

Abstract
Background and Objectives
New-onset refractory status epilepticus (NORSE) occurs in previously healthy children or adults, often followed by refractory epilepsy and poor outcomes. The mechanisms that transform a normal brain into an epileptic one capable of seizing for prolonged periods despite treatment remain unclear. Nonetheless, several pieces of evidence suggest that immune dysregulation could contribute to hyperexcitability and modulate NORSE sequelae.
Methods
We used single-nucleus RNA sequencing to delineate the composition and phenotypic states of the CNS of 4 patients with NORSE, to better understand the relationship between hyperexcitability and immune disturbances. We compared them with 4 patients with chronic temporal lobe epilepsy (TLE) and 2 controls with no known neurologic disorder.
Results
Patients with NORSE and TLE exhibited a significantly higher proportion of excitatory neurons compared with controls, with no discernible difference in inhibitory GABAergic neurons. When examining the ratio between excitatory neurons and GABAergic neurons for each patient individually, we observed a higher ratio in patients with acute NORSE or TLE compared with controls. Furthermore, a negative correlation was found between the ratio of excitatory to GABAergic neurons and the proportion of GABAergic neurons. The ratio between excitatory neurons and GABAergic neurons correlated with the proportion of resident or infiltrating macrophages, suggesting the influence of microglial reactivity on neuronal excitability. Both patients with NORSE and TLE exhibited increased expression of genes associated with microglia activation, phagocytic activity, and NLRP3 inflammasome activation. However, patients with NORSE had decreased expression of genes related to the downregulation of the inflammatory response, potentially explaining the severity of their presentation. Microglial activation in patients with NORSE also correlated with astrocyte reactivity, possibly leading to higher degrees of demyelination.
Discussion
Our study sheds light on the complex cellular dynamics in NORSE, revealing the potential roles of microglia, infiltrating macrophages, and astrocytes in hyperexcitability and demyelination, offering potential avenues for future research targeting the identified pathways.
Introduction
New-onset refractory status epilepticus (NORSE), including its subtype with a preceding febrile illness known as febrile infection-related epilepsy syndrome (FIRES), is a severe form of status epilepticus.1 NORSE occurs in adults or children without active epilepsy or preexisting relevant neurologic disorders and without a clear acute or active structural, toxic, or metabolic cause identified in the first few days.1 The prognosis is often poor among patients with NORSE, including a high rate of mortality, 12% in children and 16%–27% in adults2,3; long-term neurocognitive, behavioral, and functional disabilities; as well as drug-resistant epilepsy.2,3
The mechanisms that transform a normal brain into an epileptic state are poorly understood. Moreover, it is not known why some patients with status epilepticus will respond to first or second-line antiseizure medications, whereas one third of patients will experience refractory status epilepticus. Emerging literature suggests that immune dysregulation may underlie NORSE onset and correlate with long-term outcomes, including drug-resistant epilepsy.4,5 Differences in serum and CSF cytokine/chemokine profiles related to innate immunity have been observed in patients with NORSE compared with control patients and those with other forms of refractory status epilepticus, suggesting a potential role of innate immunity-related inflammation in NORSE pathogenesis.4 Findings from in vivo experiments support the role of innate immunity-related cytokines such as IL-1β, or its downstream cytokines IL-6 and CXCL8 (previously known as IL-8), in hyperexcitability and epileptogenesis through direct actions on ion channels, neurotransmitter receptors, and structural and functional changes in glial and neuronal networks.6-8 Furthermore, the elevation of proinflammatory cytokines associated with innate immunity in patients with NORSE has been linked to poorer short and long-term outcomes, suggesting a connection between inflammation, brain damage, and post-NORSE consequences.4,9
Neuropathologic examinations, coupled with advanced technologies such as metagenomics or single-nucleus analyses, have revealed stage-dependent transcriptomic states in diseases such as Huntington, multiple sclerosis, and macular degeneration.10-12 This approach has enhanced our understanding of the mechanisms underlying Rasmussen encephalitis,13 and some otherwise unexplained encephalitides.14 For patients with NORSE, neuropathologic findings include neuronal loss, reactive astrogliosis, and perivascular T-cell infiltration.15 Although nonspecific, findings were crucial in identifying a specific etiology and/or guiding immunotherapy in approximately 15% of cases.15 Applying metagenomics or single-nucleus analyses to patients with NORSE holds promise in illuminating the mechanisms governing NORSE onset and its consequences and elucidating the relationship between immune dysregulation and hyperexcitability. We isolated single-cell nuclei from the brains of 4 patients with NORSE and compared their transcriptomic composition and phenotypic states with those of patients with chronic temporal lobe epilepsy and control patients without neurologic disorders.
Methods
Standard Protocol Approvals, Registrations, and Patient Consents
This study was approved by Yale University (NORSE/FIRES biorepository, institutional review board #1511016840), the Paris Pitié-Salpêtrière Hospital (2012, CPP Paris-VI), and the French INSERM (C16-16-20152482) ethics committees. Patients or relatives provided informed consent. Flash-frozen human brain tissues were obtained from patients undergoing epilepsy surgery for hippocampal sclerosis at the Pitié-Salpêtrière Hospital (Paris, France). For patients with NORSE and controls with no known neurologic disorder, postmortem unfixed frozen human brain tissues were obtained from the Department of Neuropathology at Pitié-Salpêtrière Hospital or the Department of Pathology at Yale School of Medicine. The study design and report followed the STROBE guidelines.
Human Brain Nuclei Isolation and Single-Nucleus RNA Sequencing
Nuclei were isolated from postmortem frozen or flash-frozen human brain tissue following established procedures.16 The frozen tissue (50–100 mg) was homogenized in 15 mL of ice-cold nuclei homogenization buffer (2 M sucrose, 10 mM Hepes [pH 7.9], 25 mM KCl, 1 mM EDTA [pH 8.0], 10% glycerol, and ribonuclease [RNase] inhibitors freshly added [1 µL/mL]) using a Dounce tissue grinder. The homogenate was transferred into an ultracentrifuge tube on top of 10 mL of fresh nuclei homogenization buffer and ultracentrifuged at 24,000 rpm for 60 minutes at 10°C. The supernatant was removed, and the pellet was resuspended in 1 mL of nuclei suspension buffer (15 mM Hepes [pH 7.4], 15 mM NaCl, 60 mM KCl, 2 mM MgCl2, 3 mM CaCl2, and RNase inhibitors freshly added [2 µL/mL]) and counted on a hemocytometer. Nuclei were centrifuged at 800 g for 10 minutes at 4°C and resuspended at 700 to 1,200 nuclei/µL for 10x Genomics Chromium loading. The single-nucleus RNA sequencing libraries were prepared by the Chromium Single Cell 3′ Reagent Kit v3.1 chemistry according to the manufacturer's instructions and sequenced using Illumina NovaSeq S4 6000.
Processing of Single-Nucleus RNA Sequencing Data
Single-nucleus RNA sequencing was aligned to the human GRCh38 genome (GENCODE v32/Ensembl 98) using CellRanger version 7.0.1. CellRanger-filtered unique molecular identifier count matrices were used for downstream analysis. Low-quality cell profiles were excluded if they fulfilled one or more of the following criteria: (1) number of genes expressed <200, (2) number of genes expressed >8,000, or (3) ≥ 5% of the total unique molecular identifiers were mitochondrial RNA.
Data from different batches were integrated using the Seurat v4.3 SCTransform integration workflow. Seurat v4.3 was used to perform dimensionality reduction and clustering. First, principal component analysis (PCA) was performed on the batched data with the RunPCA function. The number of PCs (i.e., dimensions) to be used in downstream analysis was selected using an elbow plot and differed according to the brain area. A shared nearest-neighbor (SNN) graph was constructed using a set of highest variance PCs using the FindNeighbors function. Clusters were constructed using the FindClusters function that maximized the modularity of the SNN graph. Uniform Manifold Approximation and Projection (UMAP) was performed using the RunUMAP function on the selected PCs, and the UMAP coordinates were used for visualization.
Cluster Annotation of Single-Nucleus RNA Sequencing Data
Cell-specific clusters were annotated to reflect similarities and differences in subpopulation composition across cells. First, top marker genes were identified for each cluster, patient, or group of patients using the Seurat FindAllMarkers function. Second, the gene expression was compared among clusters, patients, and groups of patients using the Seurat FindMarkers function. The DoHeatmap or pheatmap function was used to draw the heatmaps of single-nuclei top gene expression.
Neuropathology
After surgery or autopsy, brain specimens were paraffin-embedded. Three micrometers–thick tissue sections were stained by hematoxylin-eosin or were processed for immunostaining by a fully automated stained Ultra (Ventura, Roche) using diaminobenzidine as a chromogen and the following primary antibodies and dilutions: monoclonal mouse clone MRQ-26 anti-CD163 (Roche, prediluted), monoclonal mouse clone KP1 anti-CD68 (Agilent technologies, 1/1,000), and polyclonal rabbit anti-Iba1 (Wako, 1/500).
Statistical Analysis
Analyses were performed with R Studio (v 2023.03.1), and graphs were computed with either R Studio or GraphPad Prism software 9 (version 9.2.0).
Chi-square fit tests were used to test whether the frequency of each cell type differed among the patient subgroups, with the assumption of independence of the variables. A p-value less than 0.05 was considered statistically significant.
Data Availability
All data and codes are available upon request from the corresponding author.
Results
Study Participants
The study focused on postmortem brain tissues from 4 patients with NORSE, aged between 16 and 39 years. In addition, we included brain tissues from 2 control patients, aged 31 and 54 years with no history of neurologic disorders, who died of respiratory disorders. Hippocampus data from patients with NORSE were compared with those obtained from 4 patients who underwent surgery for temporal lobe epilepsy associated with type 2 ILAE hippocampal sclerosis (TLE).17 Patients with TLE ranged in age from 32 to 54 years, all of whom had experienced a seizure within 24 hours before the surgery.
For patients NORSE#1, NORSE#2, and NORSE#3, despite an extensive workup (including toxicology, antineuronal antibodies, bacterial and viral panels, and neuropathology findings), no etiology was identified; therefore, these cases were classified as cryptogenic NORSE. For patient NORSE#4, whole-exome sequencing revealed a variant for RANBP2. Given the association between RANBP2 sequence variations and fatal acute necrotizing encephalopathy,18 this variant was considered the likely cause of refractory status epilepticus. Patients NORSE#1, NORSE#2, and NORSE#4 died during the acute phase of the disease (9, 34, and 24 days after status epilepticus onset, respectively) while NORSE#3 died during the subacute phase (106 days after the status epilepticus onset but still requiring multiple continuous antiseizure medications to control seizures). Clinical and demographic information is provided in Table 1.
Table.
Summary of Clinical Data
| Patient | Relevant prior medical history | Reason for admission | Prodromes before SE onset | Type of SE/seizures | Duration of status epilepticus before death or epilepsy before surgery | Time gap between death/surgery and tissue acquisition | Immunotherapies | Brain MRI results | CSF results, including cytokines when available | Cause of death | Autopsy/surgery neuropathologic findings |
| #NORSE 1 | None | Refractory status epilepticus that qualified as FIRES | Fever, headaches | Generalized convulsive status epilepticus | 9 d | 22 h | None | Unremarkable | First lumbar puncture (1 d after status epilepticus onset): 3 WBCs, 6 RBCs, protein 25 mg/dL Second lumbar puncture (3 d after status epilepticus onset): 20 WBCs, 885 RBCs |
Multiorgan failure (acute respiratory distress syndrome with pulmonary embolism, kidney failure, and cerebral edema) Etiology of SE: cryptogenic |
-Panencephalitis -Scattered T cells and macrophages in the temporal cortex -Perivascular inflammation (microglia) in the caudate nucleus and gray matter -Mild gliosis |
| #NORSE 2 | None | Refractory status epilepticus | Headaches | Generalized convulsive status epilepticus | 34 d | 67 h | None | T2/FLAIR hyperintensity in the left frontal-temporal-parietal areas and left thalamus | Three lumbar punctures: no WBCs | Multiorgan failure (respiratory, kidney, liver, vascular) Etiology of SE: cryptogenic |
-Astrogliosis -Reactive microglia -Dysmorphic neurons without focal cortical dysplasia -No T-cell inflammation |
| #NORSE 3 | None | Refractory status epilepticus | Blurred vision, metamorphopsia | Generalized convulsive status epilepticus | 106 d | 22 h | Steroids, IVIG | T2 hyperintensity in both thalami and left occipital-parietal cortex Cortical laminar necrosis |
Four lumbar punctures: Protein 23 mg/dL, no WBCs | Withdrawal of life-sustaining therapies (after the occurrence of septic shock and disseminated intravascular coagulation) Etiology of SE: cryptogenic |
-Recent hypoxic-ischemic injury -Numerous ischemic neurons affecting the Sommer sector of the hippocampus -Astrogliosis -Laminar cortical necrosis involving the occipital lobe -Perivascular infiltrates of T cells |
| #NORSE 4 | Hashimoto thyroiditis | Refractory status epilepticus that qualified as FIRES | Fever, headaches, nausea, emesis, diarrhea | Generalized convulsive status epilepticus | 24 d | 28 h | Steroids, IVIG, Anakinra | Diffuse T2/FLAIR hyperintensity of the basal ganglia and gray matter of bilateral cerebral hemispheres with mild associated restricted diffusion. Leptomeningeal enhancement | First lumbar puncture (the day of status epilepticus onset): 1,652 WBCs, 4,000 RBCs, protein 350 mg/dL Second lumbar puncture (3 wk after status epilepticus onset): 2 WBCs, 3,000 RBCs, protein 19.3 mg/dL. Elevated CSF neopterin. Elevated CXCL8, CCL2, MIP-1a, IL-10, IL-1beta |
Severe encephalopathy complicated by multifocal pneumonia, diffuse alveolar damage, and sepsis leading to hypoxemia and hypotension Etiology of SE: RANBP2 sequence variation |
-Severe diffuse cerebral edema -Petechial hemorrhages in basal ganglia, thalamus, subcortical white matter -Scattered T cells CD8+ and macrophages CD163+ in the leptomeninges -Occasional T cells in the hippocampus |
| #TLE1 | Franceschetti syndrome Migraines Epilepsy |
Surgery of temporal lobe epilepsy associated with hippocampal sclerosis | NA | Focal impaired awareness, 3 to 4 per day | 21 y | <1 h | None | Hippocampal sclerosis | Not performed | NA | Type 2 hippocampal sclerosis (ILAE 2013 classification) |
| #TLE2 | Asthma Epilepsy |
Surgery of temporal lobe epilepsy associated with hippocampal sclerosis | NA | Focal impaired awareness, up to 1 per week | 14 y | <1 h | None | Hippocampal sclerosis | Not performed | NA | Type 2 hippocampal sclerosis (ILAE 2013 classification) |
| #TLE3 | Deep vein thrombosis Obesity Epilepsy |
Surgery of temporal lobe epilepsy associated with hippocampal sclerosis | NA | Focal impaired awareness, 3 to 4 per month | 42 y | <1 h | None | Hippocampal sclerosis | Not performed | NA | Type 2 hippocampal sclerosis (ILAE 2013 classification) |
| #TLE4 | Anxiety Gastritis Epilepsy |
Surgery of temporal lobe epilepsy associated with hippocampal sclerosis | NA | Focal aware, 1 per day Focal impaired awareness, 1 per week |
35 y | <1 h | None | Hippocampal sclerosis | Not performed | NA | Type 2 hippocampal sclerosis (ILAE 2013 classification) |
| #CONT 1 | Drug-induced hepatitis | Bilateral pneumopathy | NA | NA | NA | 48 h | Steroids | Not performed | Not performed | Severe broncho pneumopathy associated with reactive mediastinal adenopathy without evidence of malignancy | Normal brain Mild gliosis |
| #CONT 2 | None | Sudden cardiac arrest | NA | NA | NA | 96 h | None | Not performed | Not performed | Hypertrophic cardiomyopathy. Pulmonary edema | Cerebral edema |
Abbreviations: FIRES = febrile infection-related epilepsy syndrome; ILAE = International League Against Epilepsy; IVIG = IV immunoglobulins; NA = not applicable; RBC = red blood cell; TLE = temporal lobe epilepsy; WBC = white blood cell.
Single-Nucleus Isolation and Brain Cellular Population
To delineate transcriptional changes and phenotypic states of nuclei within the brains of patients with NORSE at the single-cell level, we isolated brain nuclei for single-nucleus RNA sequencing, from the autopsy frontal cortex (NORSE n = 2, control n = 2), autopsy or surgery hippocampus (NORSE n = 3, TLE n = 4, control n = 1), and autopsy temporal cortex (NORSE n = 1, control n = 1) (Figure 1A). The extracted nuclei exhibited good quality, with an average of 1903 genes (range 764–2725) and 3,644 unique molecular identifiers per cell (range 1,052–5,510).
Figure 1. Single-Nucleus Isolation and Brain Cellular Population.

(A) Description of the brain areas studied for each patient. The number of the patient is written below each female/male symbol. The same number was used for patients with several brain areas analyzed (e.g., NORSE#1). (B) UMAP (Uniform Manifold Approximation and Projection) shows the distribution of all brain cell nuclei within the frontal cortex (left), hippocampus (middle), and temporal cortex (right). (C) UMAP colored by gene expression of known lineage genes used to identify cell types. (D) UMAP shows the main cell types within the hippocampus. (E) Frequency distribution of the 8 main cell types within the frontal cortex, hippocampus, and temporal cortex for the different groups of patients.
Our single-nucleus databases were integrated for brain cell-type annotation across patients and controls (Figure 1B). Each anchor or cell cluster represented a similar biological state defined by the common expression of genes. We identified 12 cell clusters in the frontal and temporal cortices and 8 cell clusters in the hippocampus (eFigure 1A). By examining the expression of specific genes, we identified the 8 most common brain cell populations, including excitatory neurons (SLC17A7), GABAergic neurons (GAD1), astrocytes (AQP4), microglia/infiltrating macrophages (CSF1R), oligodendrocytes (MOG), oligodendrocyte precursors (PDGFRA), endothelial cells (CLDN5), and T cells (TRAC) (Figure 1C). The distribution of these cell populations in the hippocampus is illustrated in Figure 1D, and similar data are presented for the cortices in eFigure 1. Cell populations exhibited unequal distribution among patient subgroups in the hippocampus (p < 0.001) and the temporal cortex (p < 0.001), while no significant difference was found in the frontal cortex (p = 0.37) (Figure 1E).
In the hippocampus, patients with NORSE had fewer oligodendrocytes compared with CONT#2 (28.54% vs 67.24%, p = 0.0037) or TLE (28.54% vs 51.73% p = 0.0014). Patients with TLE also demonstrated fewer oligodendrocytes compared with CONT#2 (51.73% vs 67.24%, p = 0.013). By contrast, both NORSE and TLE displayed a higher proportion of microglia/infiltrating macrophages compared with CONT#2 (NORSE: 17.24% vs 2.25%, p < 0.001; TLE 12.37% vs 2.25%, p < 0.001), with a lower proportion for TLE compared with NORSE (12.37% vs 17.24%, p < 0.001). There was also a trend for a different proportion of excitatory neurons among patients (p = 0.060), with a higher proportion for TLE (15.65%) and NORSE (10.91%) compared with CONT#2 (5.33%). However, no significant difference was found in the proportion of astrocytes (p = 0.39) or GABAergic neurons (p = 0.50) among subgroups (Figure 1E, eFigure 2). Examining each patient individually, the ratio of excitatory neurons to GABAergic neurons was higher for patients with acute NORSE (NORSE#1 25.8 and NORSE#3 5.3) and for those with TLE (TLE#1 8.2, TLE#2 2.2, TLE#3 8.7, TLE#4 3.7) compared with CONT#2 (1.8).
Similar findings were observed in the temporal cortex, with fewer oligodendrocytes (6.75% vs 46.0%, p < 0.001), a higher proportion of microglia/infiltrating macrophages (9.49% vs 1.20%, p = 0.022), and a higher proportion of excitatory neurons (34.09% vs 19.74%, p = 0.033) for NORSE#1 compared with CONT#1. No difference was found in the astrocyte proportion (p = 0.11) (Figure 1E, eFigure 2). In the temporal cortex, similar to the hippocampus, the ratio of excitatory neurons to GABAergic neurons was higher for NORSE#1 compared with CONT#1 (2.6 vs 1.8).
Correlations Between Brain Cell Populations
Astrogliosis associated with microglial reactivity has been previously reported in tissues of patients with epilepsy experiencing neuronal loss. We investigated whether disturbances in the proportion of brain cell populations could be inter-related. Analyzing the 3 brain areas together, we found a positive correlation between the ratio of excitatory to GABAergic neurons and the proportion of microglial/infiltrating macrophages (rho 0.64, p = 0.016) (Figure 2). Patients with a higher ratio of excitatory to GABAergic neurons had a lower proportion of GABAergic neurons (rho −0.815, p = 0.001) (Figure 2). Similarly, patients with a lower proportion of oligodendrocytes had a higher proportion of excitatory neurons (rho −0.60, p = 0.025), astrocytes (rho −0.71, p = 0.006), and T cells (rho −0.68, p = 0.01) (Figure 2).
Figure 2. Correlations Between the Different Cell Type Proportions.
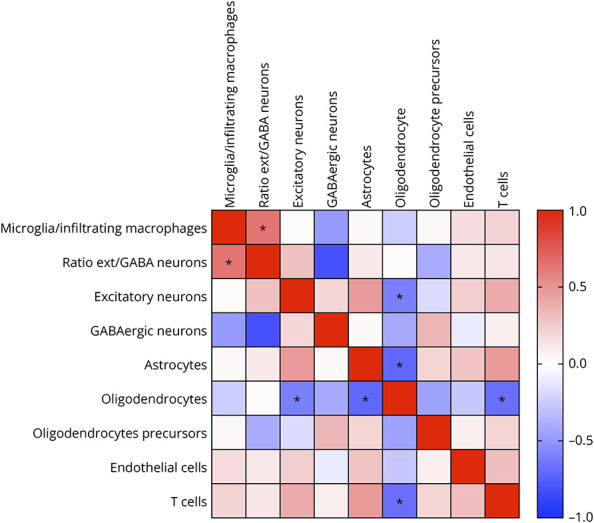
Heatmap showing correlations between the different cell type proportions. The heatmap colors correspond to correlations grading from −1 (negative correlation, blue), to no correlation (white), to 1 (positive correlation, red). * indicates p < 0.01 with Spearman analysis.
Microglia/Infiltrating Macrophages and Astrocyte Reactivity in Patients With NORSE or TLE
Because we observed a correlation between the ratio of excitatory neurons to GABAergic neurons with the proportion of microglia/infiltrating macrophages, we examined the transcriptional changes within microglia and infiltrating macrophages in patients with NORSE. A heightened proportion of microglia/infiltrating macrophages was observed in the hippocampus and temporal cortex of all patients with NORSE or TLE compared with controls (Figure 3A). Patients with TLE exhibited significant overexpression of 51 microglia/infiltrating macrophages-related genes, including cytokine-related genes such as CCL4 (fold-change = 1.12, p < 0.001), CCL3 (fold-change = 1.09, p < 0.001), IL1B (fold-change = 0.74, p < 0.001), TNF (fold-change = 0.59, p < 0.001), or CCL2 (fold-change = 0.32, p < 0.001) (Figure 3B, eTable 1). Moreover, the microglia/infiltrating macrophages demonstrated increased expression of EGR1 (fold-change = 0.69, p < 0.001) and IER2 (fold-change = 0.70, p < 0.001), 2 genes known to increase rapidly after seizure (Figure 3B).19 Patients with NORSE also displayed heightened microglial/infiltrating macrophage activation, expressing significantly higher levels of 64 genes, including CD163, a marker of peripheral macrophages, possibly indicating blood-brain barrier disruption or infiltration of peripheral macrophages (Figures 3B and 3C).20 The suspected infiltration of peripheral macrophages in patients with NORSE is also supported by the overexpression of CD44 (fold-change 0.50, p < 0.001), a molecule reported to be expressed exclusively by infiltrating cells and not on resident microglia (eFigure 3).21 In addition, an upregulation of KCNK13, implicated in NRLP3 inflammasome activation, was evident in all patients with NORSE (fold-change = 0.33, p < 0.001) (Figure 3D).22
Figure 3. Microglia Reactivity in Patients With NORSE or Temporal Lobe Epilepsy.

(A) UMAP for the nuclei belonging to the microglia cluster in the hippocampus. (B) Highlights of the number of genes overexpressed for control patients (CONT), patients with NORSE, or patients with temporal lobe epilepsy (TLE) compared with the other subgroups. (C-G) Violin plots for selected genes that were found differentially expressed among patients.
Both patients with NORSE and TLE showed increased expression of genes associated with the extension of the microglial processes toward the injury site, such as P2RY12 and CD86 (Figure 3E), as well as genes related to phagocytosis, such as MERTK or AXL (Figure 3F). However, in contrast to patients with TLE, none of the patients with NORSE exhibited high levels of CX3CR1, known for downregulating the immune response and protecting cells from phagocytosis (Figure 3G).23 Conversely, control #2 overexpressed genes associated with immune response and oxidative stress control, such as RBFOX1 (fold-change = 0.70, p = 0.0092), NEGR1 (fold-change = 0.62, p < 0.001), TFRC (fold-change = 0.58, p < 0.001), CST3 (fold-change = 0.43, p < 0.001), UCHL1 (fold-change = 0.33, p < 0.001), or TIMP3 (fold-change = 0.28, p = 0.033), suggesting a possibly anti-inflammatory condition (Figure 3B).
Pathway analyses in patients with NORSE compared with TLE revealed the activation of several pathways in patients with NORSE, potentially increasing the inflammation response and modulating neuronal functions. Notably, the activation of the G alpha Q pathway (z-score 1.34, p < 0.001) could result in phospholipase C activation and macrophage-mediated inflammatory response24,25 while the activation of the glutaminergic receptor signaling pathway (z-score 2.24, p < 0.001) could modulate neuronal glutamate signaling.26
Microglia has been recognized for its pivotal role in modulating astrocyte functions in both healthy and pathologic conditions.27 In this study, the proportion of astrocytes was not significantly increased in patients with NORSE or TLE compared with controls, neither in the hippocampus nor the cortices (Figure 1E). However, alterations in the genes expressed by astrocytes were observed, indicating a potential shift from A2 neuroprotective and anti-inflammatory astrocytes to A1 neuroinflammatory and neurotoxic astrocytes (Figure 4A).28
Figure 4. Astrocyte Reactivity in Patients With NORSE or Temporal Lobe Epilepsy.

(A) Heatmap analysis revealing the differences in the gene expression between patients within the hippocampus. (B–D) Violin plots for selected genes that were found differentially expressed among patients, in the hippocampus (B–C), or frontal cortex (D).
Overall, patients with NORSE exhibited overexpression of genes associated with reactive astrocytes including CHI3L1 (fold-change = 3.29, p < 0.001), RASGEF1B (fold-change = 2.46, p < 0.001), FTH1 (fold-change = 2.23, p < 0.001), MT2A (fold-change = 1.78, p < 0.001), STAT3 (fold-change = 0.86, p < 0.001), or GFAP (fold-change = 0.29, p < 0.001) compared with patients with TLE or CONT#2. While both patients NORSE#1 and NORSE#3 had gliosis reported in neuropathology findings (Table 1), NORSE#1 seemed to exhibit the most proinflammatory profile and NORSE#4 also expressed high levels of RASGEF1B and CHI3L1 (Figures 4A and 4B). Within the hippocampus, NORSE#1 expressed less SLC1A2 than MT2A, suggesting a higher proportion of reactive astrocytes than quiescent astrocytes (Figure 4C). Similarly, in the frontal cortex, NORSE#2 expressed a higher expression ratio of MT2A compared with SLC1A2 (Figure 4D).
Neuropathologic Studies
The neuropathologic analysis unveiled gliosis in patients with NORSE and TLE, as opposed to CONT#2 (Figure 5). Notably, only NORSE#1 displayed pronounced CD68 staining, indicative of the presence of macrophages with heightened phagocytic activity in the parenchyma. By contrast, the remaining patients exhibited only a limited number of infiltrating and perivascular macrophages (Figure 5).
Figure 5. Histopathology of the Hippocampus for a Panel of Patients Control, With TLE, or With NORSE.

Iba-1 revealed gliosis for patients with TLE or NORSE. CD68 highlighted the infiltration of macrophages in the parenchyma of NORSE#1. CD163 revealed perivascular macrophages for TLE#2 and TLE#4. Scale bars: 50 µm.
T-Cell Clusters in the Brain: The Specificity of NORSE#1
Given the neuropathology findings, we investigated T-cell clusters in the brain. A panencephalitis was observed for patient NORSE#1, distinguishing her from the other patients with NORSE: In NORSE#3 and NORSE#4, only a few perivascular T cells were observed, and in NORSE#2, no T cells were present. The proportion of T cells in the hippocampus exhibited significant differences when analyzing all patients separately (p = 0.0076): NORSE#1 showed a markedly higher proportion of T cells in the hippocampus (4.59% vs an average of 0.30% for other patients) (Figure 6A). NORSE#1 also displayed a similar proportion of T cells in the temporal cortex (3.53%) and frontal cortex (2.76%) while NORSE#2 surprisingly exhibited a significant T-cell cluster in the frontal cortex (5.15%).
Figure 6. T-Cell Infiltration in Patients With Cryptogenic Acute NORSE.

(A) Individual proportion of T cells within the different brain areas. (B) UMAP for the hippocampus nuclei belonging to the T-cell cluster. (C) Pie charts showing the proportion of each T-cell cluster, for each patient, within the hippocampus. (D) UMAP colored by gene expression of known lineage genes used to identify the subtypes of T cells. (E) Heatmap analysis revealing the genes expressed by the nuclei from each subcluster within the hippocampus. (F) Plots highlighting the genes overexpressed by NORSE#1 compared with the other patients in the hippocampus (top), frontal cortex (middle), and temporal cortex (bottom). The genes with p < 0.01 and a fold-change above 1 are highlighted in red. The genes with p < 0.01 and a fold-change below −1 are highlighted in blue. The black dots correspond to genes with p > 0.01 and/or a fold-change from −1 to 1.
Within the hippocampus, 5 T-cell subclusters were identified (Figure 6B). All patients had some T cells belonging to subcluster 3 or 4 (Figure 6C). However, only NORSE#1 had most of the cells belonging to subcluster 0, 1, or 2. Notably, 69% (445/641) of the T cells from NORSE#1 were in the CD8 subclusters 0 and 1 (Figure 6C) expressing mainly CD8A (Figure 6D). For a more detailed understanding of cell cluster specificities within the hippocampus, a heatmap analysis was conducted (Figure 6E). While the nuclei from subclusters 0 and 1 expressed CD8A, differences were observed in the genes expressed within these subclusters. Subcluster 0 was characterized by the overexpression of 102 markers, including GNLY (fold-change = 1.46, p < 0.001), and CCL5 (fold-change = 1.34, p < 0.001), crucial components of the immune response contributing to effective T-cell functioning. In addition, nuclei in subcluster 0 overexpressed markers associated with the immune response and apoptosis, such as IFI27 (fold-change = 1.18, p < 0.001), a protein induced by interferons, GZMA (fold-change = 1.09, p < 0.001), and BCL2L11 (fold-change = 1.06, p < 0.001) promoting apoptosis. The genes expressed by nuclei in subcluster 1 highlighted immune cell infiltration, including TOP2A (fold-change = 3.08, p < 0.001), ASPM (fold-change = 3.27, p < 0.001), and MKI67 (fold-change = 2.56, p < 0.001) (Figure 6E).
In comparison with the other patients, NORSE#1 overexpressed 116 genes in T cells in the hippocampus, including 61 with a fold-change above 1 and p < 0.01 (Figure 6F), including PLCG2 (fold-change = 2.98, p < 0.001), GNLY (fold-change = 2.19, p < 0.001), CCL5 (fold-change = 1.35, p < 0.001), CD38 (fold-change = 1.33, p < 0.001), and GZMB (fold-change = 1.03, p < 0.001), which highlighted the effective functioning of T cells. The overexpression of UBASH3B (fold-change = 2.21, p < 0.001), GADPH (fold-change = 1.82, p < 0.001), NFATC3 (fold-change = 1.72, p < 0.001), or TRAF5 (fold-change = 1.60, p < 0.001) mirrored the secondary activation of regulating immune response pathways. In contrast to the hippocampus, only a few genes were differentially expressed in the frontal and temporal cortices (Figure 6F). In addition, no overexpression of the markers highlighting the effective functioning of T cells was found in these 2 cortical regions, except for IFNG-AS1 (fold-change = 1.05, p < 0.001), a marker of the Th1 function, in the temporal cortex (Figure 6F).
Discussion
NORSE is one of the most severe forms of status epilepticus that can be triggered by different types of CNS insults, but most of them remain unexplained—i.e., cryptogenic NORSE. Unbiased analysis of brain tissue using single-nucleus RNA sequencing allowed us to delineate the composition and phenotypic states of brain cells among those patients. We identified significant differences in CNS cell population distribution within the temporal cortex and hippocampus in patients with NORSE. Specifically, patients with NORSE or TLE showed a significantly higher proportion of excitatory neurons and microglia/infiltrating macrophages and a lower proportion of oligodendrocytes than controls. The ratio of excitatory neurons to GABAergic neurons was higher for patients with acute NORSE or TLE compared with controls. The increase in microglia/infiltrating macrophage proportion correlated with the ratio of excitatory neurons to GABAergic neurons, while the elevated proportion of excitatory neurons, astrocytes, and T cells was associated with a lower proportion of oligodendrocytes. In addition to these changes in cellular composition, patients with NORSE exhibited reactive microglia and astrocytes, and cytotoxic T-cell clusters were primarily detected in patients with acute cryptogenic NORSE. These data provide novel insight into the common underlying pathogenesis of severe refractory seizures, both acute—NORSE—and chronic—TLE.
Microglia, as tissue-resident macrophages, plays crucial roles in normal brain development and function by clearing apoptotic cell debris and regulating neuronal excitability.29 Their ability to modulate synapses and clear damaged neurons has been implicated in altering the balance between excitatory and inhibitory synapses, potentially favoring excitation, as observed in temporal lobe epilepsy.30 By contrast, macrophage depletion was associated with a significant reduction in seizure frequency in mice after acute viral encephalitis.31 This may explain the positive correlation between the proportion of microglial cells or infiltrating macrophages and the ratio between the excitatory and GABAergic neurons.
In response to signals indicating brain damage, microglia can switch from an M2 anti-inflammatory phenotype to an M1 proinflammatory phenotype.32 Microglia activation involves changes in cell morphology and modulation of microglia-related genes, resulting in microglial activation.19,27,33 Microglia activation has been frequently associated with neuronal loss, specifically interneuron loss, and astrogliosis, evident in autopsy and biopsy specimens from patients with epilepsy or status epilepticus, as well as in animal models of status epilepticus.15,19,34,35 The loss of GABAergic neurons may contribute to the observed increased ratio between excitatory neurons and GABAergic neurons, playing a crucial role in facilitating excitatory propagation, as described in animal models of status epilepticus.34,35 Different microglial phenotypes have been described based on the delay of tissue collection from the last seizure and the intensity of neuronal loss in the studied brain area.19 We report an increase in the proportion of microglial cells or infiltrating macrophages for all patients with epilepsy, whether NORSE or TLE, compared with controls. To account for potential phenotype differences influenced by the intensity of neuronal loss, the analysis exclusively focused on specimens from patients with type 2 ILAE hippocampal sclerosis, characterized by predominant neuronal loss and gliosis in CA1—the most affected area in the hippocampus of patients with NORSE.15,17
In patients with refractory seizures, whether NORSE or TLE, our study observed increased expression of genes associated with microglia activation (P2RY12, CD86), phagocytic activity (MERTK, AXL), and NLRP3 inflammasome activation (KCNK13, P2RX7), emphasizing the involvement of microglia in the pathophysiology.21,22,36 The marker CD163, indicative of perivascular macrophages, was expressed in most patients with NORSE (#1, #2, and #4).20,37 It suggests a potential infiltration of peripheral macrophages, possibly facilitated by blood-brain barrier disruption during the acute phase of the status epilepticus.20,37 It was absent in NORSE#3, who died during the subacute phase of the status epilepticus, and in patients with TLE, suggesting that chronic epilepsy does not always result in blood-brain barrier disruption or macrophage infiltration.38 Neuropathologic analysis revealed similar findings with pronounced staining of CD68 in the parenchyma only for NORSE#1 who died quickly after status epilepticus onset.
Patients with TLE, all of whom experienced a seizure within 24 hours before the surgery, exhibited overexpression of genes recognized as immediate early gene transcripts (EGR1, FOS, IER2, NR4A1) and cytokine-related genes (IL-1B, CCL4, CCL3, CCL2, TNF). This highlights a rapid local microglial response to seizures.19 We previously reported that patients with status epilepticus had elevated levels of CCL2 and CCL3 in the CSF compared with patients with TLE or healthy donors.4 In addition, patients with cryptogenic NORSE showed elevated serum levels of CCL2 and CCL3 compared with non-cryptogenic RSE.4 However, patients with NORSE in this study did not exhibit a similar elevation in cytokine-related gene expression. We could speculate that continuous antiseizure medications might influence inflammation-related transcript regulation within the brain.39
In contrast to patients with NORSE, all patients with TLE expressed CX3CR1, a chemokine receptor known to modulate phagocytic activity and prevent neuronal loss.23,40 While the reduced expression of CX3CR1 in patients with NORSE may be attributed to the presence of infiltrating macrophages, known for expressing lower levels of CX3CR1, it is noteworthy that the resident microglia cells, constituting a higher proportion than the infiltrating cells, also seem not to express CX3CR1 in NORSE. These differences suggest that patients with NORSE might lack control mechanisms capable of downregulating phagocytic activity, potentially contributing to higher neuronal loss, inflammation, and persistent seizures.
Astrogliosis is often associated with microglial activation.15 In animal models of status epilepticus, hippocampal astrogliosis has been observed, leading to increased expression of astroglia activation markers such as GFAP and S100B, after several days of seizures.41,42 Reactive microglia can influence astrocyte function by secreting cytokines and chemokines,43 potentially driving astrocytes from a neuroprotective “A2” to a neurotoxic “A1” phenotype.28,44 By overexpressing genes such as HOMER1, microglia can also play a pivotal protective role in inhibiting astrocyte-related inflammation.45 Although gliosis was described for all patients with cryptogenic NORSE at neuropathology examination, single-nucleus RNA sequencing did not reveal a higher proportion of astrocytes in patients with NORSE compared with patients with TLE or controls. However, patients with NORSE did exhibit a distinct astrocyte-related gene profile, overexpressing genes associated with reactive astrocytes, such as CHI3L1, RASGEF1B, MT2A, STAT3, or GFAP.27,46 Our study also indicated that patients with NORSE, especially those with acute cryptogenic NORSE (NORSE#1 and NORSE#2), exhibited a lower expression of HOMER1 and a higher proportion of inflammatory and reactive astrocytes, suggesting an ineffective control mechanism including microglia and astrocyte function. Notably, patient NORSE#1, who died only 9 days after the onset of status epilepticus, had the most significant proinflammatory astrocyte profile, suggesting that astrogliosis might have played a role in the early consequences of status epilepticus.
Our study revealed a similar astrocytic state to that observed in Huntington disease, where astrocytes were classified as quiescent or reactive based on the expression of MT2A and SLC1A2.10 Most of the patients, except NORSE#1 and NORSE#2, exhibited a higher expression of SLC1A2 compared with MT2A, indicating a quiescent state in their astrocytes. By contrast, NORSE#1 and NORSE#2 showed an overexpression of MT2A, marking a distinct feature in at least some patients with acute cryptogenic NORSE.
Neuron-glial interactions are crucial for maintaining neuronal homeostasis and myelination.47,48 Our study identified a negative correlation between the proportion of astrocytes or excitatory neurons and the proportion of oligodendrocytes. The activation of astrocytes may lead to the expression of disintegrin and metalloproteinase 12 (ADAM12) in both astrocytes and microglia.49 The higher expression of ADAM12 in patients with NORSE may contribute to demyelination, providing a potential explanation for the observed lower proportion of oligodendrocytes in these patients.49 The loss of myelin in the cerebral cortex is commonly observed in postsurgical tissue from focal epilepsies and animal models of epilepsy. The redistribution of Na+ and K+ channels in the demyelinated segment could contribute to hyperexcitability and epileptogenesis.50 These findings underscore the intricate interplay between different cell types in the brain and how dysregulation, as seen in NORSE, can have cascading effects on astrocyte states, neuron-glia interactions, and myelination processes.
In the literature, pathologic examination revealed leukocyte infiltration, mainly CD8+ T-lymphocytes, in 14% of patients with NORSE.15 The neuropathologic analysis indicated panencephalitis for patient NORSE#1 and scattered T cells for patients NORSE#3 and NORSE#4. By contrast, NORSE#2 showed no T-cell infiltration. However, single-nucleus RNA sequencing analysis demonstrated a significantly increased proportion of T cells in both patients NORSE#1 and NORSE#2 compared with other patients with NORSE, TLE, or controls. Patients NORSE#1 and NORSE#2 died quickly after the onset of status epilepticus and were qualified as cryptogenic NORSE. The observed T-cell infiltration could be linked to blood-brain barrier disruption during the status epilepticus course.37 Alternatively, it might signify a concomitant proinflammatory condition from an unidentified underlying etiology such as autoimmune encephalitis.13,51
The proportion of T cells was consistent across different brain areas in patient NORSE#1. However, differences in gene expression were noted based on the area. Specifically, T cells within the hippocampus exhibited markers of immune response contributing to effective CD8+ T-cell functioning, apoptosis, and immune infiltration. By contrast, patients with NORSE did not overexpress genes related to T-cell function in the cortex. This difference may explain the predominance of imaging abnormalities in limbic structures for patients with NORSE compared with those with Rasmussen encephalitis, who experience broader CD8+ T-cell infiltration and abnormal imaging findings within one hemisphere of the brain.3,13,52
Immunotherapy has been observed to shorten the duration of status epilepticus and prevent post-NORSE seizures in patients with T-cell infiltration identified on neuropathology.15 Hence, it is reasonable to hypothesize that a more thorough examination of biopsy brain specimens from patients with NORSE, using single-nucleus RNA sequencing, could prove pertinent in elucidating the precise phenotype of these T cells and informing patient management.
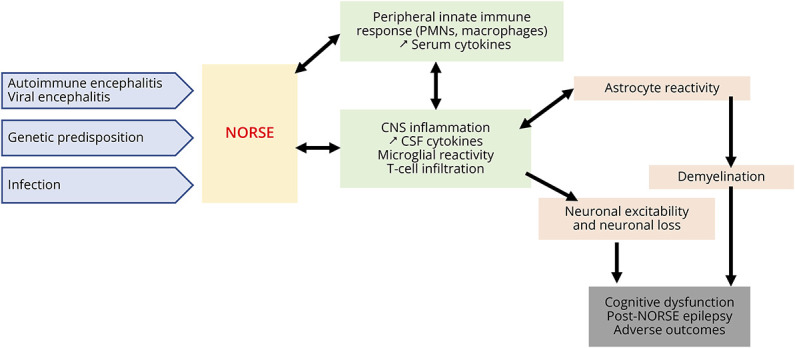
Although NORSE is heterogeneous clinically, including a small proportion of cases with various identifiable etiologies (e.g., autoimmune encephalitis, viral encephalitis, genetic disorders, etc.), patients shared dysregulations of innate immunity, potentially leading to NORSE onset and consequences (Figure 7). This dysregulation of innate immunity may result in microglial and astrocyte reactivity, leading to neuronal damage, higher excitability, and demyelination, setting up a vicious cycle. These cellular alterations can consequently result in cognitive dysfunction, post-NORSE epilepsy, and adverse outcomes.
Figure 7. Schema Summarizing the Possible Mechanisms Involved in NORSE Onset and Consequences.
There are several limitations to this study. First, this study was conducted in a small cohort of patients and controls, preventing us from conducting pathway analysis comparing patients with NORSE with controls. In small cohorts, variations in tissue preparation or sampling errors could potentially influence the brain cellular population. For instance, there may be a higher proportion of white matter tissue relative to gray matter tissue, resulting in an overrepresentation of oligodendroglia and a lower presence of excitatory neurons in the control group. Second, patients with NORSE had possibly heterogeneous underlying etiologies and did not experience the same duration of the status epilepticus. In addition, the same brain areas were not available for all patients, and tissues from patients with TLE were obtained from surgery, not autopsy. The tissues were collected several hours/days after the death of patients with NORSE, potentially triggering hypoxic ischemia and the brain death process. This activation could lead to the expression of microglia and astrocytic genes. The delayed tissue collection in patients with NORSE, compared with patients with TLE, may account for some of the observed differences between the 2 groups. However, we also analyzed autopsy specimens from control patients, collected with the same delay as for patients with NORSE, a measure taken to minimize the influence of material preparation conditions. Nonetheless, our study used single-nucleus RNA sequencing, a powerful tool, to delineate the composition and phenotypic CNS cell states of patients with NORSE. It is important to acknowledge that NORSE is a rare and devastating condition in which it is very difficult to obtain brain tissues. Our study revealed, for the first time in patients with NORSE, the intricate interplay between different cell types in the brain and how dysregulation can impair neuronal, glial, and oligodendrocyte functions. Although there are no validated animal models of NORSE, confirming our findings through additional immunohistochemistry or protein Western blotting analyses on human tissues would be valuable. Furthermore, conducting further studies on biopsy tissues from patients with NORSE can help eliminate the potential influence of hypoxic ischemia and the brain death process on gene activation. To support this effort, contributing more biopsy tissues to the NORSE/FIRES biorepository at Yale (norse@yale.edu) would be beneficial. Our findings, although preliminary, offer potential avenues for future research targeting the identified pathways.
Glossary
- FIRES
febrile infection-related epilepsy syndrome
- NORSE
new-onset refractory status epilepticus
- PCA
principal component analysis
- SNN
shared nearest neighbor
- TLE
temporal lobe epilepsy
Appendix. Authors
| Name | Location | Contribution |
| Aurélie Hanin, PharmD, PhD | Departments of Neurology and Immunobiology; Comprehensive Epilepsy Center, Department of Neurology, Yale University School of Medicine, New Haven, CT; Sorbonne Université, Institut du Cerveau - Paris Brain Institute - ICM, Inserm, CNRS, APHP; AP-HP, Epilepsy Unit and Clinical Neurophysiology Department, DMU Neurosciences, Hôpital de la Pitié-Salpêtrière, Paris, France | Drafting/revision of the manuscript for content, including medical writing for content; major role in the acquisition of data; study concept or design; analysis or interpretation of data |
| Le Zhang, PhD | Departments of Neurology and Immunobiology, Yale University School of Medicine, New Haven, CT | Drafting/revision of the manuscript for content, including medical writing for content; major role in the acquisition of data; study concept or design; analysis or interpretation of data |
| Anita J. Huttner, MD | Department of Pathology, Yale University School of Medicine, New Haven, CT | Drafting/revision of the manuscript for content, including medical writing for content; analysis or interpretation of data |
| Isabelle Plu, MD, PhD | Sorbonne Université, Institut du Cerveau - Paris Brain Institute - ICM, Inserm, CNRS, APHP; AP-HP, Department of Neuropathology, DMU Neurosciences, Hôpital de la Pitié-Salpêtrière, Paris, France | Drafting/revision of the manuscript for content, including medical writing for content; analysis or interpretation of data |
| Bertrand Mathon, MD, PhD | Sorbonne Université, Institut du Cerveau - Paris Brain Institute - ICM, Inserm, CNRS, APHP; AP-HP, Department of Neurosurgery, Hôpital de la Pitié-Salpêtrière, Paris, France | Drafting/revision of the manuscript for content, including medical writing for content; analysis or interpretation of data |
| Franck Bielle, MD, PhD | Department of Neuropathology, Pitie Salpetriere Hospital, Paris, France | Major role in the acquisition of data; analysis or interpretation of data |
| Vincent Navarro, MD, PhD | Sorbonne Université, Institut du Cerveau - Paris Brain Institute - ICM, Inserm, CNRS, APHP; AP-HP, Epilepsy Unit and Clinical Neurophysiology Department, DMU Neurosciences; Center of Reference for Rare Epilepsies, EpiCare, Hôpital de la Pitié-Salpêtrière, Paris, France | Drafting/revision of the manuscript for content, including medical writing for content; study concept or design; analysis or interpretation of data |
| Lawrence J. Hirsch, MD | Comprehensive Epilepsy Center, Dept. of Neurology, Yale University School of Medicine, New Haven, CT | Drafting/revision of the manuscript for content, including medical writing for content; study concept or design; analysis or interpretation of data |
| David A. Hafler, MD | Departments of Neurology and Immunobiology, Yale University School of Medicine, New Haven, CT | Drafting/revision of the manuscript for content, including medical writing for content; study concept or design; analysis or interpretation of data |
Study Funding
This work was supported by the Daniel Raymond Wong Neurology Research Fund (NORSE Institute), the NORSE/FIRES Research Fund at Yale, the Swebilius Foundation, the Fondation Assistance Publique des Hôpitaux de Paris (EPIRES - Marie Laure Merchandising), and the association Paratonnerre and the Fondation Française pour la Recherche en épilepsie (FFRE) (FIRES and NORSE grant).
Disclosure
A. Hanin received postdoctoral grants from the Paratonnerre Association, the Servier Institute, the Philippe Foundation, the Swebilius Foundation, and the NORSE/FIRES Research Fund at Yale for NORSE-related research. L.J. Hirsch received support for investigator-initiated studies from The Daniel Raymond Wong Neurology Research Fund. L.J. Hirsch received funding from the NORSE/FIRES Research Fund at Yale. He received consultation fees for advising from Ceribell, Eisai, Marinus, Neurelis, Neuropace, Rafa Laboratories, and UCB; royalties from Wolters-Kluwer for authoring chapters for UpToDate-neurology and from Wiley for coauthoring the book Atlas of EEG in Critical Care, 1st and 2nd editions; honoraria for speaking from Neuropace, Natus, and UCB. Vincent Navarro reports personal fees from UCB Pharma, EISAI, GW Pharma, and Angellini, outside the submitted work. Other authors report no disclosures relevant to the manuscript. Go to Neurology.org/NN for full disclosures.
References
- 1.Hirsch LJ, Gaspard N, van Baalen A, et al. Proposed consensus definitions for new-onset refractory status epilepticus (NORSE), febrile infection-related epilepsy syndrome (FIRES), and related conditions. Epilepsia. 2018;59(4):739-744. doi: 10.1111/epi.14016 [DOI] [PubMed] [Google Scholar]
- 2.Kramer U, Chi C-S, Lin K-L, et al. Febrile infection-related epilepsy syndrome (FIRES): pathogenesis, treatment, and outcome: a multicenter study on 77 children. Epilepsia. 2011;52(11):1956-1965. doi: 10.1111/j.1528-1167.2011.03250.x [DOI] [PubMed] [Google Scholar]
- 3.Gaspard N, Foreman BP, Alvarez V, et al. New-onset refractory status epilepticus: etiology, clinical features, and outcome. Neurology. 2015;85(18):1604-1613. doi: 10.1212/WNL.0000000000001940 [DOI] [PMC free article] [PubMed] [Google Scholar]
- 4.Hanin A, Cespedes J, Dorgham K, et al. Cytokines in new-onset refractory status epilepticus predict outcomes. Ann Neurol. 2023;94(1):75-90. doi: 10.1002/ana.26627 [DOI] [PubMed] [Google Scholar]
- 5.Tan TH-L, Perucca P, O'Brien TJ, Kwan P, Monif M. Inflammation, ictogenesis, and epileptogenesis: an exploration through human disease. Epilepsia. 2021;62(2):303-324. doi: 10.1111/epi.16788 [DOI] [PubMed] [Google Scholar]
- 6.Vezzani A, Baram TZ. New roles for interleukin-1 Beta in the mechanisms of epilepsy. Epilepsy Curr. 2007;7(2):45-50. doi: 10.1111/j.1535-7511.2007.00165.x [DOI] [PMC free article] [PubMed] [Google Scholar]
- 7.Di Sapia R, Zimmer TS, Kebede V, et al. CXCL1-CXCR1/2 signaling is induced in human temporal lobe epilepsy and contributes to seizures in a murine model of acquired epilepsy. Neurobiol Dis. 2021;158:105468. doi: 10.1016/j.nbd.2021.105468 [DOI] [PubMed] [Google Scholar]
- 8.Vezzani A, Maroso M, Balosso S, Sanchez M-A, Bartfai T. IL-1 receptor/toll-like receptor signaling in infection, inflammation, stress and neurodegeneration couples hyperexcitability and seizures. Brain Behav Immun. 2011;25(7):1281-1289. doi: 10.1016/j.bbi.2011.03.018 [DOI] [PubMed] [Google Scholar]
- 9.Wang D, Wu Y, Pan Y, et al. Multi-proteomic analysis revealed distinct protein profiles in cerebrospinal fluid of patients between anti-NMDAR encephalitis NORSE and cryptogenic NORSE. Mol Neurobiol. 2023;60(1):98-115. doi: 10.1007/s12035-022-03011-1 [DOI] [PubMed] [Google Scholar]
- 10.Al-Dalahmah O, Sosunov AA, Shaik A, et al. Single-nucleus RNA-seq identifies Huntington disease astrocyte states. Acta Neuropathol Commun. 2020;8(1):19. doi: 10.1186/s40478-020-0880-6 [DOI] [PMC free article] [PubMed] [Google Scholar]
- 11.Schirmer L, Velmeshev D, Holmqvist S, et al. Neuronal vulnerability and multilineage diversity in multiple sclerosis. Nature. 2019;573(7772):75-82. doi: 10.1038/s41586-019-1404-z [DOI] [PMC free article] [PubMed] [Google Scholar]
- 12.Kuchroo M, DiStasio M, Song E, et al. Single-cell analysis reveals inflammatory interactions driving macular degeneration. Nat Commun. 2023;14(1):2589. doi: 10.1038/s41467-023-37025-7 [DOI] [PMC free article] [PubMed] [Google Scholar]
- 13.Bien CG, Bauer J, Deckwerth TL, et al. Destruction of neurons by cytotoxic T cells: a new pathogenic mechanism in Rasmussen's encephalitis. Ann Neurol. 2002;51(3):311-318. doi: 10.1002/ana.10100 [DOI] [PubMed] [Google Scholar]
- 14.Brown JR, Bharucha T, Breuer J. Encephalitis diagnosis using metagenomics: application of next generation sequencing for undiagnosed cases. J Infect. 2018;76(3):225-240. doi: 10.1016/j.jinf.2017.12.014 [DOI] [PMC free article] [PubMed] [Google Scholar]
- 15.Hanin A, Cespedes J, Huttner A, et al. Neuropathology of new-onset refractory status epilepticus (NORSE). J Neurol. 2023;270(8):3688-3702. doi: 10.1007/s00415-023-11726-x [DOI] [PubMed] [Google Scholar]
- 16.Pappalardo JL, Zhang L, Pecsok MK, et al. Transcriptomic and clonal characterization of T cells in the human central nervous system. Sci Immunol. 2020;5(51):eabb8786. doi: 10.1126/sciimmunol.abb8786 [DOI] [PMC free article] [PubMed] [Google Scholar]
- 17.Blümcke I, Thom M, Aronica E, et al. International consensus classification of hippocampal sclerosis in temporal lobe epilepsy: a Task Force report from the ILAE Commission on Diagnostic Methods. Epilepsia. 2013;54(7):1315-1329. doi: 10.1111/epi.12220 [DOI] [PubMed] [Google Scholar]
- 18.Denier C, Balu L, Husson B, et al. Familial acute necrotizing encephalopathy due to mutation in the RANBP2 gene. J Neurol Sci. 2014;345(1-2):236-238. doi: 10.1016/j.jns.2014.07.025 [DOI] [PubMed] [Google Scholar]
- 19.Morin-Brureau M, Milior G, Royer J, et al. Microglial phenotypes in the human epileptic temporal lobe. Brain. 2018;141(12):3343-3360. doi: 10.1093/brain/awy276 [DOI] [PMC free article] [PubMed] [Google Scholar]
- 20.Borda JT, Alvarez X, Mohan M, et al. CD163, a marker of perivascular macrophages, is up-regulated by microglia in simian immunodeficiency virus encephalitis after haptoglobin-hemoglobin complex stimulation and is suggestive of breakdown of the blood-brain barrier. Am J Pathol. 2008;172(3):725-737. doi: 10.2353/ajpath.2008.070848 [DOI] [PMC free article] [PubMed] [Google Scholar]
- 21.Jurga AM, Paleczna M, Kuter KZ. Overview of general and discriminating markers of differential microglia phenotypes. Front Cell Neurosci. 2020;14:198. doi: 10.3389/fncel.2020.00198 [DOI] [PMC free article] [PubMed] [Google Scholar]
- 22.Drinkall S, Lawrence CB, Ossola B, et al. The two pore potassium channel THIK-1 regulates NLRP3 inflammasome activation. Glia. 2022;70(7):1301-1316. doi: 10.1002/glia.24174 [DOI] [PMC free article] [PubMed] [Google Scholar]
- 23.Lee M, Lee Y, Song J, Lee J, Chang S-Y. Tissue-specific role of CX3CR1 expressing immune cells and their relationships with human disease. Immune Netw. 2018;18(1):e5. doi: 10.4110/in.2018.18.e5 [DOI] [PMC free article] [PubMed] [Google Scholar]
- 24.Sánchez-Fernández G, Cabezudo S, García-Hoz C, et al. Gαq signalling: the new and the old. Cell Signal. 2014;26(5):833-848. doi: 10.1016/j.cellsig.2014.01.010 [DOI] [PubMed] [Google Scholar]
- 25.Zhu L, Jones C, Zhang G. The role of phospholipase C signaling in macrophage-mediated inflammatory response. J Immunol Res. 2018;2018:5201759. doi: 10.1155/2018/5201759 [DOI] [PMC free article] [PubMed] [Google Scholar]
- 26.Reiner A, Levitz J. Glutamatergic signaling in the central nervous system: ionotropic and metabotropic receptors in concert. Neuron. 2018;98(6):1080-1098. doi: 10.1016/j.neuron.2018.05.018 [DOI] [PMC free article] [PubMed] [Google Scholar]
- 27.Hasel P, Aisenberg WH, Bennett FC, Liddelow SA. Molecular and metabolic heterogeneity of astrocytes and microglia. Cell Metab. 2023;35(4):555-570. doi: 10.1016/j.cmet.2023.03.006 [DOI] [PubMed] [Google Scholar]
- 28.Liddelow SA, Guttenplan KA, Clarke LE, et al. Neurotoxic reactive astrocytes are induced by activated microglia. Nature. 2017;541(7638):481-487. doi: 10.1038/nature21029 [DOI] [PMC free article] [PubMed] [Google Scholar]
- 29.Wake H, Moorhouse AJ, Miyamoto A, Nabekura J. Microglia: actively surveying and shaping neuronal circuit structure and function. Trends Neurosci. 2013;36(4):209-217. doi: 10.1016/j.tins.2012.11.007 [DOI] [PubMed] [Google Scholar]
- 30.Fan J, Dong X, Tang Y, et al. Preferential pruning of inhibitory synapses by microglia contributes to alteration of the balance between excitatory and inhibitory synapses in the hippocampus in temporal lobe epilepsy. CNS Neurosci Ther. 2023;29(10):2884-2900. doi: 10.1111/cns.14224 [DOI] [PMC free article] [PubMed] [Google Scholar]
- 31.Waltl I, Käufer C, Bröer S, et al. Macrophage depletion by liposome-encapsulated clodronate suppresses seizures but not hippocampal damage after acute viral encephalitis. Neurobiol Dis. 2018;110:192-205. doi: 10.1016/j.nbd.2017.12.001 [DOI] [PubMed] [Google Scholar]
- 32.López‐Meraz M, Álvarez‐Croda D. Microglia and status epilepticus in the immature brain. Epilepsia Open. 2023;8(suppl 1):S73–S81. doi: 10.1002/epi4.12610 [DOI] [PMC free article] [PubMed] [Google Scholar]
- 33.Sousa C, Golebiewska A, Poovathingal SK, et al. Single-cell transcriptomics reveals distinct inflammation-induced microglia signatures. EMBO Rep. 2018;19(11):e46171. doi: 10.15252/embr.201846171 [DOI] [PMC free article] [PubMed] [Google Scholar]
- 34.Chen S, Fujita S, Koshikawa N, Kobayashi M. Pilocarpine-induced status epilepticus causes acute interneuron loss and hyper-excitatory propagation in rat insular cortex. Neuroscience. 2010;166(1):341-353. doi: 10.1016/j.neuroscience.2009.12.023 [DOI] [PubMed] [Google Scholar]
- 35.Tuunanen J, Halonen T, Pitkänen A. Status epilepticus causes selective regional damage and loss of GABAergic neurons in the rat amygdaloid complex. Eur J Neurosci. 1996;8(12):2711-2725. doi: 10.1111/j.1460-9568.1996.tb01566.x [DOI] [PubMed] [Google Scholar]
- 36.Morillas AG, Besson VC, Lerouet D. Microglia and neuroinflammation: what place for P2RY12? Int J Mol Sci. 2021:22. [DOI] [PMC free article] [PubMed] [Google Scholar]
- 37.Li H, Liu X, Wang R, et al. Blood-brain barrier damage and new onset refractory status epilepticus: an exploratory study using dynamic contrast-enhanced magnetic resonance imaging. Epilepsia. 2023;64(6):1594-1604. doi: 10.1111/epi.17576 [DOI] [PubMed] [Google Scholar]
- 38.Marchi N, Granata T, Ghosh C, Janigro D. Blood-brain barrier dysfunction and epilepsy: pathophysiologic role and therapeutic approaches. Epilepsia. 2012;53(11):1877-1886. doi: 10.1111/j.1528-1167.2012.03637.x [DOI] [PMC free article] [PubMed] [Google Scholar]
- 39.Dominguini D, Steckert AV, Michels M, et al. The effects of anaesthetics and sedatives on brain inflammation. Neurosci Biobehav Rev. 2021;127:504-513. doi: 10.1016/j.neubiorev.2021.05.009 [DOI] [PubMed] [Google Scholar]
- 40.Liu Z, Condello C, Schain A, Harb R, Grutzendler J. CX3CR1 in microglia regulates brain amyloid deposition through selective protofibrillar amyloid-β phagocytosis. J Neurosci. 2010;30(50):17091-17101. doi: 10.1523/JNEUROSCI.4403-10.2010 [DOI] [PMC free article] [PubMed] [Google Scholar]
- 41.Vizuete AFK, Hennemann MM, Gonçalves CA, de Oliveira DL. Phase-dependent astroglial alterations in Li-Pilocarpine-induced status epilepticus in young rats. Neurochem Res. 2017;42(10):2730-2742. doi: 10.1007/s11064-017-2276-y [DOI] [PubMed] [Google Scholar]
- 42.Hanin A, Roussel D, Lecas S, Baudin P, Navarro V. Repurposing of cholesterol-lowering agents in status epilepticus: a neuroprotective effect of simvastatin. Epilepsy Behav. 2023;141:109133. doi: 10.1016/j.yebeh.2023.109133 [DOI] [PubMed] [Google Scholar]
- 43.Sano F, Shigetomi E, Shinozaki Y, et al. Reactive astrocyte-driven epileptogenesis is induced by microglia initially activated following status epilepticus. JCI Insight. 2021;6(9):e135391. doi: 10.1172/jci.insight.135391 [DOI] [PMC free article] [PubMed] [Google Scholar]
- 44.Jha MK, Jo M, Kim J-H, Suk K. Microglia-astrocyte crosstalk: an intimate molecular conversation. Neuroscientist. 2019;25(3):227-240. doi: 10.1177/1073858418783959 [DOI] [PubMed] [Google Scholar]
- 45.Fei X, Dou Y, Wang L, et al. Homer1 promotes the conversion of A1 astrocytes to A2 astrocytes and improves the recovery of transgenic mice after intracerebral hemorrhage. J Neuroinflammation. 2022;19(1):67. doi: 10.1186/s12974-022-02428-8 [DOI] [PMC free article] [PubMed] [Google Scholar]
- 46.Matusova Z, Hol EM, Pekny M, Kubista M, Valihrach L. Reactive astrogliosis in the era of single-cell transcriptomics. Front Cell Neurosci. 2023;17:1173200. doi: 10.3389/fncel.2023.1173200 [DOI] [PMC free article] [PubMed] [Google Scholar]
- 47.Monje M, Iwasaki A. The neurobiology of long COVID. Neuron. 2022;110(21):3484-3496. doi: 10.1016/j.neuron.2022.10.006 [DOI] [PMC free article] [PubMed] [Google Scholar]
- 48.Nomaru H, Sakumi K, Katogi A, et al. Fosb gene products contribute to excitotoxic microglial activation by regulating the expression of complement C5a receptors in microglia. Glia. 2014;62(8):1284-1298. doi: 10.1002/glia.22680 [DOI] [PMC free article] [PubMed] [Google Scholar]
- 49.Baertling F, Kokozidou M, Pufe T, et al. ADAM12 is expressed by astrocytes during experimental demyelination. Brain Res. 2010;1326:1-14. doi: 10.1016/j.brainres.2010.02.049 [DOI] [PubMed] [Google Scholar]
- 50.de Curtis M, Garbelli R, Uva L. A hypothesis for the role of axon demyelination in seizure generation. Epilepsia. 2021;62(3):583-595. doi: 10.1111/epi.16824 [DOI] [PubMed] [Google Scholar]
- 51.Rácz A, Hummel CA, Becker A, et al. Histopathologic characterization and neurodegenerative markers in patients with limbic encephalitis undergoing epilepsy surgery. Front Neurol. 2022;13:859868. doi: 10.3389/fneur.2022.859868 [DOI] [PMC free article] [PubMed] [Google Scholar]
- 52.Bien CG, Urbach H, Deckert M, et al. Diagnosis and staging of Rasmussen's encephalitis by serial MRI and histopathology. Neurology. 2002;58(2):250-257. doi: 10.1212/wnl.58.2.250 [DOI] [PubMed] [Google Scholar]
Associated Data
This section collects any data citations, data availability statements, or supplementary materials included in this article.
Data Availability Statement
All data and codes are available upon request from the corresponding author.