Abstract
In this paper, we report a physics based mathematical model to describe the mechanotransduction at the luminal surface of the brachial artery during a flow-mediated dilation (FMD) process. To account for the effect of the released vasodilators in response to the sudden blood flow resurgence, a scalar property is introduced as a signal radially diffusing through the arterial wall, locally affecting its compliance. The model was evaluated on 19 in vivo responses of brachial artery FMD (BAFMD) in 12 healthy subjects. It successfully reproduces the time-dependent dilation of the brachial artery. The predicted artery’s outer-to-inner radius ratio was also found to be consistent with the measurements within an acceptable margin of error. Physically meaningful dimensionless parameters quantifying the artery’s physical state arose from the model, providing a description to how sensitive or responsive the artery is to the changes of wall shear stress (WSS). Future applications of this model, via incorporating inexpensive, relatively quick, and non-invasive imaging, could potentially help detect early stages of developing forms of cardiovascular diseases.
Keywords: Flow mediated dilation, Fluid-structure interaction, Mechanotransduction, Wall shear stress, Model
1. Introduction
One of the indicators of cardiovascular health is the structural integrity of arterial walls. A well-known and widely reported method for assessing the physical state of the arterial wall is the noninvasive and relatively inexpensive brachial artery flow-mediated dilation (FMD) test, in which blood flow through the brachial artery is transiently obstructed for 5 min by a pressure cuff wrapped around the upper arm. The cuff is quickly deflated to reestablish flow. The dilation of the artery and its size returning to the baseline value is monitored using ultrasound imaging. FMD metrics have been proposed in the past as potential cardiovascular health indicators. Correlations have been found linking abnormal FMD results with many underlying conditions and risk factors directly affecting cardiovascular health. For example, using high resolution ultrasound imaging, the impairment of BAFMD due to cigarette smoking has been investigated (Stoner et al., 2004). The conclusions of the said study corroborate the findings of Celermajer et al. (1993), who reported on the influence that smoking has on the relationship between the arterial diameter and the blood velocity in the brachial artery. BAFMD’s predictive power when it comes to the short-term development of early stage renal dysfunction has been established (Nakamura et al., 2011). In a study involving 38 obese men, visceral obesity was linked to BAFMD impairment (Hashimoto et al., 1998). In several other studies, monitoring BAFMD has been shown to be instrumental for diagnosing cardiovascular diseases (McCully, 2012) and assessing cardiovascular health (Birk et al., 2012; Pyke and Tschakovsky, 2005; Kaźmierski et al., 2010). Despite the critical role of FMD in evaluating cardiovascular diseases, there is a significant lack of understanding of the fundamental biophysics governing the FMD process, which prevents it from being an effective and pervasive diagnostic tool for cardiovascular diseases (CVDs).
The physics and mechanics of FMD are complex. This highly transient process occurs at two main time scales, including that of a heartbeat (pulsation period) and that of the artery’s dilation soon after the uncuffing process. Since arterial walls are not rigid, flow conditions influence the artery’s diameter change, which in turn affect the flow conditions, making the problem fully coupled via a two-way fluid-structure interaction. The most challenging aspect of this system stems from the fact that, the arterial wall’s mechanical properties are not constant throughout the FMD process, due to a physiological phenomenon known as mechanotransduction. When the wall shear stress (WSS) changes, the endothelial cells (ECs) lining the arterial wall sense it, and through a complex network of biochemical signal pathways, instruct the artery’s compliance to change accordingly. A hypothesis describing the response of the blood vessel during the transient FMD process was proposed by our group (Sidnawi et al., 2020), as shown in Fig. 1. When the blood flow is abruptly allowed back through the closed artery, the drastic WSS increase is picked up by the endothelial cells, initiating signal pathways that stimulate the change of the mechanical properties (i.e. increasing compliance due to vasodilation stimulation) of the arterial wall. The artery then responds by increasing diameter under the fluid’s pressure, and hence initiating dilation and decreasing the flow speed along with the WSS, which completes the feedback loop that makes FMD a self-modulating process.
Fig. 1.

Hypothesized feedback loop describing the artery’s response to changes in WSS during the FMD process.
The microstructure through which ECs sense WSS, is the negatively charged endothelial glycocalyx layer (EGL), a soft porous layer of proteoglycans and glycoproteins lining blood vessels’ inner surface (Weinbaum et al., 2003, 2007). The EGL’s physiological function as a mechanosensor and transducer has been well established (Weinbaum et al., 2007; Fu and Tarbell, 2013; Haeren et al., 2016; Tarbell and Ebong, 2008; Tarbell and Cancel, 2016; Tarbell and Pahakis, 2006). On the cellular level, mechanotransduction has been extensively studied via experimental investigations (Shi et al., 2010), analytical modeling (Wang et al., 2006), and numerical simulations (Loth et al., 2003). The transfer of fluid WSS at the EGL-fluid interface, through the matrix, to the cytoskeleton of the endothelial cells has been described (Secomb et al., 2001). Moreover, it has been shown that the EGL’s presence is required for the ECs’ responsiveness to WSS (Thi et al., 2004). Defective ECs have been shown to be unable to align themselves with a laminar flow even after a prolonged exposure (Baeyens et al., 2014; Yao et al., 2007). Atomic-scale molecular simulations have been used to discern the specific proteins acting as mechanosensors in the EGL (Pikoula et al., 2018). It was further established that the GPC1 core protein transmits the sensed shear stress to the EC’s surface, resulting in NO production (Bartosch et al., 2017; Ebong et al., 2014). Low shear stress has been shown to inhibit NO production, whereas high levels activate it (Zeng and Liu, 2016). In the same study, when the aforementioned GPC1 core protein was removed, the effect that shear stress has on NO production was severely attenuated.
In a set of in-vitro experiments (Chien, 2007), it has been shown that the EGL’s structural configuration is indifferent to a disturbed flow lacking a forward component. Only when a forward shear stress was added, structural remodeling of the EGL could be observed. This preferential behavior towards forward (non-oscillatory) flows has also been observed when it comes to the ECs’ shear-stress-induced release of the vasodilators responsible for increasing the compliance of arterial walls in response to an elevated WSS. A significant increase in vasodilation stimulation has been observed after a prolonged 24 h exposure to a laminar flow (Nishida et al., 1992). In another experimental study (Noris et al., 1995), it was shown that a steady laminar flow induced the synthesis of nitric oxide (NO, a prominent vasodilator), which was dependent on the WSS magnitude (or step-change magnitude); however, when turbulent flow was introduced, upregulation of NO release failed. On the flip side, reduced blood flow, as in congestive heart failure for example, flow mediated vasodilation is attenuated in vivo (Kaiser et al., 1989). Collectively, the studies reported above confirm the intimate dependence of the observed FMD response on the integrity of mechano-transduction taking place at the inner surface of the arterial wall, through sensing the highly transient changes in WSS levels after uncuffing.
Driven by the hypothesis illustrated in Fig. 1, our group has developed a preliminary, physics-based mathematical model to describe the FMD response observed in 5 healthy human subjects (Sidnawi et al., 2020), where the vessel’s compliance was modeled as a function of the WSS. As a first approximation, we assumed that the artery has a thin elastic wall which simultaneously responds to mechanical loading (blood pressure and flow induced WSS) across all its layers. The model was able to capture some key feature of the mechanotransduction process, which a conventional viscoelastic model fails to describe. Dimensionless parameters, each with a clear physical meaning, arose from the model. The evaluation of those parameters for each subject based on their FMD response, provided a quantitative description of the physical state of their artery. The study was a step in the right direction towards linking the microscopic underpinnings of endothelial mechano-transduction, to macroscopic observable, measurable, and physically meaningful quantities. Especially, according to a recent comprehensive review (Weinbaum et al., 2020), mechanotransduction and vasodilator production have never been investigated on a timescale shorter than 10 min. Hence, the study was the first of its kind that quantitatively describes the transient mechanotransduction (within the uncharted timescale) of WSS through brachial arteries.
Although innovative, our first model (Sidnawi et al., 2020) has an intrinsic limitation. It assumed that the arterial wall is a thin elastic cylindrical structure that simultaneously responds to mechanical loading across the entire thickness, which is oversimplified. Aside from the pure mechanical standpoint where a real thick wall behaves differently than an idealized cylindrical thin shell, an important component of mechanotransduction, the time it takes the WSS stimulation signal to pervade the arterial wall, was not accounted for in that model. To understand the fundamental biophysics involved in the FMD process, this critical limitation needs to be addressed.
In the current paper, we are developing a new and much more involved physics-based model to describe the BAFMD response. The arterial wall is of finite thickness. Mechanotransduction is accommodated by introducing a conceptual property, visualized to be radially diffusing through the arterial wall, thereby serving as the signal cueing compliance changes across the arterial wall’s layers. Nineteen BAFMD responses obtained from 12 healthy subjects will be used to evaluate the validity of the model. The arterial wall’s physical state will be assessed through the dimensionless parameters arising from the model. The organization of the paper is as follows. A description of the experiment that was performed to retrieve the BAFMD responses will be presented first. This is followed by the development of a mathematical model based on the hypothesis illustrated in Fig. 1. An extensive discussion of the results of fitting the model to the observed responses will be subsequently laid out. Finally, a parametric study is conducted to help the reader obtain a physical sense of what is implied by the change of some key parameters arising from the model.
2. Experiment
Flow mediated in-vivo diameter-time responses was measured by ultrasound imaging performed at the University of Pennsylvania, Department of Radiology. The study was approved by the institutional review committee. BAMFD was performed in the morning with all subjects fasting. Imaging was performed by a broadband L14–5 MHz hockey stick transducer using Zonare ultrasound scanner (ZONARE Medical Systems, Bernardo, CA, USA). Nineteen datasets were obtained from 12 healthy subjects aged 23–66.
Blood pressure was checked for each subject, lying supine. While monitoring the brachial artery, an ischemic pressure cuff wrapped around their upper arm was inflated and maintained at 250 mmHg for 5 min, as shown in Fig. 2a. At the 5-min mark the cuff was deflated and the recovery of the artery from fully compressed state to dilation and return to the base line diameter was monitored over 5 min The images were obtained as video clips and analyzed offline in MATLAB for diameter change with time.
Fig. 2.

BAFMD test. (a): Ischemic cuff wrapped around the arm for 5 min while monitoring the artery. (b) A snapshot of the monitored artery. (c) Monitoring the arterial diameter response after deflating the cuff.
Fig. 2b shows an example of brachial artery image illustrating lumen contrast compared to the vascular wall. The contrast in brightness was used in MATLAB to extract the diameter at each frame of the video clip. Fig. 2c shows a typical FMD response for 5 min after the cuff is deflated. The response curve consists of an initial, relatively sharp increase in the diameter, followed by a brief dwelling phase, and a slow recovery to the baseline diameter. The initial diameter rising, and subsequent dwelling phases that represent response to the stimulus are targeted by the model and are discussed in the next section. The processes that prompt the artery to recover to its baseline value will be a subject of future studies.
3. Model formulation
3.1. Macroscopic mechanotransduction property
As indicated in Fig. 1 about the biophysics of the FMD process and evinced by the experimental studies cited above (Chien, 2007; Nishida et al., 1992; Noris et al., 1995; Kaiser et al., 1989), sustained forward wall shear stress induces the release of vasodilators which in turn prompts the increase of the wall’s compliance (the decrease of its stiffness). In this study, considering mechano-transduction throughout the wall’s thickness would require accounting for the time it takes for the WSS signal picked up at the EGL to seep through the arterial wall. Since the biochemistry of vasodilators affecting smooth muscle cells is outside the scope and interest of our theory, we propose a surrogate property, , which diffuses radially throughout the wall’s layers, delivering the “message” (the softening effect carried by the vasodilators) that these layers should soften (decrease their stiffness) accordingly. An illustration is shown in the Fig. 3. As the property diffuses through the arterial wall, its profile versus the radial position changes with time.
Fig. 3.
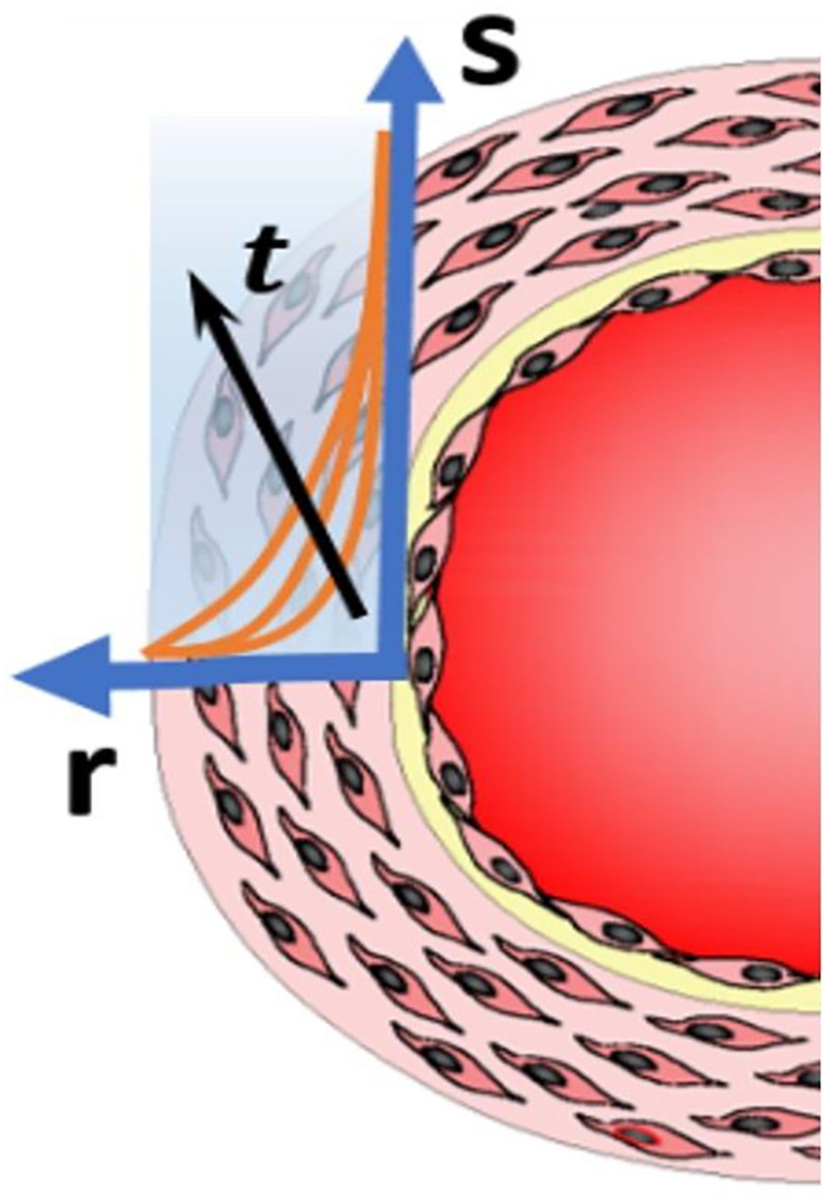
The diffusion of the property , along the radial direction , as time progresses, driven by the WSS signal sensed at the wall’s inner boundary.
From its unit of stress, , it can be seen that is the equivalent shear stress that would be sensed by a certain location inside the wall if it were in contact with the blood flow, given that location’s radial distance from the inner boundary. This is simply inspired from basic mass transfer principles based on which a diffusing substance’s (in this case a vasodilator) concentration is attenuated as it diffuses away from the source. Since a higher value of WSS induces more vasodilator production, it can be seen why introducing this property as an alternate “messenger” is appropriate, and as will be evident shortly, theoretically convenient. A helpful analogy would be that the surrogacy for the vasodilators’ concentration, is like the temperature’s surrogacy for the internal energy density. As the diffusion of is intended to represent that of the vasodilators, the traditional first order diffusion law is assumed to govern it. In cylindrical coordinates, the diffusion of is then governed by Eq. (1):
| (1) |
where is time, is the radial distance from the center, and is the diffusivity.
Indeed, it would be ideal if the diffusion of the vasodilator through the vessel wall is directly incorporated, as it is the vasodilator that stimulates the change in the local stiffness. However, this would be substantially more worthwhile if data from in-vivo experiments, which examine the vasodilator’s production rate, its diffusivity across the arterial wall, as well as its effect on the local stiffness, were available. Unfortunately, such an extremely challenging experimental investigation has yet to be carried out if that is at all possible. As reported in the conclusion of the comprehensive review (Weinbaum et al., 2020), mechanotransduction and its entailed effects have never been studied at timescales as short as the one within which the FMD response takes place. Nevertheless, pursuit of a more advanced version of this model, that would be guided by future experimental results addressing the outstanding issues mentioned above, is imperative.
3.2. Wall softening induced by
Since is equivalent to a sensed WSS at a distance as explained in the previous subsection, the same reasoning adopted in our precursor study (Sidnawi et al., 2020) for the wall’s lumped circumferential stiffness, will be applied here for the modulus of elasticity . The value of the local modulus of the wall, , that would be reached if exposure to is sustained (denoted by the subscript in ) for a long period of time, is assumed to take an exponential decreasing function from a maximum value for , to a minimum asymptotic value, , as . This depicts the softening effect that WSS (driving the diffusion of ) has on the arterial wall. Eq. (2) below governs ,
| (2) |
where is a characteristic property that indicates the wall’s resistance to a changing value of . A higher value of means a lower resistance. This behavior is illustrated in Fig. 4.
Fig. 4.

The assumed behavior of in response to .
The intuition behind the exponential function assumption stems from the softening effect that an increasing shear has on the arterial wall, together with the fact that the artery cannot soften indefinitely. A functional form that asymptotically decreases from a maximum to a minimum value at infinity, was then required. Such characteristics are provided by a simple decreasing exponential function. Of course, absent any guidance from detailed experimental measurements about how the blood vessel responds to the change of WSS, as discussed earlier about Eq. (1), a sigmoid function could have served the purpose just as well. However, using it instead of a decreasing exponential, would have rightly called for the same argument anyway. A Prony series can also provide many other forms satisfying the said characteristics. At this stage, the fact that a change in the parameter entailed by the used exponential function can correspond to physical changes in the artery, makes that form a decent starting point.
The instantaneous value of the modulus, , like many physiological processes, is expected to be transient. This means that after a sustained exposure to a value of , entailing a modulus value of (Eq. (2)), if at , suddenly shifts to a new value , the modulus would take some time to reach as illustrated in Fig. 5.
Fig. 5.
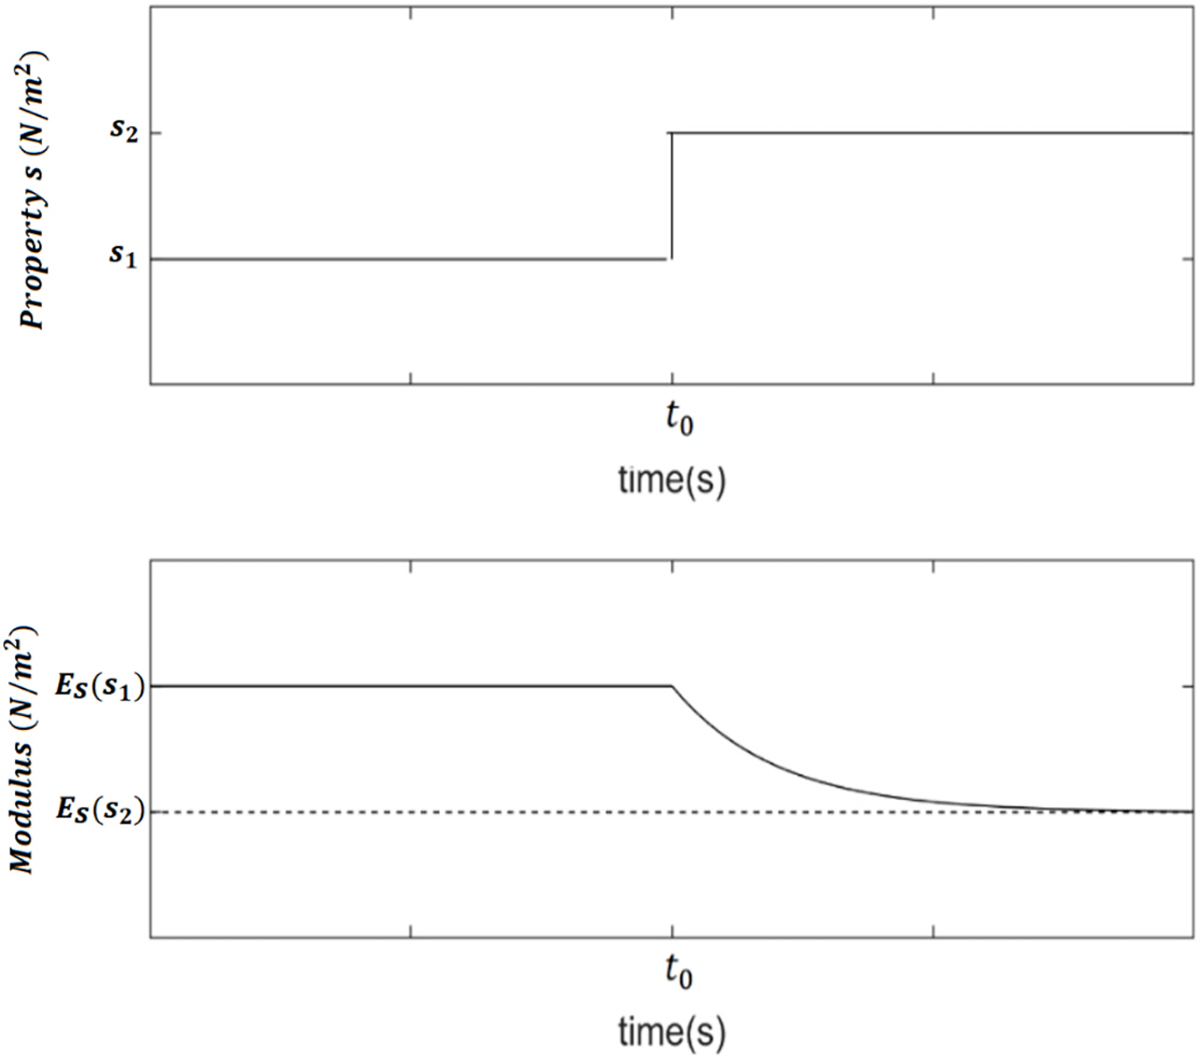
The time response to a step-change in the value of .
For , the shape of this response is also assumed to be exponential as follows:
| (3) |
where is a property of the artery that quantifies its responsiveness to a changing WSS. A greater value of indicates a more responsive artery. By thinking of a time signal as a series of infinitesimal steps, the equation governing in response to any function can be derived from Eqs. (2) and (3). According to Eq. (2), at any instant during a transient response, the following expression holds: . Therefore, for any value that takes, there exists a value of , , such that:
| (4) |
The incremental change in is: , which from Eq. (4) becomes:
| (5) |
Applying Eq. (3) to the difference in Eq. (5), one obtains
| (6) |
Hence, substituting Eq. (5) into Eq. (6),
| (7) |
Expanding into a Maclaurin series and only retaining the first order term as ,
| (8) |
or
| (9) |
Eq. (9) governs the time response of the elastic modulus, , at a given location, where an arbitrary signal is received. It should be noted that Eqs. (2), (3) and (9) may look similar to their counterparts in our previous study (Sidnawi et al., 2020). However, in the current study, these three equations describe the local behavior of the modulus of elasticity, , in response to a diffusing property driven by shear at the luminal surface, as opposed to the equations of the previous study, which describe the overall behavior of a lumped stiffness in response to the immediately felt shear stress, for a thin walled artery.
3.3. The system of equations governing the artery’s dilation
The rising-and-dwelling part of the observed FMD response for all cases, such as the one shown in Fig. 2c, is a slow process, which in the context of the elastic behavior of the artery, reveals the slow penetration of the softening effect () through the wall. This behavior makes it reasonable to assume that the expanding arterial wall, which is assumed to be linearly elastic in this study, and in a quasi-static equilibrium between the internal pressure pushing it outwards, and the opposing elastic forces resisting the deformation. It should be admitted that the initial blood resurgence might entail highly dynamic effects, and hence call the quasi-static assumption into question. However, the sharpest blood flow change occurs right after cuff deflation. During this very brief stage of the response where the initially collapsed artery restores its circular shape, the arterial wall cannot be considered under tension yet, rendering the equilibrium equation inapplicable. Once the artery is back open and fully taut, which occurs in the beginning of the experimental response, the model becomes adequate. As shown later in the paper, the excellent agreement between the model’s prediction and the experimental data proves that the quasi-static assumption is valid.
When the blood flow is established following pressure cuff release, the WSS is at its highest level. As the resulting diffusion of occurs, the arterial layers gradually soften, and the artery expands to maintain the balance between its wall’s internal elastic forces and the blood pressure, decreasing the WSS in the process.
Since a purely oscillatory WSS, devoid of a forward component, has been shown to be incapable of stimulating vasodilation (Chien, 2007; Noris et al., 1995), only the steady components of the WSS and local pressure signals are considered in this study. Also, with the subject lying in a restful state, and the artery being back open, allowing blood flow to the lower arm branch of the body to be reestablished, the steady component of the pressure signal at the examined location of the brachial artery will be assumed to be constant. This is because the steady component of the pressure drop from the heart’s left ventricle over the fixed distance to the examined location of the brachial artery near the elbow can be reasonably assumed constant with the steady component of the blood flow rate, , reestablished to that branch of the body.
The problem is setup as an initially undeformed cylindrical shell with an inner radius, , and outer radius, . A sketch is shown in the figure below.
At , an internal pressure with a flow rate are imposed. As the expansion is quasi-static, the steady component of the wall shear stress, , would correspond to the parabolic velocity profile in a Poiseuille flow:
| (10) |
where is the blood’s dynamic viscosity, and is the inner deformed radius. is in fact . If denotes the radial displacement, and denotes the displacement of the inner boundary, then and Eq. (10) may be rewritten as:
| (11) |
where .
The system of equilibrium equations governing the wall’s expansion is:
| (12a) |
| (12b) |
where is the stress tensor, and is the angular coordinate. The wall’s constitutive equations are those given by the standard elasticity theory:
| (13) |
where is the elasticity modulus, treated as a variable quantity as illustrated in Fig. 6, and is the strain tensor. is Poisson’s ratio, which is typically assigned a value of 0.5 for biological tissues. This value assumes that these tissues are mostly incompressible. However, according to a recent ex vivo, experimental and numerical study (Nolan and McGarry, 2016) performed on sections of ovine descending aorta, it was observed that these arteries can exhibit compressibility that entails values of that are as low as about 0.4. The current study is an in vivo examination of human brachial arteries under conditions where mechanotransduction-induced changes in mechanical properties are involved. It would be too speculative to assume that is not among the affected properties. Since no in vivo studies were conducted to estimate under those transient conditions, the typical value around which Poisson’s ratio for most elastic materials hovers, , was assumed. Of course, future experimental studies focusing on pinpointing of the brachial artery during the FMD response would enhance the predictions of the presented model. Still, as will be evident in the next section, even with this assumption, the results show good agreement with experimental observations.
Fig. 6.

A sketch of the problem.
As the problem is axisymmetric, dependence on , as well as the shear component of vanish . Recognizing that , and , then substituting Eq. (13) in Eq. (12a), the wall’s equilibrium equation becomes:
| (14) |
Substituting Eq. (9) in Eq. (2), the equation governing is obtained as:
| (15) |
The following dimensionless variables are introduced:
| (16) |
Note that the time scale, , is the solution to where is chosen to be in the current study. Substituting Eq. (16) into Eqs. (1), (14) and (15), the system of equations governing the FMD process is obtained:
| (17a) |
| (17b) |
| (17c) |
The arising dimensionless parameters are:
| (18) |
From its expression, indicates how sensitive to WSS the arterial wall is. The closer is to its maximum value of 1, the more indifferent the wall is to the sensed WSS. Since is directly related to , a higher value would indicate a wall that is less resistant to softening by an increasing WSS. is the parameter that quantifies the integrity of mechano-transduction. A higher value of indicates a faster diffusion of the property , thus pointing to a more active mechanotransduction.
At the inner boundary, is determined from Eq. (11), and at the outer boundary, cannot diffuse any further and therefore, . In dimensionless form, the boundary conditions for are:
| (19a) |
| (19b) |
The normal radial stress at the inner boundary is determined from the inside pressure as . The outer boundary is load free and therefore . Using Eqs. (13) and (18), the dimensionless form of the boundary conditions for are:
| (20a) |
| (20b) |
At , no diffusion of has occurred yet which means , and therefore no softening has taken place, meaning . The dimensionless form of the initial conditions for and are then obtained as:
| (21a) |
| (21b) |
However, at , the inside pressure will cause an initial deformation while the entire vessel wall is still at a uniform modulus, , which means . This makes the initial form of Eq. (17a) an ordinary equidimensional differential equation whose solution in dimensionless form yields the initial condition for :
| (22) |
The system of equations in Eq. (17) will be solved subject to the boundary conditions given by Eqs. (19) and (20), and the initial conditions given by Eqs. (21) and (22). Finite difference is used for the numerical solution of Eq. (17). The arterial wall is discretized along the radial direction, with a grid size separating two consecutive nodes. Time is discretized into instants separated by a timestep . The discrete counterparts of all space derivatives in Eq. (17) are based on a truncation error of . At every timestep Eq. (17a) is discretized into a linear system of equations to obtain the displacement at each node. Eqs. (17b) and (17c) are then solved to obtain and , respectively, at each node by the next timestep, and so the solution proceeds for the remainder of the chosen duration. However, the choices of the grid size, , and the timestep, , are not decoupled. To guarantee the stability of the diffusion equation’s solution (Eq. (17c)), the upper bound, , of the timestep, for a given grid size, , is imposed as:
| (23) |
This limit is due to the physical restriction that a node receiving an influx of a certain property by diffusion from an adjacent source node, cannot be given enough time between solution steps, to build up a concentration that exceeds its value at the source.
An algorithm that is similar to the one detailed in our previous study (Sidnawi et al., 2020), was used to find the parameter values corresponding to the experimental FMD responses that were obtained. After initiating the parameters at a certain point in the parameter space, random deviations from that point are made. At each of these points, the system of Eq. (17) is solved, and the root-mean-square (RMS) error relative to the experimentally observed response is evaluated, and the point of the parameter space, that results in the least error is retained as the new reference point from which new deviations are made, and so on, until the least error stops changing.
4. Results and discussion
For the rising-and-dwelling part of each of the experimental FMD responses, such as the one shown in Fig. 2c, the parameters, , , , in Eq. (18), were optimized to the values that resulted (through solving Eq. (17)) in the closest theoretical response, to its observed counterpart. The “closeness” was quantified by the Root Mean Square (RMS) error that resulted between the two responses as detailed above. Since is the experimentally observable quantity against which the model is tested, it will be defined as . Fig. 7 below shows a representative result for one of the subjects after fitting the model to the one observed experimentally. The thick solid curve is the theoretical fit based on our model. As evident from Fig. 7, the curvature shift in the beginning of the response, a distinctive manifestation of mechanotransduction, is independently predicted by the proposed model. Since it takes time for the WSS signal to reach into the wall and initiate the required softening of the tissue, the artery’s expansion starts at a slow rate before picking up speed. Without mechanotransduction, the wall would retain a uniform stiffness, , and would therefore be quick to undergo the deformation entailed by to maintain equilibrium, leading to exhibiting a flat profile. This behavior was observed in all 19 cases considered for this study. The remaining 18 fitting results are shown in the Appendix section.
Fig. 7.
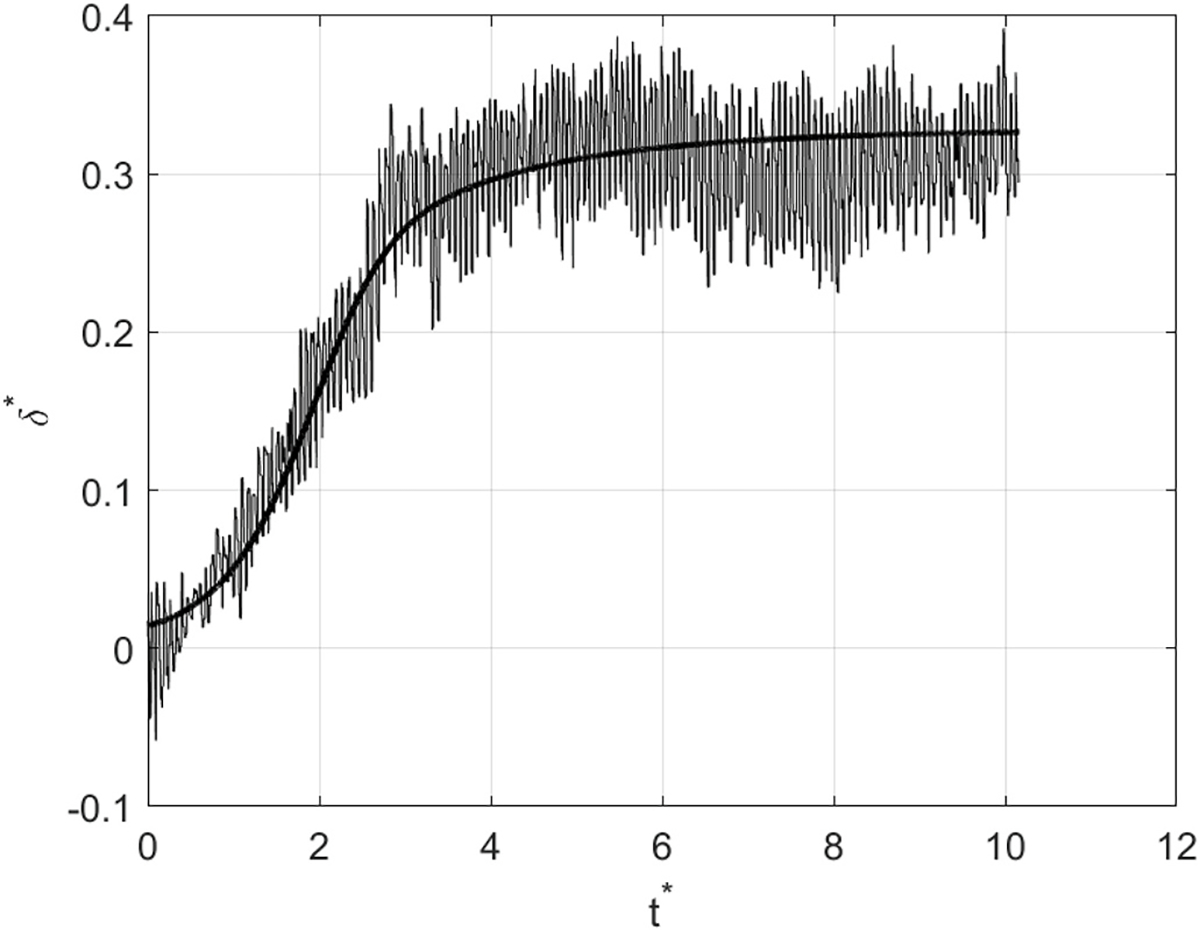
A representative result of fitting the model to its observed counterpart. The thick solid curve is the theoretical fit based on our model.
In addition to the correctly predicted curvature shift, serving as one piece of experimental evidence in favor of the proposed model, the artery’s outer-to-inner diameter (unstretched) ratio defined in Eq. (18), , was also predicted within a reasonable margin. For each of the 19 cases, the obtained ultrasound clip of the arterial response was rewound back to the early slow stage of the response before the curvature shift, where the inner arterial diameter is at its smallest, and therefore closest to its undeformed value. This is the nearest one could get to an in vivo non-invasive measurement of , for an unloaded arterial wall. The comparison results of predicted vs. measured values of are shown in Fig. 8. Although a scatter in the data is noticeable, a majority of the datapoints follow the first bisector’s trend , confirming the good agreement between the theoretically predicted value of with its experimental counterpart. The discrepancy between the experimental measurements and the theoretical predictions are mainly attributed to some unavoidable movement of artery during imaging, caused by either subject slightly moving their arm during the test or inadvertent movements of the handheld probe. As can be seen in the other 18 responses shown in the Appendix, quite a few of them are noisy, due to artefacts showing up in the ultrasound clips that lead to sudden apparent jumps or falls in the tracked arterial diameter. Despite these practical uncertainties in measurements, the trend observed in Fig. 8 compellingly justifies the validity of the presented model.
Fig. 8.

Predicted vs. measured values of the arterial outer-to-inner diameter ratio, .
Since 19 FMD responses were collected from 12 subjects, a few had repeated tests. The results for the predicted value of for each of the subjects are shown in Fig. 9. It shows that the average predicted value of is about 1.26. Subjects 3–7, and 9 had repeated tests, all of which show good repeatability except for subjects 5 and 6. However, for subject 6, one of the tests had a measured value of 1.25 vs. a predicted value of 1.16, while the second test had a measured value of 1.32 vs. a predicted value of 1.28. Subject 5 on the other hand, had a measured value of 1.41 vs. 1.37 predicted for one test, while the other test showed a measured value of 1.31 vs. 1.29 for the predicted value. In other words, although experimental repeatability of the tests for subject 5 and 6 is not as good as the rest, the theoretical predictions agree well with the corresponding experimental measurements. A quite plausible reason for the occasional variability in the measurements of is that the arterial wall is not a straight prismatic cylindrical shell of identical dimensions at every location along its axis. Therefore, in addition to the artefacts in the ultrasound images described before, there are uncertainties due to the variations in the placement of the transducer during imaging sessions.
Fig. 9.
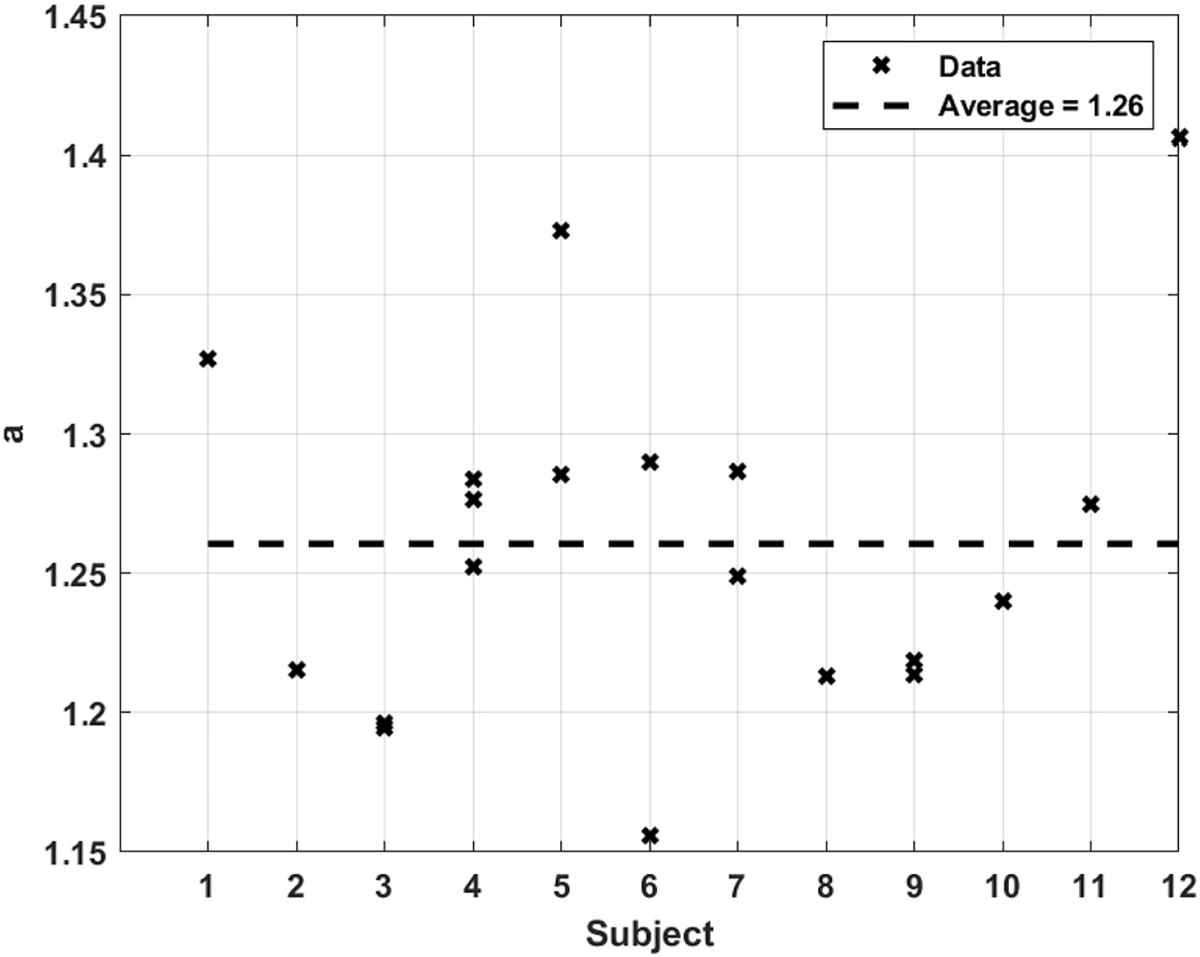
Predicted arterial outer-to-inner diameter ratio, for all subjects.
The theoretically predicted results for , the parameter that indicates the artery’s resistance to a changing WSS, with a lower value pointing to higher resistance since it is directly related to (Eqs. (2) and (18)), are shown in Fig. 10 for all subjects. The average value predicted for is 8.99, ranging from about 8.85 to 9.2. Given the tight range for , good repeatability for the same subject and across different subjects is observed.
Fig. 10.
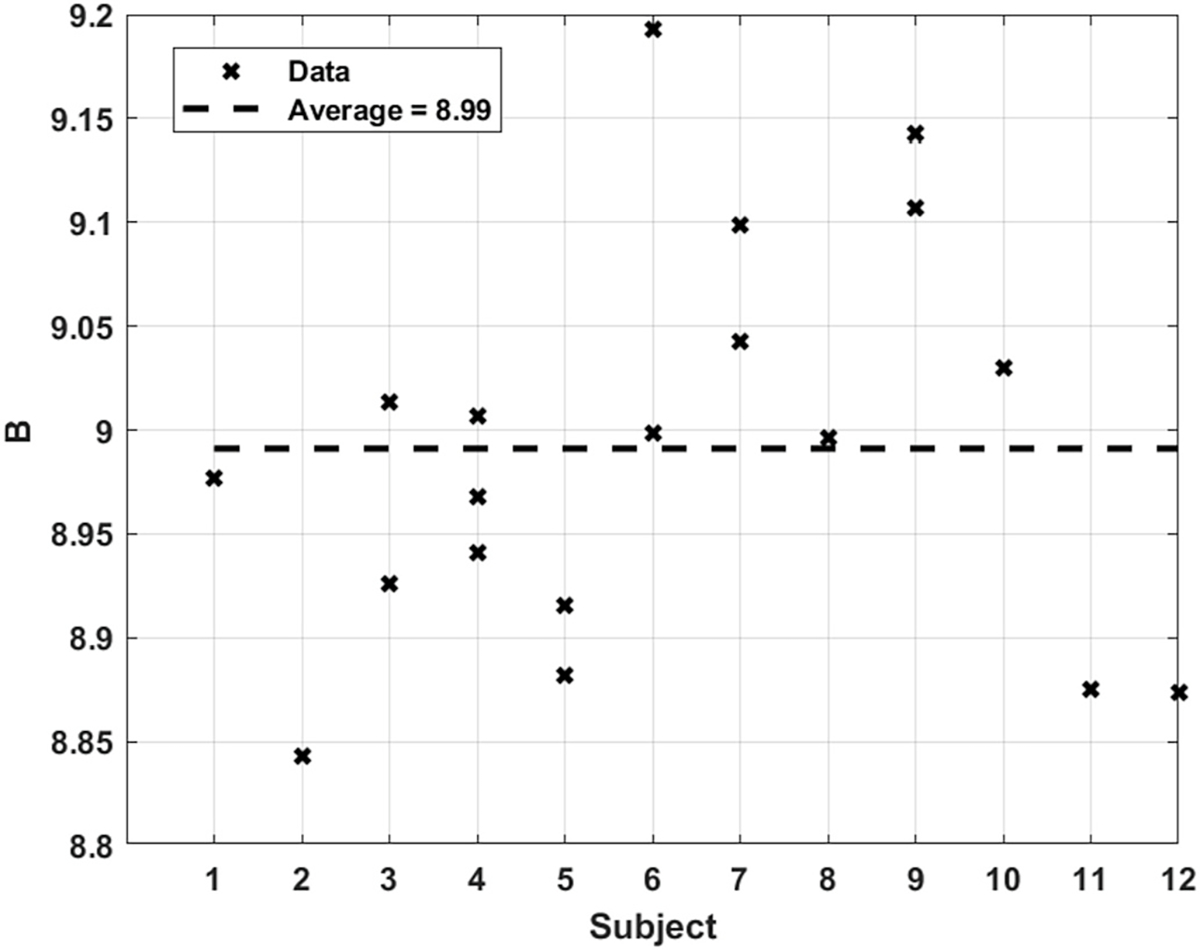
Predicted value of for all subjects.
(Eq. (18)), is the parameter that indicates the sensitivity of the arterial tissue to WSS. A higher value points to an arterial wall that is more indifferent to an increasing shear stress. The values extracted for this parameter are shown in Fig. 11. An average value of predicted for all subjects is about 0.053, with data points reasonably tight around the average line. It is not immediately clear why the value corresponding to subject 8 is so far off. The most plausible reason though could be one of the uncertainties mentioned earlier about the noisy ultrasound images.
Fig. 11.
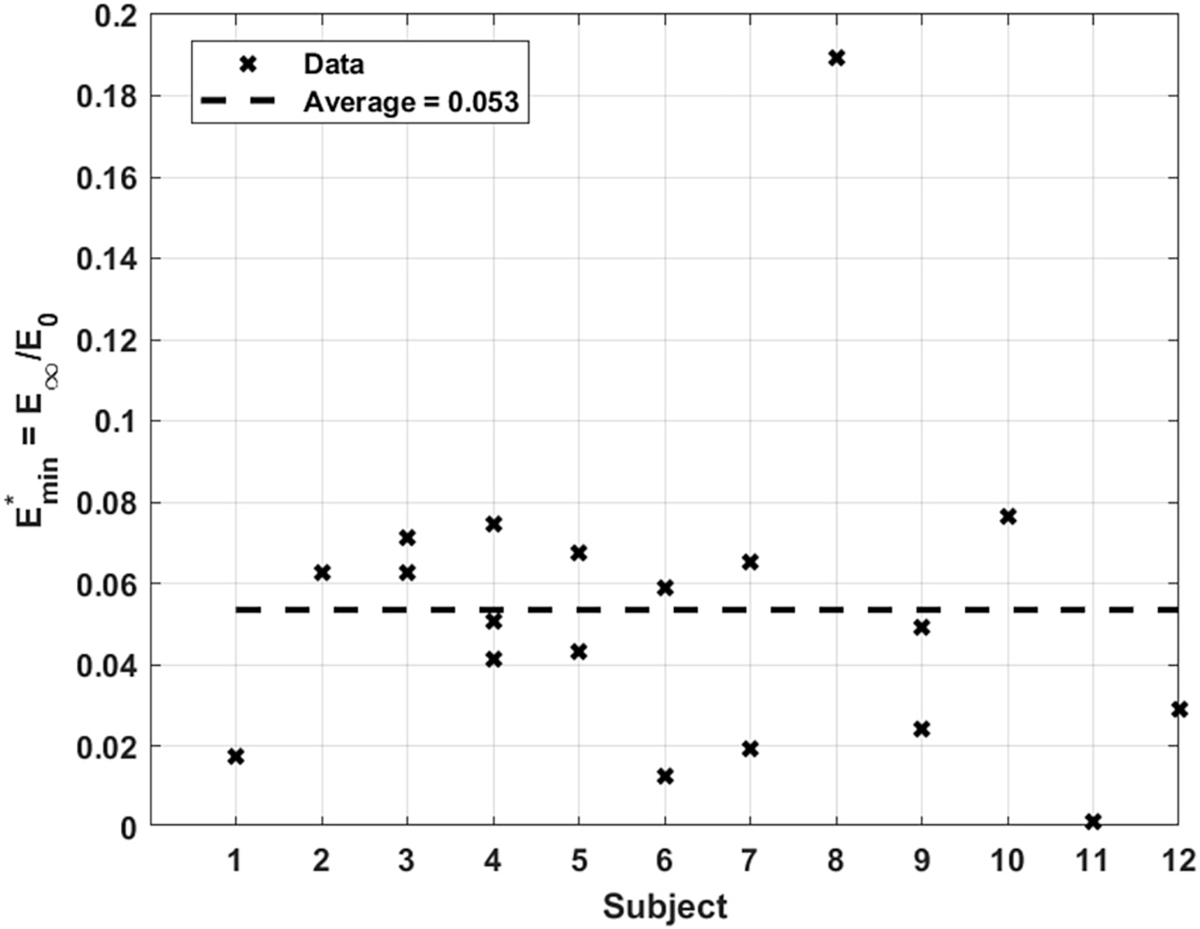
Predicted value of for all subjects.
The results for (Eq. (18)), the parameter quantifying the integrity of mechanotransduction, are shown in Fig. 12. A higher value points to an arterial wall that is more permeable to the WSS signal instructing the tissue softening. had an average predicted value of about 0.0017. Roughly all the predicted values for this parameter lie within the same order of 10−3. Like in the case of the ratio , repeatability for subjects 5 and 6 stands out as quite different from the other subjects. However there seems to be a sensible connection between the 2 parameters. For both subjects, the higher value of , corresponds to the test where a greater value of was measured. A possible explanation for this behavior could be that in the same artery, when the wall at a given cross-section is thicker than another, increases accordingly to make up for the greater distance the signal needs to travel; thereby keeping the artery’s response along its axis as homogenous as possible. Interestingly, the values pertaining to all the other subjects who had repeated tests, consistently exhibited the same behavior.
Fig. 12.
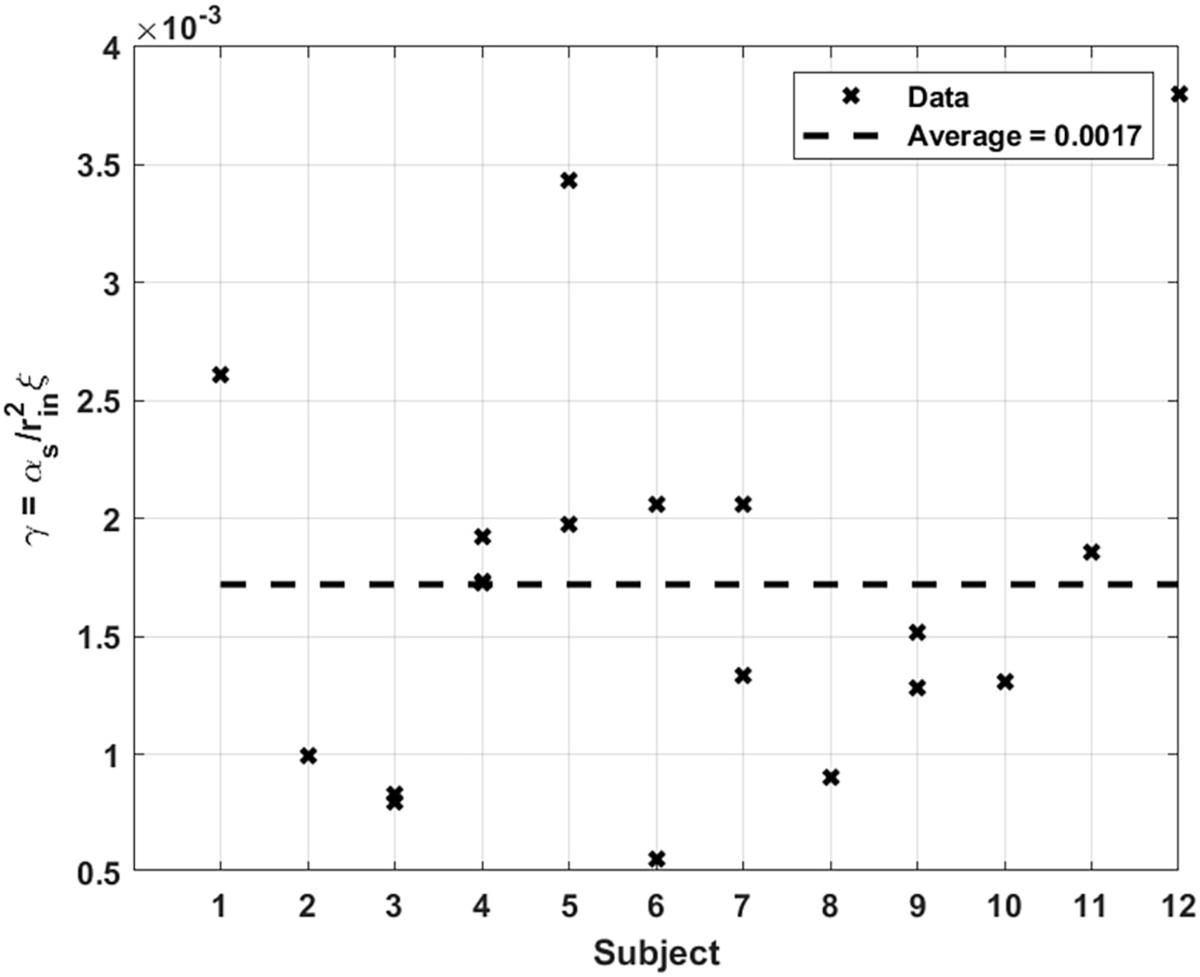
Predicted value of for all subjects.
It is meaningful to further elaborate on the uniqueness of the parameter values that were determined for the experimental FMD data. The fit of the model to the experimental data was done in two stages, the first of which is finding the appropriate time scale, . Further finetuning of all the parameters was performed in the second stage. Also note that, in this study, the outer-to-inner diameter ratio, , was left as parameter to be optimized for, to further test the model’s prediction against the measured value of . Looking at the definitions in Eq. (18), it may very well be argued that two identical responses could result from a different value of , by appropriate adjustment of to make up for the diffusion time, and to make up for the final displacement field. However, by initializing the value of at the reasonable value of 1.2, for all 19 cases, a compelling agreement between the predicted value of and its measured value was observed as reported in Fig. 8. This shows that in the full parameter space including as a free parameter, the optimization seems to be at least locally unambiguous. But was only left free in this study to test the model. In future potential applications of this method to real patients, the measured value of can be fed to the model, and unambiguous results would then be obtained.
5. Parametric study
To better understand the fundamental physical meaning of the dimensionless parameters obtained from this model, a parametric study, where one parameter is changed while keeping the others constant, will be presented. In addition to the response , all the figures in this section show the profiles of and at the last time step of the simulation. This is to show how the deformation, , is related to how soft the wall eventually gets due to the dilation stimulation, .
5.1. Changing
Fig. 13 shows the effects of changing . It is observed that for higher values of , the artery exhibits larger deformation, , and more softening illustrated by lower profiles. The profiles show little sensitivity to the value. Since is directly related to (Eq. (18)), a higher value means a lower arterial resistance to a changing WSS. Therefore, as evident from the profile, the artery gets softest for the highest value of , and consequently the artery undergoes the highest deformation . Also, notice how for all values of , the artery is softest towards the inner radial locations where is highest (strongest vasodilation stimulation). The slight effect that has on is due to the changing deformation at , affecting the WSS (Eq. (11)).
Fig. 13.
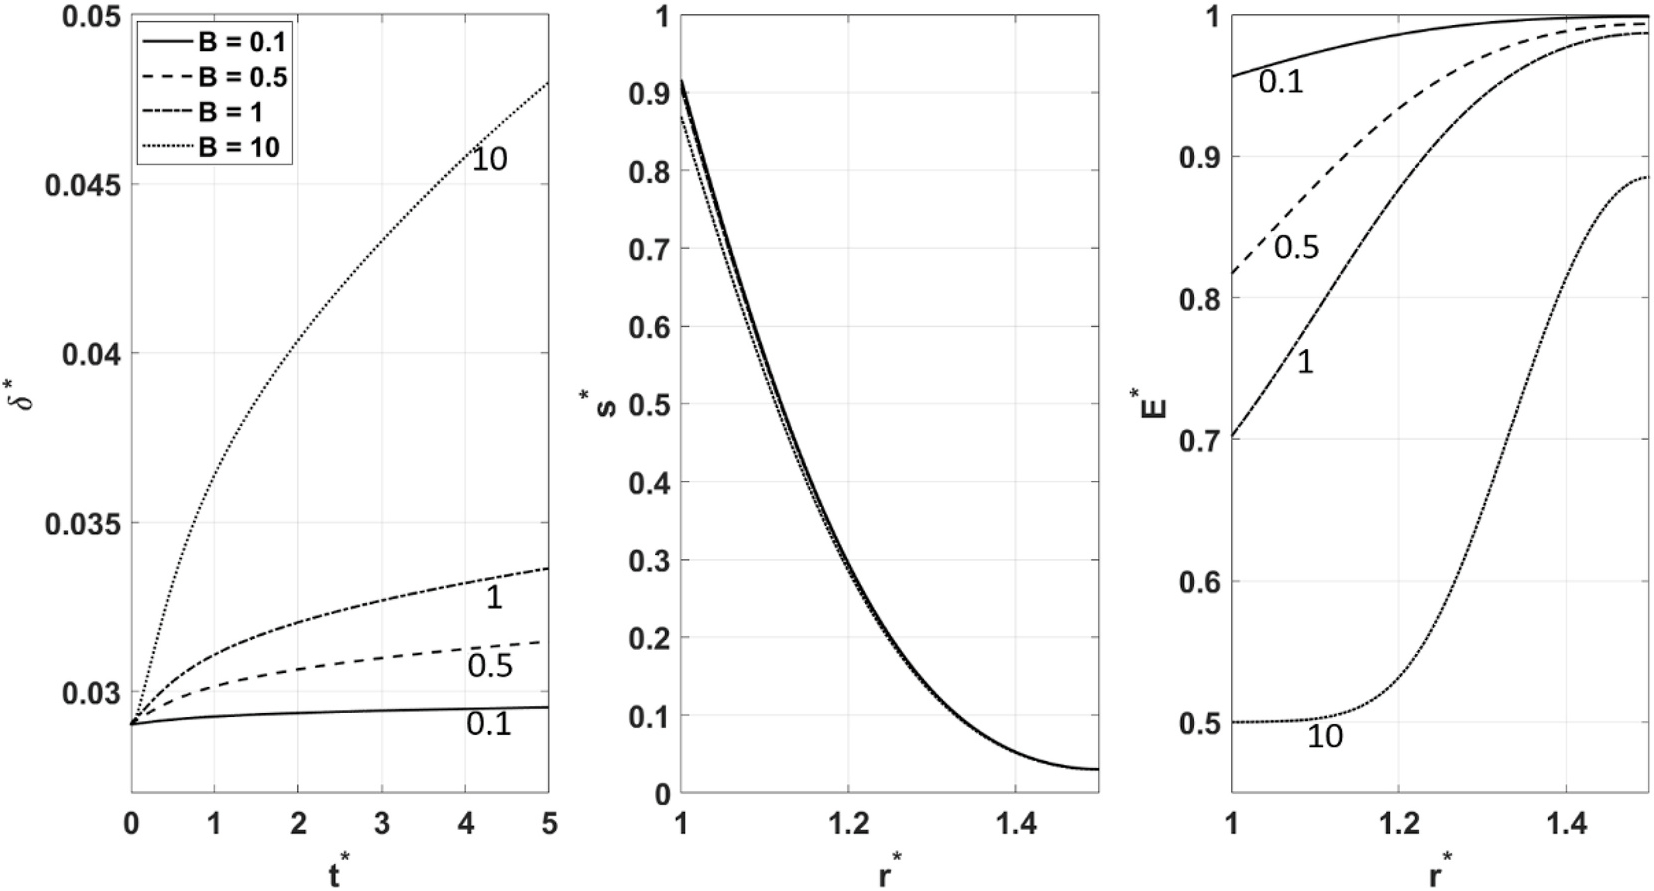
, and behavior for different values of .
5.2. Changing
Fig. 14 shows the effects of changing . It can be observed that lower values of lead to the larger deformation, , and more softening manifested by the lower profiles. seems to have minimal sensitivity to the value of . As mentioned earlier, quantifies the sensitivity of the arterial wall to a changing WSS. At its maximum value of 1, where , the arterial compliance is completely indifferent to WSS. This is manifested by holding a flat profile leading to a corresponding flat unchanging deformation . The lower the value of gets, the softer the arterial wall eventually becomes , allowing for further deformation . As in the case of , changing has little effect on the diffusion of .
Fig. 14.

, and behavior for different values of .
5.3. Changing
Fig. 15 shows the effects of changing . As evident from , higher values of lead to greater deformation, and more softening, commensurate with the lower profiles. The profiles show a high sensitivity to , the highest value of which leads to the highest profile. is the parameter characterizing mechanotransduction. Since it is directly related to the diffusion coefficient, , of the property , a higher value indicates a faster diffusion and therefore a more robust mechanotransduction. Note how at the highest value of , the profile gets closest to becoming uniform, prompting the profile to follow suit, and consequently leading to the highest deformation .
Fig. 15.

, and behavior for different values of .
6. Concluding remarks
In this study, a physics-based mathematical model describing mechanotransduction in a thick arterial wall during flow mediated dilation is proposed. The model captures the key biophysics involved in the FMD process and was validated by 19 BFMD responses. A set of dimensionless parameters arose from the model. Each has a specific physical meaning that pertains to an aspect of the arterial wall’s physical state. Using an optimization algorithm, the parameter values corresponding to each of the experimentally observed responses were measured/determined. The resulting theoretical responses show that the model independently predicts a distinctive feature of mechano-transduction, a curvature shift that was observed across all the considered cases. The model predicted the value of the artery’s outer-to-inner diameter ratio within a reasonable margin of error, despite the variability due to practical limitations of image acquisition. Also, for the subjects with repeated tests, the measured outer-to-inner diameter ratio exhibited a consistent association with the estimated value of the mechanotransduction parameter.
In this paper, the vessel wall is modeled to be elastic. However, much of the arterial wall is made of cellular tissue in which liquid redistribution could be a major contributor to a viscous component of the response. If liquid redistribution has a significant effect, its influence would be manifested by a highly viscoelastic response. However, a closer look at the experimental data would reveal something quite different. It can be noticed that, the experimental displacement fluctuations caused by pressure pulsations due to heartbeats are very pronounced, especially in the very early phase of the response before the expansion picks up pace (See Fig. 7 and Fig. A1), suggesting a predominantly elastic behavior. If the viscous component were of considerable relative importance, the transient response that it would elicit to pressure pulsations would have prevented them from being so discernible right from the beginning. An explanation that would be more in line with the experimental observations of this study, as well as other previous reports on vasodilation stimulation in response to forward WSS, is a mostly elastic wall that is gradually softening and therefore expanding under the internal mean pressure. Still, because this question clearly deserves further investigation, we are developing a comprehensive viscoelastic model to address this issue. Our preliminary results corroborate our assumption of elastic dominance. The reader is invited to stay tuned to future publications on this matter.
It is essential to acknowledge that this study does not aim to establish baseline values for the emerging model parameters. Granted, the current model is more involved than the simpler version proposed in our first study (Sidnawi et al., 2020), and 19 data sets are more than the 7 that were used there. However, the sample size still lacks the heft required for confidently asserting any standard ranges and distributions for the values of those parameters across age, gender, lifestyle, race, etc. A larger study controlling for these aspects is desirable for further evaluation of the model. With that said, beneficial future clinical applications of this model do not necessarily have to wait for bigger medical studies to establish those ranges. For a while now, advances in medicine have been strongly hinting to a paradigm shift towards personalized treatment regimes, away from the traditional standard of care, one-size-fits-all approach. This model’s sensitivity to anatomical variabilities, even within the same subject, points to potential applications where an individual regularly (as part of every annual physical screening for example) undergoes the FMD test and has the resulting parameter values stored in a database that longitudinally tracks their evolution over time. Since each of those parameters has a sensible physical meaning, the changes that they exhibit in the same individual can be easily mapped onto changes in the physical state of arteries, which in turn can provide a warning of the emergence or the onset of some forms of CVD. The potential future applications of this model as an inexpensive, noninvasive diagnostic tool for early detection of emerging CVD are promising.
On an important final note, coupling the fundamental ideas proposed in this study, with advanced numerical flow simulation techniques such as Direct Numerical Simulation (DNS) (Sánchez Abad et al., 2020) and sophisticated data-driven analyses (Guastoni et al., 2020) that can capture relevant fine details about the blood flow field, could possibly catapult the capabilities of this method to heights that would be worth future exploration.
Acknowledgment:
Q.W and B. S would like to acknowledge the support of the National Science Foundation under Award No. 1511096 for model development. C.S and Z. C would like to acknowledge the support of National Institute of Health under Award Number R21 EB005326 for experimental data collection.
Appendix
Fig. A1 shows the theoretical vs. experimental FMD response comparisons for the other 18 cases. The comparison in Fig. 7 corresponds to subject 1.
Fig. A1.
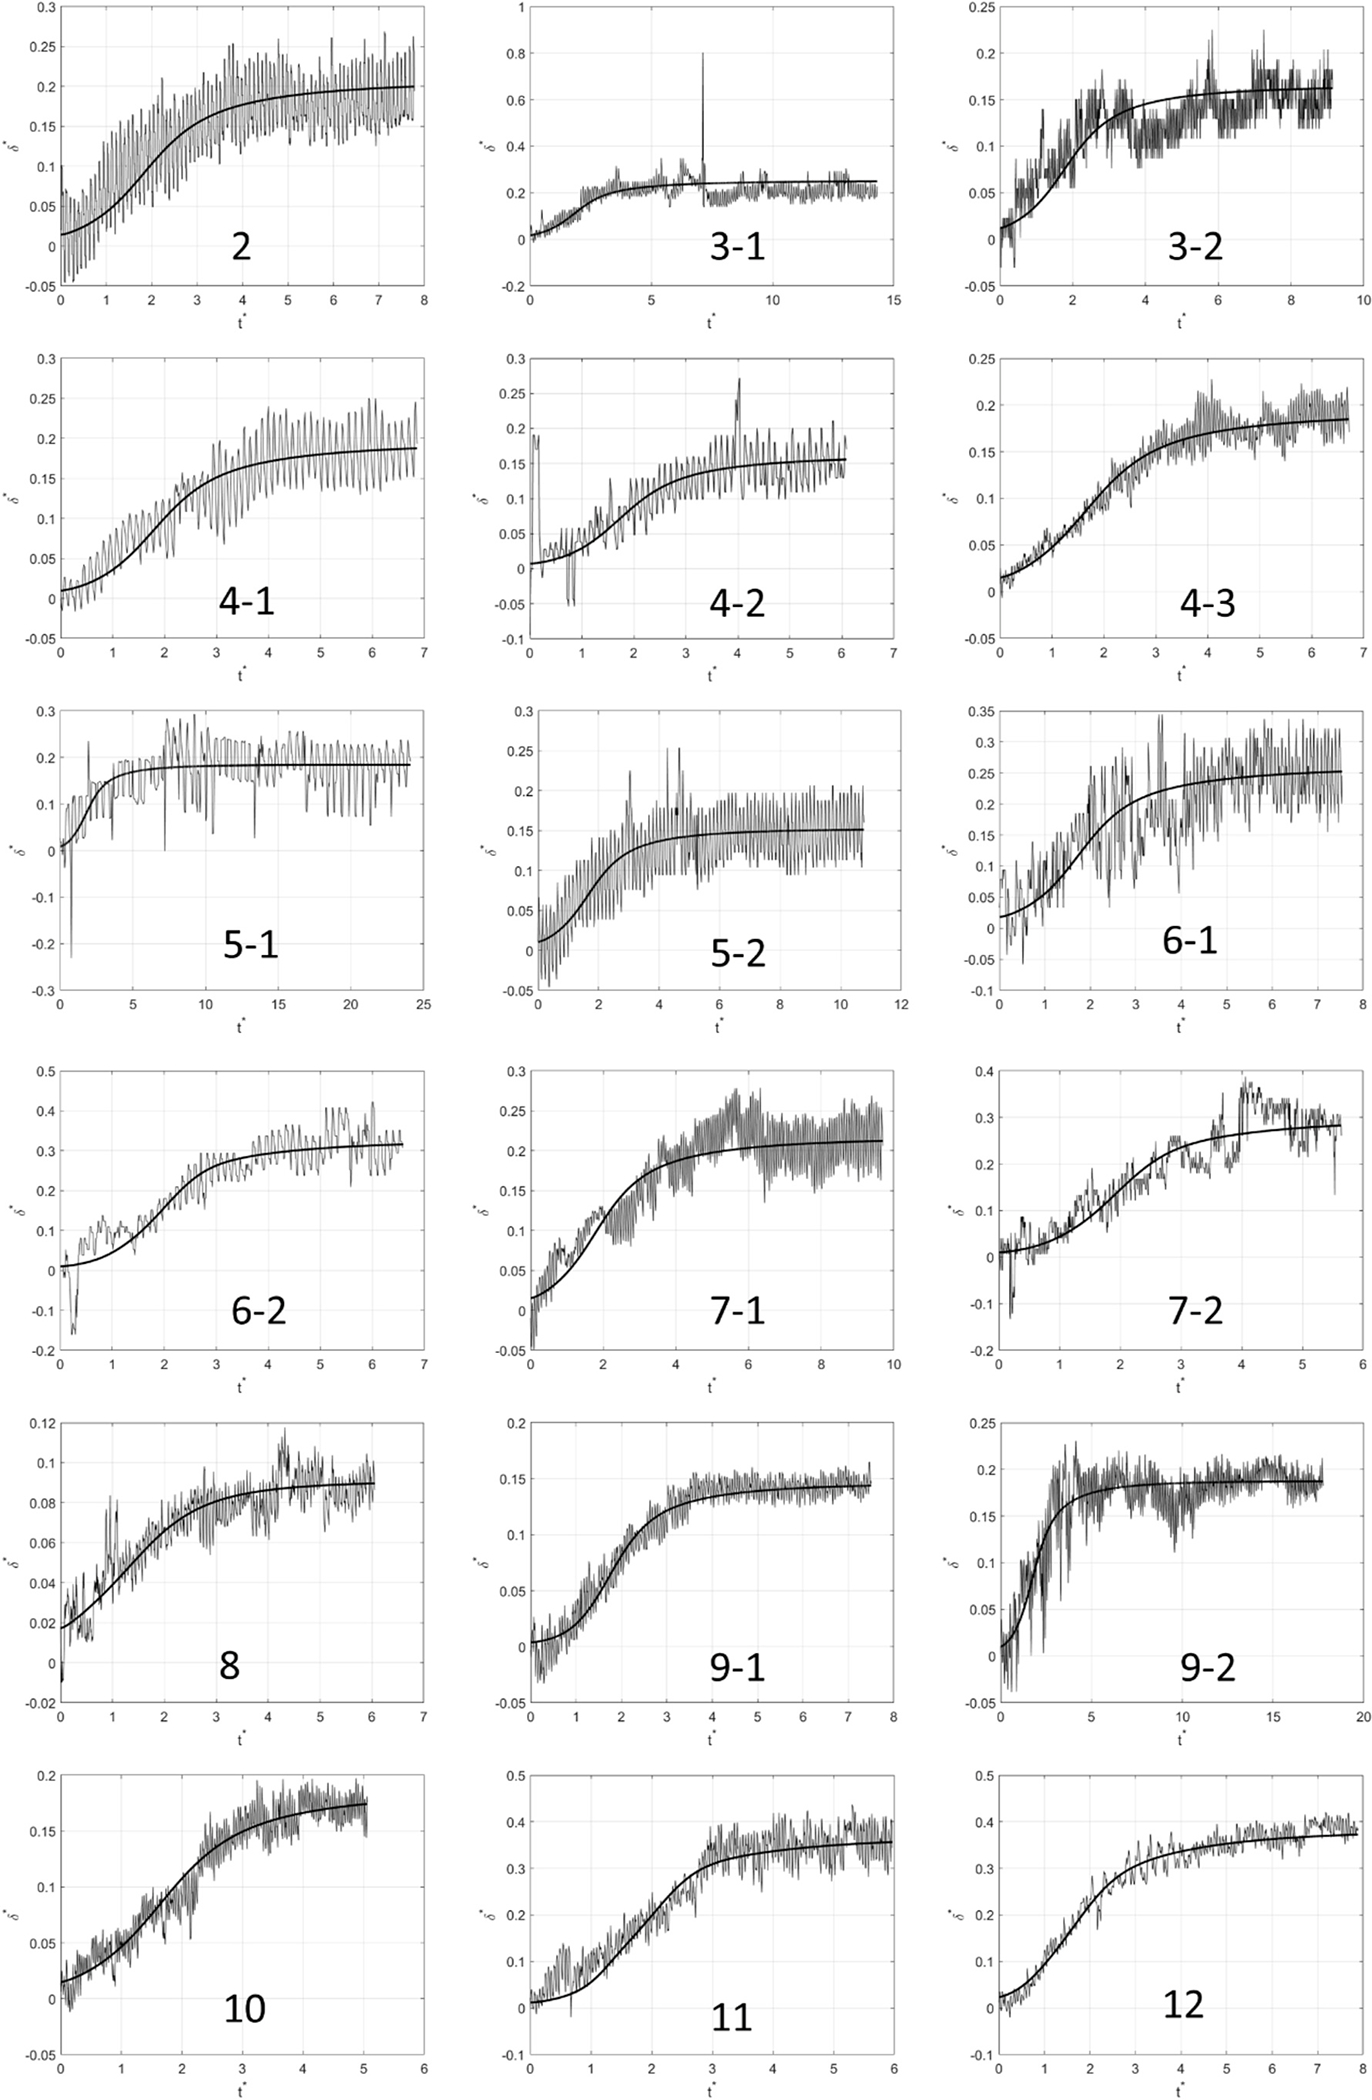
Experimental vs. theoretical FMD responses corresponding to the remaining 9 of the other 18 cases. The thick solid line plots the theoretical fit to the model. The labeling convention for the subjects who had repeat tests is: Subject Number-Test Number.
Footnotes
Declaration of competing interest
The authors declare that they have no known competing financial interests or personal relationships that could have appeared to influence the work reported in this paper.
References
- Baeyens N, et al. , 2014. Syndecan 4 is required for endothelial alignment in flow and atheroprotective signaling. Proc. Natl. Acad. Sci. U. S. A. 111, 17308–17313. [DOI] [PMC free article] [PubMed] [Google Scholar]
- Bartosch AMW, Mathews R, Tarbell JM, 2017. Endothelial glycocalyx-mediated nitric oxide production in response to selective AFM pulling. Biophys. J. 113, 101–108. [DOI] [PMC free article] [PubMed] [Google Scholar]
- Birk GK, et al. , 2012. Brachial artery adaptation to lower limb exercise training: role of shear stress. J. Appl. Physiol. 112, 1653–1658. [DOI] [PubMed] [Google Scholar]
- Celermajer DS, et al. , 1993. Cigarette smoking is associated with dose-related and potentially reversible impairment of endothelium-dependent dilation in healthy young adults. Circulation 88, 2149–2155. [DOI] [PubMed] [Google Scholar]
- Chien S, 2007. Mechanotransduction and endothelial cell homeostasis: the wisdom of the cell. Am. J. Physiol. Heart Circ. Physiol. 292. [DOI] [PubMed] [Google Scholar]
- Ebong EE, Lopez-Quintero SV, Rizzo V, Spray DC, Tarbell JM, 2014. Shear-induced endothelial NOS activation and remodeling via heparan sulfate, glypican-1, and syndecan-1. Integr. Biol. 6, 338–347. [DOI] [PMC free article] [PubMed] [Google Scholar]
- Fu BM, Tarbell JM, 2013. Mechano-sensing and transduction by endothelial surface glycocalyx: composition, structure, and function. Wiley Interdiscip. Rev. Syst. Biol. Med. 5, 381–390. [DOI] [PMC free article] [PubMed] [Google Scholar]
- Guastoni L, et al. , 2020. Convolutional-network models to predict wall-bounded turbulence from wall quantities. arXiv. [Google Scholar]
- Haeren RHL, et al. , 2016. Assessment and imaging of the cerebrovascular glycocalyx. Curr. Neurovascular Res. 13, 249–260. [DOI] [PubMed] [Google Scholar]
- Hashimoto M, et al. , 1998. The impairment of flow-mediated vasodilatation in obese men with visceral fat accumulation. Int. J. Obes. 22, 477–484. [DOI] [PubMed] [Google Scholar]
- Kaiser L, Spickard RC, Olivier NB, 1989. Heart failure depresses endothelium-dependent responses in canine femoral artery. Am. J. Physiol. Cell Physiol. 256, H962–H967. [DOI] [PubMed] [Google Scholar]
- Kaźmierski M, Michalewska-Włudarczyk A, Krzych ŁJ, Tendera M, 2010. Diagnostic value of flow mediated dilatation measurement for coronary artery lesions in men under 45 years of age. Cardiol. J. 17, 288–292. [PubMed] [Google Scholar]
- Loth F, et al. , 2003. Transitional flow at the venous anastomosis of an arteriovenous graft: potential activation of the ERK1/2 mechanotransduction pathway. J. Biomech. Eng. 125, 49–61. [DOI] [PubMed] [Google Scholar]
- McCully KK, 2012. Flow-mediated dilation and cardiovascular disease. J. Appl. Physiol. 112, 1957–1958. [DOI] [PubMed] [Google Scholar]
- Nakamura T, et al. , 2011. Endothelial vasomotor dysfunction in the brachial artery predicts the short-term development of early stage renal dysfunction in patients with coronary artery disease. Int. J. Cardiol. 148, 183–188. [DOI] [PubMed] [Google Scholar]
- Nishida K, et al. , 1992. Molecular cloning and characterization of the constitutive bovine aortic endothelial cell nitric oxide synthase. J. Clin. Invest. 90, 2092–2096. [DOI] [PMC free article] [PubMed] [Google Scholar]
- Nolan DR, McGarry JP, 2016. On the compressibility of arterial tissue. Ann. Biomed. Eng. 44, 993–1007. [DOI] [PubMed] [Google Scholar]
- Noris M, et al. , 1995. Nitric oxide synthesis by cultured endothelial cells is modulated by flow conditions. Circ. Res. 76, 536–543. [DOI] [PubMed] [Google Scholar]
- Pikoula M, Tessier MB, Woods RJ, Ventikos Y, 2018. Oligosaccharide model of the vascular endothelial glycocalyx in physiological flow. Microfluid. Nanofluidics 22, 1–13. [DOI] [PMC free article] [PubMed] [Google Scholar]
- Pyke KE, Tschakovsky ME, 2005. The relationship between shear stress and flow-mediated dilatation: implications for the assessment of endothelial function. J. Physiol. 568, 357–369. [DOI] [PMC free article] [PubMed] [Google Scholar]
- Sánchez Abad N, Vinuesa R, Schlatter P, Andersson M, Karlsson M, 2020. Simulation strategies for the food and drug administration nozzle using Nek5000. AIP Adv. 10. [Google Scholar]
- Secomb TW, Hsu R, Pries AR, 2001. Effect of the endothelial surface layer on transmission of fluid shear stress to endothelial cells. Biorheology 38, 143–150. [PubMed] [Google Scholar]
- Shi ZD, Abraham G, Tarbell J, Shear M, 2010. Stress modulation of smooth muscle cell marker genes in 2-D and 3-D depends on mechanotransduction by heparan sulfate proteoglycans and ERK1/2. PloS One 5, 1–9. [DOI] [PMC free article] [PubMed] [Google Scholar]
- Sidnawi B, Chen Z, Sehgal C, Wu Q, 2020. Characterization of arterial flow mediated dilation via a physics-based model. J. Mech. Behav. Biomed. Mater. 107, 103756. [DOI] [PubMed] [Google Scholar]
- Stoner L, Sabatier M, Edge K, McCully K, 2004. Relationship between blood velocity and conduit artery diameter and the effects of smoking on vascular responsiveness. J. Appl. Physiol. 96, 2139–2145. [DOI] [PubMed] [Google Scholar]
- Tarbell JM, Cancel LM, 2016. The glycocalyx and its significance in human medicine. J. Intern. Med. 280, 97–113. [DOI] [PubMed] [Google Scholar]
- Tarbell JM, Ebong EE, 2008. The Endothelial Glycocalyx : A Mechano-Sensor and -Transducer, vol. 1, pp. 1–6. [DOI] [PubMed] [Google Scholar]
- Tarbell JM, Pahakis MY, 2006. Mechanotransduction and the glycocalyx. J. Intern. Med. 259, 339–350. [DOI] [PubMed] [Google Scholar]
- Thi MM, Tarbell JM, Weinbaum S, Spray DC, 2004. The role of the glycocalyx in reorganization of the actin cytoskeleton under fluid shear stress: a ‘bumper-car’ model. Proc. Natl. Acad. Sci. U. S. A. 101, 16483–16488. [DOI] [PMC free article] [PubMed] [Google Scholar]
- Wang Y, Schaffler M, Weinbaum S, 2006. A model for the role of integrins in flow induced mechanotransduction in osteocytes. J. Biomech. 39, S238. [DOI] [PMC free article] [PubMed] [Google Scholar]
- Weinbaum S, Zhang X, Han Y, Vink H, Cowin SC, 2003. Mechanotransduction and flow across the endothelial glycocalyx. Proc. Natl. Acad. Sci. U. S. A. 100, 7988–7995. [DOI] [PMC free article] [PubMed] [Google Scholar]
- Weinbaum S, Tarbell JM, Damiano ER, 2007. The structure and function of the endothelial glycocalyx layer. Annu. Rev. Biomed. Eng. 9, 121–167. [DOI] [PubMed] [Google Scholar]
- Weinbaum S, Cancel LM, Fu BM, Tarbell JM, 2020. The glycocalyx and its role in vascular physiology and vascular related diseases. Cardiovasc. Eng. Technol. 10.1007/s13239-020-00485-9. [DOI] [PMC free article] [PubMed] [Google Scholar]
- Yao Y, Rabodzey A, Dewey CF, 2007. Glycocalyx modulates the motility and proliferative response of vascular endothelium to fluid shear stress. Am. J. Physiol. Heart Circ. Physiol. 293, 1023–1030. [DOI] [PubMed] [Google Scholar]
- Zeng Y, Liu J, 2016. Role of glypican-1 in endothelial NOS activation under various steady shear stress magnitudes. Exp. Cell Res. 348, 184–189. [DOI] [PubMed] [Google Scholar]


