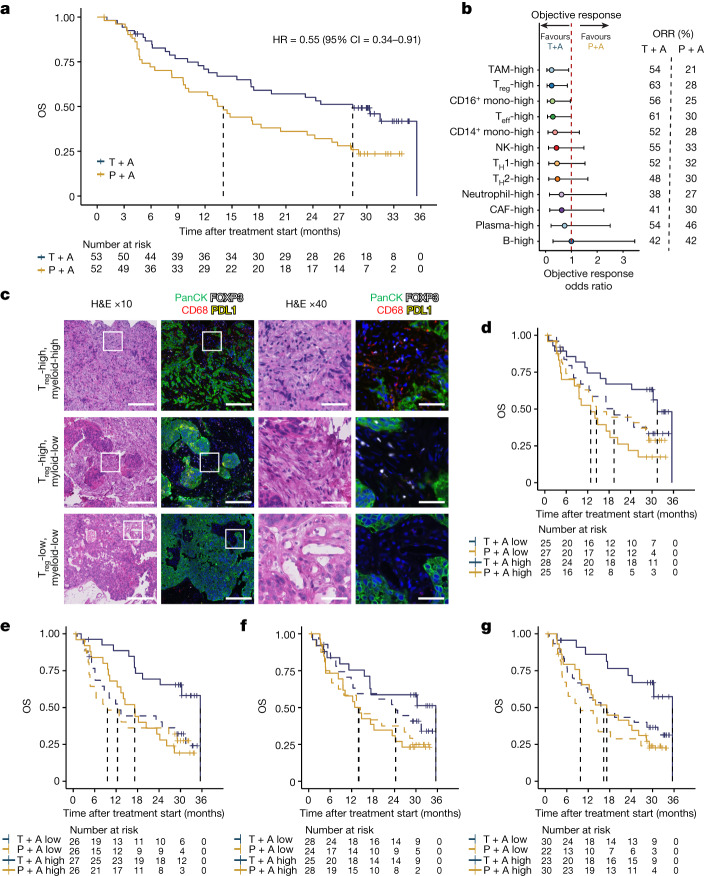
Fig. 1. Intratumoural myeloid and Treg cell content is associated with patient benefit after combination treatment with tiragolumab plus atezolizumab in the CITYSCAPE trial.
a, Kaplan–Meier curve comparing the OS of patients in the BEP who received tiragolumab + atezolizumab (blue) or placebo + atezolizumab (gold). b, Comparison of the overall objective response odds ratio of tiragolumab + atezolizumab versus placebo + atezolizumab in patients whose tumours had high cell type abundance. Intratumoural cell types were determined as high or low on the basis of the median signature score cut-offs. Odds ratio calculations were performed using Fisher’s exact tests. The dots represent the objective response odds ratio and the horizontal bars show the 95% CI. c, Multiplex immunofluorescence staining of pan-cytokeratin (panCK; green), FOXP3 (white), CD68 (red), and PD-L1 (yellow) in CITYSCAPE patient tumour samples (n = 27). Representative images are shown for Treg-high/myeloid-high (top), Treg-high/myeloid-low (middle) and Treg-low/myeloid-low (bottom). Scale bars, 200 μm (columns 1 and 2) and 50 μm (columns 3 and 4). H&E, haematoxylin and eosin. d–g, Kaplan–Meier curves comparing the OS in patients with tumours enriched (solid lines) or not enriched (dashed lines) for the top four cell types in b, including TAMs (d), Treg cells (e), CD16+ monocytes (f) and CD8+ T effector (Teff) cells (g), that were associated with response to tiragolumab + atezolizumab. Enrichment or not was determined by the median cell type signature score cut-offs. For a and d–g, HRs and 95% CIs were determined using a univariate Cox model. CAFs, cancer-associated fibroblasts; mono, monocytes; P + A, placebo + atezolizumab; T + A, tiragolumab + atezolizumab; TH, T helper cells.

