Abstract
Nitrogen-catabolic gene expression in Saccharomyces cerevisiae is regulated by the action of four GATA family transcription factors: Gln3p and Gat1p/Nil1p are transcriptional activators, and Dal80 and Deh1p/Gzf3p are repressors. In addition to the GATA sequences situated upstream of all nitrogen catabolite repression-sensitive genes that encode enzyme and transport proteins, the promoters of the GAT1, DAL80, and DEH1 genes all contain multiple GATA sequences as well. These GATA sequences are the binding sites of the GATA family transcription factors and are hypothesized to mediate their autogenous and cross regulation. Here we show, using DAL80 fused to the carbon-regulated GAL1,10 or copper-regulated CUP1 promoter, that GAT1 expression is inversely regulated by the level of DAL80 expression, i.e., as DAL80 expression increases, GAT1 expression decreases. The amount of DAL80 expression also dictates the level at which DAL3, a gene activated almost exclusively by Gln3p, is transcribed. Gat1p was found to partially substitute for Gln3p in transcription. These data support the contention that regulation of GATA-factor gene expression is tightly and dynamically coupled. Finally, we suggest that the complicated regulatory circuit in which the GATA family transcription factors participate is probably most beneficial as cells make the transition from excess to limited nitrogen availability.
Nitrogen-catabolic gene expression in Saccharomyces cerevisiae depends on the GATA family transcriptional activators Gln3p and Gat1/Nil1p (for comprehensive reviews of the GATA transcription factor literature, see references 7 and 26). In the presence of a rich nitrogen supply, Gln3p and Gat1p form a complex with Ure2p (a prion precursor and negative regulator of nitrogen catabolite repression (NCR)-sensitive gene expression) and are thereby excluded from the nucleus (2, 3, 9, 10, 14–17, 19, 27). Consistent with this exclusion, when CAN1 expression is repressed by growth with glutamine as a nitrogen source, the GATA sequences in its promoter are unoccupied and hence are able to serve as surrogate TATA elements (9).
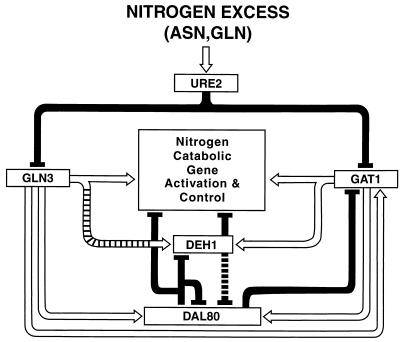
NCR-sensitive gene expression is also subject to negative regulation by two transcriptional repressors, Dal80p/Uga43p and Deh1p/Gzf3p (7, 26); mutation of DAL80 increases expression of the regulated genes 10- to 20-fold (4, 12). Dal80p, Deh1p, Gln3p, and Gat1p are all GATA family DNA-binding proteins (7, 26), and Dal80p has been shown to bind to the same GATA elements as Gln3p (11). The opposing regulation mediated by the GATA-family activators and repressors led us to propose that they might work by competing with one another for binding to their target GATA sequences (Fig. 1) (1, 6, 11, 13, 23, 24, 26). The hypothesis of competitive control not only applies to genes encoding transport and enzyme proteins; three of the four GATA-factor genes (GAT1, DAL80, and DEH1) contain multiple GATA sequences in their promoters, and genetic data argue that they are subject to cross and autogenous regulation (Fig. 1). Although genetic data overall support the model, an important aspect of it has been questioned because it has not been subjected to experimental scrutiny. Genetic data predict that GAT1 and DAL80 expression should be tightly coupled to one another (5, 6). In experiments in which GAT1 was placed under GAL1,10 control, DAL80 expression was shown to increase in parallel with that of GAT1 (10).
FIG. 1.
Proposed regulatory circuit of GATA-factor-dependent transcription in S. cerevisiae. Open arrows and closed bars indicate positive and negative regulation, respectively.
The purpose of the work reported here was to test whether graded DAL80 expression regulates GAT1 transcription in particular and overall NCR-sensitive expression in general. The data obtained support such a competitive model and suggest that the value of this complex regulation most likely accrues during the transition from a good to a poor nitrogen supply.
MATERIALS AND METHODS
Strains, plasmids, and media.
We used strains TCY5 (MATα lys2 ura3 trp1::hisG), TCY29 (Matα lys2 ura3 trp1::hisG dal80::hisG), TCY36 (MATα lys2 ura3 trp1::hisG leu2::hisG), TCY38 (MATα lys2 ura3 trp1::hisG leu2::hisG dal80::hisG), TCY46 (MATα lys2 ura3 trp1::hisG GAL1,10-GAT1), TCY53 (Matα lys2 ura3 trp1::hisG dal80::hisG GAL1,10-GAT1), TCY55 (MATα lys2 ura3 trp1::hisG dal80::hisG gln3Δ::hisG), TCY64 (MATα lys2 ura3 trp1::hisG dal80::hisG gln3Δ::hisG GAL1,10-GAT1), TSC65 (MATα lys2 ura3 trp1::hisG leu2::hisG his3::hisG GAL1,10-DAL80).
We used plasmids pTSC417 (pT7-7-DAL80) (13), pTSC491 (UGA4GATA-lacZ) (11), pTSC560 (DAL80-lacZ) (this work), pTSC565 (CUP1-DAL80) (this work), pTSC572 (DAL80-lacZ) (6), pTSC624 (GAT1-lacZ) (6), pTSC666 (GAL1,10-GAT1-lacZ) (10), pTSC674 (GAL1,10-DAL80) (this work), pTSC678 (see below), pTSC679 (GAL1,10-DAL80-lacZ) (10), and pJD5-2 (DAL5-lacZ) (6).
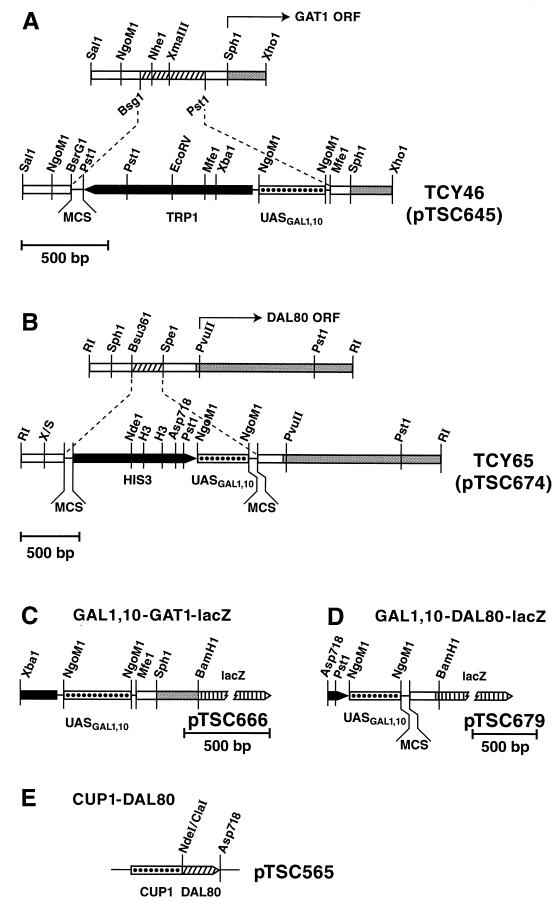
To construct the GAL1,10-DAL80 fusion, the 0.9-kb Asp-718-PvuII fragment from pTSC674 was cloned into Litmus 28 digested with the same enzymes to yield pTSC678. pTSC678 was then digested with PvuII, a BamHI oligonucleotide (10-mer) was ligated onto the blunted ends, and the resulting plasmid was digested with BamHI and XbaI. The 0.9-kb XbaI-BamHI fragment, containing the 3′ end of HIS3, the GAL1,10 UAS, and DAL80 5′ end (to position +46) was isolated and ligated into plasmid pHP41 digested with XbaI and BamHI, yielding pTSC679 (Fig. 2B). All fusion junctions were sequenced to ensure that the fusions were in frame. Methods similar to those above were used to construct CUP1-DAL80 pTSC565, except that the plasmid backbone was derived from pSc3415 (20).
FIG. 2.
Constructs for the production and assay of Dal80p and Gat1p from the GAL1,10 promoter. Genomic loci are shown prior to (A) and following (B) integration of a construct in which a GAL1,10 promoter fragment (derived from pTSC645 or pTSC674) replaces the native promoter of the gene; open bars, yeast DNA; grey bars, GAT1 or DAL80 open reading frame (ORF); black bars, yeast selectable marker; stippled bars, GAL1,10 promoter DNA; dashed lines, vector sequences. Strain numbers of the resulting strains are also indicated. lacZ fusion plasmids were derived from GAL1,10-GAT1 (C) and GAL1,10-DAL80 (D), pTSC666 and pTSC679, respectively. Symbols are as indicated for panels A and B above except vertical lines, indicating lacZ DNA. (E) CUP1-DAL80 plasmid.
Pertinent structures of GAL1,10-GAT1 and GAL1,10-DAL80, that replaced the wild-type alleles in the genome, and GAT1-lacZ, DAL80-lacZ, and CUP1-DAL80 plasmids are shown (Fig. 2). All lacZ fusion constructs were carried in CEN vectors.
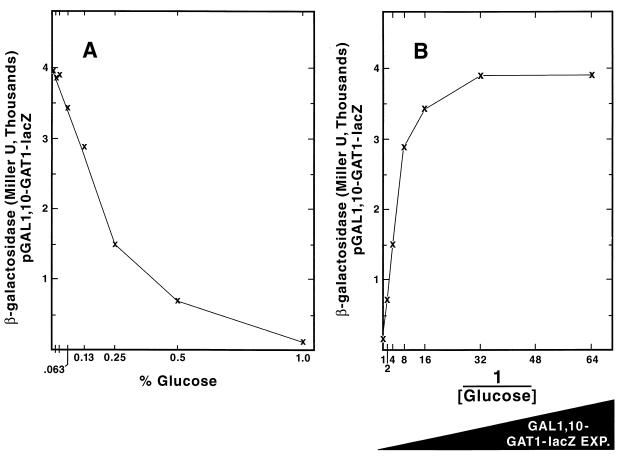
Minimal medium was 0.17% yeast nitrogen base (YNB) without aa or (NH4)2SO4 (Difco) with indicated carbon and nitrogen sources and auxotrophic requirements. Cultures for experiments in which various amounts of glucose were added to the cultures (Fig. 3, 4A and B, 5, and 7) were prepared in the following manner. Standard overnight cultures were grown to log phase (A600 = 0.6 to 0.8) in minimal 2% glucose medium. Therefore, all GAL1,10-regulated gene expression was heavily repressed at the onset of the experiment. A sample of the culture was taken, washed with water, and inoculated into fresh minimal galactose-proline medium containing the indicated amounts of glucose. The inocula were such that the cultures reached cell densities (A600) of 0.3 to 0.8 after overnight growth. The cultures were then harvested and assayed for β-galactosidase. As the amount of glucose added to the culture was increased, the cumulative amounts of either GAL1,10-GAT1 or GAL1,10-DAL80 expression decreased (Fig. 3). The premise upon which these experiments were based is that the cumulative amount of GAT1 and DAL80 expression during growth of a culture can be varied in a reproducible manner and that the effects of those variations can then be measured. It must also be noted, however, that while the method we used will test and correlate whether graded changes in DAL80 expression elicit similarly graded changes in GAT1 expression and vice-versa, they do not permit absolute quantitation of the relationships between intracellular Gat1p and Dal80p levels, subcellular distributions of the proteins, and the levels of DAL80 and GAT1 expression.
FIG. 3.
GAT1-lacZ expression driven from the GAL1,10 promoter in cultures to which increasing amounts of glucose were added. The detailed protocol for the experiment is described in Materials and Methods. Data in Fig. 3B are those from Fig. 3A plotted as the reciprocal of the glucose concentration to facilitate understanding of the results.
FIG. 4.
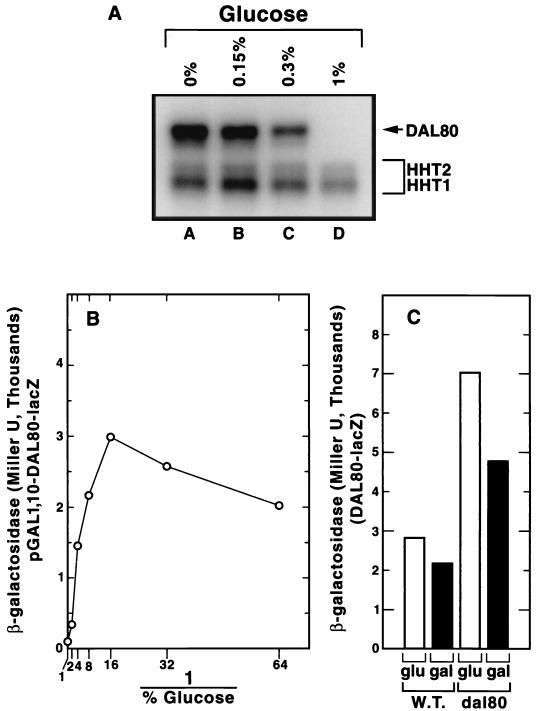
Characterization of the Dal80p-production system. (A) Northern blot analysis of DAL80 mRNA driven by the GAL1,10 promoter. Total RNA (10 μg/lane) was extracted from TCY65. The experimental protocol was as described in Materials and Methods. The 32P-dCTP-labeled DAL80 probe was synthesized from the 0.8-kb NdeI-EcoRI fragment of pTSC417. HHT1 and HHT2 standards were probed with a radioactive complementary oligonucleotide. (B) Effect of increasing glucose addition on lacZ expression in strain TCY36 transformed with GAL1,10-DAL80-lacZ pTSC679. (C) Expression of DAL80-lacZ from pTSC572 in WT (TSC46) and dal80 (TCY53) strains growing in YNB–2% glucose–2% galactose–0.1% proline medium. Cells were grown under standard conditions and harvested for β-galactosidase assays at a cell density A600 of 0.4 to 0.8.
Asparagine to proline shift.
Strain TCY36 (wild type [WT]) or TCY38 (dal80), transformed with plasmids indicated in the figures, was grown in 2% glucose–0.1% asparagine–YNB minimal medium at 22°C to an A600 of 0.4. Each culture was then harvested by filtration, washed with 100 ml of minimal medium lacking a nitrogen source, and resuspended in the same volume (as the original culture) of minimal glucose proline medium. The cultures were sampled as indicated and assayed for β-galactosidase as previously described (11). The results were reported in Miller units, which are based on 25 ml of culture.
Northern blot hybridization and β-galactosidase assays were performed as previously described (13).
RESULTS
Heterologous DAL80 and GAT1 expression under GAL1,10 control.
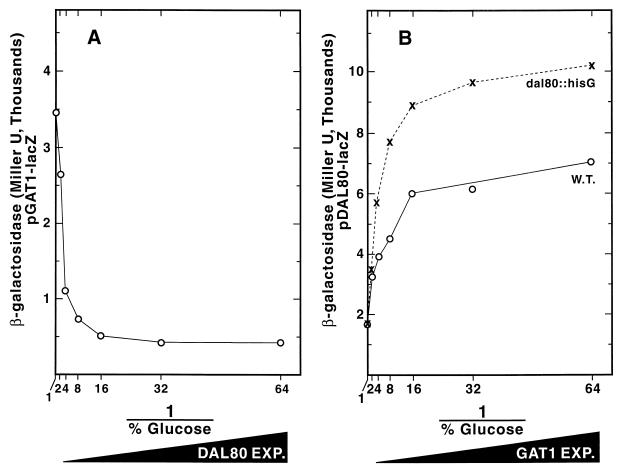
If Dal80p down-regulates transcription by competing with the GATA family transcription activators for DNA binding, one would expect Gln3p- and Gat1p-dependent transcription to vary inversely with DAL80 expression. To test this, we placed GAT1 or DAL80 expression under control of the GAL1,10 promoter to remove it from GATA factor regulation and NCR sensitivity. Variations in the amount of GAT1 or DAL80 expression were then generated by changing the levels of glucose (and hence the level of carbon catabolite repression) in the medium. These results are demonstrated in Fig. 3A, in which lacZ was fused to the GAL1,10-GAT1 promoter. Finally, the effects elicited by changes in GAT1 or DAL80 expression were measured using DAL80-lacZ or GAT1-lacZ reporter genes containing native promoter regions of the fused genes. This experimental strategy was previously used to analyze the regulatory relationships between Gat1p and Ure2p (10). Throughout this work, we have plotted the data as the inverse of the glucose concentration (Fig. 3B) to facilitate visualizing the experimental results; i.e., expression of the gene we are changing experimentally (GAL1,10-GAT1, or GAL1,10-DAL80) increases from left to right on the abscissa, and the effects elicited by the experimental pertubation are recorded on the ordinate as DAL80-lacZ or GAT1-lacZ expression (β-galactosidase production), respectively. Dal80p was chosen for these experiments rather than Deh1p because (i) Dal80p is the best characterized GATAA-binding repressor and (ii) the increasing suspicion that the Deh1p-regulated genes reported so far may not be Deh1p's most physiologically relevant targets (6, 23, 24).
To ensure the GAL1,10-DAL80 construct responded appropriately to various levels of glucose, we measured steady-state DAL80 mRNA levels and GAL1,10-DAL80-lacZ reporter gene expression. As increasing amounts of glucose were added to the medium, steady-state DAL80 mRNA (Fig. 4A) and β-galactosidase production from GAL1,10-DAL80-lacZ (Fig. 4B) decreased, arguing that we can predictably regulate DAL80 expression. To evaluate the possibility that growth on galactose vs glucose or WT vs dal80::hisG strains might compromise our experimental approach, we measured DAL80 expression under these conditions. DAL80-lacZ expression increased twofold in a dal80 mutant vs the WT and decreased less than twofold in glucose vs galactose medium (Fig. 4C). Therefore, the experimental system was not compromised by the experimental conditions we used.
Inverse regulation of GAT1 and DAL80 expression.
GAT1-lacZ pTSC624, in which lacZ is expressed from the native GAT1 promoter, was used to transform GAL1,10-DAL80 strain TCY65. As DAL80 expression increased, GAT1-lacZ expression decreased (Fig. 5A). In the reciprocal control experiment, DAL80-lacZ expression from pTSC572 increased in parallel with that of GAT1 expressed from a GAL1,10 promoter in both WT TCY46 and dal80 mutant TCY53 (Fig. 5B) as reported earlier (10). Mutating the genomic copy of DAL80 further increased DAL80-lacZ expression at each level of GAT1 expression (Fig. 5A). We conclude that (i) DAL80 expression parallels that of GAT1 and (ii) GAT1 expression is inversely related to that of DAL80.
FIG. 5.
Inverse regulation of GAL80 and GAT1 expression. (A) GAT1 expression at different levels of DAL80 expression from pTSC624 in strain TCY65. (B) DAL80 expression at different levels of GAT1 expression from pTSC572 in strains TCY46 (WT) or TCY53 (dal80). Growth and assay conditions were as described in Fig. 3. Steady-state β-galactosidase production derived from DAL80-lacZ and GAT1-lacZ fusion genes in WT, dal80, and gat1 mutant backgrounds have been reported (6). However, the values obtained in those experiments should be only generally compared with the values obtained here because of the differences in the experimental conditions used.
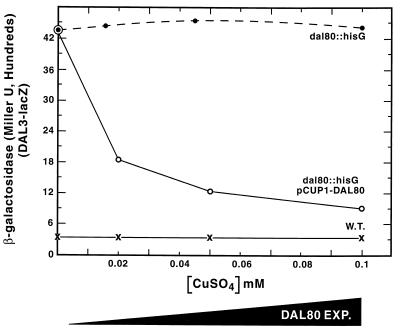
The next experiment had two objectives: (i) to ensure that the Dal80p regulation of gene expression we observed did not aberrantly derive from the heterologous GAL1,10 promoter we used and (ii) to ascertain whether the characteristics of Dal80p regulation described above extended to nonregulatory genes whose expression depended primarily upon Gln3p. We constructed CUP1-DAL80 fusion pTSC565. CUP1 is an inducible gene whose expression is regulated by the levels of copper in the medium (18). We found that copper concentrations up to 0.1 mM were not toxic to cell growth and hence provided a useful range of induction capabilities within which to work (data not shown). To meet the second objective, we used a DAL3-lacZ reporter to monitor Dal80p regulation of GATA-factor-dependent transcription. Electrophoretic-mobility-shift assays have shown that Dal80p and Gln3p bind to the same GATA elements in the DAL3 promoter (11) and further that DAL3 transcription is largely Gln3p dependent and Gat1p independent (6, 11). β-Galactosidase production, supported by DAL3-lacZ pTSC560, is approximately 14-fold higher in dal80 strain TCY29 than in isogenic WT TCY5, irrespective of the amount of copper added to the medium (Fig. 6). In strain dal80 TCY29, transformed with CUP1-DAL80 pTSC565, DAL3-lacZ expression depended on copper additions to the medium (Fig. 6). At 0.1 mM copper, DAL3-lacZ expression was close to the low level observed in WT strain TCY5, in which the genomic copy of DAL80 is expressed from its native promoter. These data suggest that the inverse functional relationship between DAL80 and GAT1 expression extends to Gln3p-mediated DAL3-lacZ expression as well.
FIG. 6.
DAL3 expression at various levels of CUP1-DAL80 expression. Strains TCY5 (WT) and TCY29 (dal80::hisG) were transformed with reporter pTSC560 alone or together with CUP1-DAL80 pTSC565. Cultures were grown overnight in 2% glucose–0.1% proline medium, containing the indicated concentrations of copper sulfate, to a cell density (A600) of 0.4 to 1.0, at which time samples were removed for the assay of β-galactosidase, using standard assay methods.
Gat1p can partially replace Gln3p in transcription of DAL80.
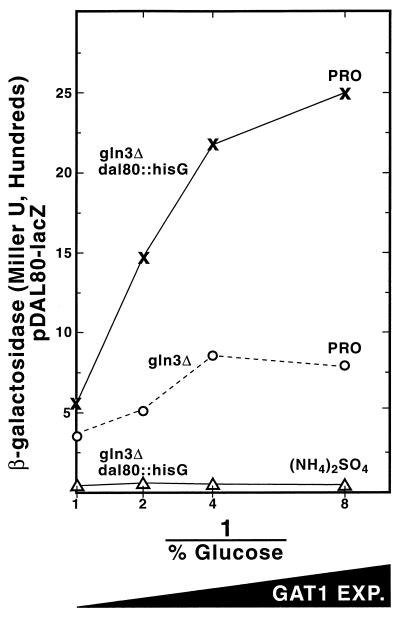
Varying GLN3 expression, as we did with DAL80 and GAT1, was not possible because excess Gln3p is toxic to the cell (21). Although we did not vary GLN3 expression, we assessed Gat1p's ability to replace Gln3p in activating DAL80 transcription. As GAT1 expression increased in gln3Δ TCY55 grown in minimal proline medium, a small but measurable amount of β-galactosidase was produced from pTSC572 (Fig. 7 [compare with Fig. 5]). When the additional variable of genomically derived Dal80p was removed, by performing the experiment in a gln3Δ dal80::hisG double mutant (TCY64), β-galactosidase production increased to about 25% of the level seen in a GLN3 strain (Fig. 7). This expression, however, was NCR sensitive.
FIG. 7.
The effect of GAT1 expression on DAL80 expression in gln3Δ strains. β-Galactosidase production was supported by a pTSC572 transformant of strain TCY55 (gln3Δ GAL1,10-GAT1) or TCY64 (gln3Δ dal80 GAL1,10-GAT1) with proline or ammonium sulfate as the nitrogen source and 2% galactose plus the indicated concentration of glucose as the carbon source as per Fig. 3 and Materials and Methods.
Dal80p functions during the transition from good to poor nitrogen sources.
The proposed GATA factor regulatory circuit consists of multiple feedback loops (Fig. 1), and this prompts the question of what use such complex control would be to the cell. When a good nitrogen source is provided, there is little DAL80 expression, reasonably low levels of GAT1 expression, and little functional Gln3p; nitrogen-catabolic gene expression is repressed to very low levels. Alternatively, when a poor nitrogen source is provided, GAT1 and DAL80 expression is high, and Gln3p functions well; nitrogen-catabolic gene expression is high and in some cases increases further via induction (7, 22). In these steady-state situations, we see little need for such a complex and dynamic regulatory circuit. Therefore, we imagined that Dal80p functions during transition from good to poor nitrogen sources to allow NCR-sensitive gene expression in general and GAT1 expression in particular to occur as a rich nitrogen supply is depleted but only at low levels.
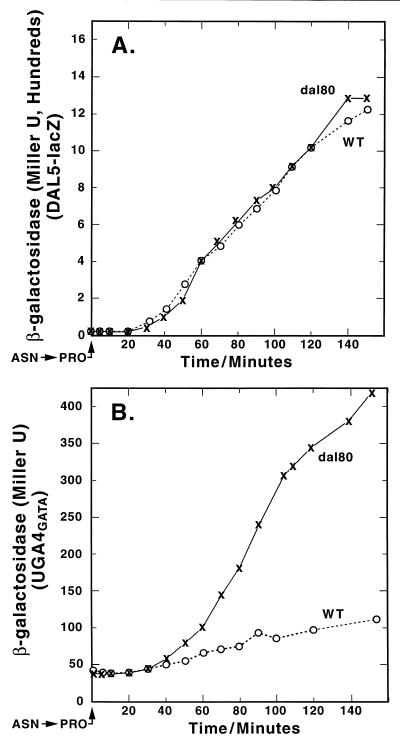
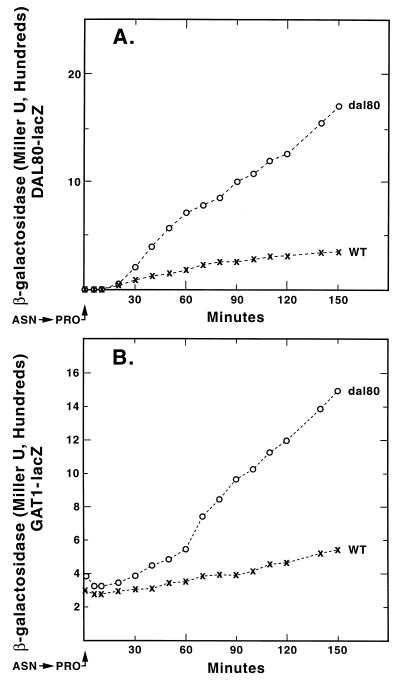
We tracked reporter gene expression supported by four fusion plasmids: pJD5-2, pTSC491, pTSC572, and pTSC624, following a rapid shift of WT and dal80 mutant cultures from minimal-asparagine to minimal-proline medium. DAL5-lacZ expression served as a control, because Dal80p regulation of this gene is minimal (13). The course of β-galactosidase production driven by the DAL5 promoter was the same in WT and dal80 cultures following the shift, increasing to high levels (Fig. 8A). A very different result was seen when expression supported by the UGA4 GATA cluster was followed. The overall kinetics of β-galactosidase production in dal80 strain TCY38 were the same as in Fig. 7A; i.e., production continuously increased following a lag of 20 to 30 min. In contrast, β-galactosidase production in the WT (TCY36) first increased as seen in the dal80 mutant but then plateaued at a low level (Fig. 7B). The same pattern was observed when DAL80-lacZ and GAT1-lacZ expression was followed through a transition from a good to poor nitrogen source (Fig. 9).
FIG. 8.
Expression of DAL5-lacZ and a UGA4 promoter fragment in a heterologous expression vector following a shift of cultures from YNB glucose-asparagine to glucose-proline medium. Strains TCY36 (WT) and TCY38 (dal80) were transformed with DAL5-lacZ pJD52 (A) or UGA4GATA pTSC491 (B).
FIG. 9.
β-Galactosidase production from DAL80-lacZ pTSC572 (A) and GAT1-lacZ pTSC624 (B) transformed into strains TCY36 (WT) and TCY38 (dal80). Conditions were as described in the legend to Fig. 8.
DISCUSSION
Our data demonstrate that GAT1 expression is inversely regulated by DAL80 expression. A similar relationship appears to exist between DAL80 expression and Gln3p-mediated transcription as well. DAL80 expression, in turn, is regulated by Gat1p expression, Gln3p operation, and autogenous repression by Dal80p (26). These results are expected if Dal80p represses Gln3p- and Gat1p-dependent transcriptional activation by competing with Gln3p and Gat1p for binding to their target GATA sequences.
The results also provide insight into the relationship of Gln3p- and Gat1p-binding sites and functions. If the two transcriptional activators were identical in DNA binding and function, one would expect Gat1p overproduction to more effectively suppress the gln3 deletion phenotype. Although some suppression was observed, it was limited, arguing that Gln3p- and Gat1p-binding-site specificity or their functions in transcription do not fully overlap. Alternatively, it is possible that differences in the relative strength of Gln3p and Gat1p as transcriptional activators could account for the differences observed (5, 12). This possibility is particularly important since three additional GATA family members in S. cerevisiae, GAT2, GAT3, and GAT4, do not appear to function in nitrogen-catabolic gene expression (8; R. Rai and T. G. Cooper, unpublished observations).
When we consider the present data in light of recent reports that Gln3p and Gat1p form complexes with Ure2p and that these complexes are excluded from the nucleus (2, 3, 9, 10, 14–17, 19, 27), we suggest that GATA factor transcriptional regulation consists of two complementing facets. NCR preeminently controls the GATA factor regulatory circuit, by dictating the amount of Gln3p and Gat1p that gains access to the nucleus and hence their target binding sites. Finer control of GATA-factor-mediated expression is then achieved by the competition of Gln3p and Gat1p with Dal80p for binding to the DNA. The fine tuning that this second level control can attain depends on the autogenous and cross regulation of GATA transcription factor production and competition. The overall outcome is a highly responsive but equally highly buffered control circuit not unrelated to the feedback loops known to electrical engineers.
We further suggest that such complex, interrelated control does not afford its greatest advantage when the cell finds itself in rich or poor nitrogen supplies but rather during the transition from the former to the latter. At times of excess nitrogen, there is little need for such finely tuned control, and little is available at the site of transcription since, due to NCR, the GATA-transcriptional activators Gln3p and Gat1p are excluded from the nucleus by Ure2p, and the repressor, Dal80p, is not produced at significant levels (6). During continuous nitrogen limitation, the system is again at steady state. Simple transcriptional regulation at the level of NCR would be quite adequate. However, as rich nitrogen sources begin to dwindle, the cell must cast about for alternative sources. To do so, only low levels of proteins required to transport and degrade alternative nitrogen sources are needed. To produce more of these proteins would be wasteful at a time when the cell can ill afford it. Therefore, nitrogen limitation results in the release of Gln3p from the Ure2p-Gln3p complex and its subsequent entry into the nucleus. There it mediates transcription of GAT1, and the Gat1p produced can then enter the nucleus and function as a transcriptional activator as well. In this regard, it is probably significant that expression of most NCR-sensitive genes requires both Gln3p and Gat1p (5, 13, 25). Therefore, when both Gln3p and Gat1p are available in the nucleus, the conditions for nitrogen-catabolic gene expression to occur have been met. However, these are also precisely the conditions that activate DAL80 expression. As soon as Dal80p is produced, it begins down-regulating not only nitrogen-catabolic gene expression per se, but also production of Gat1p, the activator required for this expression. In other words, there is only a short time during the transition when nitrogen-catabolic gene expression occurs at an unrestricted rate, i.e., the time needed for DAL80 to be expressed and DAL80 mRNA to be translated. Thereafter, gene expression moves toward the Dal80p-regulated level until a new steady-state level is attained. It is important to note that we are unable to find any evidence that Dal80p is subjected to the subcellular localization control seen with Gln3p and Gat1p (M. Distler and T. G. Cooper, unpublished observations). Although much remains to be learned about the details of this complex regulatory circuit, the mechanistic outlines through which it regulates a broad array of gene expression in S. cerevisiae (8; K. Cox, R. Andhare, and T. G. Cooper, unpublished observations) are becoming more clear.
ACKNOWLEDGMENTS
We thank the UT Yeast Group for suggested improvements to the manuscript and Tim Higgins for preparing the figures.
This work was supported by NIH grant GM-35642.
REFERENCES
- 1.Andre B, Talibi D, Boudekou S S, Hein C, Vissers S, Coornaert D. Two mutually exclusive regulatory systems inhibit UASGATA, a cluster of 5′GAT(A/T)A-3′ upstream from the UGA4 gene of Saccharomyces cerevisiae. Nucleic Acids Res. 1995;23:558–564. doi: 10.1093/nar/23.4.558. [DOI] [PMC free article] [PubMed] [Google Scholar]
- 2.Beck T, Hall M N. The TOR signaling pathway controls nuclear localization of nutrient-regulated transcription factors. Nature. 1999;402:689–692. doi: 10.1038/45287. [DOI] [PubMed] [Google Scholar]
- 3.Cardenas M E, Cutler N S, Lorenz M, Di Como C J, Heitman J. The TOR signaling cascade regulates gene expression in response to nutrients. Genes Dev. 1999;13:3271–3279. doi: 10.1101/gad.13.24.3271. [DOI] [PMC free article] [PubMed] [Google Scholar]
- 4.Chisholm G, Cooper T G. Isolation and characterization of mutations that produce the allantoin-degrading enzymes constitutively in Saccharomyces cerevisiae. Mol Cell Biol. 1982;2:1088–1095. doi: 10.1128/mcb.2.9.1088. [DOI] [PMC free article] [PubMed] [Google Scholar]
- 5.Coffman J A, Rai R, Cunningham T, Svetlov V, Cooper T G. Gat1p, a GATA-family protein whose production is sensitive to nitrogen catabolite repression, participates in transcription activation of nitrogen catabolic genes in S. cerevisiae. Mol Cell Biol. 1996;16:847–858. doi: 10.1128/mcb.16.3.847. [DOI] [PMC free article] [PubMed] [Google Scholar]
- 6.Coffman J A, Rai R, Loprete D M, Cunningham T, Svetlov V, Cooper T G. Cross regulation of four GATA factors that control nitrogen catabolic gene expression in Saccharomyces cerevisiae. J Bacteriol. 1997;179:3416–3429. doi: 10.1128/jb.179.11.3416-3429.1997. [DOI] [PMC free article] [PubMed] [Google Scholar]
- 7.Cooper T G. Mycota, G. 1994. Allantion degradative system—an integrated transcriptional response to multiple signals; pp. 139–169. Marzluf and R. Bambrl, eds. Springer-Verlag, Berlin/Heidelberg. [Google Scholar]
- 8.Cox K, Pinchak A B, Cooper T G. Genome-wide transcriptional analysis in S. cerevisiae by mini-array membrane hybridization. Yeast. 1999;15:703–713. doi: 10.1002/(SICI)1097-0061(19990615)15:8<703::AID-YEA413>3.0.CO;2-Z. [DOI] [PubMed] [Google Scholar]
- 9.Cox K H, Rai R, Distler M, Daugherty J R, Coffman J A, Cooper T G. Saccharomyces cerevisiae GATA sequences function as TATA elements during nitrogen catabolite repression and when Gln3p is excluded from the nucleus by overproduction of Ure2p. J Biol Chem. 2000;275:17611–17618. doi: 10.1074/jbc.M001648200. [DOI] [PMC free article] [PubMed] [Google Scholar]
- 10.Cunningham T S, Andhare R, Cooper T G. Nitrogen catabolite repression of DAL80 expression depends on the relative levels of Gat1p and Ure2p production in Saccharomyces cerevisiae. J Biol Chem. 2000;275:14408–14414. doi: 10.1074/jbc.275.19.14408. [DOI] [PMC free article] [PubMed] [Google Scholar]
- 11.Cunningham T S, Dorrington R A, Cooper T G. The UGA4 UASNTR site required for GLN3-dependent transcriptional activation also mediates DAL80-responsive regulation and DAL80 protein binding in Saccharomyces cerevisiae. J Bacteriol. 1994;176:4718–4725. doi: 10.1128/jb.176.15.4718-4725.1994. [DOI] [PMC free article] [PubMed] [Google Scholar]
- 12.Cunningham T S, Svetlov V, Rai R, Cooper T G. S. cerevisiae Gln3p binds to UASNTR elements and activates transcription of nitrogen catabolite repression-sensitive genes. J Bacteriol. 1995;178:3470–3479. [Google Scholar]
- 13.Daugherty J R, Rai R, ElBerry H M, Cooper T G. Regulatory circuit for responses of nitrogen catabolic gene expression to the GLN3 and DAL80 proteins and nitrogen catabolite repression in Saccharomyces cerevisiae. J Bacteriol. 1993;175:64–73. doi: 10.1128/jb.175.1.64-73.1993. [DOI] [PMC free article] [PubMed] [Google Scholar]
- 14.Drillen R, Aigle M, Lacroute F. Yeast mutants pleiotropically impaired in the regulation of two glutamate dehydrogenases. Biochem Biophys Res Commun. 1973;53:367–372. doi: 10.1016/0006-291x(73)90671-2. [DOI] [PubMed] [Google Scholar]
- 15.Drillien R, Lacroute F. Ureidosuccinic acid uptake in yeast and some aspects of its regulation. J Bacteriol. 1972;109:203–208. doi: 10.1128/jb.109.1.203-208.1972. [DOI] [PMC free article] [PubMed] [Google Scholar]
- 16.Edskes H K, Hanover J A, Wickner R B. Mks1p is a regulator of nitrogen catabolism upstream of Ure2p in Saccharomyces cerevisiae. Genetics. 1999;153:585–594. doi: 10.1093/genetics/153.2.585. [DOI] [PMC free article] [PubMed] [Google Scholar]
- 17.Edskes H K, Wickner R B. A protein required for prion generation: [URE3] induction requires the Ras-regulated MKs1 protein. Proc Natl Acad Sci USA. 2000;97:6625–6629. doi: 10.1073/pnas.120168697. [DOI] [PMC free article] [PubMed] [Google Scholar]
- 18.Furst P, Hu S, Hackett R, Hamer D. Copper activates metallothionein gene transcription by altering the conformation of a specific DNA binding protein. Cell. 1988;18:705–717. doi: 10.1016/0092-8674(88)90229-2. [DOI] [PubMed] [Google Scholar]
- 19.Hardwick J S, Kuruvilla F G, Tong J K, Shamji A F, Schreiber S. Rapamycin-modulated transcription defines the subset of nutrient-sensitive signaling pathways directly controlled by the Tor proteins. Proc Natl Acad Sci USA. 1999;96:14866–14870. doi: 10.1073/pnas.96.26.14866. [DOI] [PMC free article] [PubMed] [Google Scholar]
- 20.Klein C, Struhl K. Increased recruitment of TATA-binding protein to the promoter by transcriptional activation domains in vivo. Science. 1994;266:280–282. doi: 10.1126/science.7939664. [DOI] [PubMed] [Google Scholar]
- 21.Minehart P L, Magasanik B. Sequence and expression of GLN3, a positive nitrogen regulatory gene of Saccharomyces cerevisiae encoding a protein with a putative zinc finger DNA-binding domain. Mol Cell Biol. 1991;11:6216–6228. doi: 10.1128/mcb.11.12.6216. [DOI] [PMC free article] [PubMed] [Google Scholar]
- 22.Rai R, Daugherty J R, Cunningham T S, Cooper T G. Overlapping positive and negative GATA factor binding sites mediate inducible DAL7 gene expression in Saccharomyces cerevisiae. J Biol Chem. 1999;274:28026–28034. doi: 10.1074/jbc.274.39.28026. [DOI] [PubMed] [Google Scholar]
- 23.Rowen D W, Esiobu N, Magasanik B. Role of GATA factor Nil2p in nitrogen regulation of gene expression in Saccharomyces cerevisiae. J Bacteriol. 1997;179:3761–3766. doi: 10.1128/jb.179.11.3761-3766.1997. [DOI] [PMC free article] [PubMed] [Google Scholar]
- 24.Soussi-Boudekou S, Vissers S, Urrestarazu A, Jauniaux J-C, Andre B. Gzfp3, a fourth GATA factor involved in nitrogen-regulated transcription in Saccharomyces cerevisiae. Mol Microbiol. 1997;23:1157–1168. doi: 10.1046/j.1365-2958.1997.3021665.x. [DOI] [PubMed] [Google Scholar]
- 25.Stanbrough M, Rowen D W, Magasanik B. Role of the GATA factors Gln3p and Nil1p of Saccharomyces cerevisiae in the expression of nitrogen-regulated genes. Proc Natl Acad Sci USA. 1995;92:9450–9454. doi: 10.1073/pnas.92.21.9450. [DOI] [PMC free article] [PubMed] [Google Scholar]
- 26.ter Schure E G, van Riel N A, Verrips C T. The role of ammonia metabolism in nitrogen catabolite repression in Saccharomyces cerevisiae. FEMS Microbiol Rev. 2000;24:67–83. doi: 10.1111/j.1574-6976.2000.tb00533.x. [DOI] [PubMed] [Google Scholar]
- 27.Wickner R B. [URE3] as an altered Ure2 protein: evidence for a prion analog in Saccharomyces cerevisiae. Science. 1994;264:566–569. doi: 10.1126/science.7909170. [DOI] [PubMed] [Google Scholar]


