Abstract
The biological synthesis of zinc oxide nanoparticles (ZnO NPs) from plant extracts has emerged as a novel method for producing NPs with great scalability and biocompatibility. The present study is focused on bio-fabricated zinc oxide nanomaterial characterization and investigation of its photocatalytic and antifungal activities. ZnO NPs were biosynthesized using the leaf extract of Polyalthia longifolia without using harmful reducing or capping chemicals, which demonstrated fungicidal activity against Fusarium oxysporum f. sp. ciceris. The results showed that the inhibition of the radial growth of F. oxysporum f. sp. ciceris was enhanced as the concentration increased from 100 ppm to 300 ppm. The effectiveness of the photocatalytic activity of biosynthesized ZnO NPs was analyzed using MB dye degradation in aqueous medium under ultraviolet (UV) radiation and natural sunlight. After four consecutive cycles, the photocatalytic degradation of MB was stable and was 84%, 83%, 83%, and 83%, respectively, during natural sunlight exposure. Under the UV sources, degradation reached 92%, 89%, 88%, and 87%, respectively, in 90 minutes. This study suggests that the ZnO NPs obtained from plant extract have outstanding photocatalytic and antifungal activities against F. oxysporum f. sp. ciceris and have the potential for application as a natural pest control agent to reduce pathogenesis.
The biological synthesis of zinc oxide nanoparticles (ZnO NPs) from plant extracts has emerged as a novel method for producing NPs with great scalability and biocompatibility.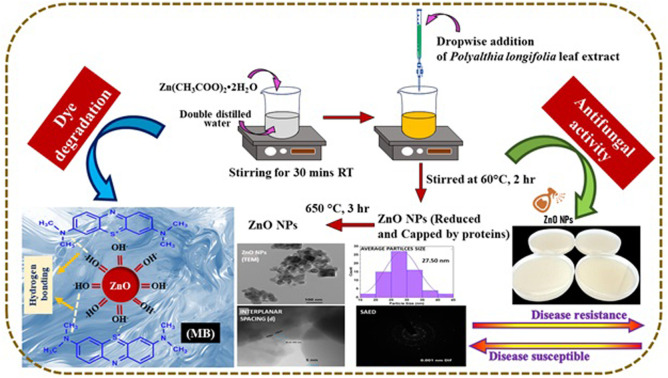
Introduction
Addressing the growing nutritional demands has become a major challenge given the ever-expanding global population but increasingly limited natural resources. An annual reduction of nearly 20–40% in crops is because of factors such as pest invasions, pathogen attacks, insufficient nutrients, and degraded soil quality.1,2 Phytopathogenic fungal diseases are responsible for 70–80% of all microbial infections in crop production.3,4 Traditional methods such as disease-resistant plant varieties and synthetic fungicides can partially mitigate fungal pathogens. However, chemical fungicide usage often leads to soil and plant tissue contamination, has limited effectiveness, and is costly.5 To address these issues, there is a need for innovative technologies that are both cost-effective and environmentally friendly. Recently, nanotechnology has sparked a revolution in the agricultural sector, resulting in significant advancements in current farming practices.6 The development of new concepts and agricultural products has led to the potential to manage problems such as food insecurity and environmental degradation1 and holds the promise of reshaping resilient agricultural systems to ensure food security.2 Therefore, employing nano-tools for disease management in plants can provide valuable protection against pathogens7 and enable the precise and targeted delivery of active ingredients to the desired sites.8 Nanoparticles and related formulations such as nano-fungicides9 and nano-fertilizers have been developed.10 The use of bio-synthesized silver nanoparticles to control fungal phytopathogen shows promise in eliminating or reducing their impact.11
Chitosan nanoparticles have demonstrated both in vitro and in vivo effects in preventing the growth of various fungi including Aspergillus niger12 and A. parasiticus13 as well as Alternaria alternata, Botrytis cinerea, Colletotrichum gloeosporioides, and Rhizopus stolonifer.14,15 Copper nanoparticles have also been found effective against multiple species of phytopathogenic fungi, such as Phoma destructiva, Curvularia lunata, A. alternata, F. oxysporum, Penicillium italicum, P. digitatum, and Rhizoctonia solani.16,17 Various researchers have achieved the green synthesis of zinc oxide nanoparticles (ZnO NPs) using different plant species viz., Cynara scolymus, Justicia spicigera, Jujube fruit, Azadirachta indica, Boswellia mukul, and their photocatalytic degradation.18–23 Due to its abundant polyphenolic components, Polyalthia longifolia extract possesses various pharmacological qualities, including anti-inflammatory, antibacterial, antioxidant, hepatoprotective, and anticancer properties.24 Flavonoids and phenolic chemicals, abundant in P. longifolia extract, may aid in naturally capping, reducing, and stabilizing the fabricated nanoparticles.25–27 Therefore, using P. longifolia extract to synthesize ZnO NPs makes this study innovative.
Conventional chemical pesticides for nematode treatment are expensive, contaminate the environment, and cause pesticide resistance in nematode populations. These chemical nematicides are also harmful to non-target creatures and can remain in the environment. In comparison, green biosynthesized ZnO NPs provide different advantages. Compared to other plant extracts, the biosynthesis of ZnO NPs utilizing P. longifolia leaf extract is a viable option due to its cheap cost, security, and straightforward production methods. Phytochemicals that have been extracted function as stabilizing and reducing agents when ZnO NPs are being formed. Therefore, we designed the research experiment to create ZnO NPs for photocatalytic and antifungal activity utilizing Polyalthia longifolia leaf extract without using harmful reducing or capping chemicals. Additionally, we used XRD, FTIR, SEM-EDX, TEM-SAED, and UV-vis NIR spectrophotometers to characterize the synthesized ZnO NPs.
Materials and methods
Materials
No additional purification was performed on any analytical grade compounds before use in this experiment. Zinc acetate dihydrate [Zn (OAc)2·2H2O], >98.6%, was purchased from Fisher Scientific. Fresh (disease-free) and full-grown leaves of P. longifolia and double distilled water (DDW) were used for leaf extract preparation.
Synthesis of ZnO NPs
The ZnO NPs were prepared by the biological synthesis method using P. longifolia leaf extract as follows:
Preparation of the plant extract
About 30 g of P. longifolia leaf extract was washed, cut into small pieces, and introduced into a conical flask, followed by the addition of 200 mL of DDW, then the mixture was autoclaved at 121 °C and 15 pounds per square inch pressure for 30 minutes. The mixture was then filtered and cooled, and the resultant plant extract was collected.
Calculation of salt weight
The quantity of zinc acetate ((CH3COO)2Zn·2H2O) required was determined using the equivalent weight formula: where W is the molecular weight of the material in grams, E is the equivalent of material, M is the molecular weight of the material, and V is the volume of the solution.
Reaction
The obtained plant extract was mixed with 0.1 M zinc acetate dehydrate and subjected to vigorous stirring at 60 °C for 2 hours.
Precipitate isolation and drying
Following the reaction, the precipitate was isolated, and then dried using a hot air oven. The dried precipitate was ground using an agate mortar.
Calcination process
The collected nano-powder was subjected to a final calcination step at 650 °C for 3 hours in a muffle furnace to remove the sample's moisture content and improve the crystallinity. This process yielded the desired ZnO NPs.
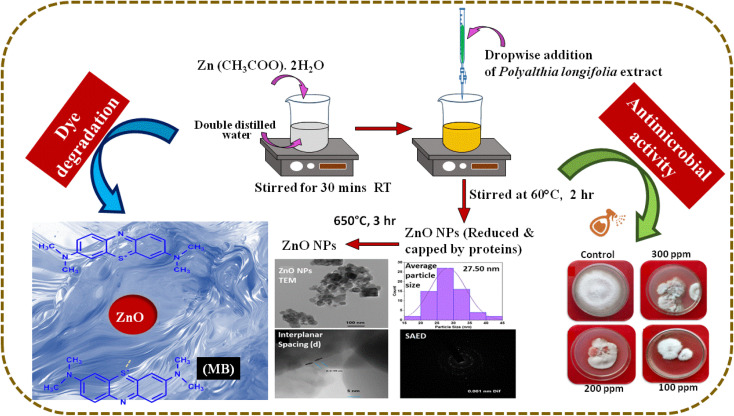
By employing this method, ZnO NPs were successfully synthesized by utilizing the biogenic properties of the P. longifolia leaf extract and were characterized by various processes, as detailed in subsequent sections. This synthesis approach presents a novel and eco-friendly strategy for fabricating ZnO NPs, showcasing the potential for sustainable nanomaterial synthesis. The schematic diagram for the synthesis of ZnO NPs is shown in Fig. 1.
Fig. 1. Schematic diagram of the synthesis of ZnO NPs using P. longifolia leaf extract.
Characterization techniques
XRD patterns were collected using a Rigaku Miniflex II (make: Rigaku, Japan; model: Miniflex II desktop) X-ray diffractometer equipped with Cu-Kα radiation, operating at 30 kV and 15 mA, and emitting a wavelength of 1.541838 Å. Optics: ZnO NPs at the angle 2θ were used in a monochromator with an automatic divergence slit and beta filtering with graphite, covering a range from 20.0°–80.0° at intervals of 0.04°. SEM micrographs were obtained via SEM-EDX (JSM-6510 LV, Japan; with energy-dispersive X-ray spectrometer) to examine the surface morphology and for element identification. To determine the morphology and structural properties (size, shape and crystal structure) of ZnO NPs, the TEM images and selected area electron diffraction (SAED) pattern were obtained using the JEM-2100 model (JEOL, Japan). Ethanol was used to suspend powder samples of ZnO before they precipitated on the grid. Prior to scanning, the sample was dried. The particle size distribution of the prepared ZnO NPs was estimated using ImageJ Launcher, Tokyo, Japan, Broken Symmetry Software, version (1.4.3.6.7). To analyze the functional bio-molecules in ZnO NPs, solid-state FT-IR spectroscopy (model: Spectrum 2, make-PerkinElmer) was performed within the 4000–400 cm−1 range. An optically transparent background medium, KBr (200 mg), was combined and compressed under high pressure to create each sample. The ZnO NPs' UV-visible absorption spectra were captured in the 200–800 nm wavelength range using a Carry Series UV-visible NIR (model-Carry 5000, make-Agilent Technologies) spectrophotometer. The fluorescence data from 250 to 600 nm were recorded using a fluorescence spectrometer (make: PerkinElmer, model: LS55). The Raman spectra were collected using a Raman microscope (make-Renishaw, model-RM-1000) with a 50× objective and a 532 nm He–Ne laser excitation source.
Isolation, purification, and identification of F. oxysporum f. sp. ciceris
The infected root samples were collected from the chickpea and green gram crops grown in farmers' fields in and around Aligarh, India. Collected root samples were washed with DDW. Infected root samples were cut into small pieces of 3 to 5 mm size with the help of a sharp blade from healthy and diseased portions inside a laminar airflow cabinet. For surface sterilization, small pieces of both diseased and healthy portions were moved through 1% sodium hypochlorite solution for one minute and washed three times with changed DDW. Infected root samples were then kept on a sterile filter paper, and 2–3 pieces were transferred onto potato dextrose agar (PDA) plates inside a laminar airflow cabinet and then incubated in a biological oxygen demand (BOD) incubator at 28 ± 2 °C. After the appearance of mycelial growth, the fungus was then transferred by taking the hyphal tip into a fresh media-poured petri plate and culture tubes. The isolated fungus was purified using the hyphal tip method and single spore isolation technique.28 The isolated pathogen was identified based on morphological characteristics by placing a tiny tip from the pure culture on a glass slide and examining it under a microscope.
In vitro assessment of ZnO NPs against pathogenic fungus and growth inhibition
The antifungal activity of ZnO NPs at three different concentrations (100, 200, 300 ppm) on the colonization of a pathogenic fungus, namely F. oxysporum f. sp. ciceris, was tested using the poison food technique29 under in vitro conditions. The concentrations of ZnO NPs were also prepared in DDW to get the desired ZnO NPs after mixing the DMSO (dimethyl sulfoxide) solution in the PDA media in equal amounts before pouring it into sterilized Petri plates. Approximately 20–25 mL of the medium containing the test ZnO NPs solution was poured into each sterilized Petri plate under a laminar airflow chamber. Each plate was then inoculated with the seven-day-old cultures of F. oxysporum f. sp. ciceris by transferring 5 mm mycelial discs cut with the help of a cork borer. The control was maintained by adding DDW to the medium. Each treatment was replicated thrice, and the inoculated plates were incubated at 28 ± 2 °C in a BOD incubator. The colony diameter of all the cultured plates was recorded seven days after inoculation when the control plates acquired full growth of the mycelium of the pathogen. The percentage of mycelial growth inhibition of the pathogen was calculated according to the following formula:30 where C = the radial growth of fungus in the control, and T = the radial growth of fungus in ZnO NPs.
Results and discussion
X-ray diffraction (XRD)
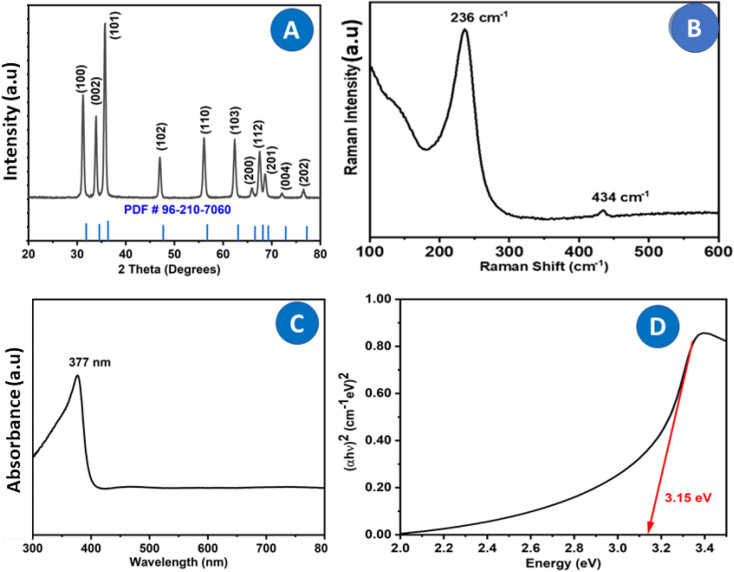
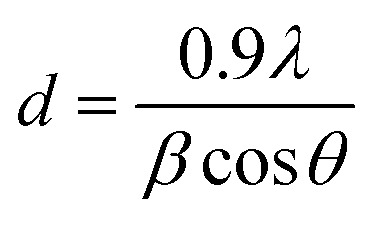
Fig. 2A displays the XRD pattern of ZnO NPs. A well-defined, distinct peak was observed for the NPs that were bio-fabricated using P. longifolia leaves and consisted of particles in the nanoscale range, as confirmed by TEM. Using the Origin [version 2019b (9.65)] software for XRD data, the pattern positions of the peaks, intensity, full width at half maximum (FWHM), and width were determined.31 The XRD diffraction peaks situated at 31.847°, 34.550°, 36.540°, 47.694°, 56.745°, 63.087°, 66.558°, 68.161°, 69.284°, 72.870° and 77.205° corresponding to the (100), (002), (101), (102), (110), (103), (200), (112), (201), (004), and (202) planes have been keenly indexed with lattice constants a = b = 3.2420 Å and c = 5.1880 Å (JPCDS card (PDF) number: 96-210-7060),32 which confirmed the purity of the biosynthesized ZnO photocatalysts, with no impurities detected in the XRD peaks except for those of pure ZnO NPs. The fabricated ZnO NP's crystallite size (d) was calculated using the Debye–Scherrer formula:33
 |
1 |
where 0.9 is Scherrer's constant.λ is the incident wavelength (Cu-Kα) of X-rays.β and θ represent the FWHM of the diffraction peak located in the plane, and the Bragg diffraction angle concerning (101) lattice planes, respectively.
Fig. 2. ZnO NPs synthesized by P. longifolia leaf extract were characterized by (A) XRD and compared with the standard PDF#96-210-7060, having maximum intensity along the (101) plane. (B) Raman spectroscopy revealed peaks at 236 and 434 cm−1. (C) The UV-visible spectrum showed the absorption band at 377 nm. (D) The direct band gap calculated using a tau plot was found to be 3.15 eV from UV-visible data.
Using Scherrer's formula in eqn (1), it was calculated that the crystallite size of ZnO NPs was 22.5 nm. This value is based on the FWHM of the prominent peak associated with the (101) lattice plane at 36.540°. However, using the Debye–Scherrer equation, the average crystallite size corresponding to all peaks was 24.50 nm. The calculated average crystallite size is consistent with the TEM particle size of 27.50 nm.
Raman spectroscopy
ZnO NPs' Raman spectroscopy allows the detection of defects such as oxygen vacancies, zinc excess or surface contaminants, and the high crystal quality of the wurtzite structure. The Raman-active modes of the ZnO wurtzite crystal are responsible for the Raman characteristics observed in ZnO powder.34 Wurtzite-type ZnO, with two formula units per primitive cell, is a member of the space group P63mc. Güell et al.35 reported Raman scattering results that showed a narrow (∼7 cm−1) full width at half maximum of the E2 high optical phonon mode, demonstrating the good crystal quality of the ZnO nanowires. The irreducible representation can be used to categorize the zone centre optical phonons:Γopt = A1 + E1 + 2E2 + 2B1,where A1 and E1 are polar modes that are both infrared and Raman active, B1 modes are mute, and E2 low and E2 high are non-polar and exclusively Raman active at the same time.
Fig. 2B shows the Raman spectra of ZnO NPs stimulated by laser lines at 532 nm. The oxygen vibration is primarily attributed to the (high) Raman mode detected at 434 cm−1.36 Second-order Raman scattering is typically the source of the E1 (LO) mode, which is absent. The detected spectroscopic peaks indicated in Fig. 2B can be attributed to a wurtzite ZnO structure based on literature values. The basic phonon modes of hexagonal wurtzite ZnO NPs have been obtained at 236 cm−1 and 434 cm−1, which correspond to the A1 (TO) and E2H modes, respectively.37
UV visible NIR spectroscopy
The characteristic absorption peaks of ZnO NPs were observed in Fig. 2C at 377 nm. The band gap calculated using the tau plot of UV-visible data was 3.15 eV, which is slightly lower than the standard reported value of 3.34 eV (Fig. 2D). The decrease in band gap is due to the biological capping of the P. longifolia leaf extract in the ZnO nanostructure.38 It has been observed that nanomaterial synthesized by different plant extracts shows a slight change in the band gap energies due to the presence of the phytochemicals in the plant in different concentrations.39 The change in the band gap was seen for the semiconductor nanomaterials; a decrease in the band gap was also observed due to the doping of the nanomaterial.40 In recent research, it was observed that the presence of an aldehyde group in the plant extract is responsible for the reduction.41
Fourier transform infrared (FTIR) spectroscopy
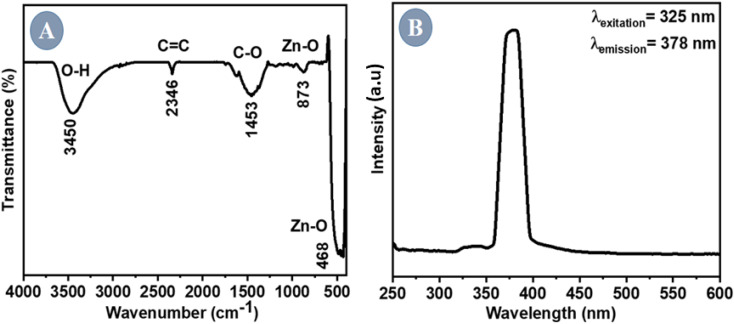
The functional bonds of the synthesized ZnO NPs were determined using FTIR. The spectrum was obtained at room temperature across a 4000–400 cm−1 range (Fig. 3A). The characteristic ZnO bands at 468 cm−1 and 873 cm−1 indicate the E2 mode of a typical hexagonal wurtzite structure.41 The absorption band at 1453 cm−1 was attributed to the stretching vibration of symmetric and asymmetric carboxyl groups, respectively.42 The relatively broad band at 3450 cm−1 corresponds to –OH stretching due to variable hydrogen bond strength. Table 1 depicts all the functional bonds present in ZnO NPs along with the wave number and confirms the formation of ZnO NPs using the extract of P. longifolia leaves.
Fig. 3. (A) FTIR spectrum of ZnO NPs showing the presence of the Zn–O bond. (B) Excitation at 325 nm yielded an emission peak at 378 nm in the fluorescence spectrum.
FTIR bands and functional groups of ZnO NPs.
| Functional group | Zn–O | Zn–O | C–O | C C | -OH |
|---|---|---|---|---|---|
| Wave number (cm−1) | 468 | 873 | 1453 | 2346 | 3450 |
Photoluminescence spectroscopy (PL)
The impacts of morphology on electrical, optical, and photochemical properties of semiconductors such as ZnO can be effectively studied using (PL) spectra. A prominent and distinct emission peak was observed at 378 nm for the ZnO NPs manufactured using sol–gel-assisted green synthesis (Fig. 3B). The excitation of ZnO NPs at 325 nm yielded an emission wavelength of 378 nm. The liberated excitons recombined through an exciton–exciton collision mechanism to produce this UV emission, also known as UV band edge emission.43
Scanning electron microscopy (SEM)
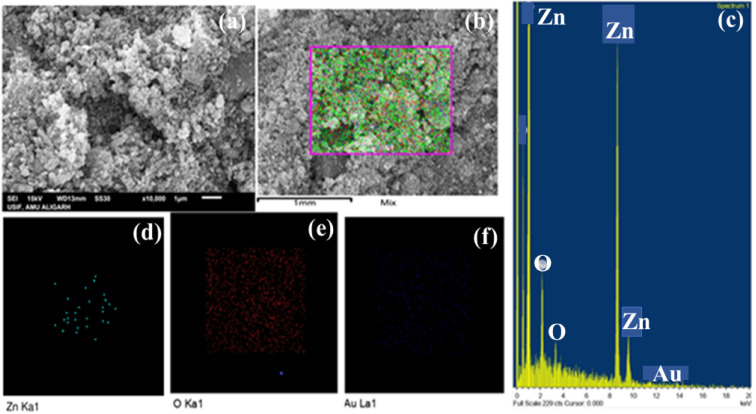
SEM was used to investigate the ZnO NPs' surface morphology, and EDAX was used for elemental composition. The flat surface of ZnO NPs is depicted in Fig. 4a. Results from XRD experiments support the prediction of polycrystalline ZnO NPs made by elongated grains and a specific granular structure (Fig. 4b). Although there is no porosity between the NPs, water evaporation creates a dense structure. Fig. 4c shows the mapped elements like Zn, O and Au. The EDAX attachment (Fig. 4d and e) confirmed the formation of ZnO NPs. Au was present (Fig. 4f) due to the gold coating during sample preparation for SEM. The gold coating was performed to cause the semiconductor material to be conducting for the easy passage of electron beams, which increases the clarity of the SEM images.
Fig. 4. Scanning electron microscopy (SEM): (a) microphotograph, (b) electron beam focused on a particular area for elemental confirmation; (c) the mapped elements were Zn and O; Au was present due to coating. (d) Confirmation of Zn, (e) confirmation of O, and (f) Au was present due to coating during SEM.
Transmission electron microscopy (TEM)
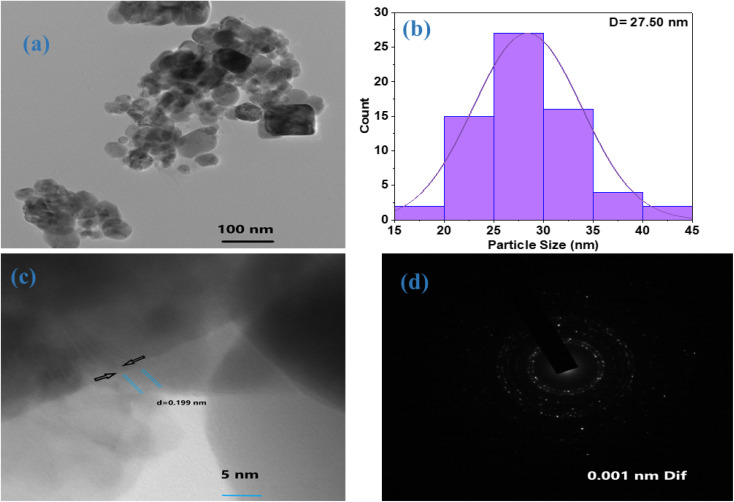
The TEM technique was used for a far greater resolution for examining ZnO NPs using an electron beam. The size, shape, size distribution, and morphology of nanoparticles were directly measured. Fig. 5a shows a TEM picture of ZnO NPs. The TEM study was conducted to comprehend the crystalline properties and size of the ZnO NPs. The TEM image validates the SEM findings by confirming the particles' hexagonal shape and minimal thickness variation. The average particle size calculated by the Image J software was 27.50 nm (Fig. 5b) with an average d spacing of 0.199 nm as shown in Fig. 5c. The polycrystalline nature of the ZnO NPs was confirmed by the SAED pattern of TEM exhibiting concentric rings in Fig. 5d. Thus, our findings confirm the formation of bio-assisted ZnO NPs in the nanoscale range with a polycrystalline nature and the XRD findings are consistent with TEM results.
Fig. 5. (a) TEM image of the ZnO NPs showing the formation of nanoscale particles. (b) The particle distribution histogram depicts the average particle size of 27.50 nm. (c) The interplanar spacing (d) between the two planes was 0.199 nm. (d) The SAED pattern of TEM shows the formation of polycrystalline ZnO NPs.
Photocatalytic study of ZnO NPs under ultraviolet and solar light
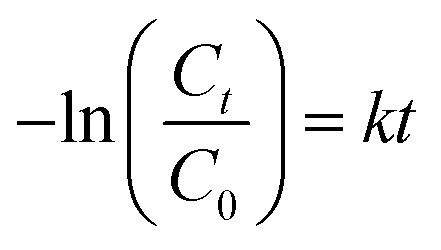
The degradation of MB was examined using the ZnO NPs by subjecting the MB solution to solar and UV irradiation [UV A lamp (2 Nos), intensity of 6 W, Philips, Amsterdam, Germany]. The reaction kinetics were studied to understand the order of the photocatalytic degradation reactions, and it was determined that the dye degradation followed first-order kinetics, given by the following eqn (2):
| Ct = C0 e−kt | 2 |
C0 is the starting dye concentration in ppm,Ct is a concentration at time t in minutes.k is the rate constant in min−1t is time, as shown in eqn (3)
 |
3 |
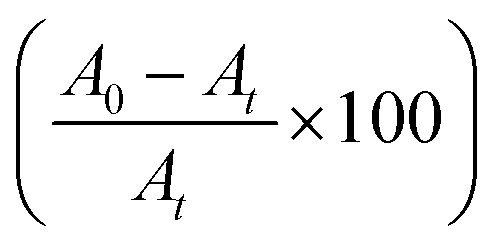
The rate constant calculated using eqn (2) and (3) revealed that the degradation rate of MB was only minimally different for UV light compared to solar light irradiation. The photocatalytic degradation efficiency of the organic dyes was calculated using the following formula (4):
 |
4 |
where A0 is the absorbance of the dye solution before photo-irradiation, and At is the absorbance of solutions in suspension after photo-irradiation for a specific time t (0 min to 90 min).
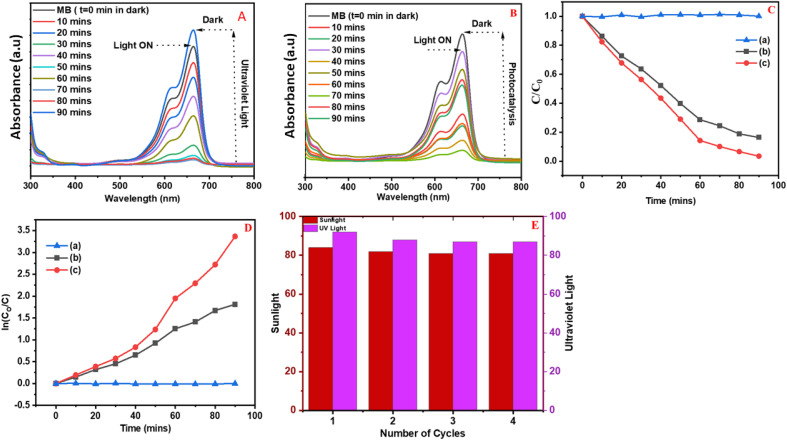
The photocatalytic performance of MB in the absence of photocatalyst (ZnO NPs) under natural sunlight and a UV light source remained unchanged as shown in Fig. 6C(a) and D(a). On comparing MB solutions with two different light sources, it was observed that the solution exposed to UV light showed a greater decrease in absorbance as compared to the average solar radiation. The MB absorbance remained largely unchanged, indicating weak degradation activity when no photocatalyst was present, as observed during photodegradation under both UV and solar irradiation in blank conditions. Githala44 found that the phyto-fabrication of silver nanoparticles showed the breaking down of organic dyes such as MB and Congo red, effectively inhibiting the fungal growth of A. alternata.
Fig. 6. (A and B) shows a typical measurement of the absorbance of an organic dye following irradiation with sunlight and a UV lamp with visible and UV wavelength vs. reaction time. According to (A and B), ZnO NPs under UV lamps are more effective than sunlight in decomposing the MB organic dye. A conjugated system of hetero-poly aromatic linkage containing sulfur and nitrogen as hetero atoms resulted in a central absorbance peak of methylene blue at 664 nm (A and B). However, because of n to p* (the presence of a lone pair of electrons on a nitrogen atom) and p to p* (conjugated system) transitions, the MB solution exhibited dual absorbance at 664 and 615 nm. After 10 minutes of exposure to UV light and the ZnO2 catalyst (E), the absorbance of the MB solution reduced dramatically, showing that ZnO2 has a strong degrading capability. After 90 minutes of ZnO2 irradiation, MB was degraded; however, after 90 minutes of ZnO2 irradiation, the UV sources degraded up to 92, 89, 88, and 87% in 90 minutes for the 1st, 2nd, 3rd, and 4th cycles, respectively. Similarly, for natural sunlight, the photodegradation of MB (E) was stable and degraded up to 84, 83, 83, and 83% in the 1st, 2nd, 3rd, and 4th cycles, respectively. C/C0vs. time plots are shown in (C), which shed light on the ZnO NPs' photocatalytic performance in the presence of UV and solar radiation and show the degradation rate over time. Regarding the degradation of MB dyes, UV light works better than solar radiation. MB photocatalytic efficiency under UV light is depicted in C(c) and D(c), which show the degradation kinetics of ZnO NPs under UV light; the plot of C/C0 illustrates the quicker decay of MB under UV light. The photocatalytic activity of MB in the presence of solar radiation is depicted in D(b), which shows the MB degradation kinetics. In contrast, C(b) shows the plot of the C/C0 MB degradation curve under sunlight at a slower rate than UV radiation.
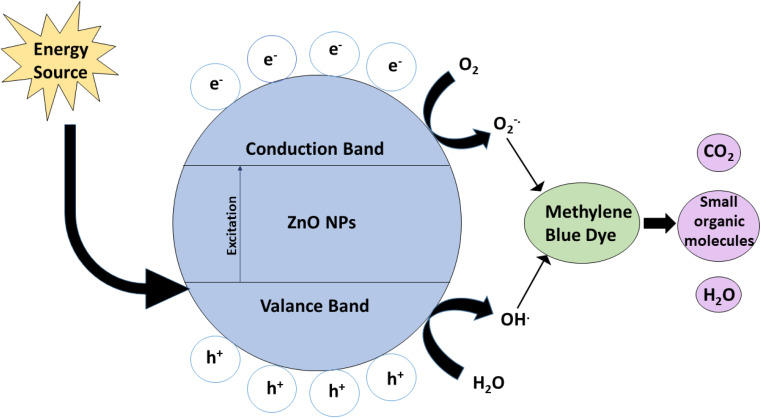
Fig. 7 explains the degradation mechanism of methylene blue using ZnO NPs as photocatalysts in the presence of natural sunlight and UV sources. When light (UV/visible) is exposed on a photocatalyst's surface, electrons (e−) are excited from the valence band to the conduction band. The holes (h+) could be made in the valence band. Photogenerated holes can react with water molecules (H2O) to form hydroxyl radicals (OH). Superoxide radicals are formed when electrons in a conduction band mix with ambient oxygen (or provided oxygen). Thus, photogenerated holes, hydroxyl radicals, and superoxide radicals play essential roles in MB degradation. ZnO has good photocatalytic activity when exposed to UV light but because of its large band gap, it has comparatively poor photocatalytic activity when exposed to visible light.45
Fig. 7. The mechanism of electron–hole pair separation in ZnO NPs (photocatalyst) during MB degradation under UV and solar light irradiation.
Regarding the degradation mechanism, it was assumed that a slow electron–hole pair recombination rate is the prime requirement of semiconductor nanoparticles for successful photocatalysis. Nano ZnO2, when irradiated by UV and sunlight, initiates a photocatalytic process via the electron and hole mechanism due to electronic excitation within ZnO2. The energy higher than the band gap of ZnO2, i.e., 3.15 eV, can directly excite nanoparticles. Similarly, photogenerated electrons will reduce the dye or may react with absorbed O2 on the surface of ZnO NPs to form the superoxide radical anion O2−. When irradiated with sunlight or UV light, the catalyst is activated, generating free electrons and holes on the catalyst surface and hydroxyl radicals. These generated radicals oxidize and degrade/decompose organic pollutants. Oxygen is present in the environment, and water reacts with the surface. It generates free electrons from ZnO2 NPs, forming the O2− anion through an initial combination of unstable oxygen free radicals (superoxide), further oxidizing organic compounds. Many of these reactions occur on the surface of zinc dioxide, leading to the breakdown of organic dyes and making it an efficient photocatalyst. Wang46 reported that a maximum of 99% photocatalytic degradation of MB was achieved with a metal oxide catalyst loading of 1.0 g L−1 and an initial MB concentration of 10 mg L−1, under conditions of neutral pH. Aroob47 found that CuO NPs exhibited high potential for the degradation of water-soluble industrial dyes, and the degradation rates for methyl green and methyl orange were 65.23% and 65.07%, respectively.
The photocatalytic activity of ZnO NPs was evaluated for degrading MB dye under solar light and UV-light sources. Moreover, oxygen vacancies enhanced charge carrier mobility within the particles, which helped photo-induced electron–hole pairs to migrate and separate more effectively.48 Because of this, when ZnO NPs were included, a remarkable 87.00% and 83.00% of MB dye degradation efficiency was reached in 90 minutes by the ZnO NPs synthesized by P. longifolia under UV and solar irradiation. Compared to other morphologies,49 spherical nanoparticles typically have a larger surface area.50 ZnO NPs fabricated using P. longifolia leaf extract and MB dye molecules could interact more often in the current study due to the increased surface area, which offers more active sites for photocatalytic processes. Because a more extensive response surface was available, the degradation efficiency increased. Additionally, the symmetrical geometry of the spherical ZnO NPs contributed to their high dispersibility in solution.51 This homogeneous dispersion facilitates the consistent and effective photocatalytic breakdown of MB dye throughout the solution,52 which guarantees that every particle is equally exposed to the reactive species.53 The crystalline structures of the spherical ZnO NPs are frequently distinct. When photo-induced electron–hole pairs are efficiently separated and migrate during the photocatalytic degradation of MB dye, this can increase charge carrier mobility inside the particles. The negatively charged ZnO NP surface could easily absorb cationic MB dye molecules through electrostatic attraction. The oxidative radicals are generated when exposure to UV and solar irradiation damage the MB dye molecules adsorbed on the ZnO NPs surface in a unidirectional manner.54
Antifungal activity of ZnO NPs
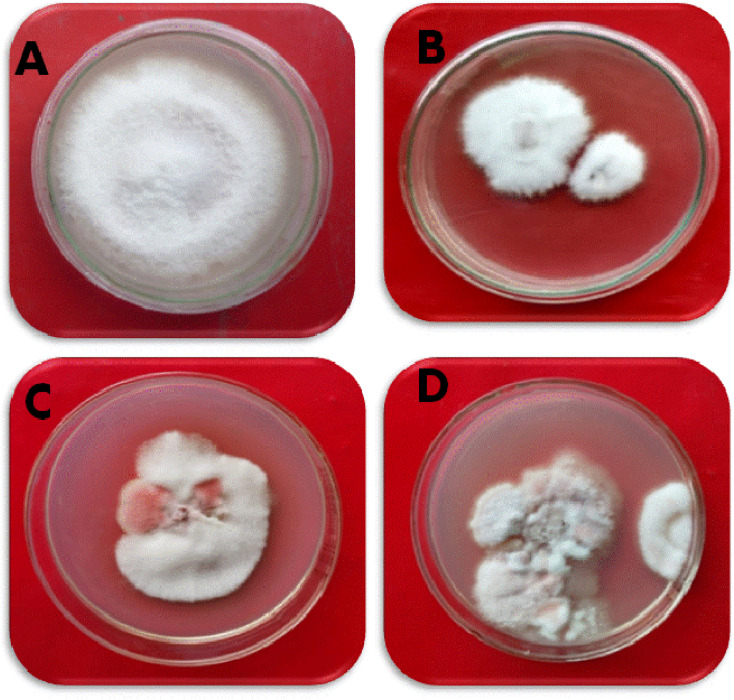
The effect of ZnO NPs on the colonization of pathogenic fungus, namely F. oxysporum f. sp. ciceris, was tested using poison food techniques under in vitro conditions. The potential inhibitory effects of ZnO NPs at three different concentrations (100, 200, and 300 ppm) were evaluated to determine their effectiveness in inhibiting the mycelial growth of a pathogenic fungus to varying extents (Fig. 8 and Table 2). The data were recorded seven days after inoculation. A significant decline in the radial growth of the pathogenic fungus was recorded with an increase in the concentration of ZnO NPs seven days after inoculation (P ≤ 0.05). The ZnO NPs were found to be most effective at the concentration of 300 ppm, inhibiting the radial growth of F. oxysporum f. sp. ciceris by 68% as compared to the control. The next efficacy was found at 200 ppm of ZnO NPs, which inhibited 53% radial growth. After seven days of inoculation, treatment with 100 ppm of ZnO NPs resulted in 35% suppression of the radial growth of F. oxysporum f. sp. ciceris over cintrol (P ≤ 0.05).
Fig. 8. The effect of different concentrations of ZnO NPs against F. oxysporium f.sp. ciceris. (A) Control, (B) 100 ppm, (C) 200 ppm, (D) 300 ppm.
The efficacy of different concentrations of ZnO NPs on the colonization of F. Oxysporum f. sp. cicerisa.
| Treatment | Concentrations (ppm) | Radial growth inhibition (%) of F. oxysporum f. sp. ciceris after 7 days |
|---|---|---|
| ZnO NPs | 300 | 68.4a |
| 200 | 52.8b | |
| 100 | 35.3c | |
| Control | 0d | |
| LSD | Df | 2 |
| Sum of squares | 1645.21 | |
| Mean squares | 822.61 | |
| F-calculated | 58.66 | |
| Significance | 0.00012 |
Each value is an average of five replicates. Values followed by the same letter within a column are not significantly different according to Duncan's multiple-range test (p ≤ 0.05).
In the present study, the biosynthesized ZnO NPs showed fungicidal activity and could control pathogenic soil fungi. However, the results revealed that inhibition in the radial growth of F. oxysporum sp. ciceris increased as we increased the concentration from 100 ppm to 300 ppm. In this way, we can say that inhibition in radial growth was directionally proportional to the concentration of ZnO NPs. Similar effects have been reported for copper nanoparticles used against Aspergillus niger, Aspergillus oryzae, and F. oxysporum.55 This demonstrates the direct toxicity mechanism of copper nanoparticles, which involves permeation through the cell wall and disturbances in the enzymes involved in controlling free radicals, causing an imbalance in all the metabolic pathways.56 Similar results have been observed for silver and copper NPs, which caused detrimental effects on the fungal hyphae of some fungi.57 According to Feng's research,58 silver ions can combine with DNA bases in pathogenic fungi to form cross-links and then replace the hydrogen bonds adjacent to nitrogen in purines and pyrimidines. This will change the structure of fungal DNA and eliminate the ability to replicate to achieve the effect of killing fungi.
Conclusions
Our study has focused on the green fabrication of ZnO NPs using the leaf extract of P. longifolia and assessed its antifungal effectiveness against F. oxysporum f. sp. ciceris. Various applied concentrations of ZnO NPs were employed and the results suggest that ZnO NPs showed toxicity to F. oxysporum f. sp. ciceris. The biosynthesized ZnO NPs were characterized by X-ray diffraction, photoluminescence, FTIR, SEM, UV-visible diffuse reflectance spectroscopy, and TEM to check the purity and nanoscale conformation of zinc oxide. TEM confirmed the formation of particles at the nanoscale with an average particle size of 27.50 nm. FTIR confirmed the formation of Zn–O bonds, while UV visible and photoluminescence confirmed the absorption and emission spectra of ZnO NPs with a band gap of 3.15 eV. Raman analysis confirmed the purity peaks of ZnO NPs. XRD and SEM confirmed the crystal structure and morphological studies.
ZnO NPs showed antifungal potential against F. oxysporum f. sp. ciceris used as substitutes for high-risk chemical fungicides without generating phytotoxicity. Based on photocatalysis principles, studies demonstrated the potential of ZnO NPs as a dye-removal agent that helps regulate water pollution. Using nanoparticles as a bio-control against fungal phytopathogens proved to be a promising method in disease management. Plant components such as carbohydrates, lipids, enzymes, flavonoids, terpenoids, polyphenols, and alkaloids are used in the green synthesis of ZnO NPs and act as capping, stabilizing, and reducing agents. Because green synthesis is less expensive, produces less pollution, and enhances the safety of the environment and human health, it is preferable to traditional chemical synthesis. Green synthesis is a faster and more environmentally friendly solution than physicochemical processes since it eliminates the cumbersome reaction steps and dangerous substances. Chemical fungicides are expensive, cause environmental pollution, and cause pesticide resistance in fungal populations. Compared to chemical fungicides, green-biosynthesized ZnO NPs provide different advantages as follows: primarily, biodegradability reduces environment pollution and resistance development; secondly, the cost-effectiveness and simple fabrication of ZnO NPs benefit small-scale agricultural farmers; lastly, the eco-friendly ZnO NPs do not affect beneficial creatures, which promotes environmental sustainability. This work on the green synthesis of ZnO NPs and their application against Fusarium oxysporum suggests a possible alternative to conventional pesticides, addressing their limitations while giving a long-term solution for fungal control in agriculture.
Ethical approval
This article does not contain any studies with human participants or animals performed by any of the authors.
Data availability
The authors confirm that the data supporting the findings of this study are available within the article.
Author contributions
All authors conceived and designed the research. AR and ZZ, synthesized and characterized the NPs. AK, IA, MH and MZ conducted the antifungal experiment and analyzed the data. AR, AK, IA, MH, ZZ, MZ, CS and FA wrote the original draft. AA, PM, CSS, TAYA, MH and FA edited the manuscript. AA and FA supervised. All authors read and approved the manuscript.
Conflicts of interest
The authors have no relevant financial or non-financial interests to disclose.
Funding
This work was supported by the Department of Biotechnology (DBT), Government of India, through setting up a Centre of Excellence (COE, BT/PR1-3584/COE/34/29/2015) at the Interdisciplinary Nanotechnology Centre (INC), AMU.
Supplementary Material
Acknowledgments
Dr Tahani A. Y. Asseri and Dr Mohamed Hashem extend their appreciation to the Deanship of Scientific Research, King Khalid University, for getting financial support through the groups program under grant number R.G.P. 1/24/45. The facility and support provided by the Department of Botany, AMU are also gratefully acknowledged. We are grateful to Dr Manar Fawzi Bani Mfarrej for proofreading and developing a polished and professional manuscript.
Electronic supplementary information (ESI) available. See DOI: https://doi.org/10.1039/d4ra01035c
References
- Worrall E. A. Hamid A. Mody K. T. Mitter N. Pappu H. R. J. Agron. 2018;8:285. [Google Scholar]
- Mittal D. Kaur G. Singh P. Yadav K. Ali S. A. Frontal Nanotechnol. Res. 2020;2:579954. [Google Scholar]
- Kutawa A. B. Ahmad K. Ali A. Hussein M. Z. Abdul Wahab M. A. Adamu A. Ismaila A. A. Gunasena M. T. Rahman M. Z. Hossain M. I. Biology. 2021;10:881. doi: 10.3390/biology10090881. [DOI] [PMC free article] [PubMed] [Google Scholar]
- Peng Y. Li S. J. Yan J. Tang Y. Cheng J. P. Gao A. J. Yao X. Ruan J. J. Xu B. L. Front. Microbiol. 2021;12:670135. doi: 10.3389/fmicb.2021.670135. [DOI] [PMC free article] [PubMed] [Google Scholar]
- Sharma A. Sharma N. K. Srivastava A. Kataria A. Dubey S. Sharma S. Kundu B. Ind. Crops Prod. 2018;123:353–362. [Google Scholar]
- Fiol D. F. Terrile M. C. Frik J. Mesas F. A. Álvarez V. A. Casalongué C. A. J. Chem. Technol. Biotechnol. 2021;96:2095–2108. [Google Scholar]
- M. Sathiyabama, In: Nanoscience for Sustainable Agriculture, Pudake, R., Chauhan, N., Kole, C. (eds) Springer; Cham, Switzerland, 2019, pp. 139–152 [Google Scholar]
- Zehra A. Rai A. Singh S. K. Aamir M. Ansari W. A. Upadhyay R. S. Food Security and Plant Disease Management, Kumar, A., Droby, S., (eds) Elsevier, 2020, United Kingdom, 193-219. Food Security and Plant Disease Management. 2020:193–219. [Google Scholar]
- Fu L. Wang Z. Dhankher O. P. Xing B. J. Exp. Bot. 2020;71:507–519. doi: 10.1093/jxb/erz314. [DOI] [PubMed] [Google Scholar]
- Banerjee A. Sarkar A. Acharya K. Chakraborty N. Lett. App. NanoBioSci. 2021;10:2784–2803. [Google Scholar]
- Abdel-Hadi A. M. Awad M. F. Abo-Dahab N. F. ElKady M. F. Biosci. Biotechnol. Res. Asia. 2014;11:1179–1186. [Google Scholar]
- Martínez-Camacho A. Cortez-Rocha M. Ezquerra-Brauer J. Graciano-Verdugo A. Rodriguez-Félix F. Castillo-Ortega M. Yépiz-Gómez M. Plascencia-Jatomea M. Carbohydr. Polym. 2010;82:305–315. doi: 10.1016/j.carbpol.2012.08.076. [DOI] [PubMed] [Google Scholar]
- Cota-Arriola O. Cortez-Rocha M. O. Rosas-Burgos E. C. Burgos-Hernández A. López-Franco Y. L. Plascencia-Jatomea M. Polym. Int. 2011;60:937–944. [Google Scholar]
- El Ghaouth A. Arul J. Wilson C. Benhamou N. Physiol. Mol. Plant Pathol. 1994;44:417–432. [Google Scholar]
- Bautista-Baños S. Hernandez-Lauzardo A. N. Velazquez-Del Valle M. G. Hernández-López M. Barka E. A. Bosquez-Molina E. Wilson C. Crop Prot. 2006;25:108–118. [Google Scholar]
- Kanhed P. Birla S. Gaikwad S. Gade A. Seabra A. B. Rubilar O. Duran N. Rai M. Mater. Lett. 2014;115:13–17. [Google Scholar]
- Viet P. V. Nguyen H. T. Cao T. M. Hieu L. V. J. Nanomater. 2016:2016. [Google Scholar]
- Şendal K. Üstün Özgür M. Gülen J. J. Dispersion Sci. Technol. 2023;44:2734–2747. [Google Scholar]
- Soto-Robles C. Nava O. Cornejo L. Lugo-Medina E. Vilchis-Nestor A. Castro-Beltrán A. Luque P. J. Mol. Struct. 2021;1225:129101. [Google Scholar]
- Golmohammadi M. Honarmand M. Ghanbari S. Spectrochim. Acta, Part A. 2020;229:117961. doi: 10.1016/j.saa.2019.117961. [DOI] [PubMed] [Google Scholar]
- Madan H. Sharma S. Suresh D. Vidya Y. Nagabhushana H. Rajanaik H. Anantharaju K. Prashantha S. Maiya P. S. Spectrochim. Acta, Part A. 2016;152:404–416. doi: 10.1016/j.saa.2015.07.067. [DOI] [PubMed] [Google Scholar]
- Nourbakhsh M. Darroudi M. Gholizadeh M. Res. Chem. Intermed. 2020;46:243–252. [Google Scholar]
- Osman A. I. Zhang Y. Farghali M. Rashwan A. K. Eltaweil A. S. Abd El-Monaem E. M. Mohamed I. M. A. Badr M. M. Ihara I. Rooney D. W. Yap P. S. Environ. Chem. Lett. 2024;22:841–887. [Google Scholar]
- Shinde P. K. Kokate R. H. Gawade G. S. Res. J. Sci. Technol. 2023;15:41–48. [Google Scholar]
- Islam S. U. Sun G. ACS Sustain. Chem. Eng. 2022;10:10084–10104. [Google Scholar]
- Bairagi S. Kamali M. R. Chem. Eng. J. Adv. 2023;14:100460. [Google Scholar]
- Chelu M. Moreno J. C. Atkinson I. Cusu J. P. Rusu A. Bratan V. Aricov L. Anastasescu M. Seciu-Grama A.-M. Musuc A. M. Bio I. J. Macromol. 2022;211:410–424. doi: 10.1016/j.ijbiomac.2022.05.070. [DOI] [PubMed] [Google Scholar]
- Dhingra O. D. and Sinclair J. B., Basic Plant Pathology Methods, CRC Press, Boca Raton, 1985, pp. 11-47 [Google Scholar]
- Falck R. Myceture. 1907;32:38–39. [Google Scholar]
- Vincent J. Nature. 1947;159:850. doi: 10.1038/159850b0. [DOI] [PubMed] [Google Scholar]
- Raza A. Shoeb M. Mashkoor F. Rahaman S. Mobin M. Jeong C. Ansari M. Y. Ahmad A. Mater. Chem. Phys. 2022;286:126173. [Google Scholar]
- Hamrayev H. Kamyar S. IOP Conf. Ser.: Mater. Sci. Eng. 2021;1051:012088. [Google Scholar]
- Islam S. N. Muaz M. Rizvi A. H. Parveen S. Naqvi S. M. A. Raza A. Ansari M. M. Patil C. R. Ahmad A. Inorg. Chem. Commun. 2023;152:110692. [Google Scholar]
- Gupta H. Joshi K. Gautam S. K. Singh R. Singh F. Vacuum. 2020;181:109598. [Google Scholar]
- Güell F. Martínez-Alanis P. R. Khachadorian S. Rubio-García J. Franke A. Hoffmann A. Santana G. Phys. Status Solidi B. 2016;253:883–888. [Google Scholar]
- Jayakumar G. Irudayaraj A. A. Raj A. D. Mech. Mater. Sci. Eng. 2017;9(1) doi: 10.2412/mmse.3.4.481. [DOI] [Google Scholar]
- Wu X. Lee J. Varshney V. Wohlwend J. L. Roy A. K. Luo T. Sci. Rep. 2016;6:1–10. doi: 10.1038/srep22504. [DOI] [PMC free article] [PubMed] [Google Scholar]
- Jayachandran A. Aswathy T. R. Nair A. S. Biochem. Biophys. Rep. 2021;26:100995. doi: 10.1016/j.bbrep.2021.100995. [DOI] [PMC free article] [PubMed] [Google Scholar]
- Muhammad W. Ullah N. Haroon M. Abbasi B. H. RSC Adv. 2019;9:29541–29548. doi: 10.1039/c9ra04424h. [DOI] [PMC free article] [PubMed] [Google Scholar]
- Rashid T. Raza A. Saleh H. A. M. Khan S. Rahaman S. Pandey K. AlDamen M. A. Sama F. Ahmad A. Shahid M. Ahmad S. A. ACS Appl. Nano Mater. 2023;6:18905–18917. [Google Scholar]
- Islam S. N. Raza A. Naqvi S. M. A. Parveen S. Ahmad A. Surf. Interfaces. 2022;29:101769. [Google Scholar]
- Islam S. N. Naqvi S. M. A. Raza A. Jaiswal A. Singh A. K. Dixit M. Barnwal A. Gambhir S. Ahmad A. 3 Biotech. 2022;12:309. doi: 10.1007/s13205-022-03383-0. [DOI] [PMC free article] [PubMed] [Google Scholar]
- Fageria P. Gangopadhyay S. Pande S. RSC Adv. 2014;4:24962–24972. [Google Scholar]
- Githala C. K. Raj S. Dhaka A. Mali S. C. Trivedi R. Front. Chem. 2022;10:994721. doi: 10.3389/fchem.2022.994721. [DOI] [PMC free article] [PubMed] [Google Scholar]
- Nagaraja R. Kottam N. Girija C. R. Nagabhushana B. M. Powder Technol. 2012;215–216:91–97. [Google Scholar]
- Wang X. Huang Z. Zhu N. Wu J. Li P. Dang Z. Appl. Clay Sci. 2014;95:95–103. [Google Scholar]
- Aroob S. Carabineiro S. A. C. Taj M. B. Bibi I. Raheel A. Javed T. Yahya R. Alelwani W. Verpoort F. Kamwilaisak K. Al-Farraj S. Sillanpää M. Catalysts. 2023;13:502. [Google Scholar]
- Basit R. A. Abbasi Z. Muhammad H. Ahmad P. Khan J. Khandaker M. U. Al-Mugren K. S. Khalid A. Crystals. 2023;13(2):281. [Google Scholar]
- Waseem S. Sittar T. Kayani Z. Gillani S. Rafique M. Nawaz M. Shaheen S. Assiri M. Phys. B. 2023;663:415005. [Google Scholar]
- Primo J. O. Bittencourt C. Acosta S. Sierra-Castillo A. Colomer J. F. Jaerger S. Teixeira V. C. Anaissi F. J. Front. Chem. 2020;8:571790. doi: 10.3389/fchem.2020.571790. [DOI] [PMC free article] [PubMed] [Google Scholar]
- Motelica L. Oprea O. Vasile B. Ficai A. Ficai D. Andronescu E. Holban A. Int. J. Mol. Sci. 2023;24:5677. doi: 10.3390/ijms24065677. [DOI] [PMC free article] [PubMed] [Google Scholar]
- Badri A. Álvarez-Serrano I. Aloui F. Jabli M. J. Mater. Sci.: Mater. Electron. 2023;34:1503. [Google Scholar]
- Abdulrahman A. F. Abdulqodus A. N. Almessiere M. A. Ceram. Int. 2023;49(22):34920–34936. [Google Scholar]
- Golthi V. Kommu J. Ramesh A. V. Colloid Polym. Sci. 2024;302:183–197. [Google Scholar]
- Bouson S. Krittayavathananon A. Phattharasupakun N. Siwayaprahm P. Sawangphruk M. R. Soc. Open Sci. 2017;4:170654. doi: 10.1098/rsos.170654. [DOI] [PMC free article] [PubMed] [Google Scholar]
- Rao K. J. Paria S. RSC Adv. 2013;3:10471–10478. [Google Scholar]
- Ouda S. Res. J. Microbiol. 2014;9:34–42. [Google Scholar]
- Feng Q. Wu J. Chen G.-Q. Cui F.-Z. Kim T. Kim J. J. Biomed. Mater. Res. 2000;52:662–668. doi: 10.1002/1097-4636(20001215)52:4<662::aid-jbm10>3.0.co;2-3. [DOI] [PubMed] [Google Scholar]
Associated Data
This section collects any data citations, data availability statements, or supplementary materials included in this article.
Supplementary Materials
Data Availability Statement
The authors confirm that the data supporting the findings of this study are available within the article.


