

Abstract
Tacrolimus (Tac) is widely used to prevent rejection and graft loss in solid organ transplantation. A limiting characteristic of Tac is the high intra and interpatient variability associated with its use. Routine therapeutic drug monitoring (TDM) is necessary to facilitate Tac management and to avoid undesirable clinical outcomes. However, whole blood trough concentrations commonly utilized in TDM are not strong predictors of the detrimental clinical outcomes of interest. Recently, researchers have focused on Tac intrapatient variability (Tac IPV) as a novel marker to better assess patient risk. Higher Tac IPV has been associated with a number of mechanisms leading to shortened graft survival. Medication nonadherence (MNA) is considered to be the primary determinant of high Tac IPV and perhaps the most modifiable risk factor. An understanding of the methodology behind Tac IPV is imperative to its recognition as an important prognostic measure and integration into clinical practice. Therapeutic interventions targeting MNA and reducing Tac IPV are crucial to improving long-term graft survival.
Keywords: graft survival, health services and outcomes research, immunosuppressant - calcineurin inhibitor: tacrolimus, kidney transplantation/nephrology
1 |. INTRODUCTION
Tacrolimus (Tac) is the cornerstone of the modern immunosuppression regimen used in contemporary solid organ transplantation to prevent rejection and graft loss. The most recent Scientific Registry of Transplant Recipients (SRTR) data reports that more than 90% of all transplant recipients receive Tac as part of their immunosuppressant regimen.1 Tac is highly effective at preventing rejection yet has a number of notable limitations. These include high intra and interpatient variability with regard to its pharmacokinetic properties and a relatively short half-life that requires transplant recipients be highly adherent to this therapy in order to avoid detrimental clinical consequences. Therapeutic drug monitoring (TDM) is universally applied to facilitate Tac management. Although the use of whole blood trough concentrations is most commonly utilized, they are not strongly correlated with the clinical outcomes that are generally used by clinicians to identify patients that might be over- or underimmunosuppressed.2 Recently, a researcher has sought out additional methods to utilize Tac trough concentrations to better assess patient risk and correlate these measures with important clinical outcomes.3 This comprehensive review focuses on a promising measure that has received intense scrutiny within the contemporary transplant literature, namely, Tac intrapatient variability (IPV). Tac IPV can generally be conceptualized as the fluctuation in whole blood Tac trough concentrations within an individual over a period of time during which the Tac dose is stable.4
2 |. DETERMINANTS OF TAC IPV
Tac pharmacokinetics can be influenced by multiple factors that ultimately contribute to Tac IPV. Figure 1 provides a conceptual model relating these key determinants to the clinical implications of high Tac IPV. Both the timing and fat content of meals can affect the rate and extent of the oral absorption of Tac. In addition, foods that alter the activity of cytochrome P450 3A (CYP3A), such as grapefruit, can increase the blood concentration of Tac.4 For Tac, several drug-drug interactions including, but not limited to, the inhibition or induction of the CYP3A enzyme have also been described. Prescription and nonprescription medications, including herbal supplements, interacting with Tac can alter its absorption, distribution, metabolism, and excretion by the body. Genetic factors have been associated with differences in Tac dose requirements and also play a role in Tac variability. To reach target dose concentrations, CYP3A5 expressers need about 50% higher doses as compared to CYP3A5 nonexpressers.4,5 In contrast, certain concomitant illnesses may necessitate a Tac dose reduction. Several studies have demonstrated that severe diarrheal illness results in higher Tac levels, one of which reported a 30% Tac dose reduction needed to obtain prediarrhea Tac levels. This rise in exposure has been attributed to an increase in oral bioavailability. However, the impact of diarrhea on Tac exposure greatly depends on the severity of the illness.4
FIGURE 1.
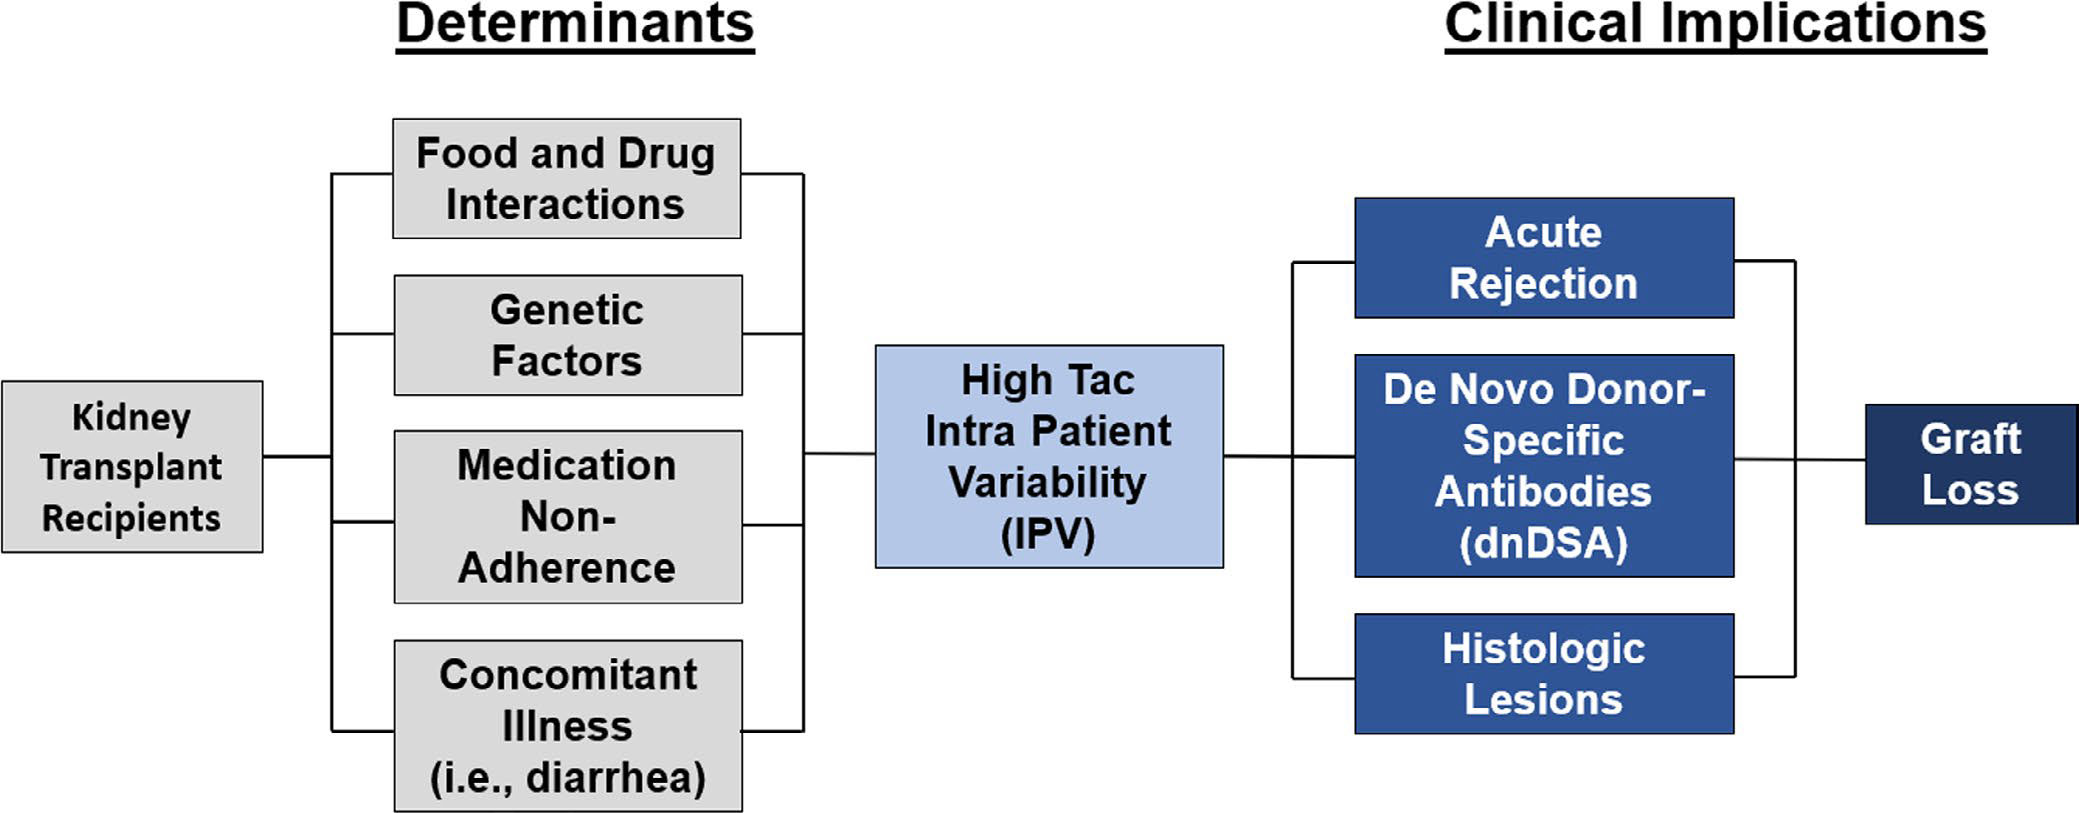
Conceptual model of high tacrolimus (Tac) intrapatient variability (IPV) and graft loss in kidney transplant recipients. The key determinants of high Tac variability are food and drug interactions, including herbal supplements, genetic factors, medication nonadherence, and concomitant illness. High Tac variability leads to an increased incidence of acute rejection, de novo donor-specific antibody (dnDSA) development, and histologic lesions. Ultimately, there is an increased risk of graft loss in recipients with high Tac IPV
Although variation is explained in part by food and drug interactions, genetic factors, and concomitant illness, medication nonadherence is considered by researchers to be the predominant determinant of high Tac IPV. Lack of adherence to immunosuppression regimens has an obvious impact on Tac exposure and represents a major risk factor for poor graft outcomes. Fluctuations in Tac concentrations can result from taking doses late, missed doses, or attempts to compensate for this behavior, such as doubling up on medications or bolusing prior to clinic visits.4 Medication nonadherence also encompasses some of the previously mentioned factors. Complete adherence to the prescribed regimen includes taking the drug appropriately with regard to food, avoiding interacting foods and drugs, and maintaining consistent timing of doses.
In all studies, Tac IPV estimates range from 5% to over 60%.6 On average, most analyses observe mean Tac IPV measures for a given study population somewhere between 15% and 30% (Table 1).4 Recently, Leino et al sought to establish a baseline reference for Tac IPV in highly adherent adult kidney and liver transplant recipients (Table 2). Medication adherence was assessed during a 6-week trial, where patients switched between three different formulations of twice-daily Tac using both objective and subjective measures. Adherence measures included electronic monitoring (Medication Event Monitoring System: MEMS), pill counts, a daily patient diary, and Tac trough concentrations. Daily Tac trough measurements were collected using dried blood spot (DBS), whereas in-clinic measures were also collected weekly using venipuncture. The study population demonstrated 99.9% adherence, with comparable rates across both subjective and objective adherence measures. The median weekly Tac IPV for all patients was 15.2%. Median weekly Tac IPV was 16.8% (interquartile range [IQR] 12.3–23.8) in kidney recipients and 14.4% (IQR 11.0–18.9) in liver recipients. There were no significant differences in IPV based on graft type or Tac formulation. Researchers used an IPV cutoff of 30% to link 29 of the 287 weekly CV values to high IPV in 16 patients7 (Table 2). These findings suggest that baseline Tac IPV in kidney and liver recipients with high medication adherence to twice-daily Tac formulations averages around 15%. Considering the difference between this median Tac IPV in an established highly adherent group of patients, and those that have been reported in previous observational studies, these results suggest that nonadherence is likely a main determinant of high Tac IPV.6 Future studies can use this estimate of normal physiologic Tac IPV in highly adherent patients to further investigate the determinants of Tac IPV. Furthermore, an IPV cutoff of 30% can be used to correlate Tac IPV with inferior graft outcomes.
TABLE 1.
Tac IPV measurement methods
| Citation | Levels included | Levels excluded | Dose normalized | Posttransplant time period | Number of levels assessed | Tac variability calculation | Exposure group cutoffs | IPV reported |
|---|---|---|---|---|---|---|---|---|
| Borra LC. Nephrol Dial Transplant. 2010; 25(8):2757–2763. | Outpatient | Inpatient | Yes | 6–12 mo | Min: 3 Mean: 4.6 ± 1.8 |
MAD | Median IPV Tac clearance |
Mean: 17% Median: 14.9% |
| Ro H. Ther Drug Monit. 2012; 34(6):680–685. | Inpatient and outpatient | None | Not reported | 6–12 mo | Mean: 6.8 ± 3.6 | MAD | Median IPV |
Mean: 20.46% Median: 17.97% |
| Sapir-Pichhadze R. Kidney Int. 2014; 85(6):1404–1411. | Inpatient and outpatient | None | Not reported | >1 y | Median: 15 | TacSD | TacSD (thresholds: >1.5, >2.0, >2.5, >3.0) | Not reported |
| O’Regan JA. J Nephrol. 2016; 29(2):269–276. | Inpatient and outpatient | None | Not reported | 3–12 mo | Median: Q1: 6 Q2: 8 Q3: 10 Q4:10 |
CV | IPV quartiles |
Median: Q1: 12.5% Q2: 18.17% Q3: 24.63% Q4: 36.91% |
| Vanhove T. Am J Transplant. 2016; 16(10):2954–2963. | Outpatient (between 7–10 AM) | Inpatient; Untrue levels | Yes | 6–12 mo | Min: 3 | CV | IPV tertiles |
Mean: T1: 9.8 ± 3.3% T2:18.3 ± 2.4% T3: 31.1 ± 7.8% |
| Rodrigo E. Transplantation. 2016; 100(11):2479–2485. | Outpatient | Inpatient | No | 4–12 mo | Min: 3 Mean: 7.0 ± 2.6 |
CV | IPV > 30% | Mean: 29.1 ± 16.9% |
| Shuker N. Transpl Int. 2016; 29(11): 1158–1167. | Outpatient | Inpatient | Yes | 6–12 mo | Min: 3 Median: 5 (range 3–11) |
MAD | Median IPV | Median: 16.2% |
| Goodall DL. Transplant Direct. 2017;3(8):e192. | Outpatient | Inpatient | Not reported | 6–12 mo | Mean: 8.98 ±3.81 | CV | IPV quartiles | Median: 18.15% |
| Rozen-Zvi B. Nephrol Dial Transplant. 2017; 32:393–399. | Inpatient and outpatient | None | No | ≤6 mo | Min: 8 Mean: 20.7 ± 6.5 |
TWCV | TWCV tertiles |
Mean: 34.8 ±21.3% Median: 31.1% (*at t = 6 months post-tx) |
| Whalen HR. Transplantation. 2017; 101(2):430–436. | Outpatient | Inpatient; Untrue levels | Yes | 6–12 mo | Mean (SD): Low IPV group: 6.9 (3.28) High IPV group: 10.02 (6.08) |
MAD | Median IPV | Median: 15% |
| Sablik KA. PLoS One. 2018; 13(5). | Outpatient | Inpatient | Yes | 3-y period prior to c-aABMR; ≥6 mo post-tx | Min: 8 over ≥ 2-yr period Mean: Cases: 17 (8–33) Controls: 15 (8–44) |
MAD | Mean IPV |
Mean: Overall:24% Cases: 24.4% Controls: 23.6% |
| Leino AD. Am J Transplant. 2019; 19(5):1410–1420. | Outpatient | Inpatient | No | 6-wk period; ≥6 mo post-tx | Daily DBS and weekly venipuncture | CV | IPV ≥ 30% | Median: 15.2% (*highly adherent cohort) |
| Rahamimov R. Eur J Clin Pharmacol. 2019; 75:951–958. | Inpatient and outpatient | None | No | ≥6 mo | Not reported | Cumulative TWCV | Cumulative TWCV > 25% | Mean: 26.2 ± 12.9% |
Abbreviations: c-aABMR, chronic active antibody-mediated rejection; CV, coefficient of variation; DBS, dried blood spot; IPV, intrapatient variability; MAD, mean absolute deviation; Min, minimum; SD, standard deviation; Tac, tacrolimus; TacSD, standard deviation of tacrolimus; TWCV, time-weighted coefficient of variation; tx, transplant.
TABLE 2.
Tac IPV and clinical outcomes
| Citation | Objectives | Outcomes | Methods | Ns | Findings | Comments |
|---|---|---|---|---|---|---|
| Graft survival | ||||||
| Borra LC. Nephrol Dial Transplant. 2010; 25(8):2757–2763. | Determine impact of high Tac IPV clearance on long-term chronic allograft nephropathy and graft loss after kidney tx. | Primary composite: graft failure (graft loss, biopsy-proven chronic allograft nephropathy, doubling of SCr between 12 mo post-tx and last follow-up). | • Single-center, retrospective cohort study. • Included adult kidney tx between 1/1/2000–12/31/2004 on Tac-based IS, with graft function at 12 mo post-tx, and eGFR ≥ 25 mL/min. • Estimated IPV using MAD. Included outpatient trough levels 6–12 mo post-tx. • Median IPV used to divide subjects into low and high variability groups. |
N = 297 | • Mean follow-up: 1849 ± 585 days (range: 1096–2811). • Median IPV: 14.9% (mean: 17%). • LV: n = 148 (mean IPV: 9.6%). • HV: n = 149 (mean IPV: 24.2%). Primary: • 34 outcome events (failures): 29 = graft loss; 3 = chronic allograft nephropathy; 2 = doubled SCr. • Failures: 24/34 (70.6%) in HV group vs 10/34 (29.4%) in LV group. • Impact of IPV on graft failure (P = .003) is comparable to AR within first year post-tx (P = .003). • Multivariate analysis found Tac IPV independently associated with occurrence of graft failure. |
• Also demonstrated poor correlation between Tac and MMF IPV Strengths: • IPV calculation excluded inpatient levels. Limitations: • External validity (study design). • Arbitrary IPV cutoff value. Implications: 1. High Tac IPV is associated with ↓ graft survival. 2. Compliance may not be main underlying cause of IPV. 3. Need to establish high IPV cutoff. |
| O’Regan JA. J Nephrol. 2016; 29(2):269–276. | Primary: Determine relationship between Tac IPV 3–12 mo post-tx and long-term graft survival. Secondary: Investigate association between Tac IPV and patient survival. |
Primary: death-censored graft loss. Secondary: patient survival. |
• Single-center, retrospective cohort study. • Included adult kidney tx between 1/1/2000–4/31/2008 on Tac-based IS with graft function at 12 mo post-tx. • Excluded multiorgan tx. • Estimated IPV using CV. Included all trough levels 3–12 mo post-tx. • Subjects divided into IPV quartiles (Q1-Q4). |
N = 394 | • Median follow-up: 6.94 years (range: 1.09–12.44). • Median IPV: Q1: 12.5% (n = 99); Q2: 18.17% (N = 96); Q3: 24.63% (n = 100); Q4: 36.91% (n = 99). Primary: • Graft survival 3 and 5 years post-tx: Q1: 100,97%; Q2: 97,93%; Q3: 94,84%; Q4: 92,87%. • 46% ↑ hazard for graft loss per quartile increase (HR 1.46, 95% CI 1.16–1.83, P = .001). • Remained significant in multivariate adjusted model. Secondary: no association between Tac IPV and patient survival. |
Strengths: • Larger sample size. Limitations: • External validity (study design). • IPV calculation included inpatient levels. • Shorter lead in time for Tac dose stabilization. Implications: 1. High Tac IPV is associated with ↓ graft survival, but not patient survival. 2. IPV calculations are a readily available clinical tool to identify at-risk groups. |
| Goodall DL. Transplant Direct. 2017;3(8):e192. | Determine the clinical impact of Tac IPV and outpatient clinic nonattendance in patients receiving Tac monotherapy. | Primary: patient survival and graft survival. Secondary: outpatient clinic attendance. |
• Single-center, retrospective cohort study. • Included adult kidney tx between 11/1/2005–12/31/2012 who received Tac monotherapy. • Excluded death, graft loss, or rejection within 6 mo post-tx. • Estimated IPV using CV. Included outpatient trough levels 6–12 mo post-tx. • Subjects divided into IPV quartiles (Q1-Q4). |
N = 628 | • Mean follow-up: 4.72 ± 2.19 years • Median IPV: 18.15% (IQR 13.45%–25.27%) Primary: • Inferior patient survival in highest IPV group (Q4) vs lower IPV groups (Q1 + Q2) (83.2% and 92.7%, respectively, P = .017). • Graft survival: 77.2% in Q4% vs 89.5% in Q3 (/P/ = .011), vs 89.4% in Q2 (P = .051), vs 93.4% in Q1 (P = .042). • Highest IPV group showed inferior rejection-free survival compared with the lowest IPV group (77.7% vs 89.7%, P = .023). Secondary: • Mean clinic nonattendances: 3.79 ± 3.61 • Median number of nonattendances was higher in the high IPV groups (Q3 + Q4; 4) vs low IPV groups (Q1 + Q2; 2) (P < .0001). |
Strengths: • Large sample size. • IPV calculation excluded inpatient levels. Limitations: • External validity (study design). • Tac monotherapy is not a widely used IS regimen. Implications: 1. Higher Tac IPV is associated with poorer graft and patient survival. 2. Patients with higher Tac IPV may be less likely to attend clinic visits. |
| Rozen-Zvi B. Nephrol Dial Transplant. 2017; 32:393–399. | Determine whether calculating Tac time-weighted CV 0enables Identification of high-risk patients early post-tx. | Primary composite: patient and graft survival. | • Single-center, retrospective cohort study. • Included adult kidney tx between 2/1/2000–12/31/2013 with graft function 6 mo post-tx. • Excluded multiorgan tx. • Estimated IPV using TWCV. Included all levels up to 6 mo post-tx. • Subjects divided Into tertiles. |
N = 803 | • Median follow-up: 3.7 years (range: 0.5–12.9). • At 180 days post-tx, mean IPV: 34.8 ± 21.3% (median: 31.1%). Primary: • 98 outcome events: 49 = graft loss, 49 = death. • Highest IPV fertile = ↓ survival (P = .002). • Highest IPV fertile = ↑ graft loss (HR 7.35 per log IPV, 95% CI 3.64–15.33, P = .001). |
Strengths: • Large sample size. • TWCV calculation minimizes effect of acute events, allows Inclusion of Immediate post-tx period levels. Limitations: • External validity (study design). Implications: 1. High TWCV is associated with ↓ graft survival. 2. Need to establish TWCV cutoff. |
| Rahamimov R. Eur J Clin Pharmacol. 2019; 75:951–958. | Determine whether reduction of exposure to high Tac IPV is associated with better graft survival. | Primary composite: patient and graft survival. | • Single-center, retrospective cohort study. • Included adult kidney tx between 1/1/2006–12/31/2015 on Tac-based IS ≥12 mo. • Excluded graft loss or death within 6 mo post-tx and multiorgan tx. • Estimated IPV using TWCV Included all trough levels ≥ 6 mo post-tx. • Divided subjects into 5 IPV groups: (<20%, 20%–25%, 25%–30%, 30%–35%, >35%) to establish cutoff. |
N = 878 | • Median follow-up: 1263 days (IQR: 768–1976). • Mean cumulative IPV: 26.2 ± 12.9% • High fertile: 29.5%. Primary: • 109 outcome events: 58 = graft loss; 51 = death. • ↑ cumulative IPV = ↑ rate of graft loss (HR 1.037 per percent, 95% CI 1.025–1.048, P < .001). • IPV > 25% = ↑ rate of graft loss (H R 3.66, 95% CI 2.3–5.8, P < .001) - cutoff value = 25%. • 480 (54.7%) patients with IPV > 25% at any time, 110(22.9%) resumed IPV < 25%. • Reduction of IPV to < 25% associated with hazard of graft loss no different than IPV < 25% throughout entire follow-up. |
Strengths: • Large sample size. • TWCV calculation does not require dose correction. Limitations: • External validity (study design). Implications: 1. Reducing TWCV < 25% is associated with better graft survival. 2. TWCV cutoff value > 25% as target for intervention. |
| Shuker N. Transpl Int. 2016; 29(11): 1158–1167. | Evaluate whether high Tac IPV is associated with inferior adverse kidney tx graft outcomes. | Primary composite: death-censored graft loss, late BPAR, tx glomerulopathy, doubling of SCr between 12-mo post-tx and last follow-up. | • Single-center, retrospective cohort study. • Included adult kidney tx between 1/1/2000–12/31/2010 on Tac-based IS, with graft function at t = 12 mo post-tx, and eGFR ≥ 25 mL/min. • Excluded multiorgan tx. • Estimated IPV using MAD. Included outpatient trough levels 6–12 mo post-tx. • Median IPV used to divide subjects into LV and HV groups. |
N = 808 | • Median follow-up: 5.5 years (range 0.06–14.1). • Median IPV: 16.2% (range 1.1%–76.0%). Primary: • 188 outcome events: 68 = graft loss, 69 = late BPAR, 39 = tx glomerulopathy, 12 = doubled SCr. • Cumulative incidence of primary endpoint significantly ↑ in HV vs LV groups (HR 1.41, 95% CI 1.06–1.89, P = .019). |
• Follow-up to Borra et al - enlarged study population and extended follow-up time. Strengths: • Large sample size. • IPV calculation excluded inpatient levels. Limitations: • External validity (study design). Implications: 1. High Tac IPV is an independent risk factor for adverse kidney tx outcomes. |
| Acute rejection | ||||||
| Ro H. Ther Drug Monit. 2012; 34(6):680–685. | Primary: determine whether higher IPV of Tac in Asian patients 6–12 mo post-tx ↑ risk of AR. Secondary: assess impact of CYP3A5 polymorphism on graft outcomes in Asian kidney tx recipients. |
Primary: AR. Secondary: mean Tac C0, AR, dose requirements. |
• Single-center, retrospective cohort study. • Included adult kidney tx between 1/1/2000–12/31/2010. • Excluded multiorgan tx. • Consenting subjects underwent genotyping at baseline. Divided into expressers/nonexpressers to assess secondary outcomes. • Estimated IPV using MAD. Included all trough levels 6–12 mo post-tx. • Median IPV used to divide subjects into LV and HV groups. |
N = 357 | • Median follow-up: 50.4 mo. • Median IPV: 17.97% (mean: 20.46%). Primary: • ↑ hazard for AR development in high IPV group vs low (H R 2.655, 95% CI, 1.394–5.056, P = .003). Secondary: • No difference in mean Tac trough C0 or incidence of AR between CYP3A5 expressers and nonexpressers. • Dose requirements at 6, 9, 12-mo post-tx significantly higher in expressers (P < .001). |
Limitations: • External validity (study design). • CV calculation included inpatient levels. Implications: 1. CYP3A5 polymorphism might affect association of Tac IPV and AR. 2. IPV ≠ determined by CYP3A5 polymorphism. |
| Sapir-Pichhadze R. Kidney Int. 2014; 85(6):1404–1411. | Examine impact of time-dependent Tac exposure on LT kidney tx outcomes. | Primary composite: late AR, tx glomerulopathy, graft failure, death with function. Secondary composite: late AR, tx glomerulopathy, graft failure (excluding death with function). |
• Single-center, retrospective cohort study. • Included adult kidney tx between 1/1/2000–12/31/2011 on Tac-based IS with graft function at 1-y post-tx. • Excluded multiorgan tx and re-tx. • Estimated IPV using TacSD. Included all trough levels ≥ 12 mo post-tx. • TacSD thresholds > 1.5, >2.0, >2.5, >3.0 used for analysis. |
N = 356 | • Median follow-up: 3.72 y Primary/Secondary: • 62 events: 16 = late AR; 6 = glomerulopathy; 10 = graft failure; 20 = death. • 5-y cumulative incidence = 24.8% in patients with TacSD > 2% vs 16.3% in TacSD ≤ 2 - difference not statistically significant (P = .21); TacSD thresholds > 2.5 or > 3 ↑differences between curves. • Every one-unit increase in TacSD = 27% and 34% ↑ hazard in primary and secondary endpoints, respectively (P = .01 and P = .03). |
Strengths: • Time-dependent assessment. Limitations: • External validity (study design). • TacSD not commonly reported measure. Implications: 1. TacSD can be used as a marker for nonadherence and to identify high-risk patients. |
| Whalen HR. Transplantation. 2017; 101(2):430–436. | Assess association between Tac IPV and negative outcomes in patients on low-dose Tac IS regimen. | Primary: graft survival, patient survival, eGFR, BPAR, NO DAT. | • Single-center, retrospective cohort study. • Included adult kidney tx between 1/1/2007–12/31/2011. • Excluded death or graft loss within 1-y post-tx or switch to non-Tac IS regimen. • Estimated IPV using MAD. Included true outpatient trough levels 6–12 mo post-tx. • Median IPV used to divide subjects into LV and HV groups. |
N = 376 | • Median follow-up: • LV: 3.9 y (IQR:2.–5.2). • HV: 4.2 y (IQR: 2.9–5.5). • Median IPV: 15% • LV: n = 186 (median IPV: 11%). • HV: n = 190 (median IPV: 24.2%). Outcomes: • 20 (5%) patients suffered graft loss. Graft survival significantly worse in HV group (HR 4.928, 95% CI 2.050–11.85, P = .0004). • 12 (3%) patients died. No significant difference between LV and HV groups. • LV group had significantly better eGFR at 1, 2, 3, 4 y follow-up (P < .0001). • 51 (14%) patients suffered early BPAR; 31 (8%) suffered late BPAR. • Significantly ↑ BPAR in HV vs LV group (18.4% vs 8.6%, P = .0351). • No difference in NODAT between groups. |
Limitations: • External validity (study design). • CV calculation included inpatient levels. Implications: 1. Previously demonstrated reduced graft outcomes (↑ AR, ↓ eGFR, ↓ graft survival) hold true in patients treated with low-dose Tac IS regimens. |
| DnDSA | ||||||
| Rodrigo E. Transplantation. 2016; 100(11):2479–2485. | Evaluate incidence of dnDSA and graft survival in relation to Tac IPV. | Primary: dnDSA. Secondary: graft loss. |
• Single-center, retrospective cohort study. • Included adult kidney tx between 1/1/1998–12/31/2013 on Tac-based IS, with graft survival 1-y post-tx and no pre-tx DSA. • Excluded multiorgan tx. • Estimated IPV using CV. Included outpatient trough levels 4–12 mo post-tx. • IPV > 30% used to define high IPV subjects. |
N = 310 | • Mean follow-up: 6.6 ± 3.7 y. • 116 patients had IPV > 30%. Primary: • 39 (12.6%) developed dnDSA. • dnDSA development associated with worse graft survival (5-y survival 78.1% vs 91.0%, P > .001). • CV > 30% Independently and significantly associated with dnDSA development (HR 2.925, 95% CI 1.473–5.807, P = .002). • dnDSA development = risk factor for graft loss (HR 2.61, 95% CI 1.257–5.466, P = .010). Secondary: • Graft loss = 53 (17.1%). • CV > 30% associated with ↑ risk of graft loss (HR 2.474, 95% CI 1.434–4.268, P = .001). |
Strengths: • Excluded pre-tx DSA. Limitations: • External validity (study design). • Selected samples at 1-, 3-, 5-y intervals and end of study follow-up to study dnDSA, not annually as in previous reports. Implications: 1. Tac IPV = independent risk factor for graft loss and strong risk factor for dnDSA development. |
| Chronic rejection | ||||||
| Sablik KA. PLoS One. 2018;13(5). | Investigate the association between Tac IPV and c-aABMR development. | Primary: Tac IPV and c-aABMR development. Secondary: graft function, change in Tac C0 over time, graft survival. |
• Single-center, retrospective, case-control study. • Included adult kidney tx between 1/1/2000–12/31-2013 on Tac-based IS. • Cases = patients with histologically proven c-aABMR. • Controls matched for age, year of tx, donor-type, and minimal graft survival (cases’ time to c-aABMR dx). • Estimated IPV using MAD. Included outpatient trough levels 3 y prior to c-aABMR diagnosis. • Mean IPV used to divide into LV and HV groups. |
N = 248 | • Cases: 59, controls: 189 • Study follow-up: 3 y. • Mean IPV: cases: 24.4%; controls: 23.6%. Primary: • No statistical significance between mean IPV in cases vs controls (P = .47). Secondary: • Cases had significantly inferior graft function 1-y prior and at time of c-aABMR diagnosis (P = .005, P < .001). • Significant difference in mean Tac C0 between cases and controls in year prior to endpoint (P = .03). • Cases with LV (≤24%) vs HV (>24%) had average survival of 13.1 vs 9.9 y (P = .04). |
Strengths: • Cases/controls well-matched. Limitations: • External validity (study design). Implications: 1. Tac IPV ≠ associated with c-aABMR. 2. High Tac IPV ↓ graft survival for c-aABMR. |
| Histologic lesions | ||||||
| Vanhove T. Am J Transplant. 2016; 16(10):2954–2963. | Determine relationship between Tac IPV and evolution of acute and chronic histologic lesions. | Primary: Histologic scores between 3 mo and 2-y post-tx. Secondary: eGFR. |
• Single-center, retrospective cohort study. • Included adult kidney tx between 11/1/2004–12/31/2012. • Estimated IPV using CV. Included true outpatient trough levels 6–12 mo post-tx. • Subjects divided into IPV tertiles (T1-T3). |
N = 220 | • Study follow-up: 2-y. • Mean IPV: Tl: 9.8 ± 3.3%; T2: 18.3 ± 2.4; T3: 31.1 ± 7.8%. Primary: • Mean increase in chronicity score: 1.97 ± 2.03 in T3 vs 1.18 ± 2.44 in T2 (P = .016) and 1.12 ± 1.80 in T1 (P = .023). • T3= ↑ risk of moderate-severe fibrosis and tubular atrophy by 2 y vs T1 (OR 2.47, 95% CI 1.09–5.60, P = .031 and OR 2.40, 95% CI 1.03–5.60, P = .043). Secondary: • ↑ in chronic histologic lesions not associated with ↓in eGFR. |
Limitations: • External validity (study design). Implications: 1. IPV monitoring can be used to predict accelerated progression of chronic histologic lesions prior to onset of renal dysfunction. |
Abbreviations: 95% CI, 95% confidence interval; AR, acute rejection; BPAR, biopsy-proven acute rejection; C0, trough concentration; c-aABMR, chronic active antibody-mediated rejection; CV, coefficient of variation; CYP3A5, cytochrome P450 3A5; dnDSA, de novo donor-specific antibody; eGFR, estimated glomerular filtration rate; HR, hazard ratio; HV, high variability; IPV, intrapatient variability; IQR, interquartile range; IS, immunosuppression; LV, low variability; MAD, mean absolute deviation; NODAT, new-onset diabetes after transplant; Scr, serum creatinine; Tac, tacrolimus; TacSD, standard deviation of tacrolimus; TWCV, time-weighted coefficient of variation; Tx, transplant.
3 |. TAC IPV MEASUREMENT METHODS AND BEST-PRACTICE CONSIDERATIONS
Many researchers consider underexposure to tacrolimus due to medication nonadherence to be one of the predominant underlying mechanisms contributing to these outcomes. However, when tacrolimus intrapatient variability has been used as a proxy for nonadherence, only analyses that used the combination of both high and low variability were correlated to outcomes. No further studies have included the level of granularity of Tac IPV needed to provide distinction between high and low levels.
Tac IPV can be quantified using any one of several different statistical measures. The simplest method to estimate how the Tac trough concentration distributes around the mean is to take the difference between the trough and the overall mean. The main issue with this method is that the resulting value can be either positive or negative. Ultimately, the total deviation will be skewed by the addition of positive and negative scores that cancel each other out. Because the parameter of interest is the deviation of each Tac trough (C0) concentration from the mean Tac C0, not whether those scores are above or below the mean score, it is appropriate to use a measure that corrects for negative deviations.
The variance (σ2) is another measure that can be used to calculate Tac IPV. The σ2 corrects for negative values by squaring individual deviations to force positive scores. However, this introduces two new problems. First, by squaring each standard deviation (σ) from the mean, this method of calculation gives more weight to outliers. Second, the variance is measured in units squared, rather than the units of the data set, and this complicates the direct relation of the variance to individual values in a data set.
The coefficient of variation (CV) is commonly used by investigators to quantify Tac IPV.7–13 The CV is represented by the ratio of the standard deviation (σ) to the mean (μ). The CV can also be described as the ratio of the square root of the variance (σ2) to the μ. In the computation of CV, the sum of squared deviations (σ2) is taken first and then the square root of the total is taken. Squared deviations introduce susceptibility to outliers as with variance. Other investigators have used the mean absolute deviation (MAD) for the quantification of Tac IPV.5,14–17 The MAD takes the absolute value of deviations from the mean to eliminate negative values from the data set. In contrast to the CV, by using absolute deviations rather than squared deviations, the MAD is less susceptible to outliers.
3.1 |. Measurement considerations
3.1.1 |. Time period
The early phase after transplantation is often characterized by wide fluctuations in Tac exposure due to frequent Tac dose changes and hospitalizations. Hospitalizations for acute rejection episodes, gastrointestinal illnesses, or infection often correspond with larger values for Tac variability. During this time, Tac pharmacokinetics are subject to influence from interacting medications (eg, antibiotics and glucocorticoids), concurrent diseases, and frequent dose adjustments from changes in goal levels due to potential or actual Tac toxicities.6 Previous studies have accounted for these issues by including only Tac trough concentrations measured after the early posttransplant phase (see Table 1: Posttransplant Time Period). The definition of the early posttransplant period differs based on institution-specific protocols but can be conservatively defined as the first 6 months posttransplantation.
Rozen-Zvi et al used a time-weighted coefficient of variation (TWCV) calculation to assess Tac trough concentrations measured within the first 6 months posttransplantation (Table 1). The TWCV, represented by the ratio of the time-weighted standard deviation (TWσ) to the time-weighted average (TWA), offers several potential advantages over the standard CV measure. The TWCV reduces the effect of short periods of multiple measurements (eg, during hospitalizations) on the calculated IPV.11 By minimizing the impact of such repeat measures, investigators may be able to include Tac trough concentrations measured in the immediate posttransplant phase.11 Of note, the higher Tac IPV reported by Rozen-Zvi et al compared to previous studies is likely attributable to the inclusion of the early posttransplant period (Table 1). Despite being conceptually advantageous, the TWCV calculation may be outweighed by its relative complexity compared to other approaches and its limited practice. Because the TWCV method has only been employed by this unique research team, there is also uncertainty regarding its application elsewhere.
Similarly, the long-term evaluation of Tac IPV is complicated by limited evidence. The current body of research focuses primarily on the time period between 6 and 12 months after transplantation. However, a few studies have assessed Tac IPV and associated outcomes beyond 12 months after transplantation. Sapir-Pichhadze et al used time-dependent Cox proportional hazard models to examine the association between Tac IPV, starting at 1-year posttransplant, and a composite end point of late rejection, transplant glomerulopathy, or total graft loss (including death). Using the standard deviation of Tac (TacSD) levels to calculate IPV, researchers found a 27% increase in adjusted hazard for the composite end point for every 1-unit increase in TacSD.18 Rahamimov et al published a novel study that approached the issue of long-term Tac IPV evaluation by calculating cumulative CV across 6-month time increments for a median follow-up time of 3.5 years. The results have demonstrated that an increase in cumulative Tac IPV was associated with an increased risk of graft loss.12 These findings highlight the importance of long-term Tac IPV calculations as it is related to poorer graft outcomes. Researchers and clinicians should consider the value of evaluating long-term Tac IPV but proceed cautiously, as neither of these methods has been comprehensively studied prospectively, and they are not used in routine clinical practice.
Considerations:
Studies should use a lead in time of 6 months to allow for Tac stabilization when calculating CV or MAD Researchers and clinicians should use caution when calculating IPV using levels less than 6 months or beyond 12 months after transplantation. Studies have focused primarily on the time period between 6 and 12 months after transplantation and there are limited data regarding earlier or later time periods.
3.1.2 |. Dose normalization
Although the consideration of the time period over which Tac trough concentrations are collected allows investigators to control for changes in Tac doses, not all patients will be treated with a stable dose and goal trough range during the time period of interest. Some investigators have addressed this issue by correcting the Tac trough concentrations with the drug dosage (C0/D)9,14–17 (see Table 1: Dose Normalized). However, dose normalization is a measure of variability of Tac absorption and a proxy for Tac IPV clearance rather than exposure. Typically, inconsistency in Tac absorption is not likely to be the driving factor associated with adverse outcomes. Thus, dose normalization may not be necessary when evaluating Tac IPV.
Consideration:
Dose normalization may not be necessary when evaluating Tac IPV
3.1.3 |. Number of trough concentrations
Based on the statistics utilized, a minimum of two Tac trough concentrations are required to calculate Tac IPV. However, investigators commonly include a minimum of three Tac trough concentrations for each patient in their assessments9,10,14,15 (see Table 1: Number of Levels Assessed). Studies have reported the median number of Tac trough concentrations included in the calculation of Tac IPV ranging from 3 to 1515,18 (see Table 1: IPV Reported). The mean number of levels reported range from 4.6 to 20.7.5,10,11,12,16,17 Clearly, the more levels that are included, the better confidence a clinician has regarding the accuracy of the Tac IPV estimate.
Consideration:
Include a minimum of 3 Tac trough concentrations in the Tac IPV estimate for each patient. Those without at least 3 measures should not have a Tac IPV estimated
3.1.4 |. Excluding outlier Tac trough measurements
As mentioned previously, transplant recipients who are hospitalized for acute rejection, infection, or other issues are subject to changes in Tac pharmacokinetics, Tac doses, Tac trough goals, and thus Tac IPV. Therefore, levels measured while patients are in the hospital may not be truly representative of adherence and can greatly skew Tac IPV. Furthermore, the increase in Tac trough concentration monitoring frequency that occurs during these hospitalizations introduces the possibility of measurement bias. Several studies have demonstrated that Tac IPV is influenced by the number of Tac trough concentrations included in the analysis.9,14,15 A more accurate estimation of true Tac IPV (a lower value) would be expected with an increasing number of available measurements, but often the increasing frequency of measurements corresponds with clinical problems (eg, drug-drug interactions, illness) associated with higher Tac IPV.6 These offsetting issues make it difficult to truly understand the full implications of including Tac trough concentrations obtained during hospitalization on accurate assessments of Tac IPV. Other nonrepresentative Tac trough concentrations should also be excluded from the Tac IPV estimate. Previous studies have investigated erroneous levels and excluded those that were determined to not be true trough levels9,16 (Table 1). For instance, levels that are not obtained from blood samples drawn before the patient takes the morning dose of Tac should be excluded. Methods to do this in an autonomous manner should be explored, and these may include eliminating elevated Tac troughs (>20 ng/mL) that are measured after when most patients take their morning dose of medications (9:00 or 10:00 AM). It is also important to consider removing evening measures of Tac, as diurnal variation in levels has been established with this agent2 (see Table 1: Levels Included and Excluded).
Considerations:
Only outpatient Tac trough concentrations should be included in calculations. Furthermore, it is likely best-practice to set up an algorithm that systematically eliminates levels that are likely not to be true trough measurements (drawn after a certain time).
4 |. IMPACT OF TAC IPV ON CLINICAL OUTCOMES
4.1 |. Graft survival
There are several studies demonstrating significant associations between high Tac IPV and graft outcomes. The objectives and outcomes of these studies are summarized in Table 2. Borra et al were the first to demonstrate that high IPV in Tac clearance is associated with reduced long-term kidney allograft outcomes. In a cohort of 297 kidney recipients who received Tac and mycophenolate (MMF), IPV was calculated from outpatient trough concentrations measured between 6 and 12 months after transplantation and normalized for the Tac dose to estimate Tac clearance. IPV of the Tac clearance was correlated with a primary composite end point of graft loss, biopsyproven chronic allograft nephropathy, or doubling of serum creatinine in the 12 months following the IPV clearance measurement. After a mean follow-up of 5.1 ± 1.6 years, 11.4% (34/297) of patients reached the composite end point. Using the median (14.9%, mean 17%), patients were divided into low variability (n = 148, mean Tac IPV 9.6%) and high variability (n = 149, mean Tac IPV 24.2%) cohorts. There were significantly more patients in the high IPV group that reached the composite end point (24/34, 70.6%) as compared to the low IPV group (10/34, 29.4%). Of interest, among patients who did not reach the primary end point, proportions of high (47.5%) and low (52.5%) variability patients were comparable.4 Notably, mean Tac concentrations did not differ between cases (failures) and controls.4 Multivariable analysis found Tac IPV to be a predictor of graft failure, together with recipient age and the acute rejection in the first year after transplant14 (Table 2). Later, Shuker et al conducted a follow-up study with a larger cohort of 808 patients and confirmed these results. The composite end point varied slightly from their first study to include graft failure, late biopsy-proven acute rejection (BPAR), transplant glomerulopathy, or doubling of serum creatinine concentration. Consistent with the original analysis, high Tac IPV was an independent predictor of adverse allograft outcomes. In multivariate Cox regression modeling, the risk of reaching the composite end point was significantly higher in the high IPV group as compared to the low IPV group (hazard ratio [HR] 1.41, 95% confidence interval [CI] 1.06–1.89, P = .019)15 (Table 2).
O’Regan et al investigated the relationship between Tac IPV and long-term graft survival using a primary end point of death-censored graft loss (Table 2). Different from previous studies, investigators analyzed both inpatient and outpatient Tac trough levels obtained between 3 and 12 months after kidney transplantation. The population of 394 patients was divided into 4 cohorts based on IPV quartiles (Q1: median IPV 6, Q2: median IPV 8, Q3: median IPV 10, Q4: median IPV 10). Kidney graft survival at 3 and 5 years after transplant was reported as follows: Q1: 100, 97%; Q2: 97, 93%; Q3: 94, 84%; Q4: 92, 87%. After adjusting for covariates, the hazard model demonstrated a 36% increased risk of death-censored graft loss per quartile increase (HR 1.36, 95% CI 1.05–1.78, P = .019).6 The increased risk for graft loss was confirmed later by another large retrospective study (n = 376)16 (Table 2). Goodall et al also supported this association by demonstrating that patients with high Tac IPV and missed clinic appointments were at increased risk of rejection and graft loss.13
Although previous studies estimated Tac IPV at 3 to 12 months after transplantation by calculating either CV or MAD, more recent studies employed a different technique11,12 (Table 1). Rozen-Zvi et al was the first to use TWCV to determine whether researchers could identify high-risk patients in the early posttransplant period. The primary end point was a composite of patient and graft survival. Using TWCV, all Tac trough concentrations measured up to 6 months after transplantation were used to estimate IPV in 803 patients. At 180 days after transplantation, mean IPV was 34.8 ± 21.3%. During a median follow-up of 3.7 years, there were 98 events, including 49 graft losses and 49 deaths. Cohorts were created using Tac IPV tertiles. In survival analysis, patients in the highest Tac IPV tertile had inferior survival compared to other tertiles (P = .002). Investigators also found a significant association between high Tac IPV and reduced graft survival using Cox regression models11 (Table 2). This study reported a higher mean Tac IPV compared to previous studies, which can be attributed to the inclusion of the early posttransplant phase (Table 1). In a recent paper, Rahamimov et al also used TWCV to demonstrate that reduction of exposure to high Tac IPV is associated with improved graft survival (Table 2). In a cohort of 878 patients, IPV was estimated using TWCV, and all Tac trough concentrations measured after 6 months posttransplant were included to assess a composite end point of patient and graft survival. Cumulative TWCV was calculated in additive 6-month increments, beginning 6 months after transplant. After a median follow-up of 3.5 years, 109 patients reached the composite end point. Mean cumulative TWCV from 6 months to the end of follow-up was 26.2%±12.9%. As a continuous variable, TWCV was associated with an increased risk of graft loss (HR 1.04 per percent, 95% CI 1.03–1.05, P < .001). Patients were also grouped according to TWCV tertiles. In multivariate survival analysis, the highest Tac IPV tertile had more than twice the risk of graft loss, as compared to the other two tertiles (HR 2.22, 95% CI 1.48–3.35, P < .001). To establish a cutoff value for TWCV as a predictor of graft survival, patients were grouped into 5 categories based on cumulative TWCV values: <20%, 20%–25%, 25%–30%, 30%–35%, and > 35%. Patients with a cumulative TWCV greater than 25% showed an increased risk of graft loss (HR 3.66, 95% CI 2.3–5.8, P < .001) and 25% was established as the cutoff value. Of interest, researchers also found that patients who had cumulative TWCV above 25% at any point during follow-up, but later resumed a cumulative TWCV less than 25%, had a hazard of graft loss that was not different from that of patients who had cumulative TWCV less than 25% for the entire duration of follow-up. In contrast, patients with a consistent cumulative TWCV greater than 25% showed a significant hazard of graft loss12 (Table 2). This demonstrates that changing the Tac IPV may actually reduce risk of graft loss. Ultimately, several studies have demonstrated a clear association between higher Tac IPV and an increased risk of graft loss. The calculation of Tac IPV is not only a readily available tool that can be used to identify at-risk patients but is also a potentially modifiable risk factor.
4.2 |. Acute rejection
Other investigators have correlated high Tac IPV with an increased risk of acute rejection (Table 2). Ro et al reported an association between high Tac IPV and risk of acute rejection after kidney transplantation in 249 adult Korean recipients. Tac IPV was calculated using outpatient trough concentrations measured between 6 and 12 months after transplant. Median IPV was 18.0% (mean 20.5%) and was used to group patients into low variability (n = 124) and high variability (n = 125) and to evaluate a primary outcome of acute rejection. The hazard of acute rejection development was higher in the high Tac IPV group compared to the low IPV group (HR 2.655, 95% CI 1.394–5.056, P = .003). The study also aimed to assess the impact of CYP3A5 polymorphism on graft outcomes in Asian patients as a secondary outcome. CYP3A5*1 expressers have increased Tac dose requirements and are theoretically more susceptible to higher Tac IPV.6 However, investigators did not find any significant difference in the incidence of acute rejection between CYP3A5 expressers and nonexpressers, although dose requirements were significantly higher in expressers5 (Table 2). Sapir-Pichhadze et al later sought to determine the impact of time-dependent Tac exposure on long-term kidney graft outcomes defined as a composite end point of late acute rejection, transplant glomerulopathy, graft loss, or death with function. Researchers used the standard deviation of Tac (TacSD) calculated from all trough levels measured beyond 12 months after transplantation to estimate Tac IPV. TacSD thresholds of > 1.5, >2.0, >2.5, and > 3.0 were used for analysis. After a median follow-up time of 3.72 years, 62 outcome events occurred. There was no significant difference in the 5-year cumulative incidence of the composite outcome between patients with TacSD >2 vs patients with TacSD ≤2. However, there was a significant increase in the adjusted hazard of the composite end point for every 1-unit increase in TacSD18 (Table 2). Whalen et al supported these findings, showing an increased incidence of acute rejection in high Tac IPV (n = 186) vs low Tac IPV (n = 190) groups (18.4% vs 8.6%, P = .0351).16 The ease and accessibility of calculating Tac IPV may allow for increased surveillance and targeted interventions to reduce incidence of acute rejection events.
4.3 |. De novo donor-specific antibodies (dnDSAs)
Medication nonadherence is an independent risk factor for dnDSA development.19 Because nonadherence had previously been suggested as a main driver behind high Tac IPV, Rodrigo et al hypothesized that patients with high Tac IPV would have more dnDSA development and worse graft outcomes (Table 2). In a cohort of 310 DSA negative adult kidney transplant recipients, IPV was calculated using outpatient Tac trough concentrations obtained between 4 and 12 months after transplantation. dnDSAs were prospectively analyzed at 1, 3, and 5 years and at 6 months before the last follow-up visit or graft loss. During a mean follow-up of 6.6 ± 3.7 years, 53 patients lost their graft, excluding death. A total of 116 patients (37.4%) were found to have a Tac IPV greater than 30%, and 39 patients (12.6%) reached the primary end point of dnDSA development. Tac IPV greater than 30%, along with acute rejection and retransplantation, was found to be an independent risk factor for the development of dnDSAs (HR 2.92, 95% CI 1.473–5.807, P = .002). Tac IPV >30% also increased the risk of death-censored graft loss (HR 2.613, 95% CI 1.361–5.016, P = .004).7 This study supported previous findings that showed patients with higher Tac IPV had worse kidney transplant outcomes. In addition, these findings provide further evidence that nonadherence plays a major role in Tac IPV.
More recent studies have further investigated the role that high Tac IPV plays in dnDSA development. Davis et al reported that immunologic risk associated with high Tac IPV can be attributed to time spent outside of therapeutic range.20 Using mean Tac IPV alone may overlook individuals at higher immunologic risk. Monitoring time spent outside of the therapeutic range, more specifically, time below therapeutic range, in conjunction with Tac IPV, may improve a clinician’s capacity to determine patients at risk for dnDSA development by providing a more detailed clinical picture.
4.4 |. Chronic immunologic-mediated graft injury
dnDSA development is considered to be closely related to the development of chronic active antibody-mediated rejection (c-aABMR), which similarly contributes substantially to unfavorable long-term graft outcomes. Several earlier studies defined graft failure as a composite end point (Table 2), which included the diagnosis of c-aABMR; however, the association between Tac IPV and c-aABMR was not analyzed separately until later. In a retrospective case-control study, Sablik et al found no association between high Tac IPV and c-aABMR. There were no differences in mean Tac IPV (measured over 3 preceding years) for patients with biopsy-proven c-aABMR diagnosis (n = 59) and matched controls (n = 189).17,18 However, high Tac IPV was associated with inferior graft survival in patients diagnosed with c-aABMR. c-aABMR cases with high Tac IPV (IPV > 24%) after diagnosis had inferior graft survival compared to cases with low Tac IPV (IPV ≤ 245) (9.9 vs 13.1 years, respectively, P = .04)17 (Table 2). Although there is a lack of evidence demonstrating that higher Tac IPV is associated with the occurrence of c-aABMR, it does unfavorably impact graft survival in patients with c-aABMR diagnosis. Tac IPV may be a readily available and useful in tool for clinicians when determining prognosis in c-aABMR cases. Larger-scale studies are needed to assess the impact of high Tac IPV on the risk of developing c-aABMR.
4.5 |. Histologic lesions
Specific patterns of histologic injury may precede the onset of graft dysfunction. Vanhove et al demonstrated that Tac IPV monitoring may be useful to predict the accelerated progression of chronic histologic lesions prior to the onset of renal dysfunction (Table 2). Tac IPV was calculated using true trough concentrations measured from 6 to 12 months after transplantation in a cohort of 220 kidney recipients. Patients had paired protocol (surveillance) biopsies available at 3 months and 2 years after transplantation.6 Patients were grouped into IPV tertiles with the following mean IPVs per tertile: T1: 9.8% ± 3.3%, T2: 18.3% ± 2.4%, T3: 31.1% ± 7.8%. Patients in the highest tertile (IPV > 22.1%) were found to have a mean increase in chronicity score of 1.97 ± 2.03 compared to 1.18 ± 2.44 in the middle tertile (P = .016) and 1.12 ± 1.80 in the lowest tertile (IPV < 14.4%; P = .023). The highest tertile cohort also had an increased risk of moderate to severe fibrosis and tubular atrophy by 2 years posttransplant, compared to the lowest tertile (odds ratio [OR] 2.47, 95% CI 1.09–5.60, P = .031 and OR 2.40, 95% CI 1.03–5.60, P = .043)9 (Table 2). The relationship between Tac IPV and the evolution of histologic legions described in this study reinforce the value of Tac IPV as a predictor for poor graft outcome.
5 |. TAC IPV AND CLINICAL IMPLICATIONS FOR PATIENT MONITORING AND MANAGEMENT
Clearly, there is a significant and growing body of literature to support the association between high Tac IPV and deleterious graft outcomes. Figure 1 provides a conceptual model of the relationship between high Tac IPV and graft loss in kidney transplantation derived from this body of evidence. For the purposes of this paper, we focus on medication nonadherence as the primary determinant of high Tac IPV. For the clinician caring for transplant recipients, the salient questions that need to be answered moving forward are: (a) Does high Tac IPV actually cause harm to the graft? (b) Is high Tac IPV a true direct measure of nonadherence or is it related to other biologic factors? (c) Is high Tac IPV mutable? and (d) If Tac variability is reduced, does that improve clinical outcomes? If Tac IPV is to be considered a clinically relevant and useful metric, these questions need to be addressed.
In terms of high Tac IPV causing deleterious graft outcomes, the supporting evidence is all observational and thus impedes the ability to fully distinguish between causality and noncausal association. However, a popular set of criteria proposed by Sir Austin Bradford Hill can be used as a tool for casual inference from observational data.21 The existing body of evidence satisfies most of Hill’s relevant criteria for causality, including strength, consistency, specificity, temporality, biologic gradient, and plausibility. The strong associations observed across several of these studies5,7–18 in the absence of considerable conflicting evidence or confounding supports the strength of this evidence. Results are consistent across studies analyzing graft outcomes5,8,11,12,13 and rejection14–16,18 in kidney transplant recipients. Each study within the body of evidence demonstrates that higher Tac IPV leads to inferior graft outcomes due to immunologic effects. This common finding between individual studies upholds the criteria for specificity. All studies reviewed in this article meet the criteria for temporality, as exposure to high Tac IPV always preceded the outcomes of interest. Several studies demonstrated the existence of a dose-response curve to satisfy the criteria for biologic gradient. For instance, Sapir et al demonstrated that every 1-unit increase in TacSD led to a 27% increased hazard for deleterious graft outcomes.18
We must also consider the plausibility of the hypothesis that higher Tac IPV leads to inferior kidney transplant outcomes. By considering that patients with higher tacrolimus IPV are subject to trough concentrations frequently above or below the therapeutic window and, therefore, may be at risk of underexposure and rejection or overexposure and toxicity, this criterion can be satisfied. Tac IPV measures the variability in tacrolimus trough concentrations and thus can be theoretically considered a direct measure of adherence. In most studies, it is hypothesized that high Tac IPV is primarily due to nonadherence, but the empirical evidence fully supporting this is not strong. Previous studies are limited by retrospective study designs and lack of available adherence data. However, the recent findings of Leino et al provide the first prospective assessment of Tac IPV in the setting of strictly controlled adherence. This study assessed adherence across both indirect and direct adherence measures, as compared to previous studies where adherence could not be analyzed. In this highly adherent study population, the median Tac IPV reported was 15.2%, whereas a highly variable drug is frequently defined as one exhibiting an IPV greater than 30%. These results indirectly suggest that in the absence of nonadherence, Tac is not a highly variable drug.7 In addition, more recent studies have reported both minor and significant improvements in Tac IPV following adherence interventions.3,22,23
Next, it is important to understand if Tac IPV is feasibly mutable. In theory, if high Tac IPV is predominately due to nonadherence, then improving adherence through behavioral interventions should reduce variability. There are a number of studies that provide some level of evidence to support the mutability of Tac IPV. More recently, McGillicuddy et al published findings from a prospective, parallel-arm, randomized-controlled trial investigating a new method of adherence intervention. A total of 80 patients were evenly randomized to either the intervention arm or standard of care. The intervention arm utilized an electronic medication tray, Bluetooth-enabled blood pressure (BP) monitor, and mHealth app to monitor adherence. Participants in the control group received text messages containing healthy lifestyle tips. Investigators assessed Tac IPV using a cumulative average of CV assessed at monthly intervals. Patients randomized to the intervention arm showed a significant reduction in mean cumulative Tac IPV (P = .046) compared to the control group. In addition, patients in the intervention arm had significant improvement in the proportion of patients achieving Tac IPV <40% (P = .001) compared to the control arm.3 This is the first clinical trial to provide evidence for an intervention capable of significantly improving Tac IPV.
Several other investigators sought to improve nonadherence by switching transplant recipients from a twice-daily immediate release (IR) to a once-daily extended release (XR) Tac formulation. The argument could be made that missed doses are of greater impact in a once-daily vs twice-daily regimen; however, there is evidence demonstrating that a reduction in dosing frequency leads to a higher percentage of prescribed doses taken.24 Kuypers et al conducted a prospective, randomized controlled trial in which 219 patients were randomized 2:1 between the two formulations. Prior to randomization, study participants continued the twice-daily IR Tac regimen and baseline adherence data were collected. Adherence was measured throughout the study using an electronic medication intake monitor. Among patients who switched to the once-daily regimen, 88.2% took the prescribed number of daily doses as compared to 78.8% in the twice-daily group (P = .0009). These findings suggest that regimen implementation is significantly superior for patients on a once-daily Tac regimen compared to twice-daily.25 A few studies have aimed to determine whether switching from twice-daily to once-daily Tac not only improved adherence, but also Tac IPV, but the evidence is conflicting. In an early prospective study, Tac IPV was calculated for 129 kidney transplant patients on twice-daily Tac regimens. Subjects were converted to once-daily Tac and Tac IPV was assessed 1-week postconversion and every 2–4 weeks thereafter. Investigators found that, compared with before conversion, fewer patients had a Tac IPV greater than 22.5% after conversion (3.1% vs 17.4%, P < .01).22 In a more recent pharmacokinetic study, a cohort of 40 kidney transplant recipients were switched from twice-daily to once-daily Tac and investigators compared the Tac IPV of each subject before and after the change. In contrast to the previous study, the observed improvement in Tac IPV after switching to the XR formulation was minor and unlikely to be clinically relevant.23 More studies are needed to investigate the value of switching from an IR to an XR Tac formulation.
Sufficient evidence exists to demonstrate that high Tac IPV, as a proxy measure of nonadherence, can lead to acute rejection and impact graft loss. As such, it can be considered an additional measure utilized by clinicians to identify at-risk patients. Interventions aimed at reducing high Tac IPV through improving adherence may optimize clinical outcomes, but future clinical trials are warranted. Upcoming research should also address other uncertainties regarding Tac IPV evaluation. Investigators should focus on better defining a best cutoff value, describing mechanisms of variability, and the relationship between nonadherence and Tac IPV. Additional efforts are needed to define methods of IPV evaluation in the early posttransplant period as well as long-term. Furthermore, research should aim to expand on the impact of interventions to reduce Tac IPV on both variability and graft outcomes. In terms of measurement, clinicians should consider using the CV calculation to estimate Tac IPV. During long-term follow-up, providers should estimate Tac IPV as a method to identify atrisk patients and to triage workload. In terms of a cut point, patients with Tac IPV >30% or >40% should be considered high risk.
Abbreviations:
- 95% CI
95% confidence interval
- AR
acute rejection
- BPAR
biopsy-proven acute rejection
- C0
trough concentration
- c-aABMR
chronic active antibody-mediated rejection
- CV
coefficient of variation
- CYP3A5
cytochrome P450 3A5
- DBS
dried blood spot
- dnDSA
de novo donor-specific antibody
- eGFR
estimated glomerular filtration rate
- HR
hazard ratio
- HV
high variability
- IPV
intrapatient variability
- IQR
interquartile range
- IR
immediate release
- IS
immunosuppression
- LV
low variability
- MAD
mean absolute deviation
- MEMS
medication event monitoring systems
- MMF
mycophenolate mofetil
- NODAT
new-onset diabetes after transplant
- Scr
serum creatinine
- SRTR
Scientific Registry of Transplant Recipients
- Tac
tacrolimus
- TacSD
standard deviation of tacrolimus
- TDM
therapeutic drug monitoring
- TWCV
time-weighted coefficient of variation
- Tx
transplant
- XR
extended release
Footnotes
DISCLOSURE
The authors have no conflicts of interest to disclose as described by the American Journal of Transplantation.
DATA AVAILABILITY STATEMENT
Data sharing is not applicable to this article as no new data were created or analyzed during this review.
REFERENCES
- 1.Hart A, Smith JM, Skeans MA, et al. OPTN/SRTR 2017 annual data report: kidney. Am J Transplant. 2019;19(S2):19–123. [DOI] [PubMed] [Google Scholar]
- 2.Staatz CE, Tett SE. Clinical pharmacokinetics and pharmacodynamics of tacrolimus in solid organ transplantation. Clin Pharmacokinet. 2004;43(10):623–653. [DOI] [PubMed] [Google Scholar]
- 3.McGillicuddy JW, Sox L, Chandler J, Treiber F, Taber D. Impact of an mHealth, electronic pillbox intervention on tacrolimus variability in kidney transplantation: results of a prospective randomized clinical trial [abstract]. Am J Transplant. 2019;19;(suppl:3):1149–1150. [Google Scholar]
- 4.Shuker N, van Gelder T, Hesselink DA. Intra-patient variability in tacrolimus exposure: causes, consequences for clinical management. Transplant Rev. 2015;29(2):78–84. [DOI] [PubMed] [Google Scholar]
- 5.Ro H, Min S-I, Yang J, et al. Impact of tacrolimus intraindividual variability and CYP3A5 genetic polymorphism on acute rejection in kidney transplantation. Ther Drug Monit. 2012;34(6):680–685. [DOI] [PubMed] [Google Scholar]
- 6.Kuypers DR. Intra-patient variability of tacrolimus exposure in solid organ transplantation: a novel marker for clinical outcome. Clin Pharmacol Ther. 2020;107(2):347–358. [DOI] [PubMed] [Google Scholar]
- 7.Leino AD, King EC, Jiang W, et al. Assessment of tacrolimus intrapatient variability in stable adherent transplant recipients: establishing baseline values. Am J Transplant. 2019;19(5):1410–1420. [DOI] [PubMed] [Google Scholar]
- 8.O’Regan JA, Canney M, Connaughton DM, et al. Tacrolimus trough-level variability predicts long-term allograft survival following kidney transplantation. J Nephrol. 2016;29(2):267–276. [DOI] [PubMed] [Google Scholar]
- 9.Vanhove T, Vermeulen T, Annaert P, Lerut E, Kuypers DR. High intrapatient variability of tacrolimus concentrations predicts accelerated progression of chronic histologic lesions in renal recipients. Am J Transplant. 2016;16(10):2954–2963. [DOI] [PubMed] [Google Scholar]
- 10.Rodrigo E, Segundo DS, Fernández-Fresnedo G, et al. Within-patient variability in tacrolimus blood levels predicts kidney graft loss and donor-specific antibody development. Transplantation. 2016;100(11):2479–2485. [DOI] [PubMed] [Google Scholar]
- 11.Rozen-Zvi B, Schneider S, Lichtenberg S, et al. Association of the combination of time-weighted variability of tacrolimus blood level and exposure to low drug levels with graft survival after kidney transplantation. Nephrol Dial Transplant. 2017;32:393–399. [DOI] [PubMed] [Google Scholar]
- 12.Rahamimov R, Tifti-Orbach H, Zingerman B, et al. Reduction of exposure to tacrolimus trough level variability is associated with better graft survival after kidney transplantation. Eur J Clin Pharmacol. 2019;75:951–958. [DOI] [PubMed] [Google Scholar]
- 13.Goodall DL, Willicombe M, McLean AG, Taube D. High intrapatient variability of tacrolimus levels and outpatient clinic nonattendance are associated with inferior outcomes in renal transplant patients. Transplant Direct. 2017;3(8):e192. [DOI] [PMC free article] [PubMed] [Google Scholar]
- 14.Borra LC, Roodnat JI, Kal JA, Mathot RA, Weimar W, van Gelder T. High within-patient variability in the clearance of tacrolimus is a risk factor for poor long-term outcome after kidney transplantation. Nephrol Dial Transplant. 2010;25(8):2757–2763. [DOI] [PubMed] [Google Scholar]
- 15.Shuker N, Shuker L, van Rosmalen J, et al. A high intrapatient variability in tacrolimus exposure is associated with poor long-term outcome of kidney transplantation. Transpl Int. 2016;29(11):1158–1167. [DOI] [PubMed] [Google Scholar]
- 16.Whalen HR, Glen JA, Harkins V, et al. High intrapatient tacrolimus variability is associated with worse outcomes in renal transplantation using a low-dose tacrolimus immunosuppressive regime. Transplantation. 2017;101(2):430–436. [DOI] [PubMed] [Google Scholar]
- 17.Sablik KA, Clahsen-van Groningen MC, Hesselink DA, van Gelder T, Betjes MG. Tacrolimus intra-patient variability is not associated with chronic active antibody mediated rejection. PLoS ONE. 2018;13(5):e0196552. [DOI] [PMC free article] [PubMed] [Google Scholar]
- 18.Sapir-Pichhadze R, Wang Y, Famure O, Li Y, Kim SJ. Time-dependent variability in tacrolimus trough blood levels is a risk factor for late kidney transplant failure. Kidney Int. 2014;86(6):1404–1411. [DOI] [PubMed] [Google Scholar]
- 19.Wiebe C, Gibson IW, Blydt-Hansen TD, et al. Evolution and clinical pathologic correlations of de novo donor-specific HLA antibody post kidney transplant. Am J Transplant. 2012;12:1157. [DOI] [PubMed] [Google Scholar]
- 20.Davis S, Gralla J, Klem P, Stites E, Wiseman A, Cooper J. Tacrolimus intrapatient variability, time in therapeutic range, and risk of de novo donor-specific antibodies. Transplantation. 2020;104(4):881–887. [DOI] [PubMed] [Google Scholar]
- 21.Hill AB. The environment and disease: association or causation? Proc R Soc Med. 1965;58:295–300. [DOI] [PMC free article] [PubMed] [Google Scholar]
- 22.Wu M-J, Cheng C-Y, Chen C-H, et al. Lower variability of tacrolimus trough concentration after conversion from Prograf to Advagraf in stable kidney transplant recipients. Transplantation. 2011;92:648–652. [DOI] [PubMed] [Google Scholar]
- 23.Stifft F, Stolk L, Undre N, van Hooff JP, Christiaans M. Lower variability in 24-hour exposure during once-daily compared to twice-daily tacrolimus formulation in kidney transplantation. Transplantation. 2014;97(7):775–778. [DOI] [PubMed] [Google Scholar]
- 24.Saini SD, Schoenfield P, Kaulback K, et al. Effect of medication dosing frequency on adherence in chronic diseases. Am J Manage Care. 2009;15:e22. [PubMed] [Google Scholar]
- 25.Kuypers DRJ, Peeters PC, Sennesael JJ, et al. Improved adherence to tacrolimus once-daily formulation in renal recipients: a randomized controlled trial using electronic monitoring. Transplantation. 2013;95:333–340. [DOI] [PubMed] [Google Scholar]
Associated Data
This section collects any data citations, data availability statements, or supplementary materials included in this article.
Data Availability Statement
Data sharing is not applicable to this article as no new data were created or analyzed during this review.