Abstract
Purpose
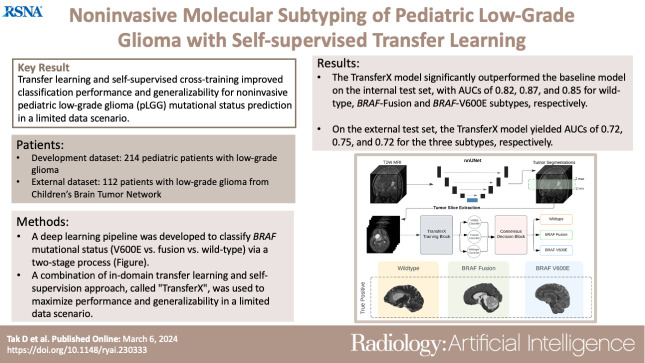
To develop and externally test a scan-to-prediction deep learning pipeline for noninvasive, MRI-based BRAF mutational status classification for pediatric low-grade glioma.
Materials and Methods
This retrospective study included two pediatric low-grade glioma datasets with linked genomic and diagnostic T2-weighted MRI data of patients: Dana-Farber/Boston Children’s Hospital (development dataset, n = 214 [113 (52.8%) male; 104 (48.6%) BRAF wild type, 60 (28.0%) BRAF fusion, and 50 (23.4%) BRAF V600E]) and the Children’s Brain Tumor Network (external testing, n = 112 [55 (49.1%) male; 35 (31.2%) BRAF wild type, 60 (53.6%) BRAF fusion, and 17 (15.2%) BRAF V600E]). A deep learning pipeline was developed to classify BRAF mutational status (BRAF wild type vs BRAF fusion vs BRAF V600E) via a two-stage process: (a) three-dimensional tumor segmentation and extraction of axial tumor images and (b) section-wise, deep learning–based classification of mutational status. Knowledge-transfer and self-supervised approaches were investigated to prevent model overfitting, with a primary end point of the area under the receiver operating characteristic curve (AUC). To enhance model interpretability, a novel metric, center of mass distance, was developed to quantify the model attention around the tumor.
Results
A combination of transfer learning from a pretrained medical imaging–specific network and self-supervised label cross-training (TransferX) coupled with consensus logic yielded the highest classification performance with an AUC of 0.82 (95% CI: 0.72, 0.91), 0.87 (95% CI: 0.61, 0.97), and 0.85 (95% CI: 0.66, 0.95) for BRAF wild type, BRAF fusion, and BRAF V600E, respectively, on internal testing. On external testing, the pipeline yielded an AUC of 0.72 (95% CI: 0.64, 0.86), 0.78 (95% CI: 0.61, 0.89), and 0.72 (95% CI: 0.64, 0.88) for BRAF wild type, BRAF fusion, and BRAF V600E, respectively.
Conclusion
Transfer learning and self-supervised cross-training improved classification performance and generalizability for noninvasive pediatric low-grade glioma mutational status prediction in a limited data scenario.
Keywords: Pediatrics, MRI, CNS, Brain/Brain Stem, Oncology, Feature Detection, Diagnosis, Supervised Learning, Transfer Learning, Convolutional Neural Network (CNN)
Supplemental material is available for this article.
© RSNA, 2024
Keywords: Pediatrics, MRI, CNS, Brain/Brain Stem, Oncology, Feature Detection, Diagnosis, Supervised Learning, Transfer Learning, Convolutional Neural Network (CNN)
Summary
The authors developed and externally tested an automated, scan-to-prediction deep learning pipeline that accurately classifies BRAF mutational status in pediatric low-grade gliomas from T2-weighted MRI scans with high area under the receiver operating characteristic curve.
Key Points
■ A deep learning approach combining self-supervision and transfer learning (TransferX) enabled the development of a scan-to-prediction pipeline for subtype classification of pediatric low-grade glioma mutations (BRAF wild type, BRAF fusion, or BRAF V600E). Center of mass distance was introduced as an evaluation metric to quantify the model’s attention around the tumor.
■ TransferX enabled scan-to-prediction pipeline-classified BRAF molecular subtypes with an area under the receiver operating characteristic curve of 0.82 or more for the internal test and 0.72 or more for the external test.
Introduction
Pediatric low-grade gliomas (pLGGs) are the most common pediatric brain tumors, comprising up to 40% of tumors in this population (1). These tumors exhibit diverse clinical outcomes and molecular characteristics, often driven by an activating BRAF mutation, either the BRAF V600E point mutation or fusion events. Molecular classification and segregation of BRAF wild type tumors from BRAF subtypes is vital for accurate treatment selection and risk stratification in pLGG, particularly given the emergence of novel BRAF-directed therapies (2). The presence of the BRAF V600E mutation, found in 15%–20% of cases, was historically associated with poor survival, particularly when combined with CDKN2A deletion (3), though with targeted BRAF pathway-directed therapies, this may be changing. BRAF V600E–mutated pLGG also exhibits an increased risk of malignant transformation, although patients with BRAF fusion and neurofibromatosis type 1 have favorable outcomes (4). An accurate distinction between BRAF wild type, BRAF fusion, and BRAF V600E tumors plays a crucial role in determining prognosis and optimal treatment strategy.
Surgical resection for pLGGs allows for assessment of mutational status. However, in more than one-third of cases, resection, or even biopsy, may not be feasible or recommended (5). In these situations, children may require alternative therapies to control a symptomatic tumor or undergo periodic MRI surveillance. Therefore, noninvasive imaging-based tumor molecular subtyping, if accurate and reliable, could enable proper selection of patients for BRAF-targeted therapies and clinical trials. In recent years, deep learning (DL) has emerged as the forefront technology for analyzing medical images (6,7) and has demonstrated numerous successful applications, encompassing tumor segmentation (8–10), outcome prediction (11,12), and tumor and molecular classification (13,14). However, DL performance degrades considerably in limited data scenarios due to instability, overfitting, and shortcut learning (15), and a key barrier to applying DL to pLGG imaging is the lack of training data available for these rare tumor cases. For these reasons, using DL for pLGG mutational classification has had limited success. Another barrier to clinical usability is that most algorithms require manual tumor segmentation as input, which is resource intensive and requires specialized expertise. A few studies have been published investigating pLGG BRAF mutation classification using DL (16) and a combination of DL and radiomics (17), but all present a single institution and lack external testing.
Here, we address these gaps by developing and externally testing, to our knowledge, the first imaging-based automated, scan-to-prediction DL pipeline capable of noninvasive BRAF mutational status prediction for pLGGs. The pipeline comprises built-in pLGG segmentation, BRAF mutation classifiers, and a consensus decision block to predict BRAF mutation status. We leverage the pLGG dataset as our developmental dataset and a novel combination of in-domain transfer learning and self-supervision approach, called TransferX, to maximize performance and generalizability in a limited data scenario. Additionally, to improve interpretability of our pipeline, we introduce a way to quantify the model attention via spatial maps, called center of mass distance (COMDist) analysis.
Materials and Methods
Study Design and Datasets
This study was conducted in accordance with the Declaration of Helsinki guidelines and was approved by the Dana-Farber/Boston Children’s Hospital (DF/BCH) and Children’s Brain Tumor Network (CBTN) institutional review boards. Waiver of the requirement for informed consent was obtained from the institutional review boards before research initiation due to the use of public datasets and retrospective nature of the study. This study involved two patient datasets. A development dataset from one high-volume academic institution, DF/BCH (n = 214), was used for training, internal testing, and hypothesis testing. This dataset included all children age 1–25 years, seen at the institution from 1994 to 2022, with a tissue-confirmed diagnosis of World Health Organization grade I–II glioma with BRAF mutational status information and available pretreatment T2-weighted brain MRI. A second dataset from the CBTN (n = 112) was used for external testing. This dataset included all patients from the publicly available CBTN pLGG cohort who had available T2-weighted brain MRI and confirmed World Health Organization grade I–II glioma tissue diagnosis and mutational status, as above. MRI acquisition details for both datasets are provided in Appendix S1. BRAF status was determined by OncoPanel, which performs targeted exome sequencing of 227–477 cancer-causing genes. BRAF mutational status may also have been captured by genomic sequencing via in-house polymerase chain reaction on tissue specimens. In cases in which neither could be performed, immunohistochemistry was used to determine V600E status. BRAF fusion status was determined by a gene fusion sequencing panel. DNA copy-number profiling via whole-genome microarray analysis was also performed in some patients. We reported our results in accordance with the Checklist for Artificial Intelligence in Medical Imaging guidelines (18). A portion of patients from the CBTN dataset (n = 140) and an additional subset of the DF/BCH dataset (n = 100) had been used in two previous studies (10,19). It is worth highlighting that these prior investigations were centered around tumor segmentation, whereas the present study was primarily dedicated to identifying BRAF mutational subtypes.
DL Pipeline
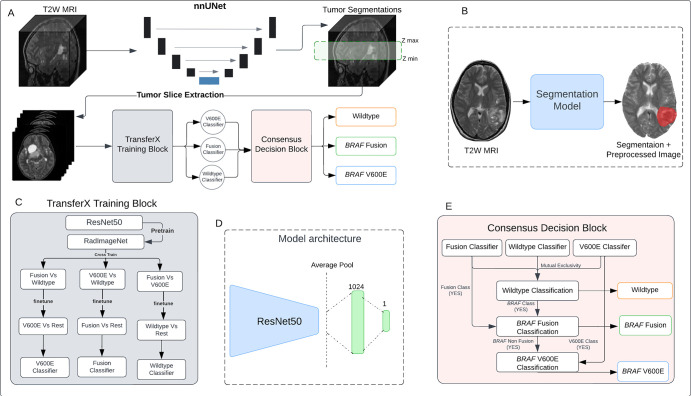
The proposed pipeline for mutation class prediction operates in two stages (Fig 1A). The initial stage involves T2-weighted MRI preprocessing (Appendix S2 and S3) and input to a nnU-Net–based three-dimensional tumor autosegmentation model previously developed, externally tested, and clinically benchmarked by our group (pipeline available at https://github.com/AIM-KannLab/pLGG_Segmentation) (10). This first stage outputs a preprocessed, skull-stripped image along with a corresponding segmentation tumor mask (Fig 1B, Appendix S4).
Figure 1:
(A) Schematic of the scan-to-prediction pipeline for molecular subtype classification. The pipeline inputs the raw T2-weighted (T2W) MRI scan and outputs the mutation class prediction. (B) Input and output depiction of the segmentation model from the first stage of the pipeline. The segmentation block also involves registration and preprocessing of the input scan. The output consists of the preprocessed input MRI scan along with the coregistered segmentation mask. (C) Flow diagram of the TransferX training block and approach. The TransferX algorithm is employed to train three individual subtype classifiers (BRAF wild type, BRAF fusion, and BRAF V600E). (D) The model architecture of the individual binary molecular subtype classifier. (E) Schematic of the consensus decision block. The block inputs the classification outputs and corresponding scores from the three individual subtype classifiers, fits them into a consensus logic, and outputs the final predictions. The mutational class predictions are output sequentially where the input is first checked for BRAF wild type or non-BRAF class first. If the input does not belong to a BRAF wild type or non-BRAF class, then the logic progresses to check the BRAF mutation class, with BRAF fusion checked first, followed by BRAF V600E.
The second stage of the pipeline encompasses three binary subtype classifiers (BRAF wild type vs rest, BRAF fusion vs rest, and BRAF V600E vs rest), each specifically trained to identify one of the following classes: BRAF wild type, BRAF fusion, and BRAF V600E (Appendix S4 and S5). For each subtype classifier, a ResNet-50 model (20) was chosen as the fundamental encoder for extracting feature embeddings from two-dimensional images, given its high performance on medical imaging classification problems (21,22) and the availability of pretrained network weights (23). The fully connected layers succeeding the average pooling layer of the ResNet-50 were replaced by a layer of 1024 neurons and a final layer of single neurons for binary classification (Fig 1D, Appendix S5). After binary classification from each binary subtype classifier, a consensus decision block collates the predictions from the classifiers, yielding the overall mutational status (Appendix S6) (Fig 1E). The final output of the consensus decision block and the pipeline consequently is a classification decision and its corresponding probability.
Three different strategies were investigated for training individual binary classifiers. The initial approach, training from scratch, involved initializing the binary classifier model with random weights. For the second approach, called RadImageNet Finetune, the classifier model was initiated with pretrained weights from RadImageNet (23) for the ResNet-50 model. This prior initialization was intended to yield superior feature embeddings compared with random weight initialization and training from scratch or out-of-domain transfer learning (24). The third approach, is called TransferX.
The TransferX approach starts with pretrained weights from RadImageNet but then adds two sequential stages of fine-tuning on separate but related classification tasks, which act as pretext tasks for self-supervision, followed by a final fine-tuning on the target class (Fig 1C). As an illustrative example, the training of a BRAF fusion classifier began with initialization via pretrained RadImageNet weights and sequential fine-tuning for BRAF V600E prediction, followed by BRAF wild type prediction and finally fine-tuning for BRAF fusion prediction. We hypothesized that combining transfer learning and self-supervised cross-training would enable the model to learn stronger, more generalizable features for mutational status prediction by exposure to different, though similar, classification problems. The models were trained to minimize loss at the axial section level on the development dataset and were tested on an internal test set (25% of data randomly selected; Appendix S3, Figs S3, S4) and external test set.
Performance Evaluation and Statistical Analysis
Because each MRI scan of each patient was factored into multiple tumor section images to generate aggregated patient-level predictions, the output probability scores of the individual two-dimensional axial images were averaged to calculate the patient level probability score. The patient-level classification was then done by applying a threshold on the patient level probability score.
 |
The primary performance end point was the area under the receiver operating characteristic curve (AUC) at the patient level for each mutational subtype (BRAF wild type, BRAF fusion, and BRAF V600E). The three DL approaches were initially evaluated on the internal test set, and the highest performing model was locked for external testing. Secondary end points included sensitivity and specificity, precision, and accuracy, which were calculated using the model output, thresholded to optimize the Youden index (25) on the internal test set. Post hoc calibration was applied on the internal test set, and model calibration was assessed graphically before and after calibration (Appendix S7; Fig S8). We compared AUCs for different models and calculated 95% CIs using the DeLong method (26). The standard error of the AUC was calculated considering the numbers of positive and negative cases in the sample and the derived variance of AUC. A two-sided P < .05 was considered statistically significant. Statistical metrics and curves were calculated using scikit-learn packages (27) in Python, version 3.8 (Python Software Foundation).
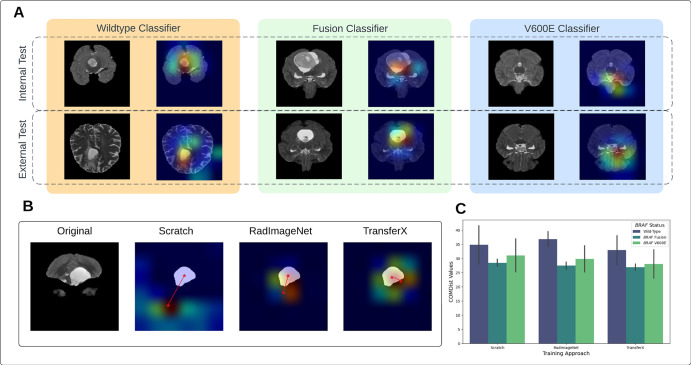
To enable the use of gradient-weighted class activation maps (Grad-CAM) (28) as a quantitative performance evaluation tool, we developed COMDist, a quantifiable metric for comparing Grad-CAM images across different methods. COMDist calculates and averages the distance (in millimeters) between the tumor’s center of mass (from the segmentation mask) and the center of mass of the Grad-CAM heatmap over the entire dataset, with smaller values indicating that the model is more accurately focusing on the tumor region.
Code Availability
The code of the DL system, as well as the trained model and statistical analysis, are publicly available at https://github.com/AIM-KannLab/BRAF_Classification.
Results
Patient Characteristics
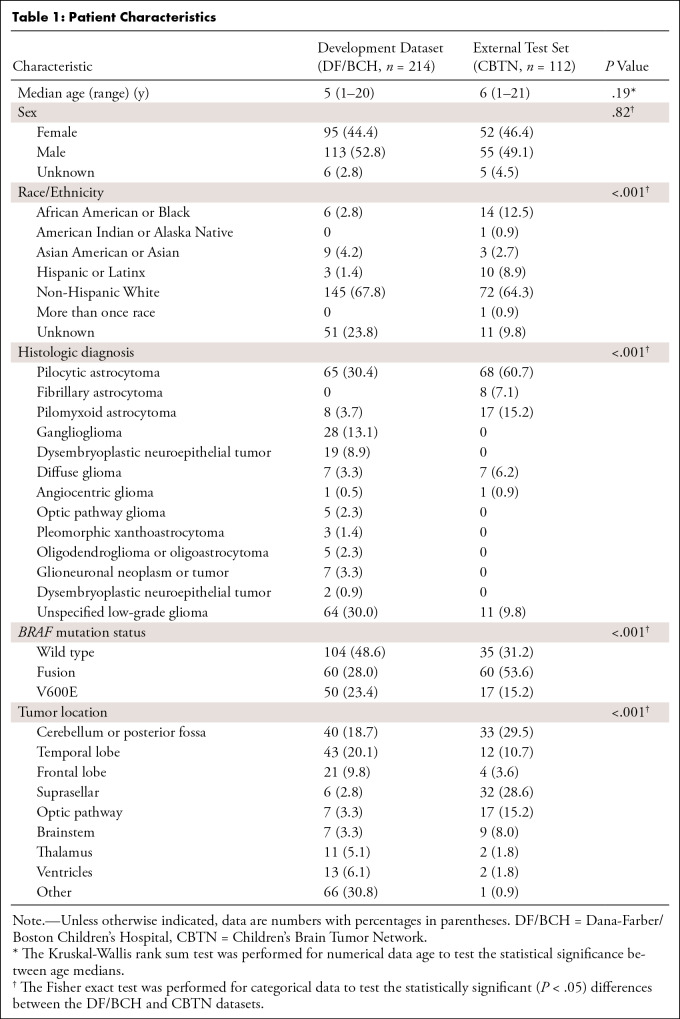
The total cohort of patients with pLGGs consisted of 326 patients from two cohorts: 214 patients in the development set from the DF/BCH cohort and 112 patients in the external test set from the CBTN cohort (Table 1). The median age was 5 years (range, 1–20) in the DF/BCH cohort and 6 years (range, 1–21) in the CBTN cohort. There were 113 (52.8%) male and 95 (44.4%) female patients (with six [2.8%] of unknown sex) in the DF/BCH cohort and 55 (49.1%) male and 51 (45.5%) female patients (with four [3.6%] of unknown sex) in the CBTN cohort. All patients had pathologically or clinically diagnosed grade I–II low-grade glioma, with a mixture of histologic subtypes and intracranial locations. The development dataset contained 104 (48.6%), 60 (28.0%), and 50 (23.4%) patients with BRAF wild type, BRAF fusion, and BRAF V600E mutation classes, respectively, and the external test dataset contained 35 (31.2%), 60 (53.6%), and 17 (15.2%) patients with BRAF wild type, BRAF fusion, and BRAF V600E mutation classes, respectively (Table 1). Age and sex were not associated with BRAF mutational status (Table S4, Fig S5). Categorical variables of tumor locations were one-hot encoded, and a logistic regression model was trained for each molecular subtype with an accuracy of 63%, 52%, and 59% for BRAF wild type, BRAF fusion, and BRAF V600E mutation classes, respectively, showing that tumor location cannot be employed as the only variable to perform molecular subtype classification.
Table 1:
Patient Characteristics
TransferX-enabled Pipeline Performance and Generalizability
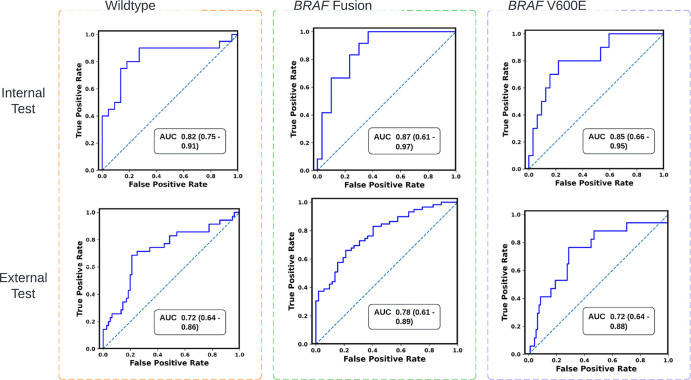
The pipeline with TransferX outperformed the pipeline with classifiers trained by RadImageNet FineTune and training from scratch for BRAF mutational status subtype prediction, with a classification AUC of 0.82 (95% CI: 0.72, 0.91), 0.87 (95% CI: 0.61, 0.97), and 0.85 (95% CI: 0.66, 0.95) compared with a classification AUC of 0.79 (95% CI: 0.67, 0.82), 0.73 (95% CI: 0.67, 0.89), and 0.75 (95% CI: 0.61, 0.83) when trained from scratch (all P < .05) for BRAF wild type, BRAF fusion, and BRAF V600E mutation classes, respectively (Figs 2, 3; Tables 2, S2). All training approaches, including TransferX, were most accurate at identifying BRAF fusion, followed by BRAF wild type and BRAF V600E. However, TransferX was the only approach to maintain an AUC of more than 0.80 for all individual subtype classifications (Figs 2, 3).
Figure 2:
Graphs of receiver operating characteristic curves of the scan-to-prediction pipeline’s predictions for all three molecular subtype classes on internal testing (n = 59) and external testing (n = 112). The models, trained with TransferX, form the individual subtype classifiers. The outputs of the subtype classifiers are pooled using consensus logic, resulting in the pipeline predictions for each mutation class. AUC = area under the receiver operating characteristic curve.
Figure 3:
Graph of the area under the receiver operating characteristic curve (AUC) is plotted and compared for the pipeline results with individual subtype classifiers trained using different training approaches (Scratch, RadImageNet FineTune, TransferX) for respective mutation class (BRAF wild type, BRAF fusion, and BRAF V600E). w.r.t. = with respect to.
Table 2:
Pipeline Performance for Classification of BRAF Status on Test Sets
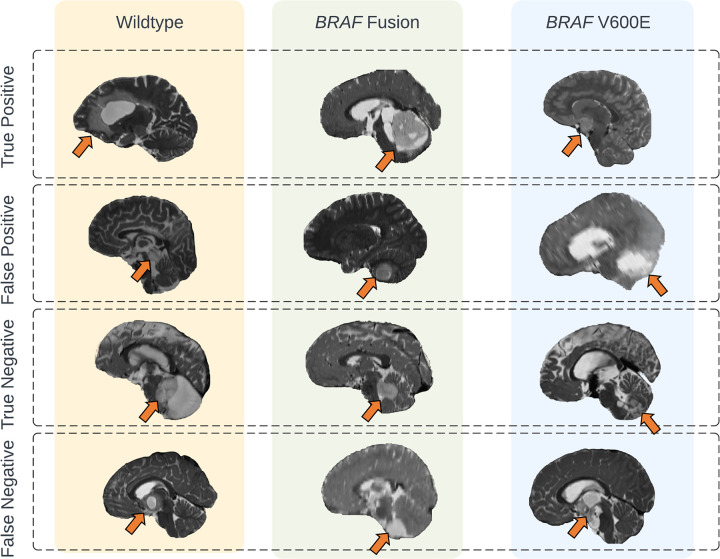
On external testing, there was a mild degradation in performance across all approaches, with TransferX still demonstrating the highest performance, with a classification AUC of 0.72 (95% CI: 0.64, 0.86), 0.78 (95% CI: 0.61, 0.89), and 0.72 (95% CI: 0.64, 0.88) compared with a classification AUC of 0.63 (95% CI: 0.54, 0.83), 0.68 (95% CI: 0.58, 0.81), and 0.60 (95% CI: 0.50, 0.70) when trained from scratch (all P < .01) for BRAF wild type, BRAF fusion, and BRAF V600E mutation classes, respectively (Figs 2, 3; Tables 2, S2). TransferX also demonstrated the best performance for classification of BRAF wild type versus any BRAF mutational class, with an AUC of 0.82 (95% CI: 0.75, 0.91) (Table 2, Fig 3). TransferX showed adequate calibration on the external test set, which was further improved after calibrating the model on the internal test set (Fig S8). TransferX also resulted in superior performance compared with the other training approaches when subtype classifiers (without consensus logic) were tested on the internal and external test sets for each subtype class (Fig S7, Table S3). Representative cases and model predictions are found in Figure 5.
Figure 5:
Representative prediction cases of the scan-to-prediction pipeline on the external dataset. The final scan-to-prediction pipeline consists of three subtype classifiers, trained using TransferX, further pooled together in consensus logic by the consensus decision block. Tumor lesions in the T2-weighted MRI scans are highlighted with arrows.
TransferX Yields Better COMDist Values
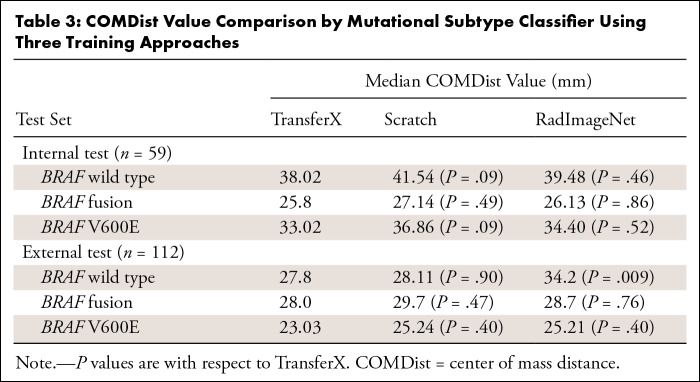
Grad-CAMs were generated for the three training approaches on the entire dataset (Fig 4), and corresponding COMDist scores were calculated for each molecular subtype with each training approach. TransferX consistently yielded the best average COMDist scores across all classification tasks, indicating improved model focus on intra- and peritumoral regions (Table 3, Fig 4C).
Figure 4:
(A) Gradient-weighted class activation map image overlay for each mutational class for internal and external test sets. (B) Center of mass distance (COMDist) representation for the three training approaches. (C) COMDist value comparison of the scan-to-prediction pipeline for each molecular subtype class, with corresponding individual subtype classifiers trained with the three different training approaches.
Table 3:
COMDist Value Comparison by Mutational Subtype Classifier Using Three Training Approaches
Discussion
pLGGs can arise in locations that make resection, and even biopsy, morbid and infeasible. In these situations, the ability to noninvasively detect BRAF mutational status via diagnostic imaging would be helpful to determine which patients may benefit from targeted therapies that act on the BRAF pathway and enrollment in clinical trials of novel targeted therapies. In this study, we developed and externally tested a scan-to-prediction algorithm to noninvasively predict BRAF mutational status of pLGGs that could be used in settings in which tissue diagnosis is infeasible (Fig 5). The limited quantity of data available for analysis has limited the translational potential of artificial intelligence in pediatric brain tumor analysis as compared with other malignancies. Our study overcomes this obstacle by combining elements of transfer learning and self-supervision to develop a high-performing model with a subtype classification AUC of 0.82 (95% CI: 0.72, 0.91), 0.87 (95% CI: 0.61, 0.97), and 0.85 (95% CI: 0.66, 0.95) for BRAF wild type, BRAF fusion, and BRAF V600E mutation classes, respectively, and maintains good performance on external testing with an AUC of 0.72 (95% CI: 0.64, 0.86), 0.78 (95% CI: 0.61, 0.89) and 0.72 (95% CI: 0.64, 0.88) for BRAF wild type, BRAF fusion, and BRAF V600E mutation classes, respectively, despite heterogeneous tumor and scanner characteristics. Additionally, we introduced COMDist, an interpretable metric to evaluate model attention with anatomic correlation that will help make medical imaging algorithms more trustworthy to clinical users. Our study findings contribute to bridging the gap between artificial intelligence development and clinical translation in a limited data scenario. To this end, we have published the code and pretrained models to provide usable tools for the scientific community and to encourage clinical testing.
With the emergence of novel BRAF pathway-directed therapies, the segregation of BRAF wild type tumor cases from BRAF subtypes in pLGGs has become critical. With an accuracy of 77% or more (internal) and 72% or more (external) for classifying BRAF wild type tumor cases versus BRAF cases (Table 2), the pipeline can be used as an assistive tool by clinicians to provide key information in settings in which tissue biopsy is infeasible or low-resource settings that preclude genomic analysis. Beyond BRAF classification, the pipeline’s ability to identify BRAF V600E, specifically, enables it to select patients for specific V600E inhibitors such as dabrafenib and trametinib, which have shown better progression-free survival than chemotherapy (29–31). The mild performance degradation observed on external testing may have been driven by notable differences in MRI parameters across institutions (Figs S1, S2). The model may perform better in scenarios in which MRI parameters are similar to training data. Importantly, the scan-to-prediction pipeline is practical and not reliant on manual segmentation, which is resource intensive and requires specialized expertise, nor hand-crafted radiomics features, which are notoriously difficult to generalize externally (32–34). Notably, the pipeline also exhibits robust performance in classifying tumors originating from challenging regions for biopsy (optic pathway, thalamus, and brainstem), which may enable more confidence for empirical treatment with targeted therapies if tissue diagnosis is infeasible.
pLGG mutational classification has been previously attempted in a few studies, most with manual segmentation-derived and/or pre-engineered radiomics (35–38), which are known to fail when applied to the external dataset. Radiomics features have been extracted from MR images and fitted to classifier models like XGBoost and SVM (17,35,36). One preprint study used neural networks to classify BRAF-mutational status in a single institution, though the algorithm required manual segmentation (16). The sensitivity of the dataset size on BRAF mutation classification performance was studied by Wagner et al (39) in a radiomics-based study. They showed that neural networks outperformed XGBoost for classification AUC and that the performance was affected by the size of the data used in training. In contrast, our study demonstrates that an end-to-end DL pipeline is feasible, even in a low-data setting, by using interclass cross-training combined with transfer learning. This idea has been explored more generally by Raouf et al (40) by relaxing the assumption of independence between multiple categories. TransferX expands on this work by dropping the assumptions of independence between different categories of a multiclass dataset with stepwise interclass training as a pretext task to learn robust feature representations. Furthermore, incorporating consensus decision logic to combine multiple binary classifiers also helped mitigate overfitting from the limited dataset.
Interpretability is a well-recognized, important factor for clinical translation of DL models. A variety of metrics, including Grad-CAM, saliency maps, and guided backpropagation, have been developed to depict the pixels that are contributing to maximum activation in the network and hence being more significant for classification (41,42). The GradCAM approach, although adding a degree of qualitative interpretability, has allowed for only case-by-case visualizations for the end user, which are not useful when trying to establish trust in a model overall. We expand the utility of GradCAM in this work with COMDist. By incorporating spatial knowledge of the tumor from autosegmentation, COMDist can quantify, in terms of distance, the model’s attention with respect to the correct, biologically rational region of interest in the image. COMDist provides the clinical user with a metric to gauge whether the model is basing its prediction on intratumoral information (as one would expect) or extemporaneous information far from the tumor (indicating an implausible model shortcut that should not be trusted). The metric can be reported case by case or in aggregate over a dataset to compare attention of different models. We expect this method will be valuable for the artificial intelligence research community as well as clinical end users evaluating and implementing medical imaging artificial intelligence applications in the clinic. COMDist should be considered exploratory at this time. We encourage further research and validation of this method to place it as a tool to gauge a model’s attention toward region of interest and also as a metric for comparing different training approaches.
This study had limitations. First, this work was retrospective and subject to the biases of our patient samples. We attempted to mitigate this effect of bias by using a blinded, external test set. Thus, we would encourage further independent validation of our results, including prospective testing. Additionally, the pipeline is exclusively based on T2-weighted MRI scans. Although T2-weighted images are the most common and available diagnostic sequence for pLGGs, contrast-enhanced T1-weighted, T1-weighted, T2-weighted fluid attenuated inversion recovery, and diffusion-weighted MRI may contain complementary information that enhances performance. Along with this, the properties of different imaging sequences and their correlation with different molecular subgroups warrant further investigation, which we aim to explore in future work. In this work, we decided to leverage a two-dimensional approach with section averaging to minimize overfitting on our limited dataset. It is possible that with further data collection, a three-dimensional approach may work better; however, this would substantially increase the model parameter size and thus make the model even more prone to overfitting. COMDist, in this work, was applied to model Grad-CAMs, which, while widely used, have been known to have limitations in expressing model interpretability (43). Of note, COMDist is agnostic to the saliency map method and can be used to evaluate various spatial attention maps. For instance, newer techniques like SmoothGrad IG (44) or XRAI (45) could be used to calculate COMDist estimates as well.
In summary, we developed and externally tested an imaging-based scan-to-prediction pipeline to analyze T2-weighted MRI as input and output BRAF-mutational subtype for pLGGs. We leveraged a novel combination of transfer learning and self-supervision to mitigate overfitting and develop a high-performing and generalizable model. We also proposed a novel evaluation metric, COMDist, that can be used to further assess performance and interpretability of artificial intelligence imaging models. Our resulting pipeline warrants prospective validation to determine if it could be clinically used in settings in which tissue and/or genomic testing is unavailable.
D.T. and Z.Y. contributed equally to this work.
This study was supported by the National Institutes of Health (U24CA194354, U01CA190234, U01CA209414, R35CA22052, and K08DE030216), the National Cancer Institute Spore grant (2P50CA165962), the European Union–European Research Council (866504), the RSNA (RSCH2017), the Pediatric Low-Grade Astrocytoma Program at the Pediatric Brain Tumor Foundation, and the William M. Wood Foundation.
Abbreviations:
- AUC
- area under the receiver operating characteristic curve
- CBTN
- Children’s Brain Tumor Network
- COMDist
- center of mass distance
- DF/BCH
- Dana-Farber/Boston Children’s Hospital
- DL
- deep learning
- Grad-CAM
- gradient-weighted class activation maps
- pLGG
- pediatric low-grade glioma
References
- 1. Ostrom QT, Price M, Neff C, et al. CBTRUS Statistical Report: Primary Brain and Other Central Nervous System Tumors Diagnosed in the United States in 2015–2019. Neuro Oncol 2022;24(Suppl 5):v1–v95. [DOI] [PMC free article] [PubMed] [Google Scholar]
- 2. Talloa D, Triarico S, Agresti P, et al. BRAF and MEK Targeted Therapies in Pediatric Central Nervous System Tumors. Cancers (Basel) 2022;14(17):4264. [DOI] [PMC free article] [PubMed] [Google Scholar]
- 3. Becker AP, Scapulatempo-Neto C, Carloni AC, et al. KIAA1549: BRAF Gene Fusion and FGFR1 Hotspot Mutations Are Prognostic Factors in Pilocytic Astrocytomas. J Neuropathol Exp Neurol 2015;74(7):743–754. [DOI] [PMC free article] [PubMed] [Google Scholar]
- 4. Marker DF, Pearce TM. Homozygous deletion of CDKN2A by fluorescence in situ hybridization is prognostic in grade 4, but not grade 2 or 3, IDH-mutant astrocytomas. Acta Neuropathol Commun 2020;8(1):169. [DOI] [PMC free article] [PubMed] [Google Scholar]
- 5. Sievert AJ, Fisher MJ. Pediatric low-grade gliomas. J Child Neurol 2009;24(11):1397–1408. [DOI] [PMC free article] [PubMed] [Google Scholar]
- 6. Razzak MI, Naz S, Zaib A. Deep Learning for Medical Image Processing: Overview, Challenges and the Future. In: Dey N, Ashour A, Borra S, eds. Classification in BioApps. Lecture Notes in Computational Vision and Biomechanics, vol 26. Springer, 2018; 323–350. [Google Scholar]
- 7. Litjens G, Kooi T, Bejnordi BE, et al. A survey on deep learning in medical image analysis. Med Image Anal 2017;42 :60–88. [DOI] [PubMed] [Google Scholar]
- 8. Hosny A, Bitterman DS, Guthier CV, et al. Clinical validation of deep learning algorithms for radiotherapy targeting of non-small-cell lung cancer: an observational study. Lancet Digit Health 2022;4(9):e657–e666. [DOI] [PMC free article] [PubMed] [Google Scholar]
- 9. Jain A, Huang J, Ravipati Y, et al. Head and Neck Primary Tumor and Lymph Node Auto-segmentation for PET/CT Scans. In: Andrearczyk V, Oreiller V, Hatt M, Depeursinge A, eds. Head and Neck Tumor Segmentation and Outcome Prediction. HECKTOR 2022. Lecture Notes in Computer Science, vol 13626. Springer, 2023; 61–69. [Google Scholar]
- 10. Boyd A, Ye Z, Prabhu S, et al. Expert-level pediatric brain tumor segmentation in a limited data scenario with stepwise transfer learning. medRxiv 2023.06.29.23292048 [preprint] 10.1101/2023.06.29.23292048. Posted September 18, 2023. Accessed September 2023. [DOI] [PMC free article] [PubMed] [Google Scholar]
- 11. Kazmierski M, Welch M, Kim S, et al. Multi-institutional Prognostic Modeling in Head and Neck Cancer: Evaluating Impact and Generalizability of Deep Learning and Radiomics. Cancer Res Commun 2023;3(6):1140–1151. [DOI] [PMC free article] [PubMed] [Google Scholar]
- 12. Ye Z, Saraf A, Ravipati Y, et al. Development and Validation of an Automated Image-Based Deep Learning Platform for Sarcopenia Assessment in Head and Neck Cancer. JAMA Netw Open 2023;6(8):e2328280. [DOI] [PMC free article] [PubMed] [Google Scholar]
- 13. Hollon T, Jiang C, Chowdury A, et al. Artificial-intelligence-based molecular classification of diffuse gliomas using rapid, label-free optical imaging. Nat Med 2023;29(4):828–832. [DOI] [PMC free article] [PubMed] [Google Scholar]
- 14. Kann BH, Likitlersuang J, Bontempi D, et al. Screening for extranodal extension in HPV-associated oropharyngeal carcinoma: evaluation of a CT-based deep learning algorithm in patient data from a multicentre, randomised de-escalation trial. Lancet Digit Health 2023;5(6):e360–e369. [DOI] [PMC free article] [PubMed] [Google Scholar]
- 15. Brigato L, Iocchi L. A Close Look at Deep Learning with Small Data. arXiv 2003.12843 [preprint] https://arxiv.org/abs/2003.12843. Posted March 28, 2020. Accessed June 2023. [Google Scholar]
- 16. Namdar K, Wagner MW, Kudus K, et al. Improving Deep Learning Models for Pediatric Low-Grade Glioma Tumors Molecular Subtype Identification Using 3D Probability Distributions of Tumor Location. arXiv 2210.07287 [preprint] https://arxiv.org/abs/2210.07287. Posted October 13, 2022. Accessed June 2023. [DOI] [PubMed] [Google Scholar]
- 17. Vafaeikia P, Wagner MW, Hawkins C, Tabori U, Ertl-Wagner BB, Khalvati F. MRI-Based End-To-End Pediatric Low-Grade Glioma Segmentation and Classification. Can Assoc Radiol J 2024;75(1):153–160. [DOI] [PubMed] [Google Scholar]
- 18. Mongan J, Moy L, Kahn CE Jr . Checklist for Artificial Intelligence in Medical Imaging (CLAIM): A Guide for Authors and Reviewers. Radiol Artif Intell 2020;2(2):e200029. [DOI] [PMC free article] [PubMed] [Google Scholar]
- 19. Fathi Kazerooni A, Arif S, Madhogarhia R, et al. Automated tumor segmentation and brain tissue extraction from multiparametric MRI of pediatric brain tumors: A multi-institutional study. Neurooncol Adv 2023;5(1):vdad027. [DOI] [PMC free article] [PubMed] [Google Scholar]
- 20. He K, Zhang X, Ren S, Sun J. Deep Residual Learning for Image Recognition. In: 2016 IEEE Conference on Computer Vision and Pattern Recognition (CVPR). IEEE, 2016; 770–778. [Google Scholar]
- 21. Wang W, Liang D, Chen Q, et al. Medical Image Classification Using Deep Learning. In: Chen YW, Jain L, eds. Deep Learning in Healthcare. Intelligent Systems Reference Library, vol 171. Springer, 2020; 33–51. [Google Scholar]
- 22. Sarwinda D, Paradisa RH, Bustamam A, Anggia P. Deep Learning in Image Classification using Residual Network (ResNet) Variants for Detection of Colorectal Cancer. Procedia Comput Sci 2021;179 :423–431. [Google Scholar]
- 23. Mei X, Liu Z, Robson PM, et al. RadImageNet: An Open Radiologic Deep Learning Research Dataset for Effective Transfer Learning. Radiol Artif Intell 2022;4(5):e210315. [DOI] [PMC free article] [PubMed] [Google Scholar]
- 24. Ravishankar H, Sudhakar P, Venkataramani R, et al. Understanding the Mechanisms of Deep Transfer Learning for Medical Images. In: Carneiro G, Mateus D, Peter L, et al., eds. Deep Learning and Data Labeling for Medical Applications. DLMIA LABELS 2016 2016. Lecture Notes in Computer Science, vol 10008. Springer, 2016; 188–196. [Google Scholar]
- 25. Ruopp MD, Perkins NJ, Whitcomb BW, Schisterman EF. Youden Index and optimal cut-point estimated from observations affected by a lower limit of detection. Biom J 2008;50(3):419–430. [DOI] [PMC free article] [PubMed] [Google Scholar]
- 26. DeLong ER, DeLong DM, Clarke-Pearson DL. Comparing the areas under two or more correlated receiver operating characteristic curves: a nonparametric approach. Biometrics 1988;44(3):837–845. [PubMed] [Google Scholar]
- 27. Pedregosa F, Varoquaux G, Gramfort A, et al. Scikit-learn: Machine Learning in Python. J Mach Learn Res 2011;12 :2825–2830. [Google Scholar]
- 28. Selvaraju RR, Cogswell M, Das A, Vedantam R, Parikh D, Batra D. Grad-CAM: Visual Explanations from Deep Networks via Gradient-Based Localization. In: 2017 IEEE International Conference on Computer Vision (ICCV). IEEE, 2017; 618–626. [Google Scholar]
- 29. Nobre L, Zapotocky M, Ramaswamy V, et al. Outcomes of BRAF V600E Pediatric Gliomas Treated With Targeted BRAF Inhibition. JCO Precis Oncol 2020;4(4 ): PO.19.00298. [DOI] [PMC free article] [PubMed] [Google Scholar]
- 30. Geoerger B, Bouffet E, Whitlock JA, et al. Dabrafenib + trametinib combination therapy in pediatric patients with BRAF V600-mutant low-grade glioma: Safety and efficacy results. J Clin Oncol 2020;38(15_suppl):10506. [DOI] [PMC free article] [PubMed] [Google Scholar]
- 31. Bouffet E, Hansford J, Garré ML, et al. Primary analysis of a phase II trial of dabrafenib plus trametinib (dab + tram) in BRAF V600–mutant pediatric low-grade glioma (pLGG). J Clin Oncol 2022;40(17_suppl):LBA2002. [Google Scholar]
- 32. Kumar V, Gu Y, Basu S, et al. Radiomics: the process and the challenges. Magn Reson Imaging 2012;30(9):1234–1248. [DOI] [PMC free article] [PubMed] [Google Scholar]
- 33. Gillies RJ, Kinahan PE, Hricak H. Radiomics: Images are more than pictures, they are data. Radiology 2016;278(2):563–577. [DOI] [PMC free article] [PubMed] [Google Scholar]
- 34. Yip SSF, Aerts HJWL. Applications and limitations of radiomics. Phys Med Biol 2016;61(13):R150–R166. [DOI] [PMC free article] [PubMed] [Google Scholar]
- 35. Wagner MW, Hainc N, Khalvati F, et al. Radiomics of pediatric low-grade gliomas: Toward a pretherapeutic differentiation of BRAF-mutated and BRAF-fused tumors. AJNR Am J Neuroradiol 2021;42(4):759–765. [DOI] [PMC free article] [PubMed] [Google Scholar]
- 36. Xu J, Lai M, Li S, et al. Radiomics features based on MRI predict BRAF V600E mutation in pediatric low-grade gliomas: A non-invasive method for molecular diagnosis. Clin Neurol Neurosurg 2022;222 :107478. [DOI] [PubMed] [Google Scholar]
- 37. Madhogarhia R, Haldar D, Bagheri S, et al. Radiomics and radiogenomics in pediatric neuro-oncology: A review. Neurooncol Adv 2022;4(1):vdac083. [DOI] [PMC free article] [PubMed] [Google Scholar]
- 38. Haldar D, Kazerooni AF, Arif S, et al. Unsupervised machine learning using K-means identifies radiomic subgroups of pediatric low-grade gliomas that correlate with key molecular markers. Neoplasia 2023;36 :100869. [DOI] [PMC free article] [PubMed] [Google Scholar]
- 39. Wagner M, Namdar K, Alqabbani A, et al. Dataset Size Sensitivity Analysis of Machine Learning Classifiers to Differentiate Molecular Markers of Pediatric Low-Grade Gliomas Based on MRI. Research Square 10.21203/rs.3.rs-883606/v1 [preprint] 10.21203/rs.3.rs-883606/v1. Posted September 17, 2021. Accessed June 2023. [DOI] [Google Scholar]
- 40. Raouf M, Amir B, Ayelet AB. Learning Interclass Relations for Image Classification. arXiv 2006.13491 [preprint] https://arxiv.org/abs/2006.13491. Posted June 24, 2020. Accessed June 2023. [Google Scholar]
- 41. Simonyan K, Vedaldi A, Zisserman A. Deep Inside Convolutional Networks: Visualising Image Classification Models and Saliency Maps. arXiv 1312.6034 [preprint] https://arxiv.org/abs/1312.6034. Posted December 20, 2013. Accessed June 2023. [Google Scholar]
- 42. Springenberg JT, Dosovitskiy A, Brox T, Riedmiller M. Striving for Simplicity: The All Convolutional Net. arXiv 1412.6806 [preprint] https://arxiv.org/abs/1412.6806. Posted December 21, 2014. Accessed June 2023. [Google Scholar]
- 43. Thumbavanam Arun N, Gaw N, Singh P, et al. Assessing the validity of saliency maps for abnormality localization in medical imaging. arXiv 2006.00063 [preprint] https://arxiv.org/abs/2006.00063. Posted May 29, 2020. Accessed June 2023. [Google Scholar]
- 44. Smilkov D, Thorat N, Kim B, Viégas F, Wattenberg M. SmoothGrad: removing noise by adding noise. arXiv 1706.03825 [preprint] https://arxiv.org/abs/1706.03825. Posted June 12, 2017. Accessed June 2023. [Google Scholar]
- 45. Kapishnikov A, Bolukbasi T, Viégas F, Terry M. XRAI: Better Attributions Through Regions. arXiv 1906.02825 [preprint] https://arxiv.org/abs/1906.02825. Posted June 6, 2019. Accessed June 2023. [Google Scholar]


