Abstract
Acute lymphoblastic leukemia (ALL) is an aggressive leukemia which can be derived from either T-cell or B-cell precursors. With current treatments, the survival rate is high, but the treatments are highly toxic with severe side effects. Individual mutations in IL7Rα and RAS pathways have been previously shown to be prevalent in ALL, and especially in relapsed patients. The relationship of IL-7Rα and RAS was investigated by transducing immature mouse thymocytes with the combination of these mutants. The resultant ALL cells were analyzed to identify the regulators and the oncoproteins that are up-regulated or down-regulated by the combination of IL7Rα with NRAS. Leukemia cells showed a significant increase in IL7Rα-mediated BCL2 expression, and an increase in MYC protein levels was mainly induced by NRAS signaling. MYC was both necessary and sufficient to replace mutant NRAS, and drugs targeting the MYC pathway showed a therapeutic benefit in IL-7Rα/NRAS T-ALL. We suggest that MYC protein stability can be regulated by PLK-1 kinase, which was increased mainly by the NRAS signal. These studies identify novel pathways of oncogenesis and new targets for intervention that could lead to better therapeutic development.
Introduction
Acute lymphoblastic leukemia (ALL) is the most common cancer in children. Current treatments have 5-year overall survival (OS) rates of up to 90%; however, the treatments are highly toxic with severe side effects.1 In addition, relapse is relatively common in T-ALL and is exceptionally difficult to salvage with hematopoietic stem cell transplantation, which is essentially the only treatment.2,3 Thus, a better understanding of T-ALL etiology and subtypes is required to develop more targeted therapies.
IL7Rα, one of the two IL7R subunits, is essential for T-cell development and survival, and mutations in the receptor itself or components of its signal pathways can lead to ALL.4-6 Somatic gain of function mutations in IL7Rα usually include insertion of cysteine into the receptor transmembrane region. This leads to disulfide bonds between two IL7Rα subunits causing constitutive signaling independent o f I L-7.7, 8 Recent studies showed that mutations in IL7Rα alone are insufficient to cause T-ALL in mice and other mutations that co-operate with IL7Rα are needed.4,9,10 A recent study in zebrafish11 did observe that mutant IL-7R transgenes were sufficient to induce T-ALL. However, the long latency of 20 weeks and oligoclonality led the authors to propose that additional events were required. Their results suggested one such event was MYC upregulation. RAS mutations in both B and T lineage-ALL occur in approximately 15% of patients, with NRAS being the most dominant.12 In early T-cell precursor ALL (ETP), mutations in the RAS signaling pathway are found in approximately 67% of cases, with 19% of them in the NRAS gene.12 Moreover, other studies showed that RAS pathway mutations account for 30-50% of cases of relapse in ALL.13 Therefore, we tested the effect of combining IL7Rα with NRAS. We had previously showed that mutant human NRAS (G13D) in combination with a somatic gain of function mutation in human IL-7Rα (c.731_732insTTGTCCCAC) caused severe T-ALL in mice compared to expression of each oncogene alone or empty vector.1
In this study, we focused on the signaling pathways and factors that are activated or inhibited when mutant NRAS and IL-7Rα are transduced into murine T-cell progenitors, causing T-ALL.
It was first shown in the 1990s that BCL2 can co-operate with MYC, which together induce transformation in vitro.14 Since then, many studies have showed the involvement of these two oncoproteins in different cancer types, both in humans and in murine models.15,16 As mentioned above, a recent study showed that mutant IL7Rα collaborated with MYC to induce T-ALL in transgenic zebrafish; however, the mechanism that is responsible for increased MYC is unclear.11 Here, using a murine model, we shed light on the mechanism that regulates MYC in ALL, on the collaboration of MYC and BCL2, and the relative roles of mutated NRAS and IL-7Rα.
Methods
Cell culture and transduction
Thymuses were harvested from 3-6 week-old C57Bl/6J female mice, depleted for CD4+ CD8+ cells, processed and transduced as previously described.1 cDNA were subcloned into a pMIG or IRES-mCherry (Addgene) retroviral vector by PCR cloning. The hIL-7Rα mutant sequence was with in-frame insertion of c.731_732insTTGTCCCAC, based on subject P2.7 Mutant human NRAS contained a point mutation (G13D). Human MYC was from pcDNA3-MYC (Addgene). Phoenix cells were transfected with pCL-Eco (Addgene) helper plasmid and the retroviral vector pMIG carrying either mutant hIL7Rα, mutant NRAS, or the combination of both mutIL7Rα-T2A-mutNRAS or IRES-mCherry containing MYC or Cre. Transfection was performed using lipofectamine and OPTI-MEM I reduced serum medium (Invitrogen). After transduction, thymocytes were maintained on OP9-DL4 cells prior to injection or sequencing.
Animal experiments
Transduced thymocytes were injected into sub-lethally irradiated (3 Gy), 6-15 week-old Rag1-/- (B6.129S7-Rag1tm1Mom/J) mice via tail vein (5x10⁵ cells / 200 µL/ mouse). For studies combining mutNRAS or MYC, the experimental groups and the numbers of animals in each group were: mutIL-7Rα-T2A-mutNRAS (N=7), mutIL7Rα (N=7), MYC (N=7), MYC+ mutIL-7Rα (N=7). MYC floxed mice were kindly provided by the Susan Mackem lab (NCI).
C57 thymocytes or MYC-floxed thymocytes were transduced with Cre (mCherry) and mutIL-7Rα-T2A-mutNRAS (GFP) (N=3 for each group). Twenty-four hours after transduction, thymocytes were sorted on BD FACSAria II for mCherry+/ GFP+ thymocytes and immediately injected intravenously into RAG1-/- mice, which were monitored for up to 35 days. Peripheral blood was collected weekly (submandibular) for leukemic burden assessment, and mice showing signs of morbidity were euthanized and harvested for spleen and blood.
For drug studies, mutIL-7Rα-T2A-mutNRAS transduced thymocytes were injected into RAG1-/- mice as described above. Twenty-four hours after injection, mice were treated with: JQ-1 (Selleckchem) administered intraperitoneally (i.p.) at 25 mg/kg (N=7), daily for 21 days, for controls (no treatment) 2.5% DMSO + 30% PEG300 + 5% TWEEN-80 + dH2O was injected into mice (N=7). Volasertib (BI6727-Selleckchem) was administered at 10 mg/kg (N=6), i.p. daily for 21 days, for controls (no treatment) mice were injected with 2% DMSO in PBS (N=6). For the combination of volasertib and venetoclax (ABT-199-; DC chemicals), mice were treated with either control (no treatment) with one injection with 2% DMSO in PBS followed three hours (hr) later with an additional injection of 5% DMSO + 50% PEG300 + 5% Tween-80 + dH2O, or with volasertib alone (10 mg/kg), venetoclax alone (15 mg/kg) or the combination of both drugs in separate injections. All drugs were injected i.p. five days per week.
All animal experimental procedures were conducted according to the US NIH guidelines for the Care and Use of Laboratory Animals, and were approved by the NCI Animal Care and Use Committee.
Statistical analysis
Statistical analysis was performed using GraphPad Prism 7.
Differences were calculated with unpaired Student t test or one-way ANOVA for multiple comparisons. P<0.05 was considered statistically significant. Error bars are Standard Deviation.
A detailed description of other methods used is provided in the Online Supplementary Appendix.
Results
Identifying the molecular pathways that lead to T-ALL caused by mutIL7Rα and mutNRAS
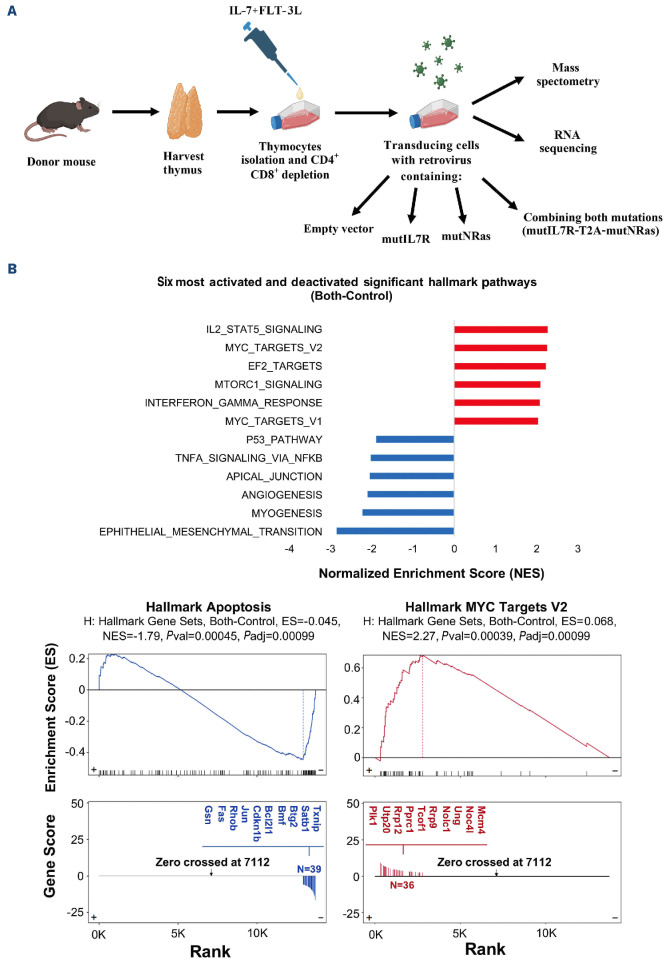
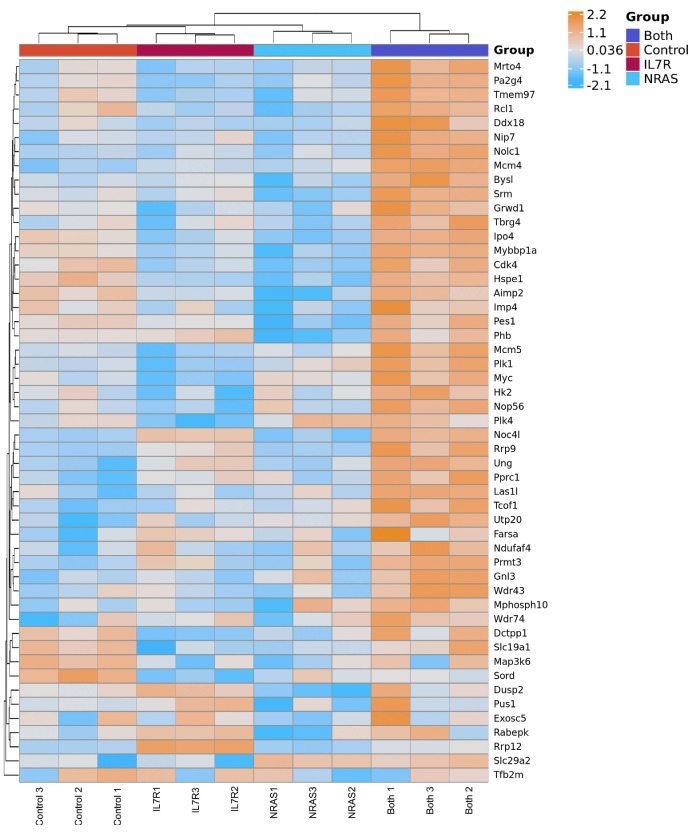
Previously our lab showed that an IL7Rα gain of function mutation is not sufficient to cause T-ALL.1 By combining different known mutations that are common in ALL, Cramer et al. found that combination of mutant human IL7Rα (P7=c.731_732insTTGTCCCAC) with mutant human NRAS (G13D) can lead to severe T-ALL in mice.1 In addition to these two specific mutations, we also tested combination of mutIL7R (P7) with mutKRAS (G12D or G12V) and mutIL7R (P1= c.726_727insAACCCATGC) with mutNRAS(G13D), and found that all gave leukemia in mice, indicated by an increase in GFP percentage in the spleen, marking leukemic cells (Online Supplementary Figure S1A). We found that combining mutIL7R(P7) and mutNRAS (G13D) gave the strongest leukemia, making it easier to study and identify the molecular and signaling pathways, and explain why combining these two oncogenes leads to ALL. To answer this question, RNA sequencing and mass spectrometry were performed on double negative primary immature mouse thymocytes, transduced with either: empty vector, mutant human IL-7Rα, mutant human NRAS, or both oncogenes combined on a single bicistronic vector (Figure 1A). RNA sequencing and differential expression of genes (DEG) analysis highlighted the differences between the four groups (Online Supplementary Figure S1B). Gene set enrichment analysis (GSEA) revealed significant changes in gene sets expressed in thymocytes that contain both mutations compared to each mutation alone or empty vector. The top six significant HALLMARK pathways as determined by GSEA are shown in enrichment plots comparing: both mutations to empty vector (Figure 1B), both mutations to mutant IL7R alone (Online Supplementary Figure S1C), and both mutations to mutant NRAS alone (Online Supplementary Figure S1D). One of the pathways that is predicted to be activated in all three comparisons in the presence of both mutations was the HALLMARK_MYC_TARGETS_V2 pathway (Figure 1B, Online Supplementary Figure S1C, D). On the other hand, one of the pathways that was predicted to be significantly deactivated in the presence of both mutations was in the HALLMARK_APOPTOSIS pathway (Figure 1B). However, as most apoptotic-related genes are regulated in protein level, we also confirmed our results by western blot (Figure 2A). Heatmap of the HALLMARK_MYC_TARGETS_V2 GSEA leading edge genes reveals an increase in the MYC positive regulator, PLK1, but only in the presence of both mutations (Figure 3). Finally, combining RNA sequencing with mass spectrometry results using a Venn diagram showed an increase in BCL2 gene and protein levels that are expressed in thymocytes containing both mutations, compared to empty vector (Online Supplementary Figure S1E).
Figure 1.
Identifying the molecular pathway that leads to acute lymphoblastic leukemia caused by mutIL7R and mutNRAS. (A) Schematic diagram describing the experimental design for conducting mass spectrometry and RNA sequencing. (B) (Top) Bar chart showing the top 6 GSEA Hallmark pathways in mutIL7R + mutNRAS relative to control empty vector. The x-axis shows normalized enrichment scores, with activated pathways given red bars and deactivated pathways in blue. (Bottom) GSEA enrichment plots for both the deactivated HALLMARK_APOPTOSIS pathway and the activated HALLMARK_MYC_TARGETS_V2 pathway. Both P values (Pval) and adjusted P values (Padj) are shown.
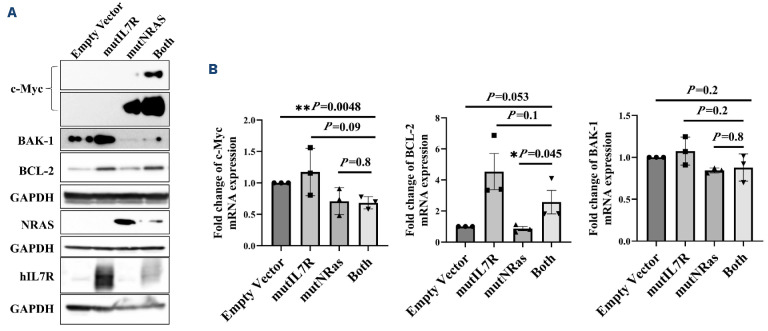
Figure 2.
Expression of mutIL7R and mutNRAS lead to changes in MYC protein level and BCL-2 protein and mRNA level. (A) Primary thymocytes transduced with: empty vector, mutIL7R, mutNRAS or combination of both mutations (Both), 72 hours from transduction cells were lysed and analyzed by western blot. (This was repeated with at least 3 biological experiments). (B) RT-PCR analysis of mRNA from primary thymocytes transduced with the different mutations or empty vector tested for MYC, BCL2 and BAK1. Each point represents biological repeat, and each biological repeat was done in triplicates (N=3).
Figure 3.
Heatmap of all GSEA leading edge genes from the HALLMARK_MYC_TARGETS_V2 gene. The heat is from row-centered and normalized expression z-scores, colored annotation bars along the top indicate treatment groups, and phylograms on the top and left side are the result of unsupervised clustering of samples and genes, respectively.
Expression of mutIL7R and mutNRAS induces increased MYC and BCL2 protein and mRNA levels
Next, we validated the bioinformatic analysis by immunoblotting in both primary thymocytes and similarly transduced D1 thymocyte cell line. In primary thymocytes, MYC protein was significantly increased in the oncogene combination compared to mutIL7R alone or empty vector, and overexposure suggested that the MYC increase is mostly due to mutant NRAS (Figure 2A). The BCL2 protein level increased in mutIL7Rα alone and in thymocytes expressing both mutIL7Rα and mutNRAS. The pro-apoptotic protein BAK1 significantly decreased in the presence of both mutations (Figure 2A). The D1 cell line is IL-7-dependent for survival and growth in vitro. In the presence of IL-7, high levels of MYC protein were observed, and the levels declined dramatically after IL-7 withdrawal (Online Supplementary Figure S2A). In this cell line after IL-7 removal, either oncogene or the combination, maintained MYC levels, albeit not up to the same level as in the presence of IL-7. Moreover, we observed an increase in PIM-1, a known oncoprotein which is regulated by the IL7R pathway.17 Both the short and the long forms of PIM-1 were significantly higher in the presence of both mutations compared to each mutation alone or empty vector (Online Supplementary Figure S2A). In addition, the pro-apoptotic protein BAD phosphorylation (inhibitory form) was increased mainly with both mutations, consistent with an anti-apoptotic fate when both IL7Rα and NRAS mutations are present (Online Supplementary Figure S2A). To determine whether MYC and BCL2 were controlled at the transcription, transitional or protein level, we first tested mRNA levels of MYC, BCL2, and BAK1. MYC and BAK1 mRNA levels did not show any major changes. On the other hand, BCL2 mRNA increased 5- and 3-fold with mutIL7Rα alone and in the presence of both oncogenes, respectively (Figure 2B). This supports our bioinformatic analysis in addition to other studies that showed BCL2 transcription is up-regulated by the IL7R pathway.18-20 To further investigate the increase in MYC protein, we used MK-2206, an AKT inhibitor, which is also known to inhibit MYC translation.21,22 We did not find any significant change in MYC protein levels in either primary thymocytes or D1 cell line transduced with mutIL7R and mutNRAS (Online Supplementary Figure S2B). This suggests that, in this scenario, MYC increased by increasing its stability, a wellknown MYC regulatory mechanism.
We conclude that in the presence of both mutant IL7Rα and NRAS, MYC stability is regulated at the protein level and BCL2 is increased at the transcriptional level. Since the combination of MYC and BCL2 is known to be highly oncogenic in many cancer types, including different types of leukemia and lymphoma,14,16,23 we suggest this combination is also responsible for the severity of T-ALL caused by mutations in IL7Rα and NRAS.
MYC overexpression can replace mutant NRAS in combination with mutant IL7Rα to create T-ALL in mice
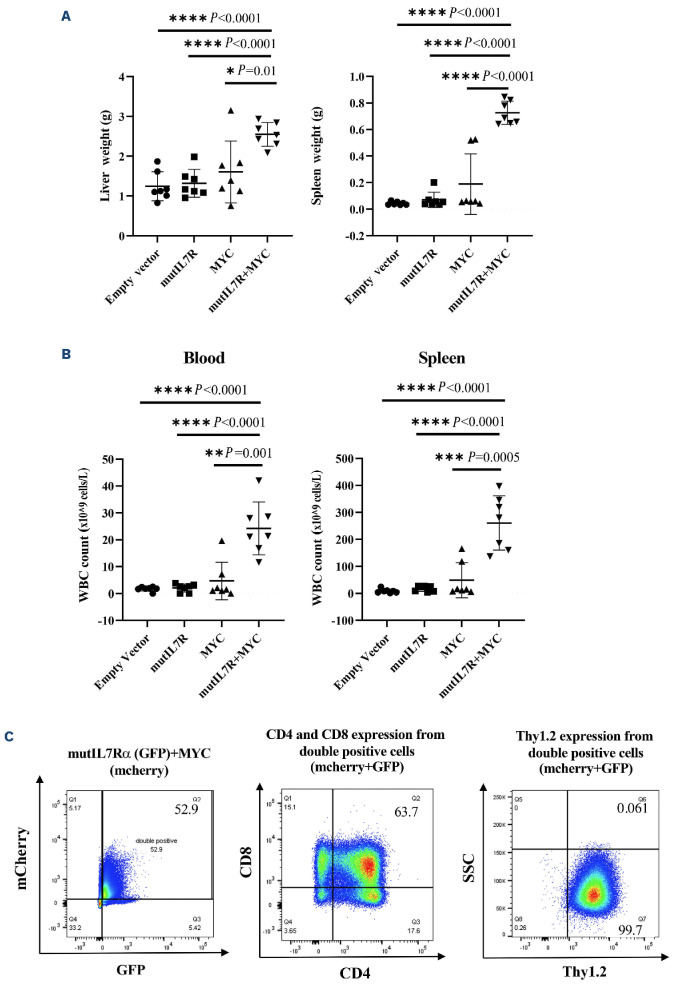
To evaluate whether the mutant NRAS contribution to leukemogenesis is explained by stabilization of MYC, we tested whether overexpression of MYC was sufficient to replace mutant NRAS. Double negative thymocytes were transduced with mutant IL-7Rα/GFP together with MYC/ mCherry, injected into RAG1-/- mice and observed for leukemia progression (Online Supplementary Figure S3A). Disease appeared approximately 16 days after injection only in the group receiving both mutIL7Rα and MYC over-expressing thymocytes, displaying increased liver and spleen size (Figure 4A, Online Supplementary Figure S3B) and increased white blood count (WBC) in both blood and spleen, all indicators for leukemia (Figure 4B). To characterize the leukemia, we first evaluated the expression of GFP and mCherry thymocytes in the blood and observed a significant increase in cells that contained both mutIL7Rα and MYC compared to controls (Online Supplementary Figure S3C). Interestingly, cells positive for both mutations were mostly Thy 1.2, CD4, and CD8 positive, marking intermediate stage thymocytes (Figure 4C). Finally, we observed that the mutIL7Rα/MYC leukemia was transferrable by injection into recipient mice, generating a leukemia of similar aggressiveness and phenotype (data not shown). Overall, we conclude that the combination of mutIL7Rα and MYC can lead to ALL, and that the leukemogenic contribution of mutant NRAS can be explained by its stabilization of MYC.
Figure 4.
MYC replaces mutant NRAS in combination with mutant IL7Rα to create acute lymphoblastic leukemia in mice. RAG1-/- mice were injected with thymocytes transduced with either: empty vector, mutIL7R, MYC or combination of both IL7R and MYC. After 16 days from injection, mice (N=7) were harvested for liver, spleen, and blood, and analyzed as follows: (A) liver and spleen weights, (B) white blood cell (WBC) counts from both blood and spleen, (C) flow cytometry analysis from blood detecting, left to right: GFP and mCherry which represent the expression of mutIL7R and MYC respectively (double positive for cells express both), CD4 versus CD8 expression and Thy1.2 expression, that represent thymocytes marker, gated on double positive thymocytes.
Acute lymphoblastic leukemia from mutant IL7R and NRAS has a similar phenotype to mutant IL7R and MYC
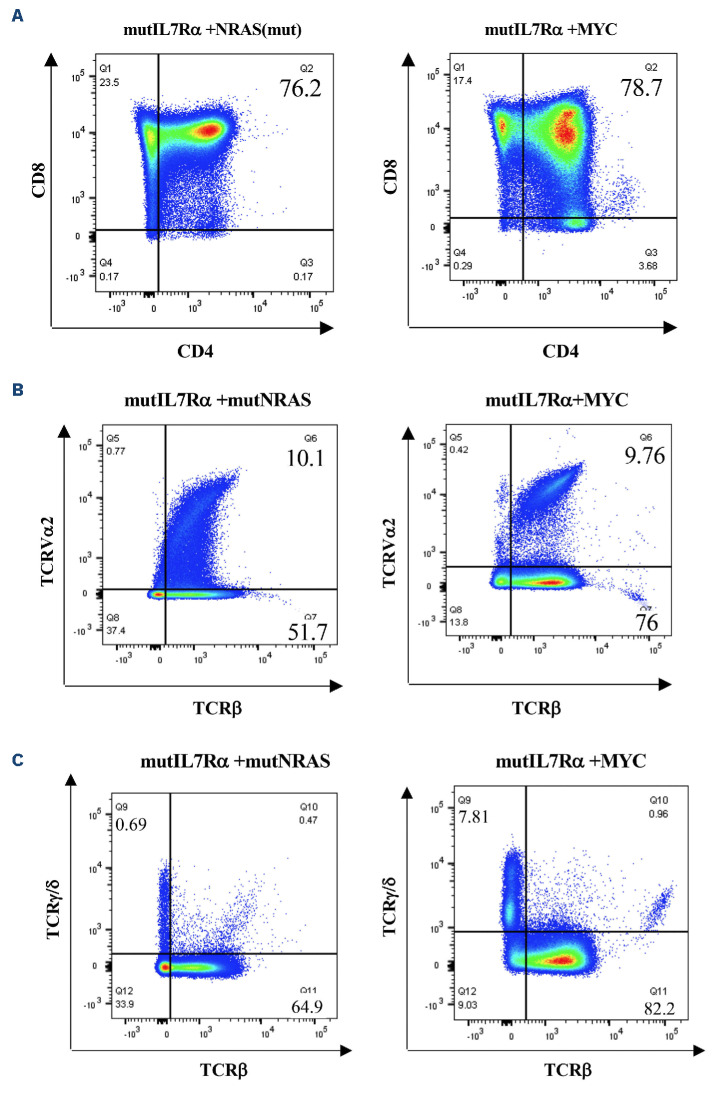
The two ALL combinations were compared to assess whether MYC plus mutIL-7R generated a phenotype similar to mutNRAS plus mutIL-7R. Double negative primary thymocytes were transduced with either mutIL7Rα plus mutNRAS (encoded on a single plasmid together with GFP) (Online Supplementary Figure S4A) or with mutIL7Rα and over-expressed MYC (encoded on separate plasmids with GFP or mCherry expression, respectively) (Online Supplementary Figure S4B). Following transduction, thymocytes were injected into RAG1-/- mice and monitored for leukemia progression by both flow cytometry and disease symptoms for approximately two weeks. In both combinations, the percentage of leukemic cells in the spleen, was around 90% (Online Supplementary Figure S4), consistent with a similar growth rate. Leukemic cells in both models also resembled the CD4+ CD8+ developmental stage (Figure 5A). TCRVα expression in the combinations were also similar between the models (Figure 5B) and the TCRαβ lineage predominated over TCRγδ lineage in both models (Figure 5C). We conclude that MYC plus mutIL-7Rα generated an ALL that was very similar to mutNRAS plus mutIL-7Rα. This is consistent with the mutNRAS contribution being mediated via increased MYC stability.
Figure 5.
Acute lymphoblastic leukemia from mutant IL7Rα and mutNRAS has similar phenotype to mutant IL7Rα and over-expressed MYC. RAG1-/- mice were injected with thymocytes transduced with either mutIL7R and mutNRAS or with mutIL7R and MYC. After 16-21 days from injection, spleen was harvested from mice (N=7) and analyzed by flow cytometry as follows: all markers’ expression is from either GFP or GFP and mCherry (double positive) gated thymocytes. (A) CD4 versus CD8 (B) TCRVα2 versus TCRβ (C) TCRβ versus TCRy/δ.
Targeting MYC reduced acute lymphoblastic leukemia progression caused by mutIL7Ra and mutNRAS
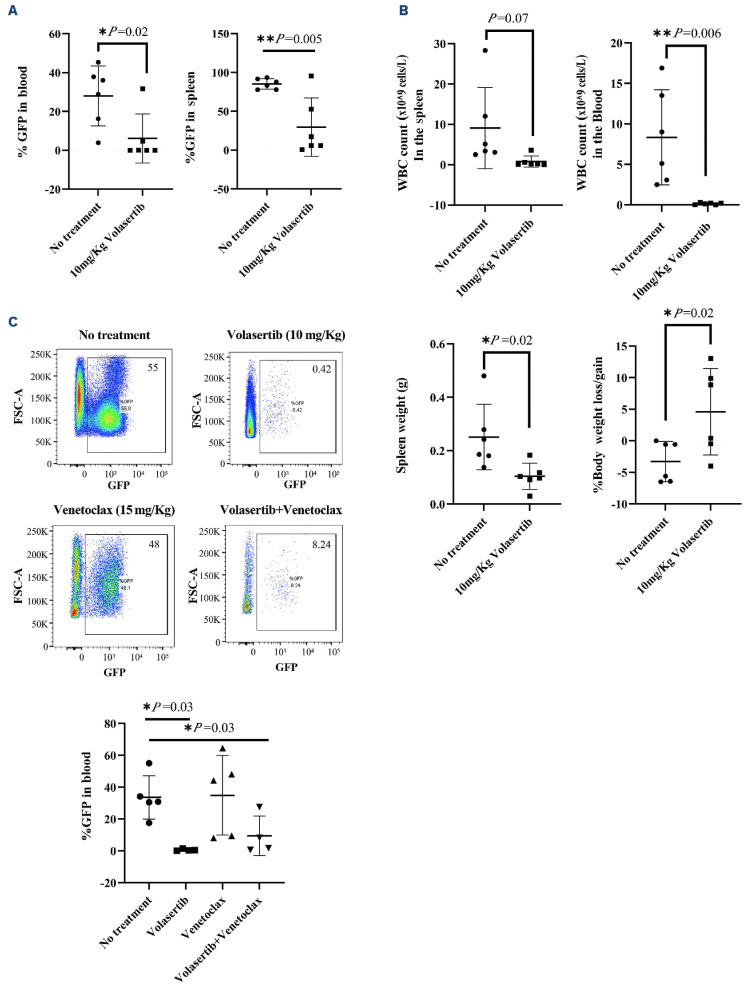
To further assess the involvement of MYC in our ALL model, we used several approaches to determine if MYC was required. Volasertib (BI6727), a dihydropterinone that targets PLK1, has shown efficacy in several cancer clinical trials, and was previously shown to destabilize MYC protein by increasing MYC proteasomal degradation.15,21,24,27 Double negative thymocytes expressing both mutIL7Rα and mutNRAS were injected into RAG1-/- treated with 10 mg/kg volasertib (BI6727) for 21 days, starting 24 hr after injection, or injected with buffer alone as control (no treatment) (Online Supplementary Figure S5A). At the end of treatment, GFP+ leukemia cells were significantly decreased in mice treated with volasertib, in both blood and spleen, compared to controls (Figure 6A). In addition, non-treated mice had significantly higher WBC in both blood and spleen, significant weight loss, and increased spleen weight compared to volasertib-treated mice (Figure 6B). MYC protein levels were significantly reduced in the presence of volasertib compared to control mice (Online Supplementary Figure S5B). Our model predicts dependency on combined overexpression of MYC and BCL2 (see Figure 2). Therefore, we next treated leukemic RAG1-/-mice with volasertib and venetoclax (a BCL2 inhibitor) separately and combined (Online Supplementary Figure S5C), possibly expecting an additive effect. The GFP percentage of leukemic cells in the blood was significantly reduced with volasertib alone and in combination with ventoclax (Figure 6C). Therefore, volasertib alone in this regimen was quite efficient in slowing leukemia progression and there was no added benefit of venetoclax. This result suggests that volasertib is more efficient in treating ALL then venecolax and it should be considered as single drug for ALL with high MYC expression or with RAS mutations. We conclude that inhibition of PLK1 lowers MYC in leukemia cells and is associated with reducing progression of ALL driven by mutIL-7Rα plus mutNRAS. Another drug that targets MYC is JQ-1, a selective small molecule, BET bromodomain BRD4 inhibitor. BET bromodomain proteins act as regulatory factors for MYC and inhibition by JQ-1 was found to down-regulate MYC transcription followed by downregulation of its target genes in multiple mouse cancer models including ALL.21,28-30 Leukemic RAG1-/- mice were treated with either control-buffer alone or with 25 mg/kg JQ-1 (Online Supplementary Figure S6A). Untreated mice showed significantly increased WBC in the blood and spleen, in addition to enlarged spleen and liver compared to mice treated with JQ-1 (Online Supplementary Figure S6B). Moreover, mice that were treated with JQ-1 showed significantly reduced GFP positive cells in both spleen and blood (Online Supplementary Figure S6C, D), a therapeutic effect similar to the other MYC inhibitor, volasertib (Figure 6).
Figure 6.
Targeting MYC reduced acute lymphoblastic leukemia progression caused by mutIL7Rαand mutNRAS. RAG1-/- mice injected with thymocytes transduced with mutIL7R and mutNRAS, were treated with volasertib. (A) Percentage of GFP leukemic cell expression in blood and spleen in either Control-no treatment (N=6) or treated with 10 mg/kg volasertib (N=6). (B) White blood cell (WBC) count in the spleen and blood, spleen weight and percentage of loss or gain body weights in mice treated with or without 10 mg/kg volasertib. (C) RAG1-/- were injected with mutIL7R and mutNRAS thymocytes, Twenty-four hours after mice were treated with either buffers alone (no treatment), volasertib (10 mg/kg), venetoclax (15 mg/kg) or with both volasertib and venetoclax. (N=5 in each group), mice were euthanized when they showed morbid symptoms and analyzed for GFP leukemic cells in the blood by flow cytometry: representative flow image (top) and quantification of GFP leukemic cells percentage in each group (bottom).
In another approach to implicate MYC in this ALL model, the Flox-Cre system was used to delete MYC in leukemia cells. Thymocytes were harvested from either MYC floxed mice or from normal C57BL/6J mice, depleted for CD4+ CD8+ and transduced with mutIL7Rα-T2A- mutNRAS/GFP and with Cre/mCherry (Online Supplementary Figure S7A). Following transduction, thymocytes were sorted for both GFP and mCherry to ensure cells contained both the oncogenes together with the Cre plasmids. Sorted cells were injected to RAG1-/- mice monitored for disease symptoms and WBC fluorescence (Online Supplementary Figure S7A). To confirm MYC deletion with Flox-Cre, we transduced either Cre or empty vector into thymocytes from MYC floxed mice and observed by immunoblotting a reduction in MYC levels in the presence of Cre (Online Supplementary Figure S7B). Mice that were injected with normal C57BL/6J thymocytes containing Cre+ mutIL7Rα and mutNRAS, showed the most severe leukemia symptoms 21 days after injection. On the other hand, mice injected with thymocytes bearing MYC floxed and Cre+ mutIL7Rα and mutNRAS showed morbid symptoms (of an unknown basis) 35 days after injection. However, these symptoms were not a result of leukemia, which was not detected. Mice injected with normal C57BL/6J thymocytes had increased WBC in the blood and spleen (Online Supplementary Figure S7C) and enlarged spleens (Online Supplementary Figure S7D) compared to mice injected with thymocytes that have MYC floxed and Cre. Moreover, flow cytometry analysis showed that at least 8% of splenocytes containing Cre and mutIL7Rα + mutNRAS, but not floxed MYC, transformed to leukemic cells, as seen by the GFP and mCherry in the splenocytes (Online Supplementary Figure S7E).
To further confirm the requirement for MYC in our ALL model, shRNA against MYC was introduced into both primary thymocytes and the D1 thymic cell line. Two of the MYC shRNA sequences were able to reduce MYC protein levels compared to control shRNA in the D1 cell line (Online Supplementary Figure S8A). To monitor D1 cell survival, we transduced cells expressing mutIL7Rα+ mutNRAS + GFP with shRNA scrambled/MYC expressed together with mCherry (Online Supplementary Figure S8B). Approximately 50% of D1 cells expressed both GFP and mCherry (Online Supplementary Figure S8B). Next, we followed cells expressing the double positive fluorophores and observed a reduction in the percentage of cells with MYC shRNA1891 and 2105, but not with scrambled shRNA, which showed no change in survival (Online Supplementary Figure S8C). In addition to shRNA experiments in the D1 cell line, we also tested the effect of MYC shRNA in primary thymocytes transduced with mutIL7Rα plus mutNRAS. The percentage of double positive thymocytes, were significantly reduced over time in the presence of MYC shRNA compared to scrambled shRNA (Online Supplementary Figure S8D).
PLK-1 involvement in MYC stability in acute lymphoblastic leukemia induced by mutIL7Rα and mutNRAS
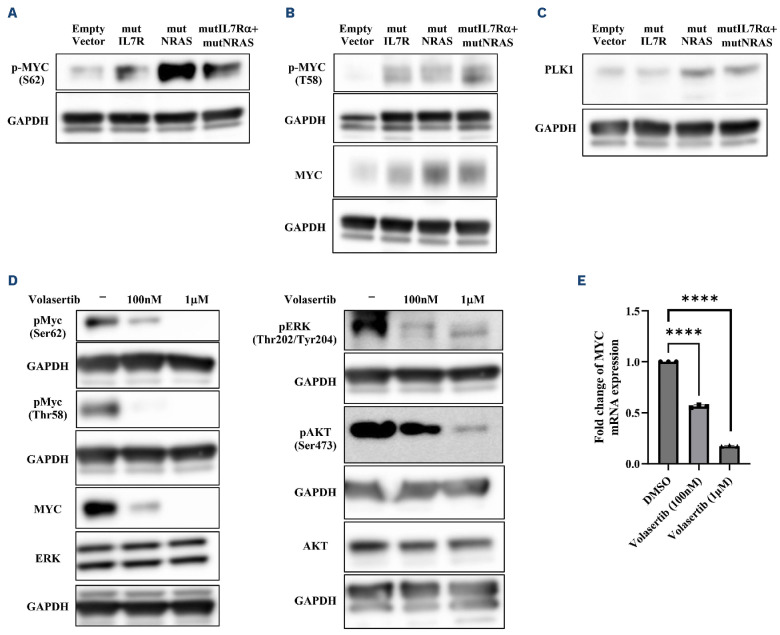
MYC stability can be regulated in different stages and by several different regulators. Many past studies revealed a relationship between the RAS family and MYC protein stability.31-33 One of the mechanisms identified by Sears et al.33 is that RAS can regulate MYC stability by activating the Raf/ MEK/ERK signal: ERK can then phosphorylate MYC at Ser62, which stabilizes MYC (as well as activating its transcriptional activity). A second MYC stabilization mechanism downstream of RAS can occur via activating the PI3K-AKT pathway, which can phosphorylate GSK-3 and down-regulate its activity. This would prevent MYC phosphorylation on Thr58 which would otherwise mark MYC for ubiquitination and proteasomal degradation.33 We, therefore, tested both pathways in the D1 thymic cell line transduced with mutIL7Rα and mutNRAS both separately and combined, and observed an increase in p-ERK as well as at p-AKT and p-GSK-3 protein levels (Online Supplementary Figure S9A, B). Although, p-AKT was increased in the presence of the mutations (separate and combined), in the absence of IL-7, p-AKT was more stable only in the presence of both mutations (Online Supplementary Figure S9B). Moreover, GSK-3α/β phosphorylation was most dramatically elevated in the presence of both IL7Rα and NRAS combined, which parallels the increase in AKT activity (Online Supplementary Figure S9B). To further confirm the involvement of NRAS in MYC stabilization in our model, we also tested MYC phosphorylation in Ser62, which is crucial for MYC stabilization and known to be induced by ERK.33 Primary thymocytes transduced with both oncogenes combined or NRAS alone showed increased p-MYC (Ser62) (Figure 7A), similar results were also observed in the thymic D1 cell line, although only with both oncogenes combined and in the absence of IL-7 (Online Supplementary Figure S9C). Interestingly, we also observed an increase in MYC phosphorylation in Thr58 which can induce MYC degradation (Figure 7B). Therefore, an additional mechanism may be operating which inhibits MYC degradation. In the last few years, PLK1 has been shown to regulate MYC stability in various cancer types.15,34,35 PLK1 was significantly increased in the presence of mutant NRAS alone and in both mutations combined, which implies PLK1 regulation by the RAS signaling, which is responsible for MYC stabilization (Figure 7C). This also validates the bioinformatic analysis (Figures 1B, 3), which showed increased MYC pathways, including upregulation of PLK1. To further investigate the involvement of PLK-1 in NRAS signaling, we treated primary thymocytes transduced with mutIL7R+mutNRAS with different concentration of volasertib in vitro and found that, in addition to a significant reduction in MYC protein level (Figure 7D), there was also a significant decrease in MYC transcripts compared to control, non-treated cells (Figure 7E). Interestingly, we also observed a reduction in phosphorylated ERK and AKT in addition to a significant reduction in MYC phosphorylated form in Ser62 and Thr58, which can suggest that PLK-1 may regulate more up-stream factors in the RAS pathway, which eventually effect both MYC protein stability and its transcripts (Figure 7D).
Figure 7.
Suggested mechanism for MYC regulation in acute lymphoblastic leukemia, caused by mutant IL7R and NRAS. Primary thymocytes were transduced with either: empty vector, mutant IL7R, mutant NRAS or both mutIL7R and mutNRAS, after 72 hours (hrs) cells were lysed and analyzed by western blot for: (A) p-MYC (Ser 62), (B) p-MYC (Thr58), MYC and (C) PLK1. (D and E) Primary thymocytes transduced with both mutIL7R and mutNRAS treated with DMSO, 100 nM or 1µM volasertib for 24 hrs were analyzed as follows: (D) immunoblot analysis testing MYC, ERK and AKT phosphorylation and total protein (presentative analysis from 3 biological repeats). (E) RT-PCR analysis testing MYC mRNA expression. Each point represents biological repeat, and each biological repeat was done in triplicate (N=3). **** P<0.0001.
To confirm that the mutant oncogenes are over-expressed in transduced thymocytes, we also examined levels of NRAS and hIL7Rα showing high levels in the groups expressing hIL7Rα or NRAS alone compared to both mutations combined (Online Supplementary Figure S9D; see also Figure 2A). The combined group showed less of each oncogene than the single oncogene, presumably because the two were encoded on the same construct. We combined them on the same plasmid to assure that every transduced thymocyte received both oncogenes.
Discussion
Mutations in the IL7Rα gene were shown in several studies to cause ALL;7,8,36 however, mutations in IL7Rα alone is not sufficient to lead to T-ALL and other mutations are necessary.1 Our lab showed that combining mutant IL7Rα with mutant NRAS can cause severe ALL in mice, but the mechanism of this oncogene co-operation was not determined.1 In B-ALL, nearly half of IL-7R mutants were reported to also harbor mutations in the Ras pathway.6 In T-ALL, approximately 2% of IL-7R mutants were reported to have mutations in K/N RAS.37 However, mutations in regulators that activate RAS may be a more important mechanism in T-ALL. Approximately 7% of IL-7R mutants were reported with inactivating mutations in the exchange factor NF1 which would result in RAS activation. In other studies, the RAS loading factor RasGRP1 was over-expressed in a majority of T-ALL (although the association with mut IL-7R has not been reported) and can induce T-ALL in mice.38 Finally, WT IL-7R is expressed on approximately 70% of T-ALL, is activated by IL-7 in vivo, and could co-operate with the RAS pathway. Approximately 17% of WT IL-7R T-ALL harbor K/N RAS mutations.37 Our study shows that co-operation between the IL-7R and RAS pathways is powerfully leukemogenic.
Here we show that in the presence of both mutant IL7Rα and NRAS there is an increase in both BCL2 and MYC protein levels, which together have long been known to be a powerful pro-oncogenic combination14 (Figure 8). BCL2 has long been identified as a major IL-7-induced anti-apoptotic mediator,36 and this was confirmed in our model at the mRNA and protein levels (Figures 2, 8A). We considered that increasing MYC could explain part of the mechanism of oncogene co-operation, as MYC target genes were over-expressed when both mutant IL7Rα and NRAS were present. We observed that while MYC protein increased with NRAS (G13D) alone, a much greater increase occurred when combining mutant NRAS with mutant IL7Rα. It has previously been shown that RAS protein can stabilize MYC by increasing its phosphorylation at Ser62 through PI3K/AKT and ERK activation.33 We showed that MYC increase at the level of protein stability, whereas the BCL2 increase is largely at the transcriptional level19,36,39 (Figures 2, 8A) An additional pro-survival effect that we observed in both primary thymocytes and a thymocyte cell line was a decrease in pro-apoptotic signals regulated by proteins such as BAK1 and BAD. The BAK1 decrease was induced by NRAS (G13D) mutant alone, which has not previously been reported. On the other hand, BAD phosphorylation (which leads to its sequestration) seemed much more stable in the presence of both IL7Rα and NRAS mutants compared to each one expressed alone.
Figure 8.
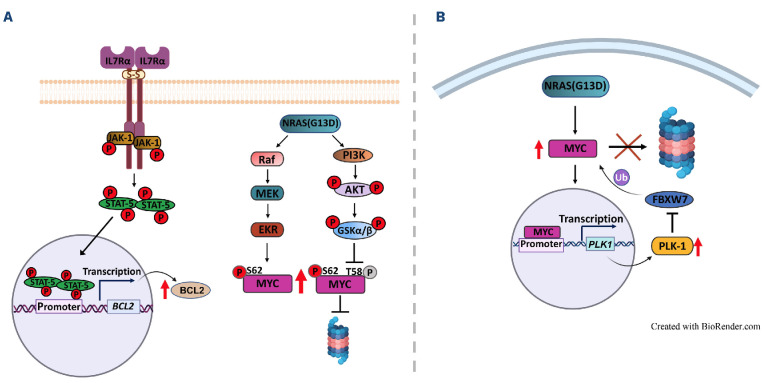
Schematic model of acute lymphoblastic leukemia induction by mutant human IL7R and NRAS. (A) mutIL7R induced expression of BCL2 by JAK/STAT signal. p-JAK-1 phosphorylates STAT-5, which activated its transcription activity. This leads to increased levels of BCL2 mRNA and protein. MutNRAS contributes to MYC stabilization through Raf/ERK and PI3K/AKT activation. The Raf/ERK pathway increases the stable form of MYC by phosphorylation of (Ser62). In addition, the PI3K/AKT signal contributes indirectly to MYC stability by increasing p-AKT and inhibiting GSK-3 activity, which results in inhibition of MYC degradation. (B) PLK-1 that is positively regulated by MYC activity can contribute to MYC stabilization through inhibition of FBXW-7, which leads to inhibition of MYC proteasomal degradation and creates a positive feedback loop.
Another potential contributor to leukemogenesis is the increase in pro-oncogene PIM-1, which is known to be induced by the JAK-STAT pathway and was shown to be activated in T-ALL40 in the presence of mutations in the IL7Rα itself or in its signaling pathway.17 In addition, it has previously been shown that PIM-1 can enhance MYC transcriptional activity by increasing phosphorylation on Ser62 and decreasing degradation by inhibiting its phosphorylation on Thr58.41 Thus PIM-1 could also contribute to the oncogenic mechanisms in ALL. To test the hypothesis that NRAS acts by regulating MYC stability, we replaced NRAS (G13D) expression with MYC overexpression together with mutant IL7Rα which induced leukemia with the same phenotype. This result is consistent with the recent study of Oliveira et al. in zebra fish showing T-ALL transformation by combining mutant IL7Rα with MYC overexpression.11
One goal of this study was to identify new targets for ALL therapy. We used several different methods to inhibit MYC levels in vivo and in vitro, and followed ALL progression. Since, so far, no drug has been found that can inhibit MYC directly, we used two clinically tested drugs that inhibit MYC indirectly: volasertib and JQ-1. Both drugs significantly reduced the progression of ALL in mice caused by the combination of mutant IL7Rα with mutant NRAS. Deletion of MYC with cre-flox also blocked ALL in vivo. In addition to our in vivo model, we also used in vitro systems, inhibiting MYC with shRNA in both primary thymocytes and a thymocyte cell line, and observed a significant reduction in cell proliferation. Altogether, we suggest that increased MYC stability is a key mechanism in this ALL model.
Finally, to understand the mechanism that could be responsible for MYC stability we tested one pathway that could be involved. We saw, in both enrichment analysis and at the protein level, that the serine/threonine kinase PLK-1 was significantly increased when both IL7Rα and NRAS mutants were expressed. Most importantly, NRAS (G13D) is that which is responsible for this increase (Figure 7C), which demonstrates that NRAS could be one of the PLK-1 regulators. PLK-1 has previously been shown to be a MYC positive regulator by inhibiting the FBWX-7 E3 ligase which targets MYC for degradation.15,42 Since PLK-1 is also one of the MYC target genes, increases in either PLK-1 or MYC can induce a positive feedback loop increasing both proteins (Figure 8B). There are two major pathways regulated by RAS that are known to stabilize MYC: 1) the Raf/ERK pathway, which phosphorylates MYC on Ser62 that is required for its stabilization33 (Figure 8A); 2) the PI3K/AKT pathway which indirectly increases the stabilization of phosphorylated MYC in Ser62 by inhibiting GSKα/β activation; the latter phosphorylates MYC on Thr58, targeting it for degradation22,33 (Figure 8A). Our data show that both p-MYC on Thr58 and Ser62 are accumulated in ALL primary cells, which suggests that GSK-3α/β retains some activity; nevertheless, MYC is not sent for proteasomal degradation. The latter supports our hypothesis that PLK-1 is involved in MYC stabilization, possibly through inhibiting the E3 ligase, FBWX-7 (Figure 8B). Overall, our study shows that combination of a gain-of-function mutation in human IL7Rα together with overexpression of MYC, generates severe ALL in mice. We suggest that NRAS (G13D) mutation acts via increasing MYC stability, and, therefore, offers MYC as an attractive target in ALL, which frequently involves the IL-7R pathway together with RAS mutations.
Supplementary Material
Acknowledgments
We are grateful to Megan Karwan and Jeff Carell from the Flow Cytometric Unit. We thank Susan Mackem for providing MYC floxed mice. We also thank Elijah Edmondson and his team at the IHC unit NCI/NIH, Maggie Cam from the CCBR unit NCI/NIH, and Lisa M. Miller Jenkins from the Laboratory of Biochemistry and Molecular Biology NCI/NIH. All illustrations were created using BioRender software.
Funding Statement
Funding: This research was supported by the intramural program of the National Cancer Institute, National Institutes of Health.
Data-sharing statement
All data for this work are available either through the detailed Online Supplementary Appendix or upon request.
References
- 1.Cramer SD, Hixon JA, Andrews C, et al. Mutant IL-7Rα and mutant NRas are sufficient to induce murine T cell acute lymphoblastic leukemia. Leukemia. 2018;32(8):1795-1882. [DOI] [PMC free article] [PubMed] [Google Scholar]
- 2.McMahon CM, Luger SM. Relapsed T cell ALL: current approaches and new directions. Curr Hematol Malig Rep. 2019;14(2):83-93. [DOI] [PubMed] [Google Scholar]
- 3.Lato MW, Przysucha A, Grosman S, Zawitkowska J, Lejman M. The new therapeutic strategies in pediatric T-cell acute lymphoblastic leukemia. Int J Mol Sci. 2021;22(9):4502. [DOI] [PMC free article] [PubMed] [Google Scholar]
- 4.Rodrigues GOL, Cramer SD, Winer HY, et al. Mutations that collaborate with IL-7Ra signaling pathways to drive ALL. Adv Biol Regul. 2021;80:100788. [DOI] [PubMed] [Google Scholar]
- 5.Oliveira ML, Akkapeddi P, Ribeiro D, Melao A, Barata JT. IL-7R-mediated signaling in T-cell acute lymphoblastic leukemia: an update. Adv Biol Regul. 2019;71:88-96. [DOI] [PMC free article] [PubMed] [Google Scholar]
- 6.Roberts KG, Li Y, Payne-Turner D, et al. Targetable kinase-activating lesions in Ph-like acute lymphoblastic leukemia. N Engl J Med. 2014;371(11):1005-1015. [DOI] [PMC free article] [PubMed] [Google Scholar]
- 7.Zenatti PP, Ribeiro D, Li W, et al. Oncogenic IL7R gain-of-function mutations in childhood T-cell acute lymphoblastic leukemia. Nat Genet. 2011;43(10):932-939. [DOI] [PMC free article] [PubMed] [Google Scholar]
- 8.Shochat C, Tal N, Bandapalli OR, et al. Gain-of-function mutations in interleukin-7 receptor-alpha (IL7R) in childhood acute lymphoblastic leukemias. J Exp Med. 2011;208(5):901-908. [DOI] [PMC free article] [PubMed] [Google Scholar]
- 9.Yokoyama K, Yokoyama N, Izawa K, et al. In vivo leukemogenic potential of an interleukin 7 receptor alpha chain mutant in hematopoietic stem and progenitor cells. Blood. 2013;122(26):4259-4263. [DOI] [PubMed] [Google Scholar]
- 10.Tremblay CS, Curtis DJ. The clonal evolution of leukemic stem cells in T-cell acute lymphoblastic leukemia. Curr Opin Hematol. 2014;21(4):320-325. [DOI] [PubMed] [Google Scholar]
- 11.Oliveira ML, Veloso A, Garcia EG, et al. Mutant IL7R collaborates with MYC to induce T-cell acute lymphoblastic leukemia. Leukemia. 2022;36(6):1533-1540. [DOI] [PMC free article] [PubMed] [Google Scholar]
- 12.Ward AF, Braun BS, Shannon KM. Targeting oncogenic Ras signaling in hematologic malignancies. Blood. 2012;120(17):3397-3406. [DOI] [PMC free article] [PubMed] [Google Scholar]
- 13.Tasian SK, Loh ML, Hunger SP. Childhood acute lymphoblastic leukemia: integrating genomics into therapy. Cancer. 2015;121(20):3577-3590. [DOI] [PMC free article] [PubMed] [Google Scholar]
- 14.Fanidi A, Harrington EA, Evan GI. Cooperative interaction between c-myc and bcl-2 proto-oncogenes. Nature. 1992;359(6395):554-556. [DOI] [PubMed] [Google Scholar]
- 15.Xiao D, Yue M, Su H, et al. Polo-like kinase-1 regulates Myc stabilization and activates a feedforward circuit promoting tumor cell survival. Mol Cell. 2016;64(3):493-506. [DOI] [PubMed] [Google Scholar]
- 16.Wang J, Zhou M, Xu JY, Chen B, Ouyang J. Combination of BCL-2 and MYC protein expression improves high-risk stratification in diffuse large B-cell lymphoma. Onco Targets Ther. 2015;8:2645-2650. [DOI] [PMC free article] [PubMed] [Google Scholar]
- 17.De Smedt R, Morscio J, Reunes L, et al. Targeting cytokine- and therapy-induced PIM1 activation in preclinical models of T-cell acute lymphoblastic leukemia and lymphoma. Blood. 2020;135(19):1685-1695. [DOI] [PubMed] [Google Scholar]
- 18.Senkevitch E, Li W, Hixon JA, et al. Inhibiting Janus Kinase 1 and BCL-2 to treat T cell acute lymphoblastic leukemia with IL7-Ralpha mutations. Oncotarget. 2018;9(32):22605-22617. [DOI] [PMC free article] [PubMed] [Google Scholar]
- 19.Silva A, Laranjeira AB, Martins LR, et al. IL-7 contributes to the progression of human T-cell acute lymphoblastic leukemias. Cancer Res. 2011;71(14):4780-4789. [DOI] [PubMed] [Google Scholar]
- 20.Hofmeister R, Khaled AR, Benbernou N, et al. Interleukin-7: physiological roles and mechanisms of action. Cytokine Growth Factor Rev. 1999;10(1):41-60. [DOI] [PubMed] [Google Scholar]
- 21.Chen H, Liu H, Qing G. Targeting oncogenic Myc as a strategy for cancer treatment. Signal Transduct Target Ther. 2018;3:5. [DOI] [PMC free article] [PubMed] [Google Scholar]
- 22.Blackburn JS, Liu S, Wilder JL, et al. Clonal evolution enhances leukemia-propagating cell frequency in T cell acute lymphoblastic leukemia through Akt/mTORC1 pathway activation. Cancer Cell. 2014;25(3):366-378. [DOI] [PMC free article] [PubMed] [Google Scholar]
- 23.Fairlie WD, Lee EF. Co-operativity between MYC and BCL-2 pro-survival proteins in cancer. Int J Mol Sci. 2021;22(6):2841. [DOI] [PMC free article] [PubMed] [Google Scholar]
- 24.Rudolph D, Steegmaier M, Hoffmann M, et al. BI 6727, a Pololike kinase inhibitor with improved pharmacokinetic profile and broad antitumor activity. Clin Cancer Res. 2009;15(9):3094-3102. [DOI] [PubMed] [Google Scholar]
- 25.Gorlick R, Kolb EA, Keir ST, et al. Initial testing (stage 1) of the Polo-like kinase inhibitor volasertib (BI 6727), by the Pediatric Preclinical Testing Program. Pediatr Blood Cancer. 2014;61(1):158-164. [DOI] [PMC free article] [PubMed] [Google Scholar]
- 26.Abbou S, Lanvers-Kaminsky C, Daudigeos-Dubus E, et al. Polo-like kinase inhibitor volasertib exhibits antitumor activity and synergy with vincristine in pediatric malignancies. Anticancer Res. 2016;36(2):599-609. [PubMed] [Google Scholar]
- 27.Li J, Ohmura S, Marchetto A, et al. Therapeutic targeting of the PLK1-PRC1-axis triggers cell death in genomically silent childhood cancer. Nat Commun. 2021;12(1):5356. [DOI] [PMC free article] [PubMed] [Google Scholar]
- 28.Roderick JE, Tesell J, Shultz LD, et al. c-Myc inhibition prevents leukemia initiation in mice and impairs the growth of relapsed and induction failure pediatric T-ALL cells. Blood. 2014;123(7):1040-1050. [DOI] [PMC free article] [PubMed] [Google Scholar]
- 29.Delmore JE, Issa GC, Lemieux ME, et al. BET bromodomain inhibition as a therapeutic strategy to target c-Myc. Cell. 2011;146(6):904-917. [DOI] [PMC free article] [PubMed] [Google Scholar]
- 30.Vanden Bempt M, Demeyer S, Broux M, et al. Cooperative enhancer activation by TLX1 and STAT5 drives development of NUP214-ABL1/TLX1-positive T cell acute lymphoblastic leukemia. Cancer Cell. 2018;34(2):271-285.e7. [DOI] [PMC free article] [PubMed] [Google Scholar]
- 31.Mahauad-Fernandez WD, Felsher DW. The Myc and Ras partnership in cancer: indistinguishable alliance or contextual relationship? Cancer Res. 2020;80(18):3799-3802. [DOI] [PMC free article] [PubMed] [Google Scholar]
- 32.Kerkhoff E, Houben R, Loffler S, et al. Regulation of c-myc expression by Ras/Raf signalling. Oncogene. 1998;16(2):211-216. [DOI] [PubMed] [Google Scholar]
- 33.Sears R, Nuckolls F, Haura E, et al. Multiple Ras-dependent phosphorylation pathways regulate Myc protein stability. Genes Dev. 2000;14(19):2501-2514. [DOI] [PMC free article] [PubMed] [Google Scholar]
- 34.Ren Y, Bi C, Zhao X, et al. PLK1 stabilizes a MYC-dependent kinase network in aggressive B cell lymphomas. J Clin Invest. 2018;128(12):5517-5530. [DOI] [PMC free article] [PubMed] [Google Scholar]
- 35.Murga-Zamalloa C, Polk A, Hanel W, et al. Polo-like-kinase 1 (PLK-1) and c-myc inhibition with the dual kinase-bromodomain inhibitor volasertib in aggressive lymphomas. Oncotarget. 2017;8(70):114474-114480. [DOI] [PMC free article] [PubMed] [Google Scholar]
- 36.Winer H, Rodrigues GOL, Hixon JA, et al. IL-7: comprehensive review. Cytokine. 2022;160:156049. [DOI] [PubMed] [Google Scholar]
- 37.Kim R, Boissel N, Touzart A, et al. Adult T-cell acute lymphoblastic leukemias with IL7R pathway mutations are slow-responders who do not benefit from allogeneic stem-cell transplantation. Leukemia. 2020;34(7):1730-1740. [DOI] [PubMed] [Google Scholar]
- 38.Klinger MB, Guilbault B, Goulding RE, Kay RJ. Deregulated expression of RasGRP1 initiates thymic lymphomagenesis independently of T-cell receptors. Oncogene. 2005;24(16):2695-2704. [DOI] [PubMed] [Google Scholar]
- 39.Jiang Q, Li WQ, Hofmeister RR, et al. Distinct regions of the interleukin-7 receptor regulate different Bcl2 family members. Mol Cell Biol. 2004;24(14):6501-6513. [DOI] [PMC free article] [PubMed] [Google Scholar]
- 40.La Starza R, Messina M, Gianfelici V, et al. High PIM1 expression is a biomarker of T-cell acute lymphoblastic leukemia with JAK/ STAT activation or t(6;7)(p21;q34)/TRB@-PIM1 rearrangement. Leukemia. 2018;32(8):1807-1810. [DOI] [PubMed] [Google Scholar]
- 41.Zhang Y, Wang Z, Li X, Magnuson NS. Pim kinase-dependent inhibition of c-Myc degradation. Oncogene. 2008;27(35):4809-4819. [DOI] [PubMed] [Google Scholar]
- 42.Wang D, Pierce A, Veo B, et al. A Regulatory loop of FBXW7-MYC-PLK1 controls tumorigenesis of MYC-driven medulloblastoma. Cancers (Basel). 2021;13(3):387. [DOI] [PMC free article] [PubMed] [Google Scholar]
Associated Data
This section collects any data citations, data availability statements, or supplementary materials included in this article.
Supplementary Materials
Data Availability Statement
All data for this work are available either through the detailed Online Supplementary Appendix or upon request.


