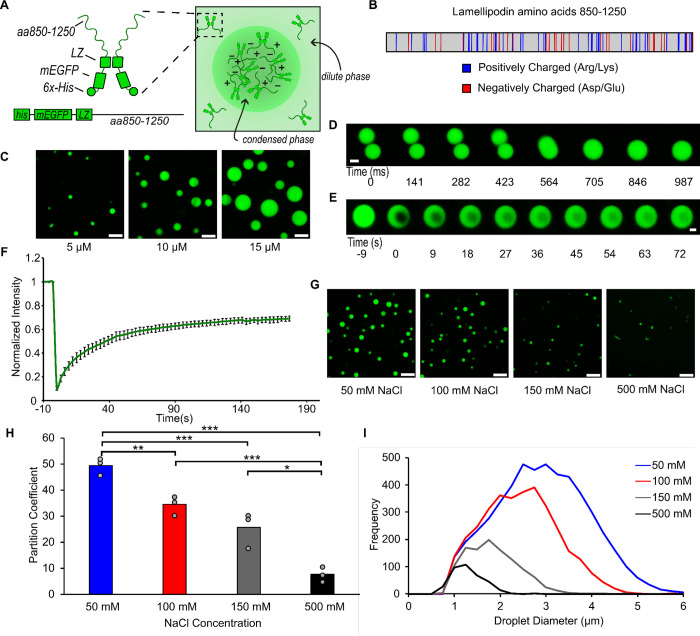
Figure 1. A minimal version of Lamellipodin phase separates into liquid-like condensates.
A) Left: Schematic depicting domains of mini-Lpd (LZ: Leucine Zipper). Right: schematic depicting condensate formation B) Amino acid sequence of amino acids 850–1250 of Lamellipodin with positively charged (blue) and negatively charged (red) amino acids highlighted. C) Condensates formed by mini-Lpd at increasing protein concentrations in a buffer containing 20 mM Tris (pH 7.4), 150 mM NaCl, and 5 mM TCEP. Scale bars are 5 μm. D) Time course of condensate fusion event for 10 μM mini-Lpd in buffer containing 20 mM Tris (pH 7.4), 50 mM NaCl, and 5 mM TCEP. Scale bar 2 μm. E) Representative images of fluorescence recovery after photobleaching of a mini-Lpd condensate. Scale bar 2 μm. F) Plot of average fluorescence recovery after photobleaching for mini-Lpd condensates. Lines are the average recovery +/− s.d. at each timepoint for each protein across n=6 independent samples. G) mini-Lpd condensates formed in buffers with increasing ionic strength. mini-Lpd concentration is 10 μM in all conditions. Scale bars are 5 μm. H) Quantification of the partitioning of mini-Lpd into condensates formed from 10 μM mini-Lpd under the conditions shown in G. Partition coefficient is defined at the ratio of protein intensity inside the condensates to that in the bulk solution. Bars represent the average across three independent experiments with at least three images quantified per experiment. One asterisk denotes p<.05, two asterisks denote p<.01, and three asterisks denote p<.001 using an unpaired, two-tailed t-test on the means of the replicates N=3. I) Distribution of condensate diameters for the conditions shown in G across three separate replicates for each condition.

