The number needed to treat (NNT) is a useful way of reporting the results of randomised controlled trials.1 In a trial comparing a new treatment with a standard one, the number needed to treat is the estimated number of patients who need to be treated with the new treatment rather than the standard treatment for one additional patient to benefit. It can be obtained for any trial that has reported a binary outcome.
Summary points
The number needed to treat is a useful way of reporting results of randomised clinical trials
When the difference between the two treatments is not statistically significant, the confidence interval for the number needed to treat is difficult to describe
Sensible confidence intervals can always be constructed for the number needed to treat
Confidence intervals should be quoted whenever a number needed to treat value is given
Trials with binary end points yield a proportion of patients in each group with the outcome of interest. When the outcome event is an adverse one, the difference between the proportions with the outcome in the new treatment (pN) and standard treatment (pS) groups is called the absolute risk reduction (ARR=pN−pS). The number needed to treat is simply the reciprocal of the absolute risk difference, or 1/ARR (or 100/ARR if percentages are used rather than proportions). A large treatment effect, in the absolute scale, leads to a small number needed to treat. A treatment that will lead to one saved life for every 10 patients treated is clearly better than a competing treatment that saves one life for every 50 treated. Note that when there is no treatment effect the absolute risk reduction is zero and the number needed to treat is infinite. As we will see below, this causes problems.
As with other estimates, it is important that the uncertainty in the estimated number needed to treat is accompanied by a confidence interval. A confidence interval for the number needed to treat is obtained simply by taking reciprocals of the values defining the confidence interval for the absolute risk reduction.1,2 When the treatment effect is significant at the 5% level, the 95% confidence interval for the absolute risk reduction will not include zero, and thus the 95% confidence interval for the number needed to treat will not include infinity (∞). To take an example, if the ARR is 10% with a 95% confidence interval of 5% to 15%, the NNT is 10 (that is, 100/10) and the 95% confidence interval for the NNT is 6.7 to 20 (that is, 100/15 to 100/5). The case of a treatment effect that is not significant is more difficult. The same finding of ARR=10% with a wider 95% confidence interval for the ARR of −5% to 25% gives a NNT=10 (−20 to 4). There are two difficulties with this confidence interval. Firstly, the number needed to treat can only be positive, and, secondly, the confidence interval does not seem to include the best estimate of 10. To avoid such perplexing results, the number needed to treat is often given without a confidence interval when the treatments are not significantly different. 
A negative number needed to treat indicates that the treatment has a harmful effect. An NNT=−20 indicates that if 20 patients are treated with the new treatment, one fewer would have a good outcome than if they all received the standard treatment. A negative number needed to treat has been called the number needed to harm (NNH).3,4
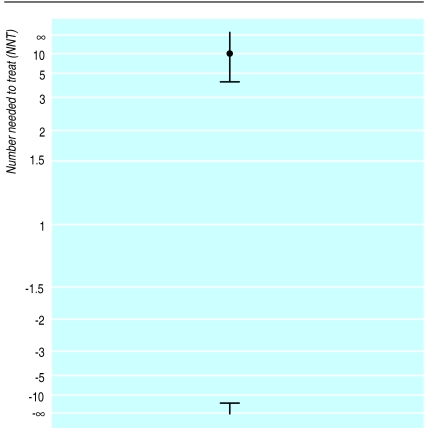
As already noted, the number needed to treat is infinity (∞) when the absolute risk reduction is zero, so the confidence interval calculated as −20 to 4 must include ∞. The confidence interval is therefore peculiar, apparently encompassing two disjoint regions—values of the NNT from 4 to ∞ and values of the NNT from −20 to −∞ (or NNH from 20 to ∞), as shown in figure 1. This situation led McQuay and Moore to observe that in the case of a non-significant difference it is not possible to get a useful confidence interval, and so only a point estimate is available.3
Figure 1.
95% confidence interval for NNT=10
It is not satisfactory for the confidence interval to be presented only when the result is significant. Indeed this goes against advice that the confidence interval is especially useful when the result of a trial is not significant.5 In this article I show how a sensible confidence interval can be quoted for any trial. I also consider the use of the number needed to treat in meta-analysis. I approach the problem initially from a graphical perspective.
Rethinking the NNT scale
The number needed to treat is calculated by taking the reciprocal of the absolute risk reduction. When we obtain the confidence interval for the number needed to treat, we take reciprocals of the values defining the confidence interval for the absolute risk reduction and we reverse their order. As noted, a difficulty arises when the confidence interval for the absolute risk reduction encompasses both positive and negative values, and hence spans zero.
In the example, the 95% confidence interval for the number needed to treat was −20 to 4, or NNH=20 to NNT=4. Before reconsidering the meaning of the confidence interval, I wish to suggest that NNT and NNH are not good abbreviations. It seems more appropriate that the number of patients needed to be treated for one additional patient to benefit or be harmed are denoted NNTB and NNTH respectively, or perhaps NNT(benefit) and NNT(harm). Using these descriptors, the confidence interval can be rewritten as NNTH 20 to NNTB 4. As already noted, this interval does not seem to include the overall estimate of NNTB 10, although figure 1 shows that it does.
When transforming data that are all positive, the effect of taking reciprocals is to reverse the order of the observations. The reciprocal transformation can be applied to negative values too, and the order of these is also reversed, but they remain negative. The overall effect of the transformation is thus quite strange when applied to data with both positive and negative values, as figure 1 illustrates. The confidence interval is peculiar, apparently encompassing two disjoint regions—values of the NNTB from 4 to ∞ and values of the NNTH from 20 to ∞. I say “apparently” because the confidence interval is rather more logical than these values suggest.
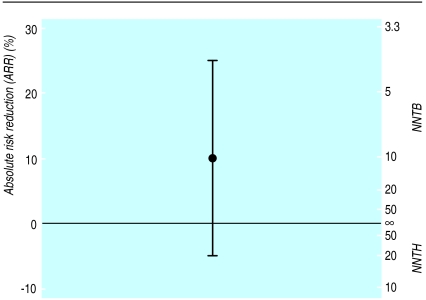
The 95% confidence interval for the absolute risk reduction includes all values from −5% to 25%, including zero. As already noted, the number needed to treat is infinity (∞) when the absolute risk reduction is zero, so the confidence interval calculated as NNTH 20 to NNTB 4 must include infinity. Figure 2 shows the absolute risk reduction and 95% confidence interval for the same example. The left hand axis shows the absolute risk reduction and the right hand scale shows the number needed to treat. Note that the number needed to treat scale now goes from NNTH=1 to NNTB=1 via infinity. It is clear that, rather unusually, infinity is in the middle of the scale, not at the ends. We should consider NNTB=1 as an extreme and unattainable value—it corresponds to the situation in which, say, all patients die if not given the new treatment and all survive with it. The other extreme, NNTH=1, corresponds to the case in which everyone lives unless given the treatment, in which case they all die. The values NNTB=1 and NNTH=1 correspond to ARR=100% and ARR=−100% respectively, and are not shown. Conversely, the midpoint on the number needed to treat scale is the case where the treatment makes no difference (ARR=0 and NNT=∞). We need to remember the absolute risk reduction scale when trying to interpret the number needed to treat and its confidence interval.
“When there is no treatment effect the absolute risk reduction is zero and the number needed to treat is infinite ... this causes problems”
Figure 2.
Relation between the absolute risk reduction (ARR) and number needed to treat and their confidence intervals (NNTB=number needed to treat (benefit); NNTH=number needed to treat (harm)) for the same example as in figure 1
There is an argument that one does not wish to know the number needed to treat unless there is clear evidence of effectiveness, which for convenience alone is often taken as having achieved P<0.05. This advice seems to be based, at least partly, on trying to avoid the difficulty of an infinite number needed to treat rather than statistical soundness. In fact, we might often wish to quote a confidence interval for the number needed to treat when the confidence interval for the absolute risk reduction includes zero. Though this can be done by quoting two separate intervals, such as NNTB 10 (NNTH 20 to ∞ and NNTB 4 to ∞), I suggest that it is done as, for example, NNTB 10 (NNTH 20 to ∞ to NNTB 4), which emphasises the continuity.
Tramèr et al quoted a NNT of −12.5 (−3.7 to ∞) for a trial comparing the antiemetic efficacy of intravenous ondansetron and intravenous droperidol.6 This negative number needed to treat implies that ondansetron was less effective than droperidol and the quoted 95% confidence interval was incomplete. The ARR was−0.08 (−0.27 to 0.11). We can convert this finding to the number needed to treat scale as NNTH=12.5 (NNTH 3.7 to ∞ to NNTB 9.1). With this presentation we can see that an NNTB less than (better than) 9 is unlikely. Similarly incomplete confidence intervals have been presented by other researchers.7,8
Number needed to treat in meta-analysis
In meta-analyses it is desirable to show graphically the results of all the trials with their confidence intervals. The usual type of plot is called a forest plot. When the effect size has been summarised as the relative risk or odds ratio the analysis is based on the logarithms of these values, and the plot is best shown using a log scale for the treatment effect. In this scale the confidence intervals for each trial are symmetrical around the estimate.
“We need to remember the absolute risk reduction scale when trying to interpret the number needed to treat and its confidence interval”
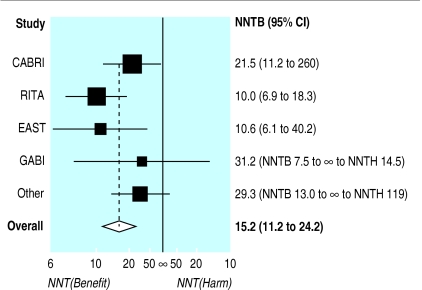
Much the same can be done with the number needed to treat. Once we realise that the number needed to treat should be plotted on the absolute risk reduction scale, it is simple to plot numbers needed to treat with confidence intervals for several trials, even when (as is usual) some of the trials did not show significant results. Figure 3 shows such a plot for eight randomised trials comparing coronary angioplasty with bypass surgery.9 The plot was produced using the absolute risk reduction scale, and then relabelled. Both scales could be shown in the figure. This analysis is based on use of the absolute risk reduction as the effect measure in the meta-analysis. Meta-analysis is often more suitably performed using the relative risk or odds ratio. The number needed to treat can be obtained from the pooled estimates from such analyses if one specifies the control group event rate.10
Figure 3.
Forest plot for meta-analysis of data from eight randomised trials comparing bypass surgery with coronary angioplasty in relation to angina in one year.9 A number needed to treat (benefit) (NNTB) for coronary artery bypass grafting and its 95% confidence interval for each trial and for the overall estimate is shown
A similar approach can be used for comparing numbers needed to treat derived for different interventions (as in fig 4) or for showing treatment effects in subgroups within a large randomised trial. The number needed to treat (benefit) (NNTB) values are shown to the left and number needed to treat (harm) (NNTH) values on the right as it has become more usual to show beneficial effects on the left.
Figure 4.
Summaries of meta-analyses of trials of prophylactic antiemetics in surgery for strabismus in children, showing the number needed to treat (benefit) (NNTB) value (95% confidence interval, NNTB to ∞ to number needed to harm (NNTH)) for each drug. (From Tramèr et al 11)
Comment
The valuable concept of the number need to treat was introduced about 10 years ago.12 Its use has increased in recent years, especially in systematic reviews and in journals of secondary publication such as ACP Journal Club and Evidence-Based Medicine. Confidence intervals are usually quoted for the results of clinical trials, and this is widely recommended.5,13 An exception has been when the number needed to treat is quoted for trials where the treatment effect was not significant. Here confidence intervals have either been omitted or reported incompletely. In this paper I have shown how to produce sensible confidence intervals for the number needed to treat in all cases, both for numerical summary and graphical display. These should be quoted whenever a number needed to treat value is presented.
Acknowledgments
I am grateful to Henry McQuay, Andrew Moore, and David Sackett for helpful discussions about these ideas. I thank the reviewer for suggesting figure 1.
Footnotes
Funding: None.
Conflicts of interest: None.
References
- 1.Cook RJ, Sackett DL. The number needed to treat: a clinically useful measure of treatment effect. BMJ. 1995;310:452–454. doi: 10.1136/bmj.310.6977.452. [DOI] [PMC free article] [PubMed] [Google Scholar]
- 2.Daly LE. Confidence limits made easy: interval estimation using a substitution method. Am J Epidemiol. 1998;147:783–790. doi: 10.1093/oxfordjournals.aje.a009523. [DOI] [PubMed] [Google Scholar]
- 3.McQuay HJ, Moore RA. Using numerical results from systematic reviews in clinical practice. Ann Intern Med. 1997;126:712–720. doi: 10.7326/0003-4819-126-9-199705010-00007. [DOI] [PubMed] [Google Scholar]
- 4.Sackett DL, Richardson WS, Rosenberg W, Haynes RB. Evidence-based medicine. How to practice and teach EBM. London: Churchill-Livingstone; 1997. p. 208. [Google Scholar]
- 5.Altman DG, Gore SM, Gardner MJ, Pocock SJ. Statistical guidelines for contributors to medical journals. In: Gardner MJ, Altman DG, editors. Statistics with confidence. London: BMJ; 1989. pp. 83–100. [DOI] [PMC free article] [PubMed] [Google Scholar]
- 6.Tramèr MR, Moore RA, Reynolds DJM, McQuay HJ. A quantitative systematic review of ondansetron in treatment of established postoperative nausea and vomiting. BMJ. 1997;314:1088–1092. doi: 10.1136/bmj.314.7087.1088. [DOI] [PMC free article] [PubMed] [Google Scholar]
- 7.Silagy C, Mant D, Fowler G, Lodge M. Meta-analysis on efficacy of nicotine replacement therapies in smoking cessation. Lancet. 1994;343:139–142. doi: 10.1016/s0140-6736(94)90933-4. [DOI] [PubMed] [Google Scholar]
- 8.Miller DB. Secondary prevention for ischemic heart disease. Arch Intern Med. 1997;157:2045–2052. [PubMed] [Google Scholar]
- 9.Pocock SJ, Henderson RA, Rickards AF, Hampton JR, King SB, Hamm CW, et al. Meta-analysis of randomised trials comparing coronary angioplasty with bypass surgery. Lancet. 1995;346:1184–1189. doi: 10.1016/s0140-6736(95)92897-9. [DOI] [PubMed] [Google Scholar]
- 10.Sackett DL, Deeks JJ, Altman DG. Down with odds ratios! Evidence-Based Med. 1996;1:164–166. [Google Scholar]
- 11.Tramèr MR, Moore RA, McQuay HJ. Prevention of vomiting after paediatric strabismus surgery: a systematic review using the numbers-needed-to-treat method. Br J Anaesth. 1995;75:556–561. doi: 10.1093/bja/75.5.556. [DOI] [PubMed] [Google Scholar]
- 12.Laupacis A, Sackett DL, Roberts RS. An assessment of clinically useful measures of the consequences of treatment. N Engl J Med. 1988;318:1728–1733. doi: 10.1056/NEJM198806303182605. [DOI] [PubMed] [Google Scholar]
- 13.Begg C, Cho M, Eastwood S, Horton R, Moher D, Olkin I, et al. Improving the quality of reporting of randomized controlled trials: the CONSORT statement. JAMA. 1996;276:637–639. doi: 10.1001/jama.276.8.637. [DOI] [PubMed] [Google Scholar]


