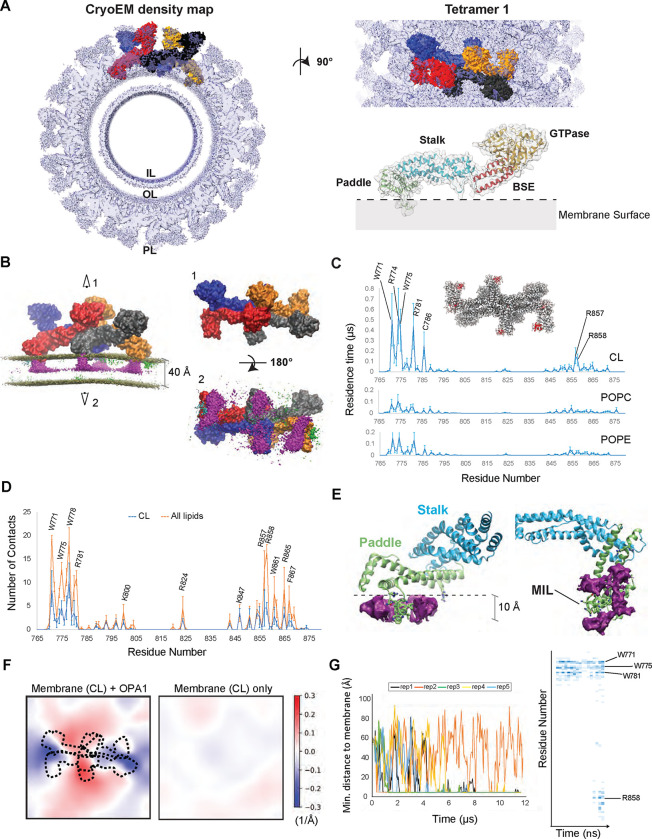
Figure 1. Interactions between lipids and S-OPA1 residues and changes in membrane topology.
(A) The S-OPA1 tetramer model was extracted from the cryoEM structure of the membrane-bound S-OPA1 polymer in membrane-proximal conformation (PDB ID: 8CT1) and fitted into cryoEM density map (EMDB ID: 26977). Each subunit of the tetramer is shown in surface representation and different colors. The extracted ribbon model for S-OPA1 monomer is colored in orange (GTPase), red (BSE), blue (stalk), and green (PD) to highlight the domain organization of S-OPA1 and the surface is depicted as semi-transparent solid density. IL, Inner Leaflet; OL, Outer Leaflet; PL, Protein Layer. (B) The CG MD simulations for tetramer 1 docked on a membrane containing 20% CL, 40% POPC and 40% POPE and relaxed through the several microsecond simulations. Each OPA1 monomer is shown in surface representation with a different color. The panel displays the trajectory-averaged density of lipid headgroup beads and the slight average curvature experienced by the membrane. The density for all CL beads is colored in magenta and indicate the clustering of CL molecules at the protein-membrane contact sites. Top (1) and bottom (1) views of the S-OPA1 tetramer simulated on CL-enriched membranes. (C) Residence times for contacts between protein and lipid beads are shown for CL, POPE and POPC and are calculated for all four subunits in each of the three CG MD simulation replicates for tetramer 1. The red regions within the tetrameric model indicate the position of the PD residues with longer residence times. (D) Average number of protein-lipid contacts per residue were calculated using the last 300 ns of the AA MD simulations in 3 independent replicas. (E) AA MD simulations show average CL density clustering near protein-membrane contact sites. The simulations were set up by using a monomeric S-OPA1 model extracted from the tetramer 1 and membranes mimicking the lipid composition of the mitochondrial inner membrane (IM) and run in triplicates. (F) Membrane deformation in CG MD simulations. Mean membrane curvatures averaged throughout the last 4 μs of CG MD simulations for tetramer 1 (left) compared to a control simulation without protein. The dashed lines indicate the position of the S-OPA1 tetramer shown from the top. The x and y axes indicate the dimensions of the membrane in Angstroms. (G) The trajectories of OPA1-membrane interactions using S-OPA1 starting model positioned ~60 Å away from the membrane. The graph shows the minimal distance between the protein and membrane, calculated from five independent replicas of the simulation (left). The heat map was generated using one of the replicas that shows strong binding to the membrane and displays the number of membrane contacts for S-OPA1 residues over time (nanoseconds).

