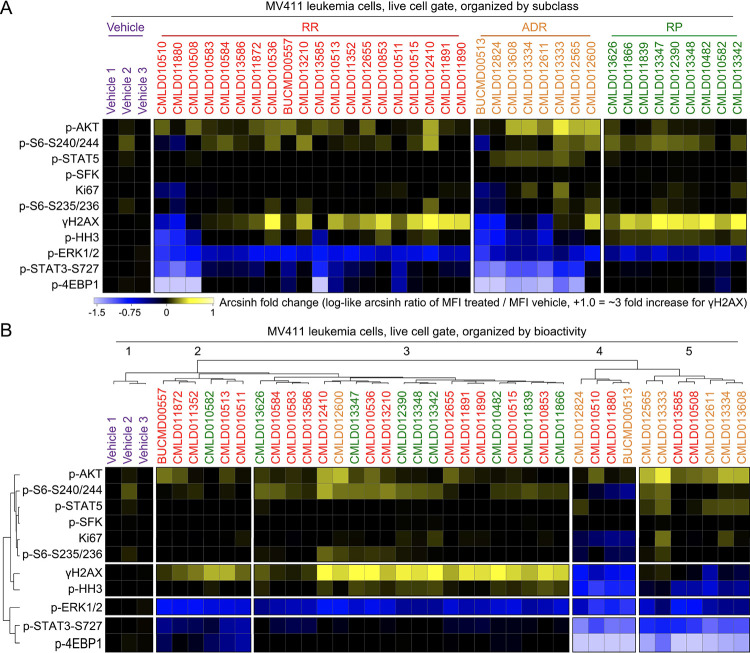
Figure 3 – Rocaglate subclasses had distinct patterns of bioactivity.
A) Heatmap depicting the arcsinh ratio of the median fluorescence intensity for each compound (listed on top of heatmap) and readout (listed left of heatmap) by the median fluorescence intensity of Vehicle 1. Cells on the heatmap range from light blue for the lowest values to bright yellow for the highest values. Compounds are grouped and colored according to the rocaglate subclass listed on the top of the plot. B) Heatmap as in Figure 2B clustered according to a dendrogram of the transformed median fluorescence intensity for each compound and readout.

