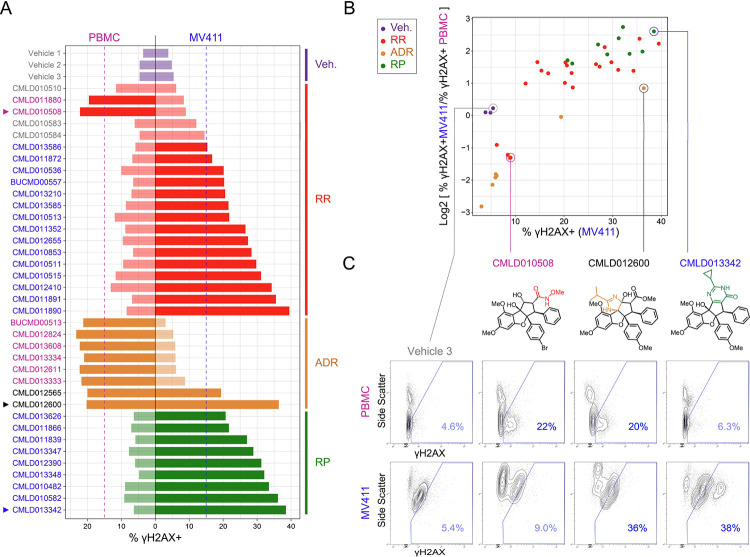
Figure 4 – MV411 specific activity was observed in the RP subfamily and some regular rocaglates.
A) Bar plot of percentage of γH2AX positive (% γH2AX +) cells for each compound grouped and colored according to rocaglate subclass listed on the right side of the plot. Bars on the left side of the vertical black line correspond to the compound response in peripheral blood mononuclear cells (PBMC) and the right side corresponds to the compound response in MV411 cells. The dotted vertical blue line corresponds to a significance threshold for % γH2AX+ cells in MV411 and the dotted pink line corresponds to a significance threshold for % γH2AX+ cells in PBMC. Compounds that cross the threshold have darkened colored bars. The compound name (or vehicle) is listed on the far left side of plot colored according to the following system: blue = increases % γH2AX+ cells past threshold in MV411 and not in PBMC, pink = increases % γH2AX+ cells past threshold in PBMC and not in MV411, light grey = does not increase % γH2AX+ cells past threshold in either cell type, dark grey = increases % γH2AX+ cells past threshold in both cell types. Arrows are displayed to the left of compounds that will be shown in Figure 4C. B) Scatter plot of % γH2AX+ cells in MV411 on the x-axis and the log2 fold ratio of % γH2AX+ cells in MV411 to % γH2AX+ cells in PBMC on the y-axis. Each dot corresponds to a compound colored according to rocaglate structural subclass. Compounds that will be shown in Figure 4C are circled and labeled. C) Contour plots of Side Scatter vs. γH2AX for Vehicle 3, CMLD010508, CMLD012600, and CMLD013342, respectively from left to right in PBMC (top) and MV411 (bottom). The blue line indicates the γH2AX+ gate. The % γH2AX+ cells within the gate is written in blue in the lower right corner. Corresponding structures for each compound are depicted below the compound name.

