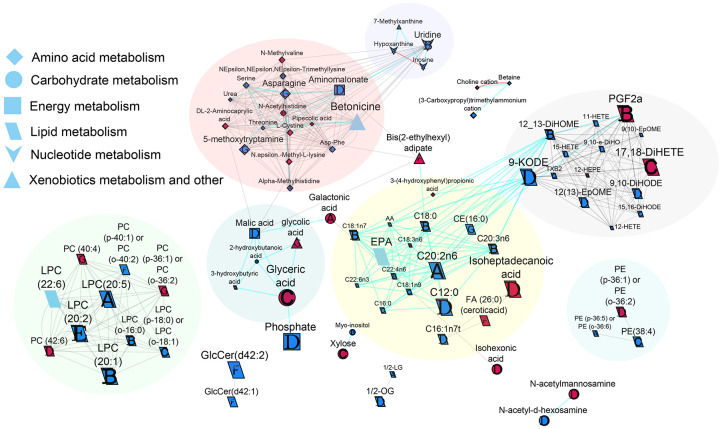
Figure 4.
Biochemical network displaying differences between almond and cracker group AUCs over different time periods. Metabolites are connected based on biochemical relationships (orange, KEGG RPAIRS), measured structural similarity (blue, Tanimoto coefficient ≥ 0.7), or manually annotated structural similarity (grey). Metabolite size denotes the effect size (Hedge’s g, almond vs cracker group). Metabolite color represents the direction of the effect size, for example blue represents almond > cracker overall (p-value<0.05) and pink represents almond < cracker overall (p-value<0.05). Letters denote the time period for which significant (p-value<0.05) group effects were observed. For example, “A” represents AUC0-15 min only, “B” represents AUC0-30 min only or in combination with AUC0-15 min, “C” represents AUC0-60 min only or in combination with AUC0-15 min, AUC0-30 min, “D” represents AUC0-120min only or in combination with AUC0-15 min, AUC0-30 min, or AUC0-60 min, “E” represents AUC15-30 min only, “F” represents AUC30-60 min only, and “G” represents AUC60-120 min only or in combination with AUC30-60 min. If metabolites showed significant changes over multiple time periods, only the time period showing the largest effect size was colored. P-values are derived from the time 0-adjusted linear model analysis. Shapes display primary metabolic pathways or structural superclass designations obtained via ClassyFire. Clusters of metabolites are circled. Significant metabolites which did not have KEGG identifiers are included as independent nodes with manually annotated edges within their respective pathway clusters. Diglyceride and triglyceride clusters are not depicted in this network map for clarity. CE, cholesterol ester; LPC, lysophosphotidylcholine; PC, phosphotidylcholine; PE, phosphatidylethanolamine.

