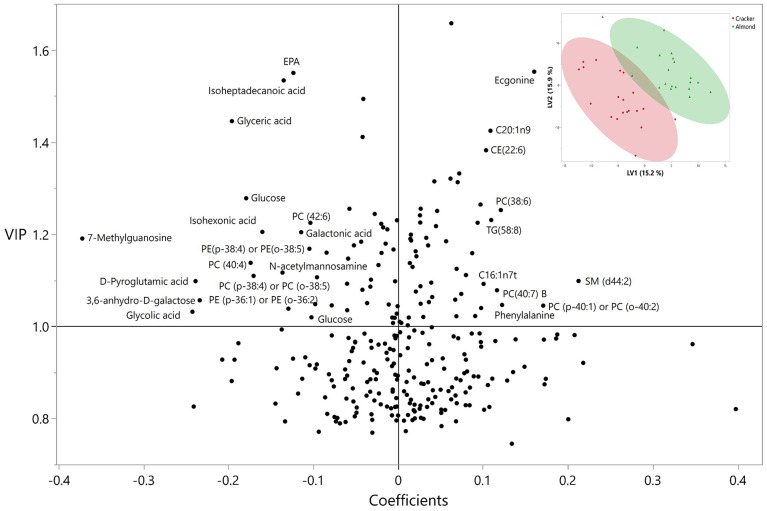
Figure 5.
VIP vs. coefficient plot of the metabolites from the PLS-DA analysis conducted on the metabolite AUC and indices to differentiate between almond and cracker groups. Labels only marked for metabolites with VIP ≥ 0.1, and coefficients ≥ 0.1 or ≤ −0.1. Not all data points are shown. Plot of latent variable 1 versus 2 of the PLS-DA analysis inset.

