



Abstract
Autoreactive CD8+ T cells play a key role in type 1 diabetes (T1D), but the antigen spectrum that activates autoreactive CD8+ T cells remains unclear. Endoplasmic reticulum stress (ERS) has been implicated in β-cell autoantigen generation. Here, we analyzed the major histocompatibility complex class I (MHC-I)-associated immunopeptidome (MIP) of islet β-cells under steady and ERS conditions and found that ERS reshaped the MIP of β-cells and promoted the MHC-I presentation of a panel of conventional self-peptides. Among them, OTUB258-66 showed immunodominance, and the corresponding autoreactive CD8+ T cells were diabetogenic in nonobese diabetic (NOD) mice. High glucose intake upregulated pancreatic OTUB2 expression and amplified the OTUB258-66-specific CD8+ T-cell response in NOD mice. Repeated OTUB258-66 administration significantly reduced the incidence of T1D in NOD mice. Interestingly, peripheral blood mononuclear cells (PBMCs) from patients with T1D, but not from healthy controls, showed a positive IFN-γ response to human OTUB2 peptides. This study provides not only a new explanation for the role of ERS in promoting β-cell-targeted autoimmunity but also a potential target for the prevention and treatment of T1D. The data are available via ProteomeXchange with the identifier PXD041227.
Keywords: immunopeptidome, ERS, T1D, OTUB2, CD8+ T cells
Subject terms: Autoimmunity, Mechanisms of disease
Introduction
T1D is an organ-specific autoimmune disease caused mainly by the destruction of islet β-cells by self-reactive T cells. Globally, the incidence of T1D has increased by an average annual rate of 3 ~ 4% over the past three decades, and while this disease can occur at any age, the incidence peaks in the age range of approximately 10 ~ 14 years [1]. Although supplemental insulin therapy is well established, there is no curative treatment for T1D, and patients with T1D remain at high risk of serious complications; therefore, T1D is still a great threat to adolescents [2]. To date, the entire disease initiation process is not completely understood, even after decades of research. HLA class II genes, such as HLA-DQ8, are involved in the development of T1D, providing strong evidence that CD4+ T-cell responses against β-cell antigens play a pivotal role in the development of T1D in humans [3]. Consistently, murine H2-Ag7 is highly homologous to the human HLA-DQ8 molecule, and its presentation of autoantigens to CD4+ T cells is an important contributor to T1D in NOD mice [4, 5]. In addition, macrophages play an indispensable role in islet autoimmune initiation in NOD mice [6, 7]. It is now thought that autoreactive CD8+ T cells occupy a central position in the destruction of pancreatic β-cells and help maintain islet inflammation [8]. CD8+ T cells are the first effector cells to infiltrate islets and destroy β-cells [9]. Autoreactive CD8+ T cells attack islet β-cells by specifically recognizing self-peptides presented by MHC class I molecules on the cell surface [10]. MHC class I genes were identified as T1D susceptibility genes independent of MHC class II alleles [11]. NOD mice with MHC-I, β2-microglobulin or CD8α gene deletion do not develop T1D, and adoptive transfer of pancreas-infiltrating CD8+ T cells from NOD mice into nonobese diabetic/severe combined immunodeficiency (NOD/scid) mice can induce T1D onset [12].
To date, the β-cell autoantigen spectrum that drives autoreactive CD8+ T-cell responses in T1D has not been completely elucidated. The collection of peptides presented by MHC-I molecules is called the MHC-I-associated immunopeptidome (MIP), and its composition is variable but precisely regulated by intrinsic and extrinsic cellular factors [13]. The emerging self-peptides in the MIP induced by certain pathological factors may contain targets for CD8+ T-cell recognition and response [14]. However, thus far, the direct identification of self-peptide ligands derived from the MIP of β-cells and recognized by autoreactive CD8+ T cells has been limited in T1D studies.
ERS is a self-protective cellular mechanism that activates the unfolded protein response (UPR) in response to misfolded or unfolded protein aggregation in the ER lumen [15]. However, pathological ERS that is overly strong or prolonged can cause cell dysfunction and apoptosis, which are closely related to the occurrence and development of many diseases, including T1D [16, 17]. Islet β-cells are endocrine cells with an abundant ER system that folds, transports and processes newly synthesized insulin in response to changes in blood glucose levels in real time, which makes islet β-cells extremely sensitive to ERS [18]. Many environmental factors, including viral infection [19], chemical factors [20], reactive oxygen species [21], hyperglycemia [22], and inflammation [23], can evoke pathological ERS in β-cells. For example, high sugar consumption has been suggested as a potential environmental risk factor closely related to T1D progression [24]. Our recent study demonstrated that high glucose intake accelerated T1D onset in NOD mice by causing abnormal ERS in islet β-cells [25].
Recent studies have demonstrated that pathological ERS can cause islet β-cells to produce “neo-autoantigens” via abnormal modifications [26], gene mRNA open reading frame shifts [27] and discontinuous peptide fragment splicing [28], thereby allowing islet β-cells to be recognized and responded to by autoreactive T cells (hereinafter referred to as the visibility of β-cells to the immune system). However, the conventional self-peptides that are naturally processed and presented by MHC-I molecules in β-cells in a pathological ERS conditions, especially those recognized by autoreactive CD8+ T cells, have been largely ignored. Here, by comparative analysis of the landscape of the MIP isolated from a NOD mouse β-cell line under steady and ERS conditions, we discovered a novel ERS-associated conventional diabetogenic self-peptide derived from the ubiquitin thioesterase OTUB2 based on its reinforced MHC-I presentation in the β-cell line under ERS conditions.
Results
High-glucose or thapsigargin treatment reshapes the MIP of NIT-1 β-cells and promotes the MHC-I presentation of a panel of conventional self-peptides
To investigate whether ERS induction could enhance the immune visibility of β-cells to peripheral CD8+ T cells from NOD mice, a NOD mouse-derived β-cell line, NIT-1, was pretreated with high glucose (HG) or the classic ERS inducer thapsigargin (TG) and then cocultured with NOD mouse splenocytes lacking CD4+ T cells for 24 h. IFN-γ ELISPOT analysis showed that NIT-1 cells pretreated with 20 mM HG for 24 h had the strongest ability to stimulate NOD mouse CD4- splenocytes to secrete IFN-γ (Fig. S1A, B), while treatment with 5 μM TG for 0.5 h also significantly enhanced the visibility of NIT-1 cells (Fig. S1D, E). These responses were significantly weakened by an anti-H-2Kd antibody (Fig. S1C, F), indicating that NIT-1-stimulated IFN-γ secretion by NOD mouse CD4- splenocytes was primarily MHC class I molecule-dependent. However, HG or TG treatment did not significantly change the level of MHC class I molecules on the surface of NIT-1 cells (Fig. S1G). Furthermore, quantitative real-time PCR (qPCR) and western blot results confirmed that both HG and TG treatment effectively induced sustained and enhanced ERS in NIT-1 cells (Fig. S1H, I). Tauroursodeoxycholic acid (TUDCA), a classic ERS inhibitor, significantly weakened the HG- and TG-induced increases in the immune visibility of NIT-1 cells to NOD mouse splenocytes (Fig. S1J).
Given that CD8+ T cells respond by scanning the immunopeptides of target cells with their receptors, we then questioned whether the increased immune visibility of ER-stressed NIT-1 β-cells to CD8+ T cells from NOD mice was due to changes in the MIP induced by HG or TG treatment. To establish a dataset for the β-cell-derived MIP, nonstressed NIT-1 cells (NIT-1-NC) or NIT-1 cells with ERS induced by HG (NIT-1-HG) or TG (NIT-1-TG) were lysed for immune purification of peptide-MHC-I complexes. The MHC-I-bound peptides were then acid-eluted and analyzed by liquid chromatography-tandem mass spectrometry (LC-MS/MS) (Fig. 1A). We matched the MS spectra against a custom mouse MHC-I-targeted peptide database we previously established with no cleavage at a false discovery rate (FDR) of 5% [29] and included all identified entries in subsequent analyses (Supplementary Table 1). We ultimately obtained a total of 214, 219 and 314 unique conventional H-2Kd-restricted peptides, probably from 198, 203 and 292 source proteins in the MIP of the NIT-1-NC, NIT-1-HG and NIT-1-TG groups, respectively (Fig. 1B). The identified peptides were mainly 9 amino acids in length (Fig. 1C); most ( > 80%) were predicted to be strong binders (SBs) with a % rank <0.5 (NetMHC-4.0) (Fig. 1D) and showed a typical H-2Kd-binding motif with tyrosine and leucine or isoleucine as the main anchor residues on P2 and P9, respectively (Fig. 1E). These data indicated that the NIT-1 cell-derived H-2Kd-restricted MIP datasets were highly reliable. Unfortunately, we identified only a much smaller number of H-2Db-restricted peptides in the NIT-1 cell-derived MIP (Fig. S2A), possibly because the expression level of H-2Db was much lower than that of H-2Kd in NIT-1 cells (Fig. S1G). This finding was consistent with the H-2Kd and H-2Db expression patterns in the pancreas tissues of NOD mice [29]. The majority of the H-2Db-restricted peptides were 9 amino acids in length (Fig. S2B), but most of them ( > 60%) were predicted to be weak binders (WBs) with a % rank of 0.5 ~ 2 (NetMHC-4.0) (Fig. S2C). The SB peptides also showed a typical H-2Db-binding motif with asparagine and phenylalanine or glutamic acid as the main anchor residues on P5 and P9, respectively (Fig. S2D). Considering the low identification efficiency of the H-2Db-restricted peptide, we focused mainly on H-2Kd-restricted peptides in subsequent studies.
Fig. 1.

High glucose (HG) and thapsigargin (TG) treatment reshapes the NIT-1 cell-derived MHC-I-associated immunopeptidome (MIP). A The workflow for identifying NIT-1 cell-derived MIPs. B The total numbers of H2-Kd-restricted peptides and their potential source proteins in the MIP derived from nonstressed NIT-1 cells (NIT-1-NC) and ER-stressed NIT-1 cells treated with HG (NIT-1-HG) or TG (NIT-1-TG). C Length distributions of MIPs derived from NIT-1-NC, NIT-1-HG and NIT-1-TG cells (8 ~11 amino acids). D The predicted affinities of peptides by NetMHC-4.0, SB: strong binder (%Rank<0.5); WB: weak binder (%Rank:0.5 ~ 2). E The binding motifs of the 9-mer peptides identified in the MIP. The x-axis represents the residue position within the 9-mer peptide sequence. The y-axis represents the information content, with the size of each amino acid symbol proportional to its frequency. F Overlap of H-2Kd-restricted MIPs between NIT-1-NC and NIT-1-HG cells and between NIT-1-NC and NIT-1-TG cells at the source protein level. G Overlap of the source proteins for H-2Kd-restricted peptides exclusively present in the MIPs of NIT-1-HG and NIT-1-TG cells
By overlapping the H-2Kd-restricted MIP landscapes of NIT-1-NC, NIT-1-HG and NIT-1-TG cells at the source protein level, we found that HG and TG treatments altered the composition of the NIT-1 cell-derived MIP to varying degrees (Fig. 1F). Notably, at the source protein level, a panel of H-2Kd-restricted self-peptides was identified in the MIPs of ER-stressed NIT-1 β-cells treated with either HG or TG but not in those of nonstressed NIT-1 β-cells (Fig. 1G and Supplementary Table 2). Taken together, these results suggest that ERS induction significantly increases the visibility of NIT-1 β-cells to peripheral CD8+ T cells from NOD mice and simultaneously promotes the presentation of MHC I, a panel of conventional self-peptides, to NIT-1 β-cells.
OTUB258-66 is an immunodominant self-peptide in NOD mice
We then questioned whether the enhanced visibility of ER-stressed NIT-1 cells to CD8+ T cells was related to the peptides whose MHC-I presentation was significantly enhanced in the ERS state. First, we divided these peptides into 7 pools according to their solubility characteristics. The peptides in pool 1 were excluded from subsequent experiments because they could only be dissolved in formic acid (Fig. S3A). The immunogenicity of peptides in the remaining pools to NOD mouse splenocytes was initially screened by IFN-γ ELISPOT assays, and only the six peptides in pools 5 and 6 showed obvious immunogenicity (Fig. S3B, C). Then, the MS identification confidence of the candidate peptides in pools 5 and 6 was evaluated by comparing the primary and secondary MS spectra of the identified endogenous peptides with those of identical synthetic peptides. The peptide GGACT53-62 was excluded because of the obvious difference in the m/z value between the endogenous peptide and its identical synthetic peptide (Fig. S4F). The evaluation of secondary MS spectral similarity, which was scored by the regular dot product (dotp) value with a threshold of 0.8, indicated that the MS identification of the remaining five peptides was reliable (Fig. S4A–E). After that, a recall IFN-γ ELISPOT assay was performed to determine the immunogenicity of the remaining five peptides one by one (Fig. 2A). The dendritic cells (DCs) used in this analysis were generated from the bone marrow of NOD mice and showed suitable purity and maturity (Fig. S5). Compared with DCs alone, DCs pulsed with the peptides WDR70530-538, SYT12291-299 or OTUB258-66 significantly increased IFN-γ production by NOD mouse CD4- splenocytes primed with the corresponding peptide, and these responses were effectively weakened by anti-H-2Kd antibody treatment (Fig. 2B, C), indicating that peptide-induced IFN-γ production was primarily mediated by H-2Kd-restricted CD8+ T cells. Furthermore, we evaluated the reactivity of splenocytes from NOD mice at different ages to five self-peptides and IGRP206-214, a reported H-2Kd-restricted immunodominant epitope. Notably, 87.5% of the NOD mice responded positively to the peptide OTUB258-66, and almost half of the NOD mice responded positively to WDR70530-538 and SYT12291-299; however, only 25% of the NOD mice showed a positive response to IGRP206-214, and one in 8 NOD mice showed a positive response to SLC35B126-34 and ATM1607-1616 (Fig. 2D). Collectively, these results suggest that the OTUB258-66 peptide represents a potential immunodominant self-peptide ligand of autoreactive CD8+ T cells in NOD mice.
Fig. 2.

OTUB258-66 is an immunodominant self-peptide in nonobese diabetic (NOD) mice. A The workflow for the recall IFN-γ ELISPOT assay. B Representative ELISPOT images showing IFN-γ production by the indicated peptide-primed NOD mouse CD4- splenocytes restimulated with DCs alone in the presence of an isotype Ab (DC + no peptide + isotype Ab), the indicated peptide-pulsed DCs in the presence of an isotype Ab (DC + indicated peptide + isotype Ab) or the indicated peptide-pulsed DCs in the presence of an anti-H-2Kd antibody (DC + indicated peptide + anti-H-2Kd Ab). C Summary data for the assay in (B) showing the mean IFN-γ spot number per 2 × 10⁵ CD4- splenocytes ± SD in duplicate cultures. The data are one representative result of eight independent experiments. *p < 0.05, **p < 0.01, determined by Student’s t test. D The reactivity of CD4- splenocytes from NOD mice harvested at different ages to the indicated peptides, as determined by the recall IFN-γ ELISPOT assay. Readouts are expressed as the mean spot numbers/2 × 105 CD4- splenocytes in duplicate cultures. The average readout from CD4- splenocytes restimulated with DCs alone was set as the basal response. A positive response against the indicated peptide was defined as readouts above basal + 3 SD (underlined); ND indicates no data
OTUB258-66-specific CD8+ T cells are diabetogenic in NOD mice
To validate the presence of OTUB258-66-specific CD8+ T cells in NOD mice, H-2Kd-peptide dextramer staining was performed, and the gating strategy is shown in Fig. S6A. The frequency of CD8+ T cells recognizing OTUB258-66 was similar to or even greater than that of CD8+ T cells recognizing IGRP206-214 peptides in the spleen, pancreas and pancreatic draining lymph nodes (pLNs) of NOD mice (Fig. 3A). However, the proportions of IGRP206-214 and OTUB258-66 dextramer+ CD8+ T cells were extremely low in the spleen of ICR mice, a nondiabetic control for NOD mice (Fig. S6B). The cytotoxicity marker CD107 was weakly expressed on the splenic CD8+dextramer+ T cells of the ICR mice (Fig. S6C) but highly expressed on those of the NOD mice (Fig. S6D). In NOD mice, the majority of splenic CD8+dextramer+ T cells exhibited the CD62L+ CD44+ phenotype of central memory T cells, with the next largest population exhibiting CD62L+ CD44- naive-like phenotype, while pancreas-infiltrating CD8+dextramer+ T cells mainly exhibited the CD62L- CD44+ phenotype of effector or effector memory T cells. Furthermore, the phenotype of CD8+dextramer+ T cells in the pLNs was an intermediate of those mentioned above (Fig. S6E), indicating that the majority of CD8+dextramer+ T cells in NOD mice were antigen-experienced. As expected, the OTUB258-66 peptide was capable of triggering the proliferation of endogenous splenic CD8+ T cells in NOD mice (Fig. 3B, C). Compared with unloaded splenocytes (target control), OTUB258-66-loaded splenocytes (target cells) were more efficiently killed by splenic CD8+ T cells (effector cells) freshly purified from NOD mice (Fig. 3D, E).
Fig. 3.

Characterization of OTUB258-66-specific CD8+ T cells in nonobese diabetic (NOD) mice. A Representative flow cytometry plots of CD8+dextramer+ T cells in the spleens, pancreases and pancreatic draining lymph nodes (pLNs) of NOD mice. B Representative flow cytometry histograms showing carboxyfluorescein succinimidyl ester (CFSE) dilution in NOD mouse splenic CD8+ T cells stimulated with or without OTUB258-66 (50 μg/mL). C Summary data for the assay in (B) are presented as the mean proliferation rate ±SD in triplicate for one representative result of three independent experiments. D Representative flow cytometry plots of peptide-loaded or unloaded NOD mouse splenocytes labeled with CFSE and incubated for 4 h in the presence (target + effector) or absence (target control) of NOD mouse CD8+ T cells (effector/target ratio, 100:1). Population 1 contained fluorescent microspheres that could be discriminated on the basis of their scattering pattern and fluorescence. Population 2 contained CFSE-negative cells (effector T cells). Population 3 contained CFSE-positive cells (target cells). E Summary data for the assay in (D) are presented as the mean killing rate ± SD in triplicate for one representative result of three independent experiments. **P < 0.01, ***p < 0.001, determined by Student’s t test
We then wanted to explore whether OTUB258-66-specific CD8+ T cells are diabetogenic in vivo. NOD mice were subcutaneously immunized with OTUB258-66 mixed with the adjuvant polyinosine cytidine acid (poly IC), a Toll-like receptor 3 (TLR-3) agonist (OTUB258-66 group) or with poly IC alone (control group). Seven days later, splenocytes were isolated from the immunized NOD mice, restimulated with the OTUB258-66 peptide or PBS, and then adoptively transferred into NOD/scid recipient mice (Fig. 4A). Analysis of the insulitis score and incidence of diabetes showed that the NOD/scid mice that received OTUB258-66-activated splenocytes developed severe insulitis and diabetes, while the NOD/scid mice that received control splenocytes exhibited no obvious insulitis and were diabetes free (Fig. 4B–D). Confocal microscopy results of immunofluorescence staining for CD8 and insulin revealed obvious infiltration of CD8+ T cells in the local islets in the NOD/scid mice receiving OTUB258-66-activated splenocytes, while the control recipients had almost no CD8+ T-cell infiltration in the islets (Fig. 4E). Collectively, these results show that endogenous CD8+ T cells in NOD mice can recognize and respond to the H-2Kd-naturally presented OTUB258-66 self-peptide of islet β-cells, ultimately exerting a diabetogenic effect.
Fig. 4.

OTUB258-66 peptide-specific CD8+ T cells are diabetogenic in nonobese diabetic/severe combined immunodeficiency (NOD/scid) mice. A The workflow for the adoptive transfer experiment. B Representative images of HE staining of the pancreas of NOD/scid mice receiving OTUB258-66-activated or control splenocytes (magnification, 200×). C Insulitis scores of NOD/scid recipient mice receiving OTUB258-66-activated or control splenocytes. D T1D incidence curve of NOD/scid mice adoptively transferred with OTUB258-66-activated or control splenocytes. Significance was determined by the log-rank (Mantel-Cox) test, *P < 0.05. E Representative laser confocal fluorescence microscopy images of pancreatic sections from NOD/scid mice stained for insulin (red) and CD8 (green). The cells were counterstained with the nuclear dye DAPI (blue). F Summary data for the assay in (E) are representative of two independent experiments and are presented as the mean ± SD, n = 5, **p < 0.01, as determined by Student’s t test
High glucose intake amplifies OTUB258-66-specific CD8+ T-cell responses in NOD mice
Given our previous findings that high glucose intake accelerates T1D in NOD mice [25] and that the peptide OTUB258-66 could be a novel ERS-associated islet β-cell self-peptide induced by high glucose, we wondered whether high glucose intake increased islet β-cell ERS, upregulated OTUB2 expression and enabled the presentation of OTUB258-66, thus amplifying the OTUB258-66-specific CD8+ T-cell response in NOD mice. To this end, NOD mice were fed high-glucose water (20% glucose, HG) or normal water (NC) from 4 weeks of age and sacrificed at 6 or 12 weeks of age. Then, pancreas-infiltrating lymphocytes and splenocytes were isolated from the NOD mice for dextramer and intracellular cytokine staining. The results showed that the absolute number of pancreas-infiltrating lymphocytes in NOD mice in the HG group was significantly higher than that in the NC group at both 6 and 12 weeks of age (Fig. 5A) and that the proportion of CD8+ OTUB258-66-dextramer+ T cells in the pancreas of NOD mice in the HG group tended to increase (Fig. 5B, C). Intracellular cytokine staining revealed that the secretion of IFN-γ and TNF-α by splenocytes from NOD mice in the HG group was significantly higher than that in the NC group at both 6 and 12 weeks of age upon stimulation with phorbol-12-myristate-13-acetate (PMA) or OTUB258-66 (Fig. 5D–F). Taken together, these results indicate that high glucose intake amplifies the response of OTUB258-66-autoreactive T cells in NOD mice. Next, we investigated whether the amplified OTUB258-66-specific CD8+ T-cell responses in NOD mice given high-glucose water were due to increased expression of OTUB2 in β-cells. Interestingly, we found that OTUB2 expression was enriched in the pancreatic islets of NOD mice (Fig. 6A). As expected, the protein level of OTUB2 in the pancreas of NOD mice in the HG group was significantly higher than that in the NC group (Fig. 6B, C). Consistently, both the HG and TG treatments increased the protein expression of OTUB2, although to different degrees, in NIT-1 β-cells (Fig. 6D, E). However, the upregulation of OTUB2 induced by HG or TG was almost completely eliminated by TUDCA (Fig. 6F). Therefore, we speculate that high glucose intake may aggravate pathological ERS, upregulate OTUB2 expression and promote MHC-I presentation of OTUB258-66 peptides in islet β-cells, thereby amplifying OTUB258-66-autoreactive CD8+ T-cell responses and ultimately promoting the progression of T1D.
Fig. 5.

Sustained high glucose intake increases the peptide-specific CD8+ T-cell response against OTUB258-66 in nonobese diabetic (NOD) mice. A Summary data showing the absolute cell number of pancreas-infiltrating lymphocytes in 6- and 12-week-old NOD mice fed high-glucose water (HG) or normal water (NC) (n = 4); *p < 0.05, determined by Student’s t test. B Representative flow cytometry plots of CD8+ dextramer+ T cells in the pancreas of 6-week-old NOD mice fed high-glucose water (HG) or normal water (NC). C Summary data for the assay in B are representative of two independent experiments and are presented as the mean ± SD (n = 4). D Representative flow cytometry plots showing the production of IFN-γ and TNF-α by NOD mouse-derived splenic CD8+ T cells stimulated with phorbol-12-myristate-13-acetate (PMA, 50 ng/mL) plus ionomycin (1 μg/mL). E Summary data for the assay in D are representative of two independent experiments and are presented as the mean ± SD (n = 4). F Summary data showing the proportions of IFN-γ- and TNF-α-producing cells in 6- and 12-week-old NOD mouse splenocytes stimulated with or without the indicated peptide (50 μg/mL). The data are expressed as the mean ± SD, n = 4
Fig. 6.

High glucose treatment increases OTUB2 expression in both the pancreases of nonobese diabetic (NOD) mice and NIT-1 cells. A Representative image of immunohistochemical analysis of OTUB2 expression in pancreatic sections from NOD mice. B, C Western blot analysis of OTUB2 expression in the pancreas of NOD mice given normal water (NC-NOD) or high-glucose water (HG-NOD). D, E Western blot analysis of the protein level of OTUB2 in untreated NIT-1 cells (NIT-1-NC) and NIT-1 cells treated with HG (NIT-1-HG) or TG (NIT-1-TG). F Quantitative PCR analysis of relative OTUB2 mRNA expression in untreated NIT-1 cells (control), NIT-1 cells treated with HG or TG, and NIT-1 cells treated with HG or TG in the presence of tauroursodeoxycholic acid (TUDCA). The data are representative of three independent experiments and are expressed as the mean ± SD. *P < 0.05, **P < 0.01, ***p < 0.001, ****p < 0.0001, as determined by Student’s t test
Repeated administration of the OTUB258-66 peptide prevents T1D onset in NOD mice
Given that the induction of autoreactive T-cell tolerance by the administration of autoantigens or peptides may prevent autoimmune disease, we questioned whether repeated administration of the OTUB258-66 peptide could affect T1D onset in NOD mice. For this purpose, 6-week-old NOD mice were subcutaneously injected with the OTUB258-66 peptide mixed with poly IC (OTUB258-66) or with poly IC alone (control) once a week for a total of three injections, after which the blood glucose level was measured weekly to monitor T1D onset (Fig. 7A). As expected, repeated administration of the OTUB258-66 peptide significantly reduced the incidence of T1D in NOD mice (Fig. 7B). Notably, compared with that in control NOD mice, the absolute number of pancreas-infiltrating lymphocytes in OTUB258-66-vaccinated NOD mice increased significantly after two injections but decreased significantly after three injections (Fig. 7C). Additionally, the proportion of pancreas-infiltrating OTUB258-66 dextramer+ CD8+ T cells in OTUB258-66-vaccinated NOD mice increased slightly after 2 injections but decreased after 3 injections compared with that in control NOD mice (Fig. 7D, E). Consistently, three injections of OTUB258-66 reduced the production of IFN-γ and TNF-α by NOD mouse splenocytes upon stimulation with PMA or OTUB258-66 (Fig. 7F, G).
Fig. 7.

Repeated vaccination with the OTUB258-66 peptide prevents type 1 diabetes (T1D) onset in nonobese diabetic (NOD) mice. A The workflow for the peptide vaccination experiment. B Incidence of diabetes in female NOD mice injected with the OTUB258-66 peptide plus poly IC (red line, n = 14) or with poly IC alone (black line, n = 14). *p < 0.05 compared by the log-rank (Mantel-Cox) test. C Summary data showing the absolute number of pancreas-infiltrating lymphocytes in NOD mice after 2 or 3 injections of the OTUB258-66 peptide mixed with poly IC (OTUB258-66) or poly IC alone (control). The data are representative of two independent experiments and are presented as the mean ± SD (n = 4 per group). D Representative flow cytometry plots of CD8+dextramer+ T cells in the pancreas of NOD mice after 2 or 3 injections of the OTUB258-66 peptide plus poly IC (OTUB258-66) or poly IC alone (control). E Summary data for the assay in (D) showing the frequency of CD8+ dextramer+ T cells in the pancreas of NOD mice after 2 or 3 injections. The data are representative of two independent experiments and are presented as the mean ± SD (n = 4 per group). F Representative flow cytometry plots depicting PMA- and OTUB258-66-stimulated IFN-γ and TNF-α production by splenic CD8+ T cells from NOD mice after 2 or 3 injections of the OTUB258-66 peptide plus poly IC (OTUB258-66) or poly IC alone (control). G Statistical summary of the flow cytometry data shown in F. The data are representative of two independent experiments and are presented as the mean ± SD (n = 4 per group). *p < 0.05, **p < 0.01, ***p < 0.001, as determined by Student’s t test
We further investigated the mechanisms underlying the protective effect of repeated vaccination with the OTUB258-66 peptide on T1D. As expected, the surface expression levels of Annexin V, FAS and PD-1 on the OTUB258-66 dextramer+ CD8+ T cells in the pancreas-infiltrating lymphocytes of OTUB258-66-vaccinated NOD mice were much higher than those in the control mice after 3 injections (Fig. S7A). Surprisingly, compared with control mice, NOD mice with 3 injections of the OTUB258-66 peptide showed significantly increased surface levels of Annexin V and FAS on pancreatic CD3+ CD8- T cells (mainly CD4+ T cells) and CD3+ CD8+ T cells, while the expression of PD-1 was significantly increased only on pancreatic CD3+ CD8+ T cells (Fig. S7B, C). These results indicate that repeated vaccination with the OTUB258-66 peptide promotes the apoptosis or functional inhibition of not only OTUB258-66-specific T cells but also other diabetogenic T cells, thereby resulting in protection against T1D. Then, we investigated whether regulatory T cells (Tregs) could be expanded in NOD mice after three injections of the OTUB258-66 peptide. Interestingly, compared to those in control NOD mice, the proportions of CD4+CD25+Foxp3+ Tregs were significantly increased in the pLNs and spleens of NOD mice after three injections of the OTUB258-66 peptide, and there was a noticeable but nonsignificant increase in the proportion of CD4+CD25+Foxp3+ Tregs in the pancreases of OTUB258-66-vaccinated NOD mice (Fig. S8A, B). Additionally, the proportion of CD8+CD25+Foxp3+ Tregs was also significantly increased in the pLNs but not in the spleens or pancreases of OTUB258-66-vaccinated NOD mice (Fig. S8C, D). Collectively, these results indicate that repeated administration of the OTUB258-66 peptide prevents the development of T1D in NOD mice, possibly not only by inhibiting the response of OTUB258-66-specific CD8+ T cells but also by inducing apoptosis or functional inhibition of other pathogenic T cells, as well as by inducing Foxp3+ Treg-mediated bystander immunosuppressive effects.
Autoreactive T-cell responses to human OTUB2 peptides in patients with T1D
NOD mice share multiple autoantigens with T1D patients, including insulin, glutamic acid decarboxylase (GAD), Islet antigen 2 (IA-2), chromogranin A, and IGRP [30, 31]. To further explore the broader importance of OTUB2 in human T1D, we performed ELISPOT assays to directly examine the IFN-γ response of PBMCs to human OTUB2 peptides ex vivo. HLA-A*0201 is the most commonly expressed HLA class I allele in all ethnic groups and contributes to susceptibility to T1D [32–34]. Therefore, we used the online tools SYFPEITHI, NetMHC-4.0 and IEDB to predict the candidate HLA-A*0201-restricted human OTUB2 peptides (Supplementary Table 3). The ELISPOT results showed that PBMCs from 6 out of 8 (75%) HLA-A2+ patients showed a positive IFN-γ response to human OTUB2 peptide pool 1, and PBMCs from 5 out of 8 (62.5%) HLA-A2+ patients showed a positive IFN-γ response to human OTUB2 peptide pool 2. The IFN-γ response to the known HLA-A*0201-restricted epitope IGRP215-223 was detected in PBMCs from 5 out of 8 (62.5%) HLA-A2+ patients. PBMCs from all HLA-A2+ healthy individuals showed a negative IFN-γ response to these OTUB2 peptides, but PBMCs from one of six healthy controls seemed to weakly respond to IGRP215-223 (Fig. 8A, B). Statistical analysis revealed significant differences in the IFN-γ response against the two pools of human OTUB2 peptide and IGRP215-223 between the PBMCs of T1D patients and those of healthy subjects. These results indicate that human OTUB2 may be a novel target for autoreactive T cells in patients with T1D.
Fig. 8.
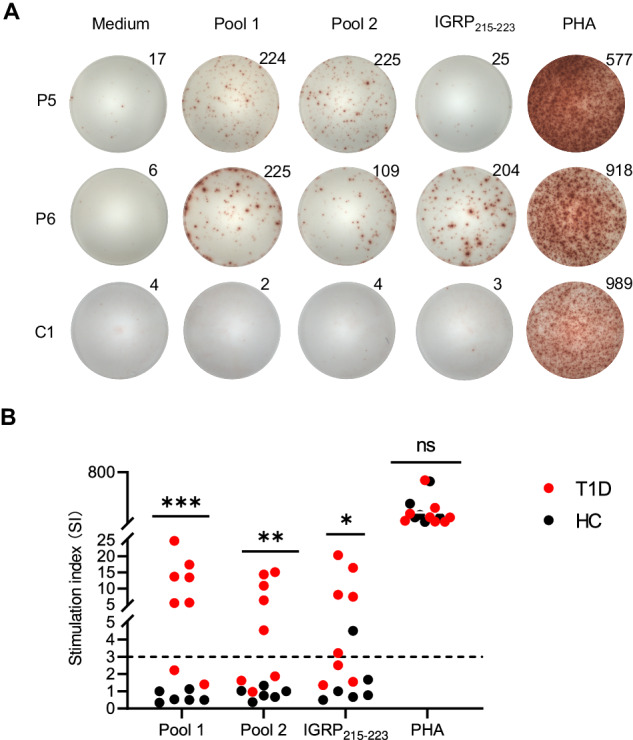
Autoreactive T-cell responses to human OTUB2 peptides in patients with type 1 diabetes (T1D). A Representative ELISPOT images showing IFN-γ production by the peripheral blood mononuclear cells (PBMCs) of HLA-A2+ patients with T1D and healthy controls stimulated with HLA-A*0201-restricted OTUB2 peptide pool 1 and pool 2 (50 μg/mL of each peptide), IGRP215-233 (50 μg/mL), phytohemagglutinin (PHA, 2.5 μg/mL) or medium alone. The number represents the number of IFN-γ spots in each well. B Summary data for the IFN-γ ELISPOT assay in A. Each dot shows the stimulation index (Sl) of triplicate wells for each subject. The horizontal dashed line represents the cutoff of positivity (SI ≥ 3). The data are presented as the mean ± SD. *p < 0.05, **p < 0.01, ***p < 0.001, determined by the Mann‒Whitney U test
Discussion
In this study, by comparative analysis of the landscape of the endogenous peptidome of NIT-1 β-cells under steady and ERS conditions, we identified the previously undescribed ERS-associated β-cell self-peptide OTUB258-66, whose MHC-I presentation was promoted in ER-stressed NIT-1 β-cells. Additionally, OTUB258-66-specific CD8+ T cells were diabetogenic in NOD mice. High glucose intake amplified OTUB258-66-specific CD8+ T-cell responses in NOD mice. Notably, repeated vaccination with the OTUB258-66 peptide prevented T1D onset in NOD mice.
Recent evidence suggests that ERS in β-cells may drive the generation of neoepitopes, which are likely not available for negative selection in the thymus. However, the conventional MHC-I peptides of β-cells, which are induced by ERS and recognized by autoreactive CD8+ T cells, have received less attention. Gonzalez-Duque et al. identified a catalog of HLA-I peptides, including conventional peptides, mRNA splicing products and fusion peptides, produced by human β-cells cultured with or without inflammatory cytokines. However, they did not focus on emerging β-cell antigenic peptides induced by inflammatory cytokines [35]. Here, we used HG and TG treatments to induce ERS in NIT-1 β-cells and focused on exploring conventional MHC-I peptides induced by ERS in β-cells and their diabetogenic effects.
The NIT-1 cell line has been widely used to study β-cell autoantigens associated with T1D pathogenesis [36–38]. However, NIT-1 cells retain some characteristics that differ from those of primary β-cells. For example, NIT-1 cells are much less sensitive to glucose stimulation than are primary β-cells [36]. Our previous study revealed that 20 mM glucose can induce ERS in NIT-1 cells and significantly improve the immune visibility of NIT-1 cells [25]. Another study demonstrated that treatment with TG, an ERS inducer, can also enhance the immunostimulatory potential of NIT-1 cells for whole NOD splenocytes or diabetogenic CD4+ T-cell clones [39]. Consistent with these studies, here, we demonstrated that both HG and TG treatment significantly enhanced the visibility of NIT-1 cells to splenic CD8+ T cells from NOD mice, which appeared to be achieved not by enhanced surface MHC-I expression but by changes in the composition of the MIP induced by ERS. In support of this, a small number of conventional peptides, which were detected by MS in the MIP of ER-stressed NIT-1 cells but not in the MIP of nonstressed NIT-1 cells, exhibited obvious immunogenicity to NOD mouse CD8+ T cells. Among these peptides, OTUB258-66 was predicted to be a weak binder for H-2Kd but showed a strong ability to stimulate an immune response in almost all NOD mice between 5 and 13 weeks of age, which spanned both the prodrome and early stages of T1D [40]. Inspiringly, NOD mouse splenocytes responded more frequently to OTUB258-66 than to IGRP206–214, a major known β-cell target of diabetogenic CD8+ T cells in NOD mice. These data, together with the results of dextramer staining and cell proliferation, killing and adoptive transfer assays, suggest that OTUB258-66 is a novel immunodominant self-peptide recognized by autoreactive CD8+ T cells in NOD mice. It is well known that when inflammation or other environmental factors alter the quality or quantity of MHC-presented self-immunopeptidomes in peripheral tissues, immune tolerance may be disrupted[41, 42]. We speculate that the abundance of the OTUB258-66 peptide presented by MHC-I is too low to be detected by MS under normal conditions, but ERS significantly promotes its MHC-I presentation, leading to the triggering of an autoreactive T-cell response against β-cells. Dudek et al. sequenced the immunopeptidome of NIT-1 β-cells under basal and inflammatory conditions [43]. However, neither Dudek et al. nor our group identified any of the immunodominant diabetogenic CD8+ T-cell epitopes previously reported in NOD mice, possibly due to the low abundance of these naturally MHC-I-presented peptides not meeting the LC-MS/MS detection sensitivity. Using a targeted MS-based approach for multiple-reaction monitoring, IGRP206-214 remains undetectable on NIT-1 cells under basal conditions (1 copy/cell) but can be detected on IFN-γ-treated NIT-1 cells (25 copies/cell), which to some extent reflects the increased MHC-I presentation induced by IFN-γ [43]. Another study confirmed that a high-glucose environment can promote the MHC-I presentation of preproinsulin signal epitopes in β-cells, thus enhancing the specific cytotoxic effect of CTLs against β-cells [44]. INSB15-23, another important H2-Kd-restricted β-cell self-peptide recognized by diabetogenic CD8+ T cells in NOD mice [45], was also not found in Dudek’s study or our MIP datasets due to its poor binding with H2-Kd (NetMHC-4.0, % Rank>2). Therefore, we presume that compared with IGRP206-214 and INSB15-23, OTUB258-66 can be naturally presented by H-2Kd in greater abundance in ER-stressed β-cells, making it more immunodominant and more easily recognized by autoreactive CD8+ T cells in NOD mice.
The source protein OTUB2 is a kind of ubiquitin hydrolase whose main function is to remove the ubiquitination label on proteins to prevent protein degradation [46]. Studies have shown that OTUB2 plays crucial roles in cancer and other human diseases. In many cases, OTUB2 acts as a tumor promoter in different types of human cancer [47, 48]. However, it may also act as a tumor suppressor in some special cases [49]. Although OTUB2 is a ubiquitously expressed protein that is preferentially expressed in the testis and brain, our immunohistochemical results indicate that OTUB2 is relatively highly expressed in pancreatic islets. The role of OTUB2 in islets remains largely unknown. Beck A. et al. reported that OTUB2 is a novel promoter of β-cell survival through the inhibition of NF-κB signaling [50]. We found that OTUB2 expression in β-cells could be upregulated by HG or TG treatment and that this upregulation of OTUB2 could be almost eliminated by ERS inhibition, suggesting that ERS may be related to the upregulation of OTUB2, thus leading to the processing and presentation of OTUB258-66 in β-cells. Consistent with our results, in the datasets reported by Dudek et al., OTUB258-66 was detected only in the immunopeptidome of IFN-γ-treated NIT-1 cells, not in that of untreated NIT-1 cells [43], highlighting that various environmental factors that induce ERS may promote the MHC-I presentation of OTUB2 in β-cells. A previous study demonstrated that ERS is critical for the generation of a prevalent preproinsulin signal peptide-derived autoantigenic peptide by modulating ERAP1 expression [51]. However, the underlying mechanism of ERS in the processing and presentation of OTUB2 remains unknown.
Then, we evaluated the potential use of the OTUB258-66 peptide for T1D prevention in NOD mice. Antigen-specific immune tolerance in T1D can be achieved by depleting diabetogenic T-cell clones, inducing autoreactive T-cell anergy or inducing antigen-specific Tregs [52]. Repeated antigen stimulation can effectively induce the death of activated T cells, which is a favorable goal for inducing immune tolerance because it can eliminate pathogenic T cells [53]. Therefore, to effectively eliminate OTUB258-66-reactive CD8+ T cells, we treated NOD mice with repeated subcutaneous injections of the peptide OTUB258-66 combined with poly IC, which is known to promote the activation and expansion of CD8+ T cells [54]. As expected, multiple immunizations with the OTUB258-66 peptide plus poly IC induced significant T1D protection in NOD mice. Surprisingly, this protective effect was accompanied not only by a decrease in the number of OTUB258-66-reactive CD8+ T cells but also by an overall decrease in the number of pancreas-infiltrating T cells, manifested by a decrease in the number of infiltrating cells and reduced proinflammatory cytokine production. This was consistent with increased FAS, Annexin V, and PD-1 expression on the cell surface, suggesting increased apoptosis and decreased function of pathogenic T cells. The protective effects of antigen-specific immunotherapies have frequently been associated with the induction of antigen-specific Tregs. We previously reported that repeated treatment with an altered peptide ligand of an HLA-A*0201-restricted insulin epitope could induce extensive suppressive bystander effects by inducing CD8+ Tregs in humanized NOD mice [55]. Here, we showed that repeated immunization with the OTUB258-66 peptide significantly increased the proportions of CD4+CD25+Foxp3+ and CD8+CD25+Foxp3+ Tregs in NOD mice, which may contribute to broader bystander immunosuppression. We speculate that this might be due to the apoptosis of peptide-specific T cells induced by repeated peptide immunization. It has been confirmed that apoptotic T cells release TGF-β [56], and the phagocytosis of apoptotic cells by macrophages can also lead to TGF-β production [57], which in turn promotes the generation of Foxp3+ Tregs [58, 59]. However, the underlying mechanism remains to be studied.
Most autoantigens identified in NOD mice have also been shown to be targets of T-cell-mediated autoimmunity in human T1D. Since ERS is associated with autoimmune destruction of pancreatic β-cells and T1D development in both animal models and humans, we further explored the broader importance of OTUB2 in human T1D. Our preliminary results suggest that OTUB2 might be a novel autoantigen recognized by autoreactive T cells in human T1D. However, further evidence is needed to demonstrate autoreactivity against OTUB2 in T1D patients.
In summary, our findings suggest that environmental factor-induced ERS can reshape the MIP of β-cells and promote the MHC-I presentation of certain proteins involved in the stress response (e.g., OTUB2), thereby driving autoreactive CD8+ T-cell responses and promoting T1D in NOD mice. In addition, recent studies have confirmed that cellular stress caused by environmental factors can also alter the MHC-II immunopeptidome and promote the MHC-II presentation of epitopes that drive autoreactive CD4+ T-cell responses, leading to pathogenic immune autoreactivity [60, 61]. Thus, these findings highlight a link between cellular stress and an altered immunopeptidome, which may play a broad and important role in the pathogenesis of autoimmunity.
Limitations of the study
There are several limitations in this study. First, this study did not use an absolute quantitative MS method to determine the true uniqueness of the OTUB258-66 peptide in ER-stressed NIT-1 β-cells. Second, this study ignored potential ERS-induced unconventional peptides, as their accurate identification remains a great challenge. Third, there are some differences between the NIT-1 β-cell line and primary NOD islet β-cells. Although the presence of OTUB258-66-specific CD8+ T cells in NOD mice has been confirmed, whether the OTUB258-66 peptide can be naturally presented by MHC-I molecules on the surface of primary β-cells under ERS conditions remains to be confirmed.
Methods
Antibodies, primers and other reagents
For the antibodies, primers and other reagents used, please see Supplementary Table 4.
NIT-1 cell culture and treatment
The pancreatic β-cell line NIT-1 was maintained in complete F-12K (Gibco, US) medium supplemented with 10% fetal bovine serum (FBS) under 5% CO2 at 37 °C. For HG and TG pretreatments, cells were cultured with 10 mM, 20 mM or 30 mM HG for 24 h or 48 h or cultured with 1 μM, 5 μM or 10 μM TG for 0.5 h or 1 h and then washed extensively with PBS. Then, 1 × 10⁴ cells were collected for mouse IFN-γ ELISPOT assays.
Mouse IFN-γ ELISPOT Assays
CD4- T cells were isolated from freshly prepared single-cell suspensions of NOD mouse splenocytes by using BeaverBeads™ Meg streptavidin (Beaver Biosciences Inc., Guangzhou, China) and a biotinylated anti-CD4 antibody (clone: GK1.5 Invitrogen). A total of 1 × 10⁵ remaining CD4- splenocytes and 1 × 10⁴ NIT-1 cells treated with or without different concentrations of glucose or TG for different durations were cultured in 96-well ELISPOT plates precoated with a specific capture antibody against IFN-γ (Dakewei Biotech, Shenzhen, China) at 37 °C and 5% CO2 for 20 h. To block the H-2Kd-restricted recognition of CD8+ T cells, NIT-1 cells treated with 20 mM glucose for 24 h or 5 μM TG for 0.5 h were preincubated with an anti-H-2Kd antibody (SF1.1.10, 50 μg/ml) for 2 h and then cocultured with CD4- splenocytes. After incubation, the cells were removed, and the plates were processed according to the ELISPOT kit manufacturer’s instructions. Spots were counted using a spot reader system (Saizhi, Beijing, China).
Western blot and quantitative reverse transcription (qRT)-PCR analyses
NIT-1 cells were treated with or without 20 mM glucose for 24 h or 5 μM TG for 0.5 h, and then cell samples were collected at 0 h, 6 h, 12 h and 24 h after the withdrawal of HG or TG treatment. For the western blot analysis, cell samples were lysed with RIPA lysis buffer (Beyotime) containing 1 mM PMSF (Beyotime). The proteins in the lysates were separated by SDS-PAGE and immunoblotted with the following primary antibodies: mouse anti-eIF2a (2103, Cell Signaling), rabbit anti-eIF2a-P (9721, Cell Signaling), rabbit anti-XBP-1 (ab220783, Abcam), rabbit anti-XBP-1 s (40435, Cell Signaling), rabbit anti-ATF6 (65880 s, Cell Signaling), rabbit anti-TXNIP (D5F3E) (14715, Cell Signaling), rabbit anti-IRE1 (PA1-16928, Thermo Fisher), rabbit anti-IRE1-P (PA1-16927, Thermo Fisher) and rabbit anti-α-tubulin (AF0001, Beyotime). After incubation with peroxidase-conjugated secondary antibodies for 60 min, the immunocomplexes were visualized using a chemiluminescence reagent (Amersham, Freiburg, Germany), and the autoradiographs were scanned by an imaging densitometer. For qRT-PCR, total RNA was isolated from cell samples using TRIzol reagent (Invitrogen, USA). Total RNA (500 ng) was reverse transcribed into cDNA using the PrimeScript® RT Reagent Kit (TaKaRa, Japan). Real-time quantitative PCR was performed using TB Green™ Premix Ex Taq™ II (Tli RNaseH Plus) (Takara, Japan) to detect the relative expression of TXNIP, CHOP, XBP-1s, ATF6 and eIF2a. Each sample run was performed in triplicate, and relative mRNA expression levels were determined using the 2(-Delta Ct) method with Gapdh as the internal reference control.
MIP Isolation from NIT-1 cells
A total of 5 × 10⁸ untreated NIT-1 cells (NC group), NIT-1 cells treated with 20 mM glucose for 24 h and cultured for another 24 h after treatment withdrawal (HG group) or NIT-1 cells treated with 5 μM TG for 0.5 h and cultured for another 12 h after treatment withdrawal (TG group) were harvested and immediately lysed in 20 mL of ice-cold lysis buffer (50 mM Tris pH 8.0, 150 mM NaCl, and 1% CHAPS) containing a “complete” protease inhibitor (Roche). The solution was centrifuged at 4 °C and 17000 rpm for 30 min, which was repeated 3 times, and the purified supernatant was filtered through a 0.2-μm needle filter (Thermo Fisher) and collected to obtain the cell lysates. The procedure used for the isolation of the MIP was performed according to our previously reported method [29]. Briefly, according to the manufacturer’s instructions for an HP column, immunoaffinity columns were constructed by using a 1-mL HiTrap NHS-activated HP column (Code No: 17-0716-01, GE Healthcare) coupled with 10 mg of anti-H-2 mAb (clone: M1/42.3.9.8, BioXCell). The NIT-1 cell proteolytic solution was repeatedly circulated in the column overnight at a flow rate of 0.5 mL/min at 4 °C. Then, the column was washed with several buffers in the following order: 50 mM Tris (pH 8.0), 150 mM NaCl and 1% CHAPS; 50 mM Tris-HCl (pH 8.0) and 150 mM NaCl; 50 mM Tris-HCl (pH 8.0) and 450 mM NaCl; and 50 mM Tris-HCl (pH 8.0). Subsequently, the MHC I-peptide complexes were eluted with 4 mL of 10% acetic acid. Ultrafiltration filters (3.0-kDa cutoff Microcon, Millipore) were prewashed with double-distilled water three times and 10% acetic acid one time to remove contaminants interfering with MS. Then, the mixture of peptides, the class I heavy chain and β2-microglobulin was separated by ultrafiltration at 8500 × g for 30 min at 4 °C. After ultrafiltration, the peptide mixture was desalted and concentrated on a Micro-Tip reversed-phase C18 column (Merck) [62].
LC-MS/MS analysis of NIT-1 cell MIPs
The concentration of desalted peptides was measured with a peptide quantification kit (Pierce Quantitative Colorimetric Peptide Assay, Thermo Fisher, 23275). Subsequently, equal masses of peptides (1.5 μg/run) were dissolved in an equal volume of solvent A (0.1% formic acid, 2% acetonitrile) and directly loaded onto a reversed-phase analytical column (25 cm in length, 100 μm i.d.) made in-house. The peptides were separated with a gradient from 4% to 23% solvent B (0.1% formic acid in 90% acetonitrile) over 62 min, 23% to 35% over 20 min, increased to 80% over 4 min and then held at 80% for the last 4 min, all at a constant flow rate of 450 nL/min, on an EASY-nLC 1200 UPLC system (Thermo Fisher Scientific). The separated peptides were analyzed in a Q ExactiveTM HF-X (Thermo Fisher Scientific) with a nanoelectrospray ion source. The electrospray voltage applied was 2.2 kV. The full MS scan resolution was set to 120,000 for a scan range of 400-1500 m/z. Up to 10 of the most abundant precursors were then selected for further MS/MS analyses with 30 s dynamic exclusion. HCD fragmentation was performed at a normalized collision energy (NCE) of 28%. The fragments were detected in the orbitrap at a resolution of 45,000. The automatic gain control (AGC) target was set at 5E4, with an intensity threshold of 1E4 and a maximum injection time of 40 ms. Two biological replicates of MIP samples were prepared for each treatment, and each sample was measured in technical triplicates. The MS proteomics data have been deposited in the ProteomeXchange Consortium via the PRIDE [1] partner repository with the dataset identifier PXD041227.
MIP mass spectrometry data analysis
All tandem mass spectra were queried against a custom MHC class I-targeted database (Supplementary material 1: Mouse_MHC_pep.fasta.) that we previously established [29], using the MaxQuant (version 1.5.2.8), Sequest and Mascot (implemented with Proteome Discoverer 2.1) search engines with no cleavage restriction. For all searches, the parent mass error tolerance was set to 10 ppm, and the fragment mass error tolerance was set to 0.02 Da. Oxidation of methionine was considered a variable modification. The confidence peptides were filtered at a 5% false discovery rate (FDR) at the peptide-spectrum match (PSM) level. Because the search algorithms of each search engine differ, so do the search results. According to the literature [63, 64], to integrate the advantages of multiple search algorithms and identify more possible peptides, the MaxQuant, Mascot and Sequest search results were combined to establish the maximum possible datasets of MIP.
Determination of MHC class I motifs
The logo program (http://weblogo.berkeley.edu/logo.cgi?tdsourcetag=s_pctim_aiomsg) was used to visualize the characteristics of peptide-binding motifs. The information content at each position in the sequence motif was indicated using the height of a column of letters, representing amino acids. The height of each letter within the columns was proportional to the frequency of the corresponding amino acid at that position.
Peptide synthesis
Peptides with purities greater than 95% were synthesized by the Chinese Peptide Company (Hangzhou, China). The synthetic peptides were identified by LC-MS/MS with the parameter settings used for MIP identification. Skyline software (version_22.2.0.351) was used to evaluate the similarity of the secondary tandem MS spectra of the identified endogenous peptides with those of identical synthetic peptides, with a dotp value > 0.8 as the threshold [65].
Generation of bone marrow-derived dendritic cells (BMDCs) from NOD mouse bone marrow cells
NOD mouse BMDCs were generated according to a previously reported protocol [66]. Briefly, NOD mouse bone marrow cells were cultured in the presence of 20 ng/mL granulocyte-macrophage colony-stimulating factor and 10 ng/mL interleukin-4 for 6 days. To induce further maturation, BMDCs were recultured in the presence of 1 μg/mL lipopolysaccharide (Sigma) for an additional 24 h. To evaluate the purity and maturity of cultured BMDCs, cells cultured for 7 days were harvested and stained with the fixable viability dye eFluor® 780 (eBioscience), BV421-conjugated anti-mouse CD3, FITC-conjugated anti-mouse CD11C, PE-conjugated anti-mouse MHC II, and PerCP-Cy5.5-conjugated anti-mouse CD80 for 20 min at 4 °C in the dark. After washing, the samples were detected on a BD FACSCanto II (BD Biosciences, Franklin Lakes, NJ), and the data were analyzed using FlowJo V10 software.
Immunogenicity evaluation of candidate peptides
The immunogenicity of peptide pools to NOD mouse splenocytes was screened by IFN-γ ELISPOT assays. Briefly, freshly prepared CD4- NOD mouse splenocytes were cultured in 96-well ELISPOT plates precoated with a specific capture antibody against IFN-γ (Dakewei Biotech, Shenzhen, China) in the presence or absence of peptide pools (50 μg/mL of each peptide) at 37 °C and 5% CO2 for 24 h. After incubation, the cells were removed, and the plates were processed according to the ELISPOT kit manufacturer’s instructions. For a recall IFN-γ ELISPOT assay, freshly prepared CD4- NOD mouse splenocytes were primed with each candidate peptide (50 μg/mL) in the presence of 50 U/mL recombinant murine interleukin-2 (rmIL-2, PeproTech, Rocky Hill, NJ, USA). On Day 7, the peptide-primed CD4- splenocytes (2 × 10⁵ cells/well) were cocultured with peptide (50 μg/mL)-pulsed DCs (1 × 10⁴ cells/well) in 96-well ELISPOT plates precoated with a specific capture antibody against IFN-γ (Dakewei Biotech, Shenzhen, China) at 37 °C and 5% CO2 for 20 h. After the incubation, the cells were removed, and the plates were processed according to the ELISPOT kit manufacturer’s instructions. Spots were counted using a spot reader system (Saizhi, Beijing, China).
Isolation of pancreas-infiltrating lymphocytes from NOD mice
Pancreas-infiltrating lymphocytes were isolated according to the protocol of a previous report with some modifications [67]. Briefly, after removing all visible pancreatic lymph nodes, the pancreas was digested in 3 mL of HBSS containing 1 mg/mL collagenase IV (Sigma) and 0.02 mg/mL DNase I with stirring (200 rpm) for 15 min in a 5% CO2 cell incubator at 37 °C. The single-cell suspensions were collected after diluting the enzyme mixture with 3 mL of ice-cold HBSS containing 5% FBS, and the aggregates were removed after incubating for 2 min on ice. The aggregates were further digested with 3 mL of half collagenase IV and DNase I for 10 min. The single-cell suspensions were washed two times with HBSS containing 5% FBS and then resuspended in 2 mL of RPMI 1640 medium containing 5% FBS. Two milliliters of cell suspension was slowly and carefully added to the surface of 2 mL of mouse lymphocyte separation medium (DAKEWE) to form a clear boundary. After centrifugation at 1800 r/min for 20 min, the lymphocytes were carefully collected and washed twice with 5 mL of PBS containing 5% FBS.
Dextramer staining
Lymphocytes isolated from the spleen, pancreas and pLNs of NOD mice or nondiabetic ICR mice (negative control) were suspended in PBS supplemented with 5% FBS (2 × 10⁶ cells/50 μL), then initially stained with 10 μL of PE-conjugated dextramer (Immudex, Copenhagen, DK) [68, 69] in the dark at room temperature for 10 min and then stained with Fixable Viability Dye eFluor® 780 (eBioscience), FITC-conjugated anti-CD3, BV510-conjugated anti-CD8, BV421-conjugated anti-CD107, PerCP-Cy5.5-conjugated anti-CD44, and PE-Cy7-conjugated anti-CD62L in the dark at 4 °C for 20 min. The cells were subsequently washed twice with 2 mL of PBS/5% FBS and immediately analyzed on a BD FACSCanto II (BD Biosciences, Franklin Lakes, NJ).
Intracellular cytokine staining of CD8+ T cells
Splenocytes isolated from NOD mice were stimulated with or without peptide (50 μg/mL) or PMA (50 ng/mL) plus ionomycin (1 μg/mL) in complete medium containing 1μL/mL GolgiStop™ (BD Biosciences) for 4 h. Dead cells were excluded from the analysis by using the fixable viability dye eFluor® 780 (eBioscience). PerCP-Cy5.5-conjugated anti-CD3 (17A2, BioLegend) and PE-Cy7-conjugated anti-CD8 (53-6.7, BioLegend) were used to label the cells for 30 min on ice. After washing with flow cytometry buffer (PBS/1% FBS), the cells were fixed and then labeled with APC-conjugated anti-mouse TNF-α (MP6-XT22, BioLegend) and PE-conjugated anti-mouse IFN-γ (XMG1.2, BioLegend) at 4 °C in permeabilization buffer. Data were acquired for each of the experiments using a BD FACSCanto II (BD Biosciences, Franklin Lakes, NJ). Data analysis was performed using FlowJo software.
CFSE-based CD8+ T-cell proliferation assay
CD4- T cells freshly isolated from NOD mouse splenocytes were stained with 0.5 μM carboxyfluorescein succinimidyl ester (CFSE; Invitrogen). After extensive washing, the CFSE-labeled splenocytes were cocultured with or without 10 μg/mL peptide in the presence of 50 U/mL rmIL-2 on Day 1. Half of the medium was replaced every 3 days and supplemented with rmIL-2. On Day 6, the cultured cells were harvested and stained with the fixable viability dye eFluor® 780 (eBioscience) and PE-Cy7-conjugated anti-mouse CD8 (YTS156.7.7, BioLegend). Then, the cell samples were washed twice with PBS and analyzed on a BD FACSCanto II (BD Biosciences, Franklin Lakes, NJ), and the data were analyzed using FlowJo V10 software.
CFSE-based cytotoxicity assay
A CFSE-based cytotoxicity assay was performed according to a previously reported protocol [70]. Briefly, after washing with PBS, NOD mouse splenocytes were resuspended at 2 × 10⁷ cells/mL and labeled with 10 μM CFSE (Invitrogen). After two washes, the CFSE-labeled splenocytes were incubated with or without peptide (50 µg/mL) at 37 °C and 5% CO2 for 2 h. After another 2 washes, the cell concentration was adjusted to 1 × 10⁵ cells/mL, and the cells were seeded in 96-well microtiter plates at 100 μL/well as target cells. CD8+ T cells were enriched from NOD mouse splenocytes using a mouse CD8+ T-cell enrichment kit (StemCell Technologies), and the cell concentration was adjusted to 1 × 10⁷ cells/mL. CD8+ T cells were seeded in 96-well microtiter plates at 100 μL/well as effector cells, and the effector-to-target ratio was 100:1. After incubation at 37 °C in 5% CO2 for 5 h, the cells were stained with the fixable viability dye eFluor® 780 for 20 min at 4 °C in the dark to stain dead cells, washed with PBS and resuspended in 300 µL of PBS/test solution. The cell samples were mixed with 10000 Flow-Count Fluorospheres (Coulter Corporation, Miami, FL) and immediately analyzed by flow cytometry. A total of 5000 microbeads were acquired for each sample, and the absolute number of surviving cells was determined by calculating the ratio between the number of cells and the number of beads. The percentage of viable cells was calculated as follows: % survival= [absolute no. viable CFSE+ target cells (t = x)]/[absolute no. viable CFSE+ target cells (t = 0)]×100.
OTUB258-66-specific CD8+ T-cell proliferation and adoptive transfer
Six-week-old female NOD mice were randomly divided into two groups and then subcutaneously injected with 30 μg of OTUB258-66 mixed with 30 μg of poly IC (OTUB258-66 group) or 30 μg of poly IC alone (control group) in 100 μL of PBS, with one injection administered per week for two weeks. Splenocytes isolated from immunized NOD mice were stimulated with or without the OTUB258-66 peptide (50 ng/mL) for one week and maintained in 50 U/mL of rmIL-2 in vitro. After three washes with PBS, the cells were resuspended in 2 mL of PBS and injected into NOD/scid mice via the tail vein at 1 × 10⁷/200 μL/mouse. The blood glucose levels of NOD/scid mice were measured 4 weeks after transfusion to detect the onset of T1D. After disease onset or at the end of the experimental observation period, pancreatic tissue was collected for hematoxylin and eosin (H&E) staining to detect insulitis. A minimum of 10 islets from each mouse were microscopically observed by two different observers, and insulitis scoring was performed according to the following criteria: 0, no infiltration; 1, peri-insulitis; 2, insulitis with <50% islet area infiltration; and 3, insulitis with >50% islet area infiltration. Laser confocal microscopy imaging of CD8+ T cells and insulin was performed to detect the infiltration of CD8+ T cells in pancreatic islets. Briefly, pancreatic paraffin-embedded sections were incubated with a guinea pig anti-insulin antibody (Abcam ab7842) and rabbit anti-CD8 alpha antibody (Abcam ab217344, EPR21769) at 4 °C overnight. The samples were then incubated with goat anti-guinea pig IgG H&L (Alexa Fluor® 647, ab150187) and Cy3-labeled goat anti-rabbit IgG H&L (Alexa Fluor® 555, Beyotime A0516) for 1 h, after which the nuclei were stained with DAPI for 0.5 h. The stained samples were observed using a confocal laser scanning microscope (Zeiss LSM780NLO).
OTUB2 expression in NIT-1 cells and the pancreases of NOD mice
Total RNA and protein were extracted from NIT-1 cells (NIT-1-NC), NIT-1 cells treated with 20 mM HG for 24 h (NIT-1-HG) and NIT-1 cells treated with 5 μM TG for 0.5 h (NIT-1-TG). Relative Otub2 mRNA levels were determined by real-time qRT-PCR, and each sample was run in triplicate and evaluated using the 2(-△△Ct) method [71] with Gapdh as the internal reference control. For the western blot analysis, total protein samples were separated by SDS-PAGE and transferred to a PVDF membrane by electroblotting [72]. The expression levels of OTUB2 in NIT-1 cells and in the pancreases of NOD mice were determined using enhanced chemiluminescence. Immunohistochemical analysis of OTUB2 expression in the pancreases of NOD mice was carried out as previously described [71].
Mouse treatment and flow cytometry analysis
Female NOD mice, NOD/scid mice and ICR mice (HFK Bioscience, Beijing, China) were maintained under a 12-h light/dark cycle in specific pathogen-free facilities and allowed free access to sterilized water and food. All procedures were approved by the Institute Animal Care and Use Committee of Army Medical University (Chongqing, China).
Four-week-old female NOD mice were randomly divided into two groups and given normal water (NC group) or 20% glucose water (HG group). The mice were sacrificed at the age of 6 or 12 weeks, and lymphocytes were isolated from the spleen and pancreas for flow cytometry analysis.
Six-week-old female NOD mice were randomly divided into two groups and then subcutaneously injected with 30 μg of OTUB258-66 plus 30 μg of poly IC (OTUB258-66 group) or 30 μg of poly IC alone (control group) dissolved in 100 μL of PBS once per week for three consecutive weeks. After three injections, blood glucose levels were measured weekly until disease onset or until the end of the experimental observation period (25 weeks). NOD mice were sacrificed after 2 or 3 injections, and lymphocytes were isolated from the spleen, pLN and pancreas. The expression of intracellular cytokines and surface Annexin V, FAS and PD-1 on T cells was analyzed by flow cytometry. For the detection of Treg cells, lymphocytes were initially stained with Fixable Viability Dye eFluor® 780, BV510-conjugated anti-CD4, PerCP-Cy5.5-conjugated anti-CD8, and BV421-conjugated anti-CD25 in the dark at 4 °C for 20 min. After washing with flow cytometry buffer (PBS/1% FBS), the cells were fixed, permeated, and then stained with PE-Cy7-conjugated anti-mouse Foxp3 at 4 °C in permeabilization buffer. The cells were washed twice and analyzed on a BD FACSCanto II (BD Biosciences, Franklin Lakes, NJ).
Prediction and synthesis of potential HLA-A*0201-restricted human OTUB2 peptides
Potential HLA-A*0201-restricted human OTUB2 peptides were predicted by using SYFPEITHI (http://www.syfpeithi.de/), NetMHC-4.0 (https://services.healthtech.dtu.dk/services/NetMHC-4.0/) and IEDB MHC-I binding predictions (http://tools.iedb.org/mhci/). The peptides with a SYFPEITHI score greater than 18 and those with a % rank < 2 according to the other two methods were selected as candidate HLA-A*0201-restricted peptides (Supplementary Table 3). Human OTUB2 peptides that were consistently predicted to be HLA-A*0201-restricted by at least two methods were synthesized with a purity >95% at the Chinese Peptide Company (Hangzhou, China).
IFN-γ ELISPOT analysis of the response of PBMCs to human OTUB2 peptides in patients with TID
PBMCs were freshly isolated from 8 HLA-A2-positive patients with recent-onset T1D (average age, 9.1 ± 5.1 years old) and 6 HLA-A2-positive healthy controls without a history of first-degree relatives with T1D (average age, 30.6 ± 7.2 years old). Patients who met at least one of the following criteria were recruited from Children’s Hospital of Chongqing Medical University: (1) fasted C-peptide <0.6 ng/mL; (2) had a glucagon- or meal-stimulated C-peptide concentration of <1.8 ng/mL; (3) were positive for glutamic acid decarboxylase and/or other autoantibodies; (4) had 24-hour urine C-peptide concentration of <30 μg/day; or (5) had a history of diabetic ketoacidosis [73]. HLA-A2 expression on the PBMCs was determined by flow cytometry using an allophycocyanin (APC)-conjugated anti-human HLA-A2 (Invitrogen, BB7.2) antibody. The study protocol was approved by the Institutional Review Board of Children’s Hospital of Chongqing Medical University, and informed consent was obtained from all participants in this study. PBMCs from HLA-A2-positive patients or healthy controls were stimulated with medium alone, peptide pool (50 μg/mL of each peptide) or phytohemagglutinin (2.5 μg/mL) and cultured in 96-well ELISPOT plates precoated with a specific capture antibody against human IFN-γ (Dakewei Biotech, Shenzhen, China) at 37 °C and 5% CO2 for 24 h. After incubation, the cells were removed, and the plates were processed according to the manufacturer’s instructions for the ELISPOT kit. Spots were counted using a spot reader system (Saizhi, Beijing, China). The stimulation index (SI) was calculated as the ratio of the mean response in the presence of peptide to the mean response in the presence of medium alone. An SI ≥ 3 was selected as the cutoff for positivity.
Statistical analysis
Prism 10 software (GraphPad Software) was used for all the statistical analyses. The survival curves of the two groups were compared by the log-rank (Mantel–Cox) test, and unpaired two-group comparisons were conducted using Student’s t test. The data are presented as the mean ± SD. P < 0.05 (*), P < 0.01 (**) and P < 0.001 (***) were considered to indicate statistical significance.
Supplementary information
Acknowledgements
This work was supported by the National Natural Science Foundation of China (No. 82071825 and No. 81871301), the National Key Research and Development Program (No. 2016YFA0502204) and the Shandong Provincial Natural Science Fund (ZR2023MH201). We also thank Quan Zhou, Mingfu Ye and Xiaojun Peng (PTM-Biolabs, China) for their assistance in MS data analysis.
Author contributions
Lina Wang, Shushu Yang and Gaohui Zhu designed and carried out the experiments and drafted the manuscript; Jie Li and Xiangqian Li performed the flow cytometry staining and data analysis; Gang Meng and Xiaoling Chen performed the HE and immunohistochemical staining of paraffin-embedded pancreas sections; Mengjun Zhang prepared the biological samples and isolated the MHC I-peptide complexes; Shufeng Wang analyzed the MS data and predicted the potential HLA-A*0201-restricted human OTUB2 peptides; Yu Pan collected the blood of all the subjects and performed the human IFN-γ ELISPOT; Yi Huang performed critical revision of the article for important intellectual content; Li Wang conceived the original ideas, designed the project, interpreted the results, evaluated the data and wrote the manuscript; Yuzhang Wu supervised and managed the research process, completed the manuscript and provided research funds. All authors contributed to the article and approved the submitted version.
Data availability
All data that support the findings of this study are available within the source data and supplementary information files. The raw mass spectrometry proteomics data have been deposited in the ProteomeXchange Consortium via the PRIDE [1] partner repository with the dataset identifier PXD041227.
Competing interests
The authors declare no competing interests. Yuzhang Wu is an editorial board member of Cellular & Molecular Immunology, but he has not been involved in the peer review or the decision-making of the article.
Ethics approval and consent to participate
This study was approved by the Ethics Committee of the Army Medical University (Third Military Medical University) and Institutional Review Board of Children’s Hospital of Chongqing Medical University, and informed consent was obtained from all participants in this study.
Footnotes
These authors contributed equally: Lina Wang, Shushu Yang, Gaohui Zhu.
Contributor Information
Li Wang, Email: liwang118@tmmu.edu.cn.
Yuzhang Wu, Email: wuyuzhang@tmmu.edu.cn.
Supplementary information
The online version contains supplementary material available at 10.1038/s41423-024-01150-0.
References
- 1.Norris JM, Johnson RK, Stene LC. Type 1 diabetes—early life origins and changing epidemiology. Lancet Diabetes Endocrinol. 2020;8:226–38. doi: 10.1016/S2213-8587(19)30412-7. [DOI] [PMC free article] [PubMed] [Google Scholar]
- 2.von Scholten BJ, Kreiner FF, Gough SCL, von Herrath M. Current and future therapies for type 1 diabetes. Diabetologia. 2021;64:1037–48. doi: 10.1007/s00125-021-05398-3. [DOI] [PMC free article] [PubMed] [Google Scholar]
- 3.Pathiraja V, Kuehlich JP, Campbell PD, Krishnamurthy B, Loudovaris T, Coates PT, et al. Proinsulin-specific, HLA-DQ8, and HLA-DQ8-transdimer-restricted CD4+ T cells infiltrate islets in type 1 diabetes. Diabetes. 2015;64:172–82. doi: 10.2337/db14-0858. [DOI] [PubMed] [Google Scholar]
- 4.De Riva A, Varley MC, Bluck LJ, Cooke A, Deery MJ, Busch R. Accelerated turnover of MHC class II molecules in nonobese diabetic mice is developmentally and environmentally regulated in vivo and dispensable for autoimmunity. J Immunol. 2013;190:5961–71. doi: 10.4049/jimmunol.1300551. [DOI] [PMC free article] [PubMed] [Google Scholar]
- 5.Antoniou AN, Elliott J, Rosmarakis E, Dyson PJ. MHC class II Ab diabetogenic residue 57 Asp/non-Asp dimorphism influences T-cell recognition and selection. Immunogenetics. 1998;47:218–25. doi: 10.1007/s002510050351. [DOI] [PubMed] [Google Scholar]
- 6.Carrero JA, McCarthy DP, Ferris ST, Wan X, Hu H, Zinselmeyer BH, et al. Resident macrophages of pancreatic islets have a seminal role in the initiation of autoimmune diabetes of NOD mice. Proc Natl Acad Sci USA. 2017;114:E10418–e27. doi: 10.1073/pnas.1713543114. [DOI] [PMC free article] [PubMed] [Google Scholar]
- 7.Zinselmeyer BH, Vomund AN, Saunders BT, Johnson MW, Carrero JA, Unanue ER. The resident macrophages in murine pancreatic islets are constantly probing their local environment, capturing beta cell granules and blood particles. Diabetologia. 2018;61:1374–83. doi: 10.1007/s00125-018-4592-4. [DOI] [PMC free article] [PubMed] [Google Scholar]
- 8.Pugliese A. Autoreactive T cells in type 1 diabetes. J Clin Investig. 2017;127:2881–91. doi: 10.1172/JCI94549. [DOI] [PMC free article] [PubMed] [Google Scholar]
- 9.Culina S, Lalanne AI, Afonso G, Cerosaletti K, Pinto S, Sebastiani G, et al. Islet-reactive CD8(+) T cell frequencies in the pancreas, but not in blood, distinguish type 1 diabetic patients from healthy donors. Sci Immunol. 2018;3:eaao4013. doi: 10.1126/sciimmunol.aao4013. [DOI] [PMC free article] [PubMed] [Google Scholar]
- 10.Wang J, Tsai S, Shameli A, Yamanouchi J, Alkemade G, Santamaria P. In situ recognition of autoantigen as an essential gatekeeper in autoimmune CD8+ T cell inflammation. Proc Natl Acad Sci USA. 2010;107:9317–22. doi: 10.1073/pnas.0913835107. [DOI] [PMC free article] [PubMed] [Google Scholar]
- 11.Noble JA, Valdes AM, Varney MD, Carlson JA, Moonsamy P, Fear AL, et al. HLA class I and genetic susceptibility to type 1 diabetes: results from the Type 1. Diabetes Genet Consort Diabetes. 2010;59:2972–9. doi: 10.2337/db10-0699. [DOI] [PMC free article] [PubMed] [Google Scholar]
- 12.Yoneda R, Yokono K, Nagata M, Tominaga Y, Moriyama H, Tsukamoto K, et al. CD8 cytotoxic T-cell clone rapidly transfers autoimmune diabetes in very young NOD and MHC class I-compatible scid mice. Diabetologia. 1997;40:1044–52. doi: 10.1007/s001250050786. [DOI] [PubMed] [Google Scholar]
- 13.de Verteuil D, Granados DP, Thibault P, Perreault C. Origin and plasticity of MHC I-associated self peptides. Autoimmun Rev. 2012;11:627–35. doi: 10.1016/j.autrev.2011.11.003. [DOI] [PubMed] [Google Scholar]
- 14.Perreault C. The origin and role of MHC class I-associated self-peptides. Prog Mol Biol Transl Sci. 2010;92:41–60. doi: 10.1016/S1877-1173(10)92003-6. [DOI] [PubMed] [Google Scholar]
- 15.So JS. Roles of Endoplasmic Reticulum Stress in Immune Responses. Molecules cells. 2018;41:705–16. doi: 10.14348/molcells.2018.0241. [DOI] [PMC free article] [PubMed] [Google Scholar]
- 16.Liu H, Wang H, Chen D, Gu C, Huang J, Mi K. Endoplasmic reticulum stress inhibits 3D Matrigel-induced vasculogenic mimicry of breast cancer cells via TGF-beta1/Smad2/3 and beta-catenin signaling. FEBS open bio. 2021;11:2607–18. doi: 10.1002/2211-5463.13259. [DOI] [PMC free article] [PubMed] [Google Scholar]
- 17.Yong J, Johnson JD, Arvan P, Han J, Kaufman RJ. Therapeutic opportunities for pancreatic beta-cell ER stress in diabetes mellitus. Nat Rev Endocrinol. 2021;17:455–67. doi: 10.1038/s41574-021-00510-4. [DOI] [PMC free article] [PubMed] [Google Scholar]
- 18.Eizirik DL, Cardozo AK, Cnop M. The role for endoplasmic reticulum stress in diabetes mellitus. Endocr Rev. 2008;29:42–61. doi: 10.1210/er.2007-0015. [DOI] [PubMed] [Google Scholar]
- 19.Horwitz MS, Ilic A, Fine C, Balasa B, Sarvetnick N. Coxsackieviral-mediated diabetes: induction requires antigen-presenting cells and is accompanied by phagocytosis of beta cells. Clin Immunol. 2004;110:134–44. doi: 10.1016/j.clim.2003.09.014. [DOI] [PubMed] [Google Scholar]
- 20.Like AA, Rossini AA. Streptozotocin-induced pancreatic insulitis: new model of diabetes mellitus. Science. 1976;193:415–7. doi: 10.1126/science.180605. [DOI] [PubMed] [Google Scholar]
- 21.Delmastro MM, Piganelli JD. Oxidative stress and redox modulation potential in type 1 diabetes. Clin Dev Immunol. 2011;2011:593863. doi: 10.1155/2011/593863. [DOI] [PMC free article] [PubMed] [Google Scholar]
- 22.Karunakaran U, Elumalai S, Moon JS, Jeon JH, Kim ND, Park KG, et al. Myricetin Protects Against High Glucose-Induced beta-Cell Apoptosis by Attenuating Endoplasmic Reticulum Stress via Inactivation of Cyclin-Dependent Kinase 5. Diabetes Metab J. 2019;43:192–205. doi: 10.4093/dmj.2018.0052. [DOI] [PMC free article] [PubMed] [Google Scholar]
- 23.Jiang Z, Woda BA. Cytokine gene expression in the islets of the diabetic Biobreeding/Worcester rat. J Immunol. 1991;146:2990–4. doi: 10.4049/jimmunol.146.9.2990. [DOI] [PubMed] [Google Scholar]
- 24.Lamb MM, Frederiksen B, Seifert JA, Kroehl M, Rewers M, Norris JM. Sugar intake is associated with progression from islet autoimmunity to type 1 diabetes: the Diabetes Autoimmunity Study in the Young. Diabetologia. 2015;58:2027–34. doi: 10.1007/s00125-015-3657-x. [DOI] [PMC free article] [PubMed] [Google Scholar]
- 25.Li X, Wang L, Meng G, Chen X, Yang S, Zhang M, et al. Sustained high glucose intake accelerates type 1 diabetes in NOD mice. Front Endocrinol (Lausanne) 2022;13:1037822. doi: 10.3389/fendo.2022.1037822. [DOI] [PMC free article] [PubMed] [Google Scholar]
- 26.Marre ML, Profozich JL, Coneybeer JT, Geng X, Bertera S, Ford MJ, et al. Inherent ER stress in pancreatic islet beta cells causes self-recognition by autoreactive T cells in type 1 diabetes. J Autoimmun. 2016;72:33–46. doi: 10.1016/j.jaut.2016.04.009. [DOI] [PMC free article] [PubMed] [Google Scholar]
- 27.Kracht MJ, van Lummel M, Nikolic T, Joosten AM, Laban S, van der Slik AR, et al. Autoimmunity against a defective ribosomal insulin gene product in type 1 diabetes. Nat Med. 2017;23:501–7. doi: 10.1038/nm.4289. [DOI] [PubMed] [Google Scholar]
- 28.Delong T, Wiles TA, Baker RL, Bradley B, Barbour G, Reisdorph R, et al. Pathogenic CD4 T cells in type 1 diabetes recognize epitopes formed by peptide fusion. Science. 2016;351:711–4. doi: 10.1126/science.aad2791. [DOI] [PMC free article] [PubMed] [Google Scholar]
- 29.Wang L, Li X, Yang S, Chen X, Li J, Wang S, et al. Proteomic identification of MHC class I-associated peptidome derived from non-obese diabetic mouse thymus and pancreas. J Proteom. 2023;270:104746. doi: 10.1016/j.jprot.2022.104746. [DOI] [PubMed] [Google Scholar]
- 30.Houeiss P, Boitard C, Luce S. Preclinical models to evaluate the human response to autoantigen and antigen-specific immunotherapy in human type 1 diabetes. Front Endocrinol (Lausanne) 2022;13:883000. doi: 10.3389/fendo.2022.883000. [DOI] [PMC free article] [PubMed] [Google Scholar]
- 31.Unanue ER. Antigen presentation in the autoimmune diabetes of the NOD mouse. Annu Rev Immunol. 2014;32:579–608. doi: 10.1146/annurev-immunol-032712-095941. [DOI] [PubMed] [Google Scholar]
- 32.Takaki T, Marron MP, Mathews CE, Guttmann ST, Bottino R, Trucco M, et al. HLA-A*0201-restricted T cells from humanized NOD mice recognize autoantigens of potential clinical relevance to type 1 diabetes. J Immunol. 2006;176:3257–65. doi: 10.4049/jimmunol.176.5.3257. [DOI] [PubMed] [Google Scholar]
- 33.Ellis JM, Henson V, Slack R, Ng J, Hartzman RJ, Katovich Hurley C. Frequencies of HLA-A2 alleles in five U.S. population groups. Predominance Of A*02011 and identification of HLA-A*0231. Hum Immunol. 2000;61:334–40. doi: 10.1016/S0198-8859(99)00155-X. [DOI] [PubMed] [Google Scholar]
- 34.Fennessy M, Metcalfe K, Hitman GA, Niven M, Biro PA, Tuomilehto J, et al. A gene in the HLA class I region contributes to susceptibility to IDDM in the Finnish population. Childhood Diabetes in Finland (DiMe) Study Group. Diabetologia. 1994;37:937–44. doi: 10.1007/BF00400951. [DOI] [PubMed] [Google Scholar]
- 35.Gonzalez-Duque S, Azoury ME, Colli ML, Afonso G, Turatsinze JV, Nigi L, et al. Conventional and neo-antigenic peptides presented by beta cells are targeted by circulating naive CD8+ T cells in type 1 diabetic and healthy donors. Cell Metab. 2018;28:946–60.e6. doi: 10.1016/j.cmet.2018.07.007. [DOI] [PubMed] [Google Scholar]
- 36.Hamaguchi K, Gaskins HR, Leiter EH. NIT-1, a pancreatic beta-cell line established from a transgenic NOD/Lt mouse. Diabetes. 1991;40:842–9. doi: 10.2337/diab.40.7.842. [DOI] [PubMed] [Google Scholar]
- 37.Wen X, Zhu H, Li L, Li Y, Wang M, Liu J, et al. Transplantation of NIT-1 cells expressing pD-L1 for treatment of streptozotocin-induced diabetes. Transplantation. 2008;86:1596–602. doi: 10.1097/TP.0b013e31818c6e64. [DOI] [PubMed] [Google Scholar]
- 38.Stephens LA, Thomas HE, Kay TW. Protection of NIT-1 pancreatic beta-cells from immune attack by inhibition of NF-kappaB. J Autoimmun. 1997;10:293–8. doi: 10.1006/jaut.1997.0133. [DOI] [PubMed] [Google Scholar]
- 39.Marré ML, Piganelli JD. Environmental factors contribute to β cell endoplasmic reticulum stress and neo-antigen formation in type 1 diabetes. Front Endocrinol (Lausanne) 2017;8:262. doi: 10.3389/fendo.2017.00262. [DOI] [PMC free article] [PubMed] [Google Scholar]
- 40.Andre I, Gonzalez A, Wang B, Katz J, Benoist C, Mathis D. Checkpoints in the progression of autoimmune disease: lessons from diabetes models. Proc Natl Acad Sci USA. 1996;93:2260–3. doi: 10.1073/pnas.93.6.2260. [DOI] [PMC free article] [PubMed] [Google Scholar]
- 41.Prinz JC. Antigen processing, presentation, and tolerance: role in autoimmune skin diseases. J investig Dermatol. 2022;142:750–9. doi: 10.1016/j.jid.2021.05.009. [DOI] [PubMed] [Google Scholar]
- 42.Ishina IA, Zakharova MY, Kurbatskaia IN, Mamedov AE, Belogurov AA, Jr, Gabibov AG. MHC Class II presentation in autoimmunity. Cells. 2023;12:314. doi: 10.3390/cells12020314. [DOI] [PMC free article] [PubMed] [Google Scholar]
- 43.Dudek NL, Tan CT, Gorasia DG, Croft NP, Illing PT, Purcell AW. Constitutive and inflammatory immunopeptidome of pancreatic beta-cells. Diabetes. 2012;61:3018–25. doi: 10.2337/db11-1333. [DOI] [PMC free article] [PubMed] [Google Scholar]
- 44.Skowera A, Ellis RJ, Varela-Calviño R, Arif S, Huang GC, Van-Krinks C, et al. CTLs are targeted to kill beta cells in patients with type 1 diabetes through recognition of a glucose-regulated preproinsulin epitope. J Clin Investig. 2008;118:3390–402. doi: 10.1172/JCI35449. [DOI] [PMC free article] [PubMed] [Google Scholar]
- 45.Wong FS, Karttunen J, Dumont C, Wen L, Visintin I, Pilip IM, et al. Identification of an MHC class I-restricted autoantigen in type 1 diabetes by screening an organ-specific cDNA library. Nat Med. 1999;5:1026–31. doi: 10.1038/12465. [DOI] [PubMed] [Google Scholar]
- 46.Leon S, Haguenauer-Tsapis R. Ubiquitin ligase adaptors: regulators of ubiquitylation and endocytosis of plasma membrane proteins. Exp cell Res. 2009;315:1574–83. doi: 10.1016/j.yexcr.2008.11.014. [DOI] [PubMed] [Google Scholar]
- 47.Zhang Z, Du J, Wang S, Shao L, Jin K, Li F, et al. OTUB2 promotes cancer metastasis via hippo-independent activation of YAP and TAZ. Mol cell. 2019;73:7–21.e7. doi: 10.1016/j.molcel.2018.10.030. [DOI] [PubMed] [Google Scholar]
- 48.Li J, Cheng D, Zhu M, Yu H, Pan Z, Liu L, et al. OTUB2 stabilizes U2AF2 to promote the Warburg effect and tumorigenesis via the AKT/mTOR signaling pathway in non-small cell lung cancer. Theranostics. 2019;9:179–95. doi: 10.7150/thno.29545. [DOI] [PMC free article] [PubMed] [Google Scholar]
- 49.Chang W, Luo Q, Wu X, Nan Y, Zhao P, Zhang L, et al. OTUB2 exerts tumor-suppressive roles via STAT1-mediated CALML3 activation and increased phosphatidylserine synthesis. Cell Rep. 2022;41:111561. doi: 10.1016/j.celrep.2022.111561. [DOI] [PubMed] [Google Scholar]
- 50.Beck A, Vinik Y, Shatz-Azoulay H, Isaac R, Streim S, Jona G, et al. Otubain 2 is a novel promoter of beta cell survival as revealed by siRNA high-throughput screens of human pancreatic islets. Diabetologia. 2013;56:1317–26. doi: 10.1007/s00125-013-2889-x. [DOI] [PubMed] [Google Scholar]
- 51.Thomaidou S, Kracht MJL, van der Slik A, Laban S, de Koning EJ, Carlotti F, et al. β-cell stress shapes CTL immune recognition of preproinsulin signal peptide by posttranscriptional regulation of endoplasmic reticulum aminopeptidase 1. Diabetes. 2020;69:670–80. doi: 10.2337/db19-0984. [DOI] [PubMed] [Google Scholar]
- 52.Loaiza Naranjo JD, Bergot AS, Buckle I, Hamilton-Williams EE. A question of tolerance-antigen-specific immunotherapy for type 1 diabetes. Curr diabetes Rep. 2020;20:70. doi: 10.1007/s11892-020-01363-3. [DOI] [PubMed] [Google Scholar]
- 53.Zheng L, Li J, Lenardo M. Restimulation-induced cell death: new medical and research perspectives. Immunological Rev. 2017;277:44–60. doi: 10.1111/imr.12535. [DOI] [PubMed] [Google Scholar]
- 54.Cho HI, Barrios K, Lee YR, Linowski AK, Celis E. BiVax: a peptide/poly-IC subunit vaccine that mimics an acute infection elicits vast and effective anti-tumor CD8 T-cell responses. Cancer Immunol, immunotherapy: Cii. 2013;62:787–99. doi: 10.1007/s00262-012-1382-6. [DOI] [PMC free article] [PubMed] [Google Scholar]
- 55.Zhang M, Wang S, Guo B, Meng G, Shu C, Mai W, et al. An altered CD8(+) T cell epitope of insulin prevents type 1 diabetes in humanized NOD mice. Cell Mol Immunol. 2019;16:590–601. doi: 10.1038/s41423-018-0058-3. [DOI] [PMC free article] [PubMed] [Google Scholar]
- 56.Chen W, Frank ME, Jin W, Wahl SM. TGF-beta released by apoptotic T cells contributes to an immunosuppressive milieu. Immunity. 2001;14:715–25. doi: 10.1016/S1074-7613(01)00147-9. [DOI] [PubMed] [Google Scholar]
- 57.Huynh ML, Fadok VA, Henson PM. Phosphatidylserine-dependent ingestion of apoptotic cells promotes TGF-beta1 secretion and the resolution of inflammation. J Clin Investig. 2002;109:41–50. doi: 10.1172/JCI0211638. [DOI] [PMC free article] [PubMed] [Google Scholar]
- 58.Chen W, Jin W, Hardegen N, Lei KJ, Li L, Marinos N, et al. Conversion of peripheral CD4+CD25- naive T cells to CD4+CD25+ regulatory T cells by TGF-beta induction of transcription factor Foxp3. J Exp Med. 2003;198:1875–86. doi: 10.1084/jem.20030152. [DOI] [PMC free article] [PubMed] [Google Scholar]
- 59.Liu Y, Zhang P, Li J, Kulkarni AB, Perruche S, Chen W. A critical function for TGF-beta signaling in the development of natural CD4+CD25+Foxp3+ regulatory T cells. Nat Immunol. 2008;9:632–40. doi: 10.1038/ni.1607. [DOI] [PubMed] [Google Scholar]
- 60.Clement CC, Osan J, Buque A, Nanaware PP, Chang YC, Perino G, et al. PDIA3 epitope-driven immune autoreactivity contributes to hepatic damage in type 2 diabetes. Sci Immunol. 2022;7:eabl3795. doi: 10.1126/sciimmunol.abl3795. [DOI] [PMC free article] [PubMed] [Google Scholar]
- 61.Clement CC, Nanaware PP, Yamazaki T, Negroni MP, Ramesh K, Morozova K, et al. Pleiotropic consequences of metabolic stress for the major histocompatibility complex class II molecule antigen processing and presentation machinery. Immunity. 2021;54:721–36.e10. doi: 10.1016/j.immuni.2021.02.019. [DOI] [PMC free article] [PubMed] [Google Scholar]
- 62.Bassani-Sternberg M, Barnea E, Beer I, Avivi I, Katz T, Admon A. Soluble plasma HLA peptidome as a potential source for cancer biomarkers. Proc Natl Acad Sci USA. 2010;107:18769–76. doi: 10.1073/pnas.1008501107. [DOI] [PMC free article] [PubMed] [Google Scholar]
- 63.Schuster H, Shao W, Weiss T, Pedrioli PGA, Roth P, Weller M, et al. A tissue-based draft map of the murine MHC class I immunopeptidome. Sci data. 2018;5:180157. doi: 10.1038/sdata.2018.157. [DOI] [PMC free article] [PubMed] [Google Scholar]
- 64.Laumont CM, Daouda T, Laverdure JP, Bonneil É, Caron-Lizotte O, Hardy MP, et al. Global proteogenomic analysis of human MHC class I-associated peptides derived from non-canonical reading frames. Nat Commun. 2016;7:10238. doi: 10.1038/ncomms10238. [DOI] [PMC free article] [PubMed] [Google Scholar]
- 65.Toprak UH, Gillet LC, Maiolica A, Navarro P, Leitner A, Aebersold R. Conserved peptide fragmentation as a benchmarking tool for mass spectrometers and a discriminating feature for targeted proteomics. Mol Cell Proteom: Mcp. 2014;13:2056–71. doi: 10.1074/mcp.O113.036475. [DOI] [PMC free article] [PubMed] [Google Scholar]
- 66.Son YI, Egawa S, Tatsumi T, Redlinger RE, Jr, Kalinski P, Kanto T. A novel bulk-culture method for generating mature dendritic cells from mouse bone marrow cells. J immunological methods. 2002;262:145–57. doi: 10.1016/S0022-1759(02)00013-3. [DOI] [PubMed] [Google Scholar]
- 67.Trembleau S, Penna G, Gregori S, Chapman HD, Serreze DV, Magram J, et al. Pancreas-infiltrating Th1 cells and diabetes develop in IL-12-deficient nonobese diabetic mice. J Immunol. 1999;163:2960–8. doi: 10.4049/jimmunol.163.5.2960. [DOI] [PubMed] [Google Scholar]
- 68.Tario JD, Jr., Chen GL, Hahn TE, Pan D, Furlage RL, Zhang Y, et al. Dextramer reagents are effective tools for quantifying CMV antigen-specific T cells from peripheral blood samples. Cytom Part B, Clin Cytom. 2015;88:6–20. doi: 10.1002/cytob.21196. [DOI] [PMC free article] [PubMed] [Google Scholar]
- 69.Dolton G, Lissina A, Skowera A, Ladell K, Tungatt K, Jones E, et al. Comparison of peptide-major histocompatibility complex tetramers and dextramers for the identification of antigen-specific T cells. Clin Exp Immunol. 2014;177:47–63. doi: 10.1111/cei.12339. [DOI] [PMC free article] [PubMed] [Google Scholar]
- 70.Jedema I, van der Werff NM, Barge RM, Willemze R, Falkenburg JH. New CFSE-based assay to determine susceptibility to lysis by cytotoxic T cells of leukemic precursor cells within a heterogeneous target cell population. Blood. 2004;103:2677–82. doi: 10.1182/blood-2003-06-2070. [DOI] [PubMed] [Google Scholar]
- 71.Schatton T, Murphy GF, Frank NY, Yamaura K, Waaga-Gasser AM, Gasser M, et al. Identification of cells initiating human melanomas. Nature. 2008;451:345–9. doi: 10.1038/nature06489. [DOI] [PMC free article] [PubMed] [Google Scholar]
- 72.Posch C, Moslehi H, Feeney L, Green GA, Ebaee A, Feichtenschlager V, et al. Combined targeting of MEK and PI3K/mTOR effector pathways is necessary to effectively inhibit NRAS mutant melanoma in vitro and in vivo. Proc Natl Acad Sci USA. 2013;110:4015–20. doi: 10.1073/pnas.1216013110. [DOI] [PMC free article] [PubMed] [Google Scholar]
- 73.Baek JH, Lee WJ, Lee BW, Kim SK, Kim G, Jin SM, et al. Age at diagnosis and the risk of diabetic nephropathy in young patients with type 1 diabetes mellitus. Diabetes Metab J. 2021;45:46–54. doi: 10.4093/dmj.2019.0134. [DOI] [PMC free article] [PubMed] [Google Scholar]
Associated Data
This section collects any data citations, data availability statements, or supplementary materials included in this article.
Supplementary Materials
Data Availability Statement
All data that support the findings of this study are available within the source data and supplementary information files. The raw mass spectrometry proteomics data have been deposited in the ProteomeXchange Consortium via the PRIDE [1] partner repository with the dataset identifier PXD041227.