Abstract
Latent membrane protein 2A (LMP2A) is one of only two viral proteins expressed during latent Epstein-Barr virus (EBV) infections in human peripheral B cells. LMP2A blocks B-cell receptor (BCR) signal transduction in vitro by modulation of the Syk and Lyn protein tyrosine kinases. Five genetically unique LMP2A transgenic mouse lines (EμLMP2A) with B-cell lineage expression of LMP2A were generated in this study to analyze the importance of LMP2A expression in vivo. These animals can be grouped into EμLMP2ABCR+ (TgB, Tg6, and TgC) and EμLMP2ABCR− (Tg7 and TgE) lines based on B-cell phenotype. LMP2A expression in bone marrow cells of EμLMP2ABCR− lines was associated with a bypass of normal B-lymphocyte developmental checkpoints inasmuch as immunoglobulin light-chain gene rearrangement occurred in the absence of complete immunoglobulin heavy-chain gene rearrangement. The resulting BCR-negative B cells were able to exit the bone marrow and colonize peripheral lymphoid organs. LMP2A expression in EμLMP2ABCR+ lines was not associated with altered B-cell development in a genetically wild-type background. When crossed into a recombinase activating null (RAG−/−) genetic background, LMP2A expression in either RAG−/− EμLMP2ABCR+ or RAG−/− EμLMP2ABCR− animals was able to provide a survival signal to BCR-negative splenic B cells. Additionally, bone marrow cells from all EμLMP2A animals were able to proliferate in response to interleukin-7-dependent developmental signals in vitro. These studies illustrate that LMP2A can provide a survival signal to BCR-negative B cells in two different groups of EμLMP2A transgenic mice.
Epstein-Barr virus (EBV) is able to infect primary human B cells in culture, transforming them into lymphoblastoid cell lines (LCLs). Upon infection, the virus enters a latent life cycle characterized by the expression of six EBV nuclear antigens (EBNA1, EBNA2, EBNA3A, EBNA3B, EBNA3C, and EBNA-LP) and three latently expressed membrane proteins (LMP1, LMP2A, and LMP2B) (17). These latent viral proteins dramatically alter in vitro B-cell biology as characterized by upregulated expression of activation and adhesion markers (CD23, CD39, CD40, CD44, LFA-1, LFA-3, and ICAM-1), decreased dependence on high-serum medium, and secretion of immunoglobulin (17). However, EBV latency in defined culture systems in vitro is quite different from in vivo latency. In latently infected individuals, virus can be isolated from immunoglobulin M-positive (IgM+) IgD− resting memory B cells which have lost surface expression of the costimulatory molecule B7-1 and the activation marker CD23 (1, 34, 35). Of the nine latent gene products detected in vitro, only EBNA1 and LMP2A transcripts are reproducibly detected in latently infected human B cells (6, 34, 40, 46). Although latent virus has been isolated from peripheral B cells in otherwise healthy individuals (1, 6, 8, 15, 34, 35, 40, 46), latently infected B cells may reside in bone marrow or other lymphatic sites producing latently infected progeny cells which account for the stable number of infected peripheral B cells in otherwise healthy individuals (21, 23, 35, 50, 51).
Considerable genetic and biochemical research has elucidated many aspects of LMP2A biology in vitro. LMP2A has 12 transmembrane domains and is expressed in patches on the surface of latently infected cells (24, 25, 42). The Lyn protein tyrosine kinase (PTK) binds to LMP2A via tyrosine residue 112 and is essential for the constitutive LMP2 phosphorylation detected in LCLs (12). Lyn-dependent phosphorylation allows other PTKs to bind specific sites within the LMP2A amino terminal cytoplasmic tail (10, 12). The Syk PTK specifically binds to the LMP2A ITAM domain at tyrosine residues 74 and 85 (11). Syk bound to LMP2A becomes constitutively phosphorylated and is unable to participate in B-cell receptor (BCR)-initiated signal transduction (11). Through interactions with these and other cellular proteins, LMP2A is able to downmodulate intracellular signaling cascades mediated by the BCR, the CD19 complex, and major histocompatibility complex class II (31, 33, 38). Although expressed in Hodgkin's disease and nasopharyngeal carcinoma cells (2, 4, 7, 36, 37), LMP2A is not essential for EBV transformation in vitro (27–29).
Transgenic mice expressing EBV latency proteins under transcriptional control of an immunoglobulin promoter have provided a convenient system for analyzing latent viral gene function in B cells in vivo. LMP1 transgenic mice develop lymphomas which exhibit upregulated expression of the antiapoptotic proteins Bcl-2 and A20, as well as the Myc oncoprotein (19). The episomal maintenance protein EBNA1 is able to induce monoclonal B-cell lymphomas in EμEBNA1 transgenic mice (48, 49). These results are surprising in that EBNA1 has no transforming ability in vitro. Recently described research with EμLMP2A transgenic mice suggest a role for LMP2A in B-cell survival in vivo (5). LMP2A transgene expression alters early B-cell development in the bone marrow during a transition requiring preBCR activation of Syk PTK. LMP2A expression blocks immunoglobulin heavy-chain expression while allowing subsequent immunoglobulin light-chain rearrangement. The resulting peripheral B cells do not express a BCR complex and yet, surprisingly, survive in the spleen without BCR stimulation. LMP2A is also able to drive B-cell development when EμLMP2A transgenic animals are crossed into a recombinase-activating gene (RAG) null background. These results indicate that LMP2A may be able to provide a yet-uncharacterized proliferative and survival signal to B cells in vivo.
Three additional EμLMP2A transgenic mice have been isolated which have relatively normal proportions of BCR-positive B cells in a genetically wild-type background. However, when crossed into a RAG null background, LMP2A transgene expression in these new EμLMP2A animals is also able to provide a survival signal to BCR-negative peripheral B cells. As-yet-undefined epigenetic effects modulating either the time or level of LMP2A expression may be controlling the EμLMP2A transgenic phenotype in a wild-type genetic background.
MATERIALS AND METHODS
Isolation of primary lymphoid cells and immunoblot analysis.
Bone marrow cells were flushed from femurs by using cold staining buffer (10 mg of bovine serum albumin per ml, 1× phosphate-buffered saline [PBS], 10 mM HEPES, 0.1% NaAzide). Spleens were dissociated between frosted slides in staining buffer to prepare single cell suspensions. Erythrocytes were lysed in erythrocyte lysis buffer (Sigma). Equivalent numbers of cells were washed three times in PBS and lysed in 1% NP-40 lysis buffer for 15 min at 4°C. Insoluble material was removed by centrifugation. Lysates were heated to 70°C for 10 min, separated by sodium dodecyl sulfate-polyacrylamide gel electrophoresis, and transferred to Immobilon membranes (Millipore). Membranes were blocked with 4% milk for 1 h at room temperature and probed with predetermined primary antibody dilutions overnight at 4°C. Membranes were then washed three times in TBST, incubated with predetermined horseradish peroxidase (HRP)-conjugated secondary antibody dilutions for 1 h at room temperature, washed five times with TBST, and detected by enhanced chemiluminescence. LMP2A immunoblottings were performed with a 1:2,500 dilution of purified 14B7-1-1 (800 μg/ml) in 1% milk–TBST as the primary antibody and a 1:2,000 dilution of HRP-conjugated sheep anti-rat F(ab)2 (Amersham) as the secondary antibody. Phosphatidylinositol 3 (PI3) kinase p85 immunoblottings were performed with a 1:5,000 dilution of anti-PI3 kinase p85 rabbit antiserum (Upstate Biotechnology) in 1% milk–TBST as the primary antibody and a 1:4,000 dilution of HRP-conjugated anti-rabbit antibody (New England Biolabs catalog number 7071-1) in TBST as the secondary antibody.
Quantitative RT-PCR. (i) Parameters for quantitative RT-PCR assay.
Quantitation of LMP2A mRNA transcripts from EμLMP2A transgenic bone marrow samples was determined in real time by 5′-to-3′ hydrolysis of a double-labeled fluorogenic probe in a kinetic PCR assay. Commercially, this assay is referred to as an RNA Taqman assay (see below) and is also referred to as quantitative reverse transcription PCR (QRT-PCR) here. Total RNA was assayed for LMP2A DNA contamination by using a DNA Taqman assay (see below). Samples which were below the level of quantitation (20 copies) for LMP2A DNA were assayed for LMP2A RNA by using an RNA Taqman assay. All samples were assayed for GAPDH (glyceraldehyde-3-phosphate dehydrogenase) RNA by a gene-specific RNA Taqman assay to allow for normalization of LMP2A levels. The RNA and DNA Taqman assays were performed in single tube reaction mixtures in 96-well arrays by using the ABI Prism 7700 Sequence Detector. This equipment is connected to a Macintosh personal computer, allowing data quantification by ABI Sequence Detection software.
(ii) Isolation and purification of total bone marrow RNA.
Equivalent numbers of EμLMP2A bone marrow cells were lysed in Qiagen RLT Buffer containing 0.1% β-mercaptoethanol according to the manufacturer's specification. Total RNA was isolated by using the Qiagen RNeasy Mini Kit as described by the manufacturer. Samples were incubated with 20 U of RQ1 DNase (Promega) in 1× Optimized Transcription Buffer (Promega) for 45 min at 37°C. RQ1 DNase was removed by using the RNeasy protocol for RNA cleanup from the Qiagen RNeasy Mini Kit as described by the manufacturer.
(iii) Preparation of in vitro-transcribed LMP2A RNA.
Plasmid RL34 contains the LMP2A cDNA sequence cloned downstream of a T7 promoter (24). A 1,979-bp LMP2A RNA transcript standard was prepared by in vitro transcription from the T7 promoter of a BglII-linearized RL34 plasmid by using the T7 Megascript Kit (Ambion) per manufacturer's description. Transcripts were incubated with 20 U of RQ1 DNase (Promega) in 1× Optimized Transcription Buffer (Promega) for 45 min at 37°C. Transcripts were phenol-chloroform extracted, ethanol precipitated, and resuspended in nuclease-free water. The integrity of transcripts was determined by agarose gel electrophoresis under denaturing conditions, staining with Sybr Green II, and visualization under UV light with a 590-nm filter. Transcripts were quantified by using the UV absorption at 260 nm. The observed concentration of RNA and the molecular weight of the LMP2A transcript (633,440 μg/μmol) were used to determine the molar concentration of the in vitro-transcribed sample. Working standards were prepared by serial dilution.
(iv) Preparation of LMP2A DNA standards.
DNA standards were prepared from nonlinearized RL34 plasmid containing the LMP2A cDNA. The absolute molar concentration of DNA plasmid was calculated by using the UV absorption at 260 nm and the molecular weight of RL34 (3,740,000 μg/μmol). Working standards were prepared by serial dilution.
(v) DNA Taqman assay.
DNA Taqman assays were performed in 25-μl (final volume) reaction mixtures containing 900 nM concentrations each of LMP2A QRT-PCR primers OL139 and OL140, 100 nM LMP2A reporter oligoprobe OL141, 3.5 mM MgCl2, 0.25 U of AmpliTaq Gold per μl, 0.01 U of AmpErase uracil N-glycosylase (UNG) per μl, 200 nM concentrations (each) of dATP, dGTP, and dCTP, 400 nM dUTP, and 1× Taqman Buffer A (PE Applied Biosystems) containing 10 mM Tris-HCl, 50 mM KCl, 0.01 mM EDTA, 60 nM Passive Reference 1, and 8% glycerol (pH 8.3). Thermal cycling parameters began with 2 min at 50°C to allow UNG decontamination of preexisting DNA template generated by previous PCR amplifications (30). Cycling parameters continued with 12 min at 95°C (AmpliTaq Gold polymerase activation) and 5 min at 95°C (denaturation), followed by 40 amplification cycles (15 s at 95°C, 60 s at 60°C) and one cycle for 60 s at 25°C. Then, 2 μl of EμLMP2A bone marrow RNA was assayed in singlet. The RL34 standards and no-template (NT) water controls were assayed in triplicate. Serial 10-fold dilutions from 21,7000 to 21.7 copies of LMP2A DNA were assayed to generate the DNA Taqman standard curve. DNA concentrations in EμLMP2A bone marrow LMP2A RNA samples were determined from the RL34 standard curve.
(vi) LMP2A RNA Taqman assay.
RNA Taqman assays were performed essentially the same as the DNA Taqman Assay. However, amplification enzymes, buffer conditions, and cycling parameters differed for the two assays. RNA Taqman assays were performed in 25-μl (final volume) reaction mixtures containing 900 nM concentrations each of LMP2A primers OL139 and OL140, 100 nM LMP2A reporter oligoprobe OL141, 3 mM Mg acetate, 0.1 U of rTth polymerase (PE Applied Biosystems) per μl, 0.01 U of UNG per μl, 300 nM concentrations (each) of dATP, dGTP, and dCTP, 600 nM dUTP, and 1× Taqman EZ Buffer (PE Applied Biosystems) containing 50 mM Bicine, 115 mM KCl, 0.01 mM EDTA, 60 nM Passive Reference 1, and 8% glycerol (pH 8.0). Cycling parameters were 2 min at 50°C (UNG decontamination), 30 min at 60°C (rTth RT), and 5 min at 95°C (denaturation), followed by 40 amplification cycles (15 s at 95°C, 60 s at 60°C) and one cycle at for 60 s at 25°C. Then, 2 μl of EμLMP2A bone marrow RNA, the in vitro-transcribed LMP2A RNA standards, and NT water controls were assayed in triplicate. Serial 10-fold dilutions of in vitro-transcribed LMP2A RNA ranging from 4,838,000 to 483.8 copies were used to generate the RNA Taqman standard curve. EμLMP2A bone marrow LMP2A RNA concentrations were determined from the in vitro-transcribed LMP2A RNA standard curve.
(vii) GAPDH RNA Taqman assay.
GAPDH RNA Taqman assays were performed essentially as described for the LMP2A RNA Taqman assay, with the following exceptions. The oligonucleotides used for cDNA amplification and detection are the commercially available rodent GAPDH forward and reverse primers and the rodent GAPDH oligoprobe (PE Applied Biosystems). The rodent GAPDH oligoprobe was resynthesized to contain the reporter dye FAM at the 5′ end and the nonfluorescent quencher dye QSY (dark dye) at the 3′ end (Megabases, Inc., Evanston, Ill.). These oligonucleotide sequences were renamed OL142 (rodent GAPDH forward), OL143 (rodent GAPDH reverse), and OL144 (modified rodent GAPDH oligoprobe). The cDNA amplification utilizes 300 nM OL142, 300 nM OL143, and 100 nM OL144. Due to the high efficiency of the GAPDH amplification, all RNA samples were diluted 1:50 for the GAPDH amplification. Serial 10-fold dilutions of rodent RNA (Taqman Rodent GAPDH Control Reagents; PE Applied Biosystems) ranging from 100,000 to 1 pg of RNA were used to generate the GAPDH RNA Taqman standard curve.
Flow cytometry.
Approximately 2 × 10⁶ cells were incubated in staining buffer with previously optimized concentrations of the indicated antibodies on ice for 15 min. Cells were washed and analyzed by flow cytometry by using a Becton Dickinson FACScan and the Cellquest analysis software. CD19-phycoerythrin, CD43-fluorescein isothiocyanate, and IgM-fluorescein isothiocyanate were purchased from Pharmingen.
Oligonucleotide sequences.
The sequences of previously unpublished oligonucleotides were as follows: OL139, GCACGACTGTTCCTATATGCTCTC; OL140, CAAAATACTGCCACCAGCGA; and OL141, (FAM)-CACTCTTGTTGCTAGCCTCCGCGCT-(TAMRA).
Methylcellulose culture.
A total of 5 × 10⁵ bone marrow cells were plated in 3 ml of Methocult M3630 methylcellulose media (Stem Cell Technologies) according to the manufacturer's instructions. After 7 days of culture, colonies were photographed under light microscopy. Cells were harvested and washed in 1× PBS, counted, and utilized in subsequent experiments as described above.
RESULTS
Initial characterization of EμLMP2A mice.
EμLMP2A transgenic mice were constructed as described previously (5). Genomic tail DNA from each of the different animals was analyzed by Southern hybridization to verify that unique genomic insertion events occurred in each of the transgenic EμLMP2A animals (data not shown). Each of these lines has maintained the specific transgenic genotype for more than six generations. The different EμLMP2A transgenic lines were given numeric or alphabetic designations which will be maintained throughout subsequent data analysis.
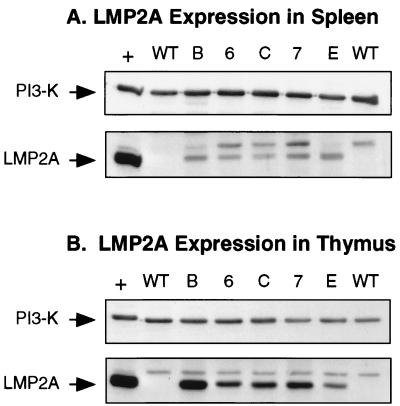
Immunoblot analysis was used to detect LMP2A expression levels in each of the EμLMP2A transgenic lines created. LMP2A was readily detected in all EμLMP2A splenic and thymic samples examined (Fig. 1). As expected, no LMP2A expression was detected in wild-type animals. A nonspecific band was detected in all samples, including the wild-type murine samples and the EBV-transformed LCL used as a positive control for LMP2A expression (Fig. 1). Equivalent expression levels of the p85 subunit of PI3 kinase indicate roughly equal amounts of total protein in each of the sample lanes (Fig. 1). LMP2A expression was also detected in purified B cells from EμLMP2A TgE, Tg7, and Tg6 spleens (reference 5 and data not shown). Although detectable, relative levels of LMP2A expression in purified splenic B-cell populations was not reproducible or quantitative.
FIG. 1.
Immunoblot detection of LMP2A expression in EμLMP2A spleen (A) and thymus (B) tissues. Whole spleen and thymus organs from EμLMP2A animals were excised and dissociated between frosted slides. Membranes were cut in half, allowing independent analysis of the same sample with LMP2A (45 kDa) and PI3 kinase (85-kDa subunit) antibodies. The bottom portion of each membrane was probed with rat 14B7 anti-LMP2A monoclonal antibody. The top portion of each blot was probed with rabbit anti-p85 primary antibody. Cell lysates from LCL10 cell equivalents were used as a positive control (+) for LMP2A expression. The LCL10 positive control lane contains 0.5 × 10⁶ cell equivalents; all EμLMP2A lanes contain 2.5 × 10⁶ cell equivalents. Wild-type animals are as indicated (WT). EμLMP2A genotypes are indicated by single alphanumeric abbreviations.
Since B-cell progenitors arise from the bone marrow, LMP2A expression was examined in bone marrow samples from each of the EμLMP2A transgenic lines. LMP2A protein expression was undetectable in bone marrow samples by immunoblot analysis. However, LMP2A RNA transcripts were detected in bone marrow samples from Tg6, TgE, and Tg7 animals by nonquantitative RT-PCR (reference 5 and unpublished results). Therefore, a more quantitative and sensitive assay was utilized to determine relative LMP2A expression levels in each of the different EμLMP2A bone marrow samples.
Quantitative analysis of LMP2A transcription in bone marrow.
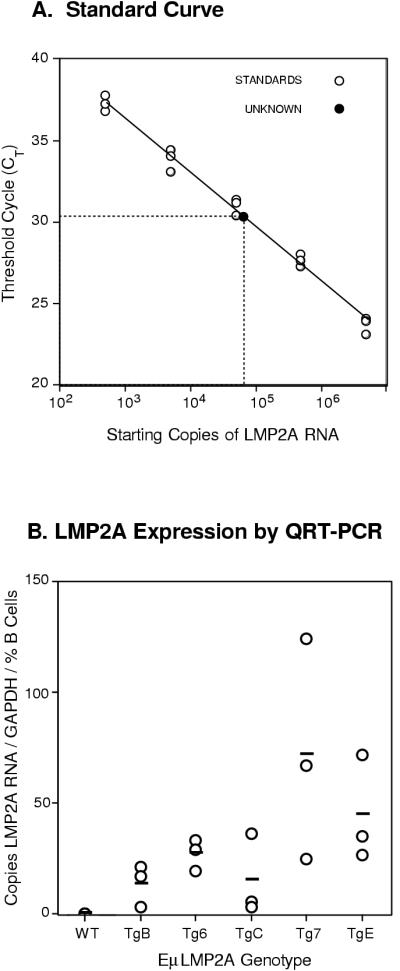
LMP2A expression in bone marrow samples was detected by using a recently developed QRT-PCR assay (RNA Taqman Assay; PE Applied Biosystems). LMP2A-specific RT-PCR products were amplified from serial 10-fold dilutions of in vitro-transcribed LMP2A RNA to generate a standard curve (Fig. 2A). Subsequent standard curves for each assay were equally reproducible, sensitive, and linear within the range of the serial dilutions and the unknown samples. Absolute levels of LMP2A RNA were determined for bone marrow samples of each EμLMP2A genotype. Relative levels of LMP2A expression in the transgenic lines were determined by dividing the LMP2A RNA transcript copy number by the absolute number of GAPDH RNA copies per sample and normalizing for the proportion of B cells in the primary bone marrow sample (copies of LMP2A/GAPDH RNA copies/% B cells). Only background levels of LMP2A transcripts were detected in wild-type littermate control animals, whereas LMP2A RNA was readily detected in all transgenic bone marrow samples examined (Fig. 2B). As a group, EμLMP2A TgB, Tg6, and TgC mice transcribe less LMP2A mRNA than EμLMP2A Tg7 and TgE animals (Fig. 2B; Student's t test, P = 0.012). Although this assay assumes LMP2A expression in only B-lineage bone marrow cells, we are unable to preclude LMP2A expression in other bone marrow cell types. Previous research had shown that bone marrow expression of LMP2A in EμLMP2A TgE and Tg7 animals was able to alter normal B-cell development (5). Therefore, EμLMP2A TgB, Tg6, and TgC animals were examined by flow cytometry to determine if relatively lower levels of LMP2A RNA expression were sufficient to alter early B-cell development.
FIG. 2.
Quantitative PCR analysis of LMP2A expression in transgenic bone marrow samples. (A) Standard curve analysis of serially diluted in vitro-transcribed LMP2A RNA. The extrapolation of QRT-PCR results from transgenic bone marrow samples allows for quantification of absolute LMP2A RNA copy numbers in transgenic bone marrow. (B) Relative LMP2A RNA content in EμLMP2A bone marrow samples. Bone marrow RNA from the various EμLMP2A genotypes, serially diluted LMP2A standards, and no-template water control samples were all simultaneously analyzed in triplicate for LMP2A transcript number by using an RNA Taqman assay. Absolute numbers of LMP2A transcripts in the unknown EμLMP2A bone marrow samples were determined from the standard curve. Absolute numbers of LMP2A transcripts were normalized to the GAPDH RNA copy number for each sample and the total percentage of CD19+ B cells in the initial bone marrow sample as determined by flow cytometry. Relative numbers of LMP2A transcripts from the various EμLMP2A and wild-type bone marrow sample are plotted against the y axis. The horizontal bars indicate the average LMP2A transcript copy numbers from three mice of each genotype. Average values for wild-type (WT), TgB, Tg6, TgC, Tg7, and TgE animals were 13, 27, 15, 77, and 44 copies LMP2A RNA/GAPDH copy/% B cells, respectively. Together, the EμLMP2A TgB, Tg6, and TgC mice transcribed less LMP2A mRNA than did the EμLMP2A Tg7 and TgE animals (Student's t test; P = 0.012).
LMP2A expression is insufficient to alter B-cell development in EμLMP2A TgB, Tg6, and TgC mice.
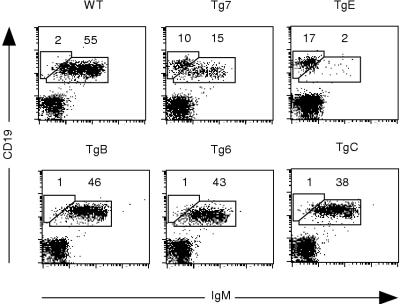
Spleen samples of all EμLMP2A transgenic animals were analyzed for surface expression of CD19 and IgM, two markers of mature peripheral B cells. As previously shown (5), EμLMP2A TgE and Tg7 animals exhibited a dramatic reduction in the number of CD19+ IgM+ cells in the spleen (Fig. 3). Both of these lines also exhibited a characteristic and striking increase in CD19+ IgM− versus IgM+ spleen cells. Although the new EμLMP2A lines TgB, Tg6, and TgC did not exhibit the CD19+ IgM− B-cell phenotype of Tg7 and TgE animals, these new lines do show a small reduction in total number of mature B cells (compare 38 to 46% CD19+ IgM+ for EμLMP2A TgB, Tg6, and TgC animals to 55% CD19+ IgM+ for wild type; Fig. 3). The transgenic lines were subsequently designated EμLMP2ABCR+ (TgB, Tg6, and TgC) or EμLMP2ABCR− (TgE and Tg7) based upon the relative phenotypic difference in the proportion of BCR-positive splenic B cells. Since the reduction in total numbers of CD19+ B cells in EμLMP2ABCR− animals is due to altered B-cell development in the bone marrow (5), samples from EμLMP2ABCR+ animals were subsequently examined to determine if developing B-cell populations were significantly different from wild-type animals.
FIG. 3.
CD19 and IgM expression on EμLMP2A splenocytes. Single cell suspensions from all samples were prepared and stained with CD19 and IgM antibodies for flow cytometry. EμLMP2A genotypes are indicated. Boxes represent CD19+ IgM− and CD19+ IgM+ populations based upon wild-type (WT) B-cell staining patterns. The percentages of lymphocytes expressing CD19 and IgM are indicated for specific populations. These data are representative of at least three separate experiments. Based upon the phenotypic differences in IgM expression among these animals, the mice were designated EμLMP2ABCR+ (TgB, Tg6, and TgC) or EμLMP2ABCR− (TgE and Tg7).
Murine B-cell development occurs in the bone marrow through ordered stages that can be delineated by cell surface markers and the status of immunoglobulin heavy-chain (HC) and light-chain (LC) gene rearrangements (14). Early progenitor B (proB) cells express CD43 on the cell surface and contain immunoglobulin HC and LC genes in germ line configuration, while the earliest CD19+ cell has rearranged both the diversity (D) and joining segments (J) of immunoglobulin HC. Cells that have successfully performed D-to-JH and subsequent V-to-DJH rearrangements generate a functional precursor BCR (preBCR). preBCR signaling initiates subsequent immunoglobulin LC rearrangement (κ or λ) and the downregulation of CD43 expression in precursor B (preB) cells. Mature B cells that express a BCR containing immunoglobulin HC and LC proteins leave the bone marrow and colonize the spleen.
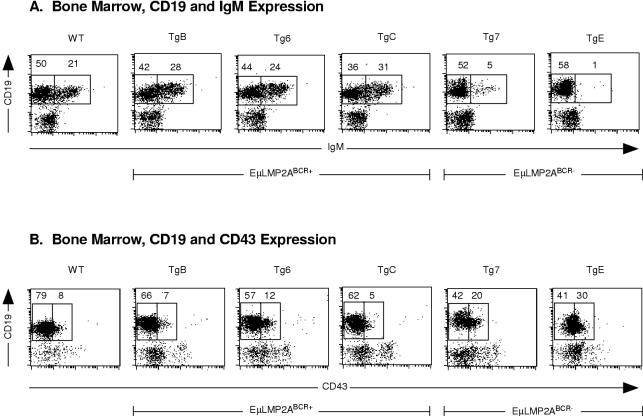
All EμLMP2A bone marrow samples were examined by flow cytometry to quantify immature CD19+ IgM+ B cells. The EμLMP2ABCR+ animals and wild-type animals exhibited similar proportions of immature CD19+ IgM+ bone marrow cells (Fig. 4A). EμLMP2ABCR− animals exhibited the previously characterized accumulation of CD19+ IgM− B cells (Fig. 4A). Bone marrow cells were also examined for CD43 expression as a marker for appropriate proB-to-preB cell transition in the earliest stages of B-cell development. Given the relatively normal proportions of CD19-positive cells in EμLMP2ABCR+ animals, it is not surprising that EμLMP2ABCR+ bone marrow cells complete the transition from proB to preB cells in proportions similar to those for wild-type littermate controls (Fig. 4B). By comparison, the EμLMP2ABCR− bone marrow cells exhibit an accumulation of CD19+ CD43+ proB cells which do not progress to CD19+ CD43− preB cells (Fig. 4B). Although not fully appreciated in previous studies (5), this alteration in CD43+ EμLMP2ABCR− bone marrow cells is clearly discernible when compared to EμLMP2ABCR+ or wild-type mouse bone marrow samples in these experiments.
FIG. 4.
Flow cytometry analysis of EμLMP2A bone marrow. Single cell suspensions from all EμLMP2A bone marrow samples were prepared and stained with CD19, IgM, and CD43 antibodies for flow cytometry. EμLMP2A genotypes are indicated. (A) CD19 and IgM expression. Boxes represent CD19+ IgM− and CD19+ IgM+ populations based upon EμLMP2A TgE staining patterns. (B) CD19 and CD43 expression. Boxes represent CD19+ CD43− and CD19+ CD43+ populations in EμLMP2A bone marrow samples as delineated by RAG−/− animals which exhibit only CD19+ CD43+ populations (data not shown). The percentage of lymphocytes expressing CD19 and IgM or expressing CD19 and CD43 are indicated for the specific populations. These data are representative of at least three separate experiments.
EμLMP2ABCR− animals are unable to fully rearrange their immunoglobulin HC genes, resulting in the accumulation of BCR-negative peripheral B cells (5). Representative of EμLMP2ABCR+ animals, Tg6 bone marrow cells were examined for immunoglobulin gene rearrangements. These animals showed no difference in VDJ recombination frequency compared to wild-type littermate animals (data not shown). Although the EμLMP2ABCR+ animals exhibit a small reduction in the total number of peripheral B cells (Fig. 3), LMP2A expression in EμLMP2ABCR+ animals was insufficient to alter B-cell development.
T-cell development is unaltered in EμLMP2A animals.
As shown in Fig. 1B, LMP2A is readily detected in thymus samples from each of the EμLMP2A mice. Flow cytometry analysis revealed that B cells constitute less than 1% of the total thymic sample preparations from all animals examined (data not shown). Therefore, the LMP2A detected in Fig. 1B results exclusively from T-cell transgene expression. In order to determine if LMP2A affected T-cell development, lymphocyte populations from spleen and thymus were examined for differences in CD4 and CD8 T-cell proportions. When compared to wild-type littermate controls, no significant differences in the relative proportion of T-cell populations were identified in either developing thymic T-cell populations or in mature splenic T-cell populations (data not shown). Additionally, in vitro proliferation assays have identified no discernible effect of LMP2A expression on T-cell responses initiated by treatment with anti-CD3 antibodies, phytohemagglutinin, or concanavalin A stimulation (data not shown). These data suggest that although the transgene is expressed in both splenic and thymic T-cell populations in these animals, only the B-cell compartment exhibits an altered developmental program as a result of LMP2A expression.
EμLMP2ABCR+ transgene expression provides a B-cell survival signal in a RAG-deficient background.
LMP2A expression in the EμLMP2ABCR− TgE bone marrow is able to overcome the proB-to-preB block in RAG−/− B cells, allowing significant numbers of CD19+ IgM− cells to accumulate in the periphery of RAG−/− TgE+ animals (5). Although unable to significantly alter B-cell development in a wild-type genetic background, LMP2A expression in EμLMP2ABCR+ animals may be sufficient to provide developmental and survival signals to RAG−/− primordial B cells. Therefore, the EμLMP2ABCR+ lines and the previously untested EμLMP2ABCR− Tg7 line were bred into the RAG−/− background in order to determine if LMP2A expression in genetically unique EμLMP2A animals quantitatively affects RAG−/− B-cell development in the manner previously described for RAG−/− TgE+ animals (5).
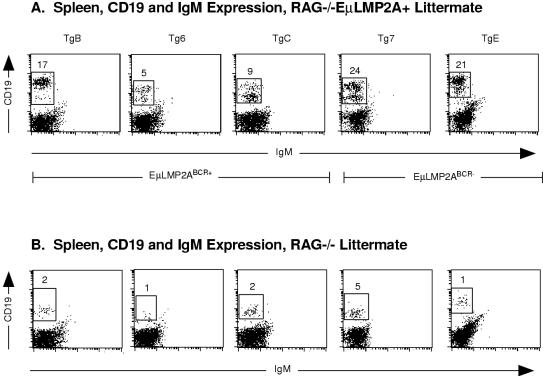
Spleen samples from each RAG−/− EμLMP2A+ genotype (Fig. 5A) and RAG−/− EμLMP2A− littermate control animals (Fig. 5B) were analyzed by flow cytometry for expression of developmentally regulated B-cell markers. Due to the loss of RAG gene expression, all RAG−/− littermate control animals are unable to rearrange immunoglobulin genes, resulting in only background levels of CD19+ IgM− cells (ranging from 1 to 5% of total lymphoid cells; Fig. 5B). Surprisingly, a significant proportion of CD19+ IgM− spleen cells were present in all RAG−/− EμLMP2ABCR+ (5 to 17%) and RAG−/− EμLMP2ABCR− (21 to 24%) samples (compare Fig. 5A and B). Interestingly, a majority of the RAG−/− EμLMP2A+ spleen cells exhibited a higher level of expression of CD19 than littermate RAG−/− EμLMP2A− animals (compare Fig. 5A and B). Flow cytometry analysis of bone marrow B-cell populations was performed to delineate the extent and temporal onset of the LMP2A survival signal among all EμLMP2A transgenic lines.
FIG. 5.
CD19 and IgM expression on RAG−/− EμLMP2A+ spleen cells. Single cell suspensions from spleens were prepared and stained with CD19 and IgM antibodies for flow cytometry. The mouse genotypes are indicated. Boxes represent CD19+ IgM− populations and are specific for littermate-matched animals. The percentage of lymphocytes expressing CD19 are indicated for specific populations. Because littermate-matched sets of EμLMP2A were analyzed separately by genotype, data from littermate-matched RAG−/− EμLMP2A (A) and RAG−/− (B) animals are shown. These data are representative of at least three separate experiments.
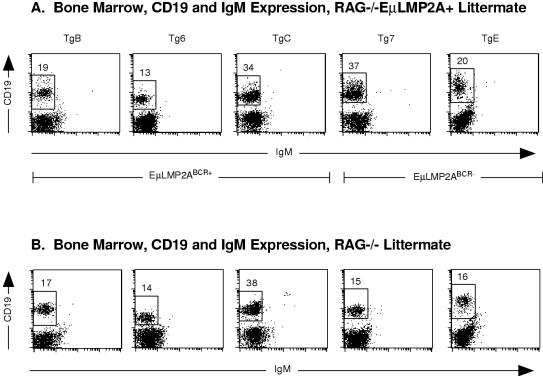
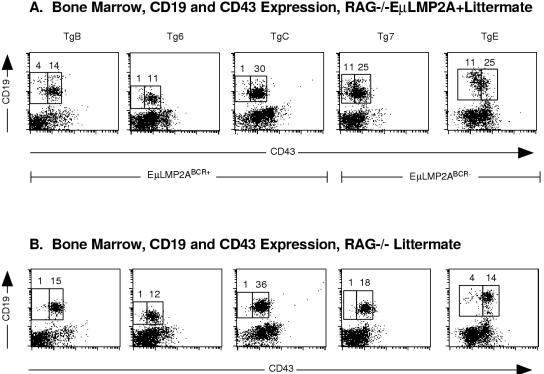
As had been previously shown for RAG−/− TgE+ animals (5), bone marrow samples from the previously uncharacterized RAG−/− Tg7+ genotype revealed an increase in CD19+ IgM− cells compared to RAG−/− littermate animals (compare Fig. 6A and B). However, LMP2A expression resulted in no significant differences in the proportion of CD19+ IgM− cells in any of the RAG−/− EμLMP2ABCR+ animals (compare Fig. 6A and B). Experiments with RAG−/− TgE animals have shown that LMP2A was able to drive the progression of bone marrow B cells from a CD43+ to a CD43− state (5). Significant numbers of primordial B cells from the previously uncharacterized RAG−/− Tg7+ animal are also able to transit from the CD43+ to the CD43− state, unlike littermate RAG−/− control animals (compare Fig. 7A and B). By comparison, the proportion of CD43+ and CD43− B cells in the EμLMP2ABCR+ animals was not significantly different from littermate RAG−/− control animals (compare Fig. 7A and B).
FIG. 6.
CD19 and IgM expression on RAG−/− EμLMP2A+ bone marrow samples. Single cell suspensions from all transgenic bone marrow samples were prepared and stained with CD19 and IgM antibodies for flow cytometry. The mouse genotypes are indicated. Boxes represent CD19+ IgM− populations and are specific for littermate-matched animals. The percentage of lymphocytes expressing CD19 are indicated for specific populations. Because littermate-matched sets of EμLMP2A were analyzed separately by genotype, data from littermate-matched RAG−/− EμLMP2A (A) and RAG−/− (B) animals are shown. These data are representative of at least three separate experiments.
FIG. 7.
CD19 and CD43 expression in RAG−/− EμLMP2A+ bone marrow samples. Single cell suspensions from all transgenic bone marrow samples were prepared and stained with CD19 and CD43 antibodies for flow cytometry. The mouse genotypes are indicated. Boxes represent CD19+ CD43− and CD19+ CD43+ populations and are specific for littermate-matched animals. The percentage of lymphocytes expressing CD19 and CD43 are indicated for specific populations. Because littermate-matched sets of EμLMP2A were analyzed separately by genotype, data from littermate-matched RAG−/− EμLMP2A (A) and RAG−/− (B) animals are shown. These data are representative of at least three separate experiments.
The preceding set of RAG breeding experiments indicate two critical points about this set of EμLMP2A transgenic mice. First, the previously characterized LMP2A survival signal described in RAG−/− TgE+ bone marrow cells has been recapitulated in another unique EμLMP2ABCR− genetic background, namely, RAG−/− Tg7+ animals. Second, and perhaps more importantly, although LMP2A expression does not produce detectable alterations of B-cell development in RAG+/+ EμLMP2ABCR+ bone marrow cells (TgB, Tg6, and TgC), transgene expression in these animals is sufficient to drive B-cell development in RAG−/− EμLMP2ABCR+ bone marrow cells, allowing RAG−/− EμLMP2ABCR+ B cells to survive in splenic tissues despite the lack of surface BCR expression.
LMP2A drives B-cell survival during IL-7 in vitro culture.
To determine if the CD43− cells present in transgenic bone marrow would proliferate in response to interleukin-7 (IL-7), in vitro bone marrow cultures were established for each EμLMP2A genotype. Primordial B cells are responsive to the growth and differentiation inducing properties of IL-7 only after rearranging immunoglobulin HC genes, expressing a functional preBCR, and transiting from a CD43+ proB cell to a CD43− preB cell (9, 45). For the following in vitro experiments, littermate-matched sets of wild-type (RAG+/+ or RAG+/−), EμLMP2A transgene only (RAG+/+ Tg+ or RAG+/− Tg+), RAG null (RAG−/−), and RAG−/− EμLMP2A animals were analyzed simultaneously to control for experimental variation.
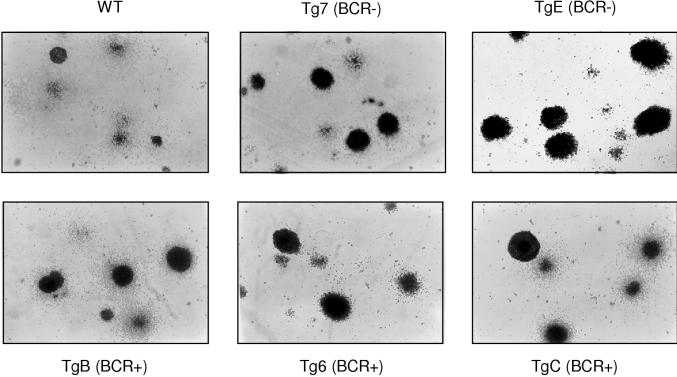
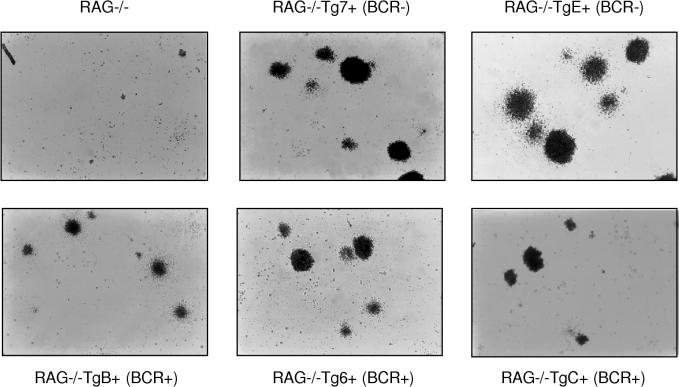
After 1 week of growth in IL-7-stimulated culture, individual wild-type bone marrow B cells formed microscopically detectable foci of proliferating cells (Fig. 8). All EμLMP2A transgene only bone marrow B cells were able to proliferate and form colonies when cultured in IL-7-containing methylcellulose medium (Fig. 8). There were no significant differences in the number of total colonies identified in either wild-type or EμLMP2A cultures. However, the EμLMP2A colonies were generally larger and denser than the wild-type colonies, regardless of the EμLMP2A genotype (Fig. 8). By comparison, the growth properties of RAG−/− EμLMP2A cells were significantly different from those of the RAG-null animals (Fig. 9). RAG-null cells do not develop to a stage responsive to IL-7 and therefore do not survive or proliferate under these culture conditions. Although all RAG−/− EμLMP2A cells grew in response to IL-7 stimulation, the RAG−/− EμLMP2ABCR− cells formed colonies of greater size than RAG−/− EμLMP2ABCR+ cells (Fig. 9). These data further support the hypothesis that LMP2A expression in two different classes of EμLMP2A transgenic mice is sufficient to provide a survival signal to RAG−/− bone marrow cells. No bone marrow cells, regardless of transgene or RAG genotype, grew in methylcellulose cultures prepared in the absence of IL-7 (data not shown). Therefore, the extent to which LMP2A can provide a developmental signal to RAG−/− bone marrow cells relies upon the cooperative stimulation of both IL-7- and LMP2A-dependent signaling pathways.
FIG. 8.
Photomicrographs of IL-7 methylcellulose cultured EμLMP2A bone marrow cells. A total of 106 bone marrow cells from the indicated EμLMP2A and wild-type genotypes were incubated in 3 ml of IL-7-containing methylcellulose medium for 7 days. Cell morphologies were photographed under ×40 magnification. The EμLMP2ABCR− (BCR−) and EμLMP2ABCR+ (BCR+) designations are indicated.
FIG. 9.
Photomicrographs of IL-7 methylcellulose cultured RAG−/− EμLMP2A+ bone marrow cells. A total of 106 bone marrow cells from the indicated genotypes were incubated in 3 ml of IL-7-containing methylcellulose medium for 7 days. Cell morphologies were photographed under ×40 magnification. The EμLMP2ABCR− (BCR−) and EμLMP2ABCR+ (BCR+) designations are indicated.
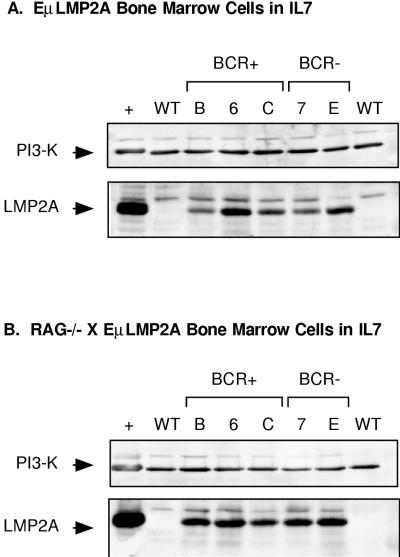
All IL-7-cultured samples were examined by immunoblot analysis to determine if the in vitro selection of B cells would reveal significant differences in LMP2A protein expression between transgenic lines. LMP2A expression was readily detectable in all EμLMP2A samples, regardless of the RAG genotype (Fig. 10). Relatively equal amounts of the p85 subunit of PI3 kinase were detected in all samples, indicating roughly equal loading of protein lysate in all samples. A nonspecific band was present in all samples, regardless of the genotype. Although suggestive, the differences in LMP2A expression between different genotypes were not reproducible by repeated immunoblot analysis.
FIG. 10.
Immunoblot detection of LMP2A expression in IL-7-cultured transgenic bone marrow cells. Cell lysates from 106 cell equivalents from IL-7-cultured bone marrow cells were prepared for LMP2A immunoblot analysis as previously described. Samples were obtained from EμLMP2A transgene only (A) and RAG−/− EμLMP2A+ (B) bone marrow cultures. EμLMP2ABCR− (BCR−) and EμLMP2ABCR+ (BCR+) genotypes are indicated. NP-40 soluble lysate from 2.5 × 10⁶ LCL10 cell equivalents was used as a positive control (+) for LMP2A expression. The diagnostic bands for the p85 subunit of PI3 kinase (PI3-K, 85 kDa) and LMP2A (45 kDa) are indicated.
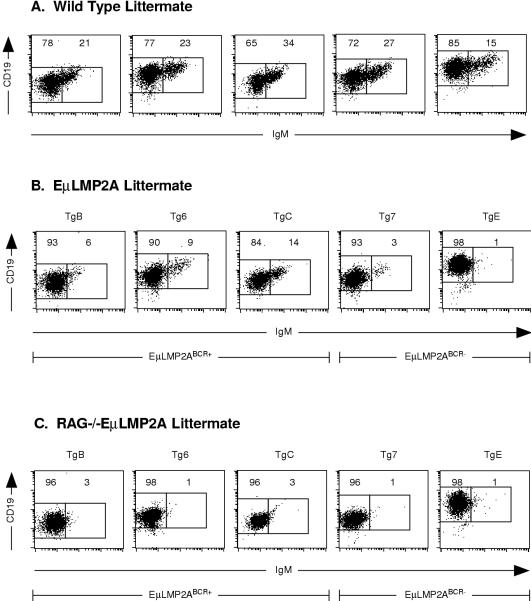
All bone marrow cultures were examined by flow cytometry to determine whether IL-7 and LMP2A stimulation cooperatively alter the expression of developmentally regulated B-cell surface markers. CD43+ proB cells and CD43− preB cells were not discernible from these cultures since all samples expressed similarly low levels of CD43 (data not shown). All EμLMP2A-only bone marrow cells recovered from methylcellulose express CD19 at levels comparable to those of the wild-type littermate controls (compare Fig. 11). As predicted by the analysis of primary bone marrow samples, both the Tg7- and the TgE-only samples showed a marked reduction in the proportion of IgM+ cells compared to the wild-type littermate controls (compare 1 to 3% for EμLMP2ABCR− versus 15 to 27% for littermate wild type; Fig. 11). Surprisingly, all of the EμLMP2ABCR+ bone marrow IL-7 cultures also showed a dramatic reduction in the proportion of IgM+ cells compared to the wild-type littermate controls (compare 6 to 14% for EμLMP2ABCR+ versus 21 to 34% for littermate wild type; Fig. 11). This decrease in EμLMP2ABCR+ CD19+ IgM+ cells was not appreciated from previous analysis of primary bone marrow samples (compare Fig. 4A and 11B). Therefore, by selecting for only B-lineage cells from the myriad primary bone marrow cell types, the IL-7 methylcellulose culture system reveals the previously masked EμLMP2ABCR+ phenotype. Alternatively, this phenotypic difference may be the result of in vitro-induced upregulated expression of LMP2A in all EμLMP2A genotypes.
FIG. 11.
Flow cytometry analysis of IL-7 methylcellulose cultures. Data from littermate genotype-matched sets of wild-type (A), RAG−/− EμLMP2A+ (B) and RAG−/− (C) animals are shown. A total of 106 IL-7-cultured bone marrow cells from the indicated genotypes were analyzed for CD19, CD43, and IgM expression by flow cytometry as described in the text. Boxes are specific for littermate-matched animals and represent CD19+ IgM− and CD19+ IgM+ populations as delineated by wild-type littermate-matched animals. The percentage of total lymphocytes expressing the indicated surface markers are indicated for specific populations. These data are representative of at least three separate experiments.
DISCUSSION
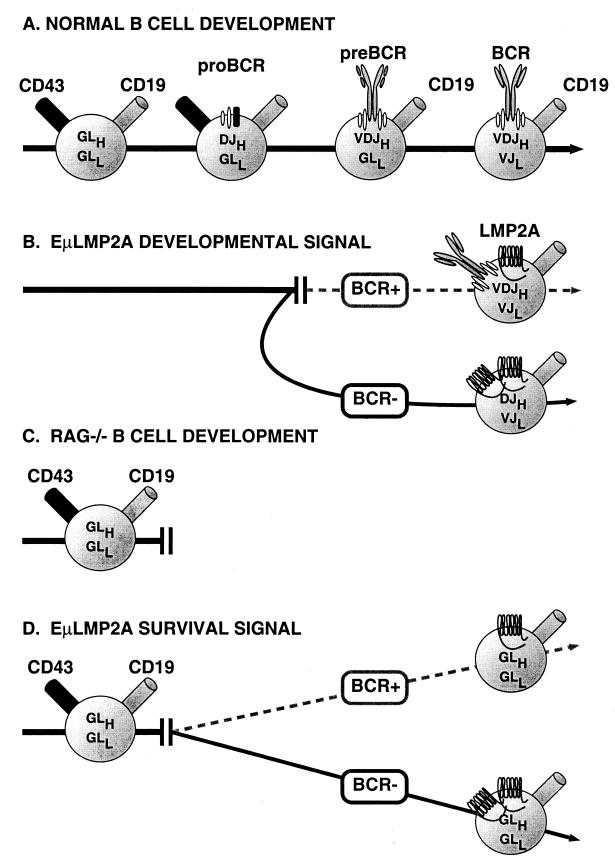
The level of LMP2A mRNA detected in bone marrow cells by the Taqman assay correlates with the severity of the transgenic B-cell phenotype. These data, however, are only suggestive and do not preclude a phenotypic effect based upon differences in EμLMP2A temporal expression during B-cell development. Additionally, mRNA transcription levels may not directly reflect protein translation levels. Considering these parameters, transgene expression in EμLMP2ABCR− mice is able to alter normal B-cell development by allowing the bypass of V-to-DJH recombination in bone marrow cells. LMP2A is also able to provide a developmental and survival signal to these same cells, resulting in immunoglobulin LC gene rearrangement and survival of BCR-negative cells in the peripheral lymphoid organs (Fig. 12A). Relatively lower levels of transgene expression in EμLMP2ABCR+ mice are insufficient to significantly alter B-cell development (Fig. 12B). These data suggest that a threshold level of LMP2A expression may be required for altering normal B-cell development in a wild-type genetic background. At levels below this threshold amount, normal B-cell signaling processes would be able to control B-cell development. In developing or mature T cells, even high-level expression of LMP2A seems to have little effect on their development or function as measured in vitro. This suggests that although T and B cells share common signal transduction features through their respective antigen receptors, there may be B-cell-specific factors that are important for LMP2A function in B cells. The significance of this observation for EBV-related T-cell pathologies will need to be determined.
FIG. 12.
Schematic representation of EμLMP2A altered bone marrow B-cell development. (A) Normal murine B-cell development can be divided into defined steps based upon the coordinated expression of various B-cell markers and immunoglobulin gene rearrangements. (B) LMP2A expression redirects normal murine B-cell development in a wild-type genetic background. EμLMP2ABCR+ mice express relatively lower levels of LMP2A, which are insufficient to significantly alter normal B-cell development. EμLMP2ABCR− animals express enough LMP2A to alter B-cell development. The EμLMP2ABCR− phenotype can be defined by the accumulation of DJH+ VDJH− VJK+ CD43− preB cells in the bone marrow, which subsequently colonize peripheral organs. (C) Murine B-cell development in a RAG−/− genetic background. RAG is responsible for immunoglobulin gene-specific DNA recombination. B-cell development in RAG−/− mice is blocked at the proB-cell stage. (D) B-cell development in RAG−/− EμLMP2A+ animals. All EμLMP2A transgenes are able to provide a survival signal to RAG−/− proB cells. BCR null RAG−/− EμLMP2A+ primordial B cells survive in the bone marrow and colonize peripheral lymphoid organs. These peripheral RAG−/− EμLMP2A+ cells are CD19+ CD43− with immunoglobulin genes in a germ line configuration. EμLMP2ABCR− transgenes are able to provide a more efficient survival signal than EμLMP2ABCR+ transgenes.
The extent to which LMP2A can drive RAG−/− B-cell development and survival also correlates with transgene expression level. Even relatively low levels of LMP2A expression provide a proportional survival signal which allows BCR-negative RAG−/− EμLMP2A+ B cells to survive in peripheral lymphoid tissues, whereas RAG−/− cells are otherwise deleted (Fig. 12C and D). This phenotype is even more pronounced in RAG−/− EμLMP2ABCR− B cells. Bone marrow B-cell progenitors from both the RAG−/− EμLMP2ABCR− and RAG−/− EμLMP2ABCR+ animals are able to respond to IL-7-specific stimuli in vitro, suggesting that these cells can also respond to developmental signals from the bone marrow microenvironment in vivo. Comparatively higher levels of LMP2A expression exaggerate this phenotype, allowing even greater numbers of receptorless cells to survive. Again, these data do not preclude an alternative hypothesis that relative developmental time of LMP2A expression may also affect the EμLMP2A phenotype. LMP2A expression in early stages of B-cell development is presently being examined by flow cytometry analysis. The fact that both EμLMP2ABCR+ and EμLMP2ABCR− animals exhibit the same B-cell survival phenotype in a RAG−/− background suggests that LMP2A must provide a transgene specific effect very early in B-cell development, prior to the onset of immunoglobulin gene rearrangement.
When expressed in a wild-type murine background, the EμLMP2ABCR− phenotype can be defined by altered preB-cell development, resulting in DJH+ VDJH− VJK+ CD43− preB cells accumulating in the bone marrow which subsequently colonize peripheral organs. The exact molecular features of LMP2A responsible for this phenotype are not clearly defined. Several murine genetic systems have defined the molecular basis of the proB-to-preB cell developmental transition in wild-type animals. Of particular note is research focusing on the immunoglobulin alpha (Igα/CD79α) and Igβ (CD79β) ITAM domains, the signaling components of the preBCR. The surface-bound immunoglobulin portion of the preBCR must bind the Igα-Igβ heterodimers in order to promote the preB-to-proB transition (43). Although neither the extracellular IgM domains nor Igα are essential for the preB-to-preB transition (18, 44, 47), deletion of Igβ blocks this transition (13). Interestingly, Igβ−/− CD43− proB cells perform D-to-JH gene rearrangements but cannot perform the subsequent V-to-DJH rearrangements (13, 39). The developmentally arrested CD43+ preB cells in EμLMP2ABCR− mice have an identical DJH (but not VDJH) gene arrangement. Transgene complementation of the RAG mutation by a chimeric mμ-Igβ fusion (extracellular IgM fused to cytoplasmic Igβ) is sufficient to drive RAG null CD43+ proB cells to the CD43− preB-cell stage (39). Site-directed mutation of the mμ-Igβ ITAM domain abolishes the complementation activity (39). EμLMP2A is also able to complement the RAG null arrested proB cells. However, unlike RAG−/− mμ-Igβ preB cells, RAG−/− EμLMP2A+ preB cells survive in peripheral organs. Therefore, EμLMP2A provides an additional survival signal, perhaps by recruiting Syk PTK to the LMP2A ITAM domain (3, 11, 24, 31).
When compared to EμLMP2ABCR− animals, the EμLMP2ABCR+ animals are unable to significantly alter wild-type B-cell development. At first glance, the only remarkable aspect of these animals is their ability to promote B-cell survival in a RAG−/− background. However, this inconspicuous LMP2A function may be the key to understanding LMP2A function during EBV latency in humans. Recently described experiments utilizing Cre loxP-mediated deletion of mature BCR reveal that constant BCR stimulation is required to maintain peripheral B-cell survival (20). LMP2A may provide antiapoptotic signals to peripheral human B cells harboring latent EBV. This would be particularly important if signaling through the BCR is blocked by LMP2A, as observed in EBV-transformed LCLs grown in tissue culture. By fractionation of B cells from EBV-positive humans, EBV is found in the BCR-positive memory cell fraction (1, 34, 35). If LMP2A is expressed in these cells at anytime during their lifetime, they would require another signal to prevent apoptosis. LMP2A could provide this signal. This LMP2A-specific function was unappreciated in in vitro studies of EBV latency since LMP1 expression in LCLs promotes B-cell growth and survival by inducing the expression of antiapoptosis proteins (17). Another complicating factor when studying in vitro latency is that LCLs express all nine latent proteins, whereas only LMP2A and EBNA1 are expressed during in vivo latency. In vivo immune pressures may also select for low-level LMP2A expression in latently infected cells inasmuch as LMP2A-specific cytotoxic T cells can be isolated from healthy latently infected individuals (16, 22, 41).
From these studies and others, it is now apparent that LMP2A may play multiple roles in the persistence of EBV in the human host. Our previous studies indicate LMP2A blocks normal BCR signal transduction in EBV latently infected LCLs grown in culture. This block in BCR signal transduction prevents switch from latent to lytic replication following BCR activation in EBV-transformed LCLs grown in tissue culture (31, 32). These in vitro observations suggested that the in vivo role of LMP2A in latent EBV infection may be to prevent activation of lytic EBV replication by BCR-mediated signal transduction (26, 31, 32). This LMP2A function would be important in preventing lytic replication in latently infected lymphocytes as they circulate in the peripheral blood, bone marrow, or lymphatic tissues, where they might encounter antigens, superantigens, or other ligands which could engage BCRs and activate EBV lytic replication. Related to the downmodulation of BCR signal transduction, LMP2A may also be important in maintaining EBV-infected lymphocytes in an inactivated state, thereby providing poor targets for cytotoxic T cells specific for LMP2A.
The data presented herein illustrate that LMP2A can provide a survival signal to developing and peripheral B cells in two different groups of EμLMP2A transgenic animals. As evidence by the EμLMP2ABCR+ lines, LMP2A can provide this survival signal without significantly altering normal B-cell development. This LMP2A survival signal, coupled with the ability to block BCR signal transduction, could be particularly important for the persistence of EBV in the human host in BCR-positive cells by preventing activation of lytic replication and providing long-term B-cell survival without the necessity for normal BCR signal transduction. This potential LMP2A function in vivo was not fully appreciated from earlier LMP2A transgenic animals. Further research with the LMP2A transgenic mice will elucidate the unique effects LMP2A has on normal B-cell biology and the role of LMP2A in EBV persistence in the human host.
ACKNOWLEDGMENTS
R.L. is supported by Public Health Service grants CA62234 and CA73507 from the National Cancer Institute and DE13127 from the National Institute of Dental and Craniofacial Research. R.L. is a Scholar of the Leukemia Society of America.
We thank Mark Merchant, Peter Pertel, and Steve Anderson for their contributions to the manuscript. We also thank the faculty of the Great Lakes Regional Center for Aids Research for their technological assistance.
REFERENCES
- 1.Babcock G J, Decker L L, Volk M, Thorley-Lawson D A. EBV persistence in memory B cells in vivo. Immunity. 1998;9:395–404. doi: 10.1016/s1074-7613(00)80622-6. [DOI] [PubMed] [Google Scholar]
- 2.Brooks L, Yao Q Y, Rickinson A B, Young L S. Epstein-Barr virus latent gene transcription in nasopharyngeal carcinoma cells: coexpression of EBNA1, LMP1, and LMP2 transcripts. J Virol. 1992;66:2689–2697. doi: 10.1128/jvi.66.5.2689-2697.1992. [DOI] [PMC free article] [PubMed] [Google Scholar]
- 3.Burkhardt A L, Bolen J B, Kieff E, Longnecker R. An Epstein-Barr virus transformation-associated membrane protein interacts with Src family tyrosine kinases. J Virol. 1992;66:5161–5167. doi: 10.1128/jvi.66.8.5161-5167.1992. [DOI] [PMC free article] [PubMed] [Google Scholar]
- 4.Busson P, McCoy R, Sadler R, Gilligan K, Tursz T, Raab-Traub N. Consistent transcription of the Epstein-Barr virus LMP2 gene in nasopharyngeal carcinoma. J Virol. 1992;66:3257–3262. doi: 10.1128/jvi.66.5.3257-3262.1992. [DOI] [PMC free article] [PubMed] [Google Scholar]
- 5.Caldwell R G, Wilson J B, Anderson S J, Longnecker R. Epstein-Barr virus LMP2A drives B cell development and survival in the absence of normal B cell receptor signals. Immunity. 1998;9:405–411. doi: 10.1016/s1074-7613(00)80623-8. [DOI] [PubMed] [Google Scholar]
- 6.Chen F, Zou J Z, di Renzo L, Winberg G, Hu L F, Klein E, Klein G, Ernberg I. A subpopulation of normal B cells latently infected with Epstein-Barr virus resembles Burkitt lymphoma cells in expressing EBNA-1 but not EBNA-2 or LMP1. J Virol. 1995;69:3752–3758. doi: 10.1128/jvi.69.6.3752-3758.1995. [DOI] [PMC free article] [PubMed] [Google Scholar]
- 7.Deacon E M, Pallesen G, Niedobitek G, Crocker J, Brooks L, Rickinson A B, Young L S. Epstein-Barr virus and Hodgkin's disease: transcriptional analysis of virus latency in the malignant cells. J Exp Med. 1993;177:339–349. doi: 10.1084/jem.177.2.339. [DOI] [PMC free article] [PubMed] [Google Scholar]
- 8.Decker L L, Klaman L D, Thorley Lawson D A. Detection of the latent form of Epstein-Barr virus DNA in the peripheral blood of healthy individuals. J Virol. 1996;70:3286–3289. doi: 10.1128/jvi.70.5.3286-3289.1996. [DOI] [PMC free article] [PubMed] [Google Scholar]
- 9.Era T, Ogawa M, Nishikawa S, Okamoto M, Honjo T, Akagi K, Miyazaki J, Yamamura K. Differentiation of growth signal requirement of B lymphocyte precursor is directed by expression of immunoglobulin. EMBO J. 1991;10:337–342. doi: 10.1002/j.1460-2075.1991.tb07954.x. [DOI] [PMC free article] [PubMed] [Google Scholar]
- 10.Fruehling S, Caldwell R, Longnecker R. LMP2 function in EBV latency. EBV Rep. 1997;4:151–159. [Google Scholar]
- 11.Fruehling S, Longnecker R. The immunoreceptor tyrosine-based activation motif of Epstein-Barr virus LMP2A is essential for blocking BCR-mediated signal transduction. Virology. 1997;235:241–251. doi: 10.1006/viro.1997.8690. [DOI] [PubMed] [Google Scholar]
- 12.Fruehling S, Swart R, Dolwick K M, Kremmer E, Longnecker R. Tyrosine 112 of latent membrane protein 2A is essential for protein tyrosine kinase loading and regulation of Epstein-Barr virus latency. J Virol. 1998;72:7796–7806. doi: 10.1128/jvi.72.10.7796-7806.1998. [DOI] [PMC free article] [PubMed] [Google Scholar]
- 13.Gong S, Nussenzweig M C. Regulation of an early developmental checkpoint in the B cell pathway by Ig beta. Science. 1996;272:411–414. doi: 10.1126/science.272.5260.411. [DOI] [PubMed] [Google Scholar]
- 14.Hardy R R, Carmack C E, Shinton S A, Kemp J D, Hayakawa K. Resolution and characterization of pro-B and pre-pro-B cell stages in normal mouse bone marrow. J Exp Med. 1991;173:1213–1225. doi: 10.1084/jem.173.5.1213. [DOI] [PMC free article] [PubMed] [Google Scholar]
- 15.Khan G, Miyashita E M, Yang B, Babcock G J, Thorley-Lawson D A. Is EBV persistence in vivo a model for B cell homeostasis? Immunity. 1996;5:173–179. doi: 10.1016/s1074-7613(00)80493-8. [DOI] [PubMed] [Google Scholar]
- 16.Khanna R, Burrows S R, Kurilla M G, Jacob C A, Misko I S, Sculley T B, Kieff E, Moss D J. Localization of Epstein-Barr virus cytotoxic T cell epitopes using recombinant vaccinia: implications for vaccine development. J Exp Med. 1992;176:169–176. doi: 10.1084/jem.176.1.169. [DOI] [PMC free article] [PubMed] [Google Scholar]
- 17.Kieff E. Epstein-Barr virus and its replication. In: Fields B N, Knipe D M, Howley P M, editors. Fundamental virology. Philadelphia, Pa: Lippincott-Raven Publishers; 1996. pp. 1109–1162. [Google Scholar]
- 18.Kitamura D, Roes J, Kuhn R, Rajewsky K. A B cell-deficient mouse by targeted disruption of the membrane exon of the immunoglobulin μ chain gene. Nature. 1991;350:423–426. doi: 10.1038/350423a0. [DOI] [PubMed] [Google Scholar]
- 19.Kulwichit W, Edwards R H, Davenport E M, Baskar J F, Godfrey V, Raab-Traub N. Expression of the Epstein-Barr virus latent membrane protein 1 induces B cell lymphoma in transgenic mice. Proc Natl Acad Sci USA. 1998;95:11963–11968. doi: 10.1073/pnas.95.20.11963. [DOI] [PMC free article] [PubMed] [Google Scholar]
- 20.Lam K, Kuhn R, Rajewsky K. In vivo ablation of surface immunoglobulin on mature B cells by inducible gene targeting results in rapid cell death. Cell. 1997;90:1073–1083. doi: 10.1016/s0092-8674(00)80373-6. [DOI] [PubMed] [Google Scholar]
- 21.Lam K M, Syed N, Whittle H, Crawford D H. Circulating Epstein-Barr virus-carrying B cells in acute malaria. Lancet. 1991;337:876–878. doi: 10.1016/0140-6736(91)90203-2. [DOI] [PubMed] [Google Scholar]
- 22.Lee S P, Tierney R J, Thomas W A, Brooks J M, Rickinson A. Conserved CTL epitopes within EBV latent membrane protein 2: a potential target for CTL-based tumor therapy. J Immunol. 1997;158:3325–3334. [PubMed] [Google Scholar]
- 23.Lewin N, Aman P, Masucci M G, Klein E, Klein G, Oberg B, Strander H, Henle W, Henle G. Characterization of EBV-carrying B-cell populations in healthy seropositive individuals with regard to density, release of transforming virus and spontaneous outgrowth. Int J Cancer. 1987;39:472–476. doi: 10.1002/ijc.2910390411. [DOI] [PubMed] [Google Scholar]
- 24.Longnecker R, Druker B, Roberts T M, Kieff E. An Epstein-Barr virus protein associated with cell growth transformation interacts with a tyrosine kinase. J Virol. 1991;65:3681–3692. doi: 10.1128/jvi.65.7.3681-3692.1991. [DOI] [PMC free article] [PubMed] [Google Scholar]
- 25.Longnecker R, Kieff E. A second Epstein-Barr virus membrane protein (LMP2) is expressed in latent infection and colocalizes with LMP1. J Virol. 1990;64:2319–2326. doi: 10.1128/jvi.64.5.2319-2326.1990. [DOI] [PMC free article] [PubMed] [Google Scholar]
- 26.Longnecker R, Miller C L. Regulation of Epstein-Barr virus latency by latent membrane protein 2. Trends Microbiol. 1996;4:38–42. doi: 10.1016/0966-842x(96)81504-6. [DOI] [PubMed] [Google Scholar]
- 27.Longnecker R, Miller C L, Miao X Q, Marchini A, Kieff E. The only domain which distinguishes Epstein-Barr virus latent membrane protein 2A (LMP2A) from LMP2B is dispensable for lymphocyte infection and growth transformation in vitro; LMP2A is therefore nonessential. J Virol. 1992;66:6461–6469. doi: 10.1128/jvi.66.11.6461-6469.1992. [DOI] [PMC free article] [PubMed] [Google Scholar]
- 28.Longnecker R, Miller C L, Miao X Q, Tomkinson B, Kieff E. The last seven transmembrane and carboxy-terminal cytoplasmic domains of Epstein-Barr virus latent membrane protein 2 (LMP2) are dispensable for lymphocyte infection and growth transformation in vitro. J Virol. 1993;67:2006–2013. doi: 10.1128/jvi.67.4.2006-2013.1993. [DOI] [PMC free article] [PubMed] [Google Scholar]
- 29.Longnecker R, Miller C L, Tomkinson B, Miao X Q, Kieff E. Deletion of DNA encoding the first five transmembrane domains of Epstein-Barr virus latent membrane proteins 2A and 2B. J Virol. 1993;67:5068–5074. doi: 10.1128/jvi.67.8.5068-5074.1993. [DOI] [PMC free article] [PubMed] [Google Scholar]
- 30.Longo N, Berninger H S, Hartley J L. Use of uracil DNA glycosylase to control carry-over contamination in polymerase chain reactions. Gene. 1990;93:125–128. doi: 10.1016/0378-1119(90)90145-h. [DOI] [PubMed] [Google Scholar]
- 31.Miller C L, Burkhardt A L, Lee J H, Stealey B, Longnecker R, Bolen J B, Kieff E. Integral membrane protein 2 of Epstein-Barr virus regulates reactivation from latency through dominant negative effects on protein-tyrosine kinases. Immunity. 1995;2:155–166. doi: 10.1016/s1074-7613(95)80040-9. [DOI] [PubMed] [Google Scholar]
- 32.Miller C L, Lee J H, Kieff E, Longnecker R. An integral membrane protein (LMP2) blocks reactivation of Epstein-Barr virus from latency following surface immunoglobulin crosslinking. Proc Natl Acad Sci USA. 1994;91:772–776. doi: 10.1073/pnas.91.2.772. [DOI] [PMC free article] [PubMed] [Google Scholar]
- 33.Miller C L, Longnecker R, Kieff E. Epstein-Barr virus latent membrane protein 2A blocks calcium mobilization in B lymphocytes. J Virol. 1993;67:3087–3094. doi: 10.1128/jvi.67.6.3087-3094.1993. [DOI] [PMC free article] [PubMed] [Google Scholar]
- 34.Miyashita E M, Yang B, Babcock G J, Thorley-Lawson D A. Identification of the site of Epstein-Barr virus persistence in vivo as a resting B cell. J Virol. 1997;71:4882–4891. doi: 10.1128/jvi.71.7.4882-4891.1997. [DOI] [PMC free article] [PubMed] [Google Scholar]
- 35.Miyashita E M, Yang B, Lam K M, Crawford D H, Thorley-Lawson D A. A novel form of Epstein-Barr virus latency in normal B cells in vivo. Cell. 1995;80:593–601. doi: 10.1016/0092-8674(95)90513-8. [DOI] [PubMed] [Google Scholar]
- 36.Murray P G, Constandinou C M, Crocker J, Young L S, Ambinder R F. Analysis of major histocompatibility complex class I, TAP expression, and LMP2 epitope sequence in Epstein-Barr virus-positive Hodgkin's disease. Blood. 1998;92:2477–2483. [PubMed] [Google Scholar]
- 37.Niedobitek G, Kremmer E, Herbst H, Whitehead L, Dawson C W, Niedobitek E, von Ostau C, Rooney N, Grasser F A, Young L S. Immunohistochemical detection of the Epstein-Barr virus-encoded latent membrane protein 2A in Hodgkin's disease and infectious mononucleosis. Blood. 1997;90:1664–1672. [PubMed] [Google Scholar]
- 38.Panousis C G, Rowe D T. Epstein-Barr virus latent membrane protein 2 associates with and is a substrate for mitogen-activated protein kinase. J Virol. 1997;71:4752–4760. doi: 10.1128/jvi.71.6.4752-4760.1997. [DOI] [PMC free article] [PubMed] [Google Scholar]
- 39.Papavasiliou F, Misulovin Z, Suh H, Nussenzweig M C. The role of Ig beta in precursor B cell transition and allelic exclusion. Science. 1995;268:408–411. doi: 10.1126/science.7716544. [DOI] [PubMed] [Google Scholar]
- 40.Qu L, Rowe D T. Epstein-Barr virus latent gene expression in uncultured peripheral blood lymphocytes. J Virol. 1992;66:3715–3724. doi: 10.1128/jvi.66.6.3715-3724.1992. [DOI] [PMC free article] [PubMed] [Google Scholar]
- 41.Redchenko I V, Rickinson A B. Accessing Epstein-Barr virus-specific T-cell memory with peptide-loaded dendritic cells. J Virol. 1999;73:334–342. doi: 10.1128/jvi.73.1.334-342.1999. [DOI] [PMC free article] [PubMed] [Google Scholar]
- 42.Sample J, Liebowitz D, Kieff E. Two related Epstein-Barr virus membrane proteins are encoded by separate genes. J Virol. 1989;63:933–937. doi: 10.1128/jvi.63.2.933-937.1989. [DOI] [PMC free article] [PubMed] [Google Scholar]
- 43.Sanchez M, Misulovin Z, Burkhardt A L, Mahajan S, Costa T, Franke R, Bolen J B, Nussenzweig M. Signal transduction by immunoglobulin is mediated through Ig alpha and Ig beta. J Exp Med. 1993;178:1049–1055. doi: 10.1084/jem.178.3.1049. [DOI] [PMC free article] [PubMed] [Google Scholar]
- 44.Shaffer A L, Schlissel M S. A truncated heavy chain protein relieves the requirement for surrogate light chains in early B cell development. J Immunol. 1997;159:1265–1275. [PubMed] [Google Scholar]
- 45.Spanopoulou E, Roman C A J, Corcoran L M, Schlissel M S, Silver D P, Nemazee D, Nussenzweig M C, Shinton S A, Hardy R R, Baltimore D. Functional immunoglobulin transgenes guide ordered B-cell differentiation in Rag-1-deficient mice. Genes Dev. 1994;8:1030–1042. doi: 10.1101/gad.8.9.1030. [DOI] [PubMed] [Google Scholar]
- 46.Tierney R J, Steven N, Young L S, Rickinson A B. Epstein-Barr virus latency in blood mononuclear cells: analysis of viral gene transcription during primary infection and in the carrier state. J Virol. 1994;68:7374–7385. doi: 10.1128/jvi.68.11.7374-7385.1994. [DOI] [PMC free article] [PubMed] [Google Scholar]
- 47.Torres R M, Flaswinkel H, Reth M, Rajewsky K. Aberrant B cell development and immune response in mice with a compromised BCR complex. Science. 1996;272:1804–1808. doi: 10.1126/science.272.5269.1804. [DOI] [PubMed] [Google Scholar]
- 48.Wilson J B, Bell J L, Levine A J. Expression of Epstein-Barr virus nuclear antigen-1 induces B cell neoplasia in transgenic mice. EMBO J. 1996;15:3117–3126. [PMC free article] [PubMed] [Google Scholar]
- 49.Wilson J B, Levine A J. The oncogenic potential of Epstein-Barr virus nuclear antigen 1 in transgenic mice. Curr Top Microbiol Immunol. 1992;182:375–384. doi: 10.1007/978-3-642-77633-5_48. [DOI] [PubMed] [Google Scholar]
- 50.Yao Q Y, Czarnecka H, Rickinson A B. Spontaneous outgrowth of Epstein-Barr virus-positive B-cell lines from circulating human B cells of different buoyant densities. Int J Cancer. 1991;48:253–257. doi: 10.1002/ijc.2910480217. [DOI] [PubMed] [Google Scholar]
- 51.Yao Q Y, Rickinson A B, Epstein M A. A re-examination of the Epstein-Barr virus carrier state in healthy seropositive individuals. Int J Cancer. 1985;35:35–42. doi: 10.1002/ijc.2910350107. [DOI] [PubMed] [Google Scholar]


