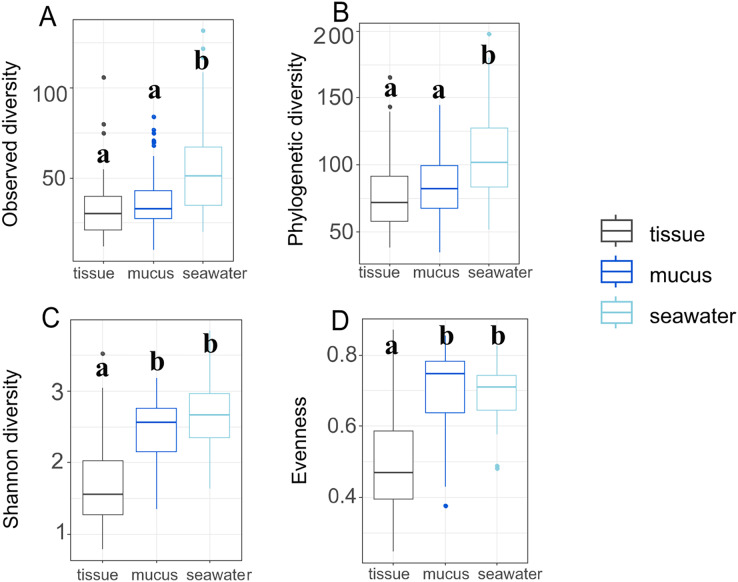
Figure 3. Microbiome diversity and evenness of coral tissues, mucus, and seawater.
Boxplots depict minimum, first and third quartile, maximum, and median for observed diversity (A), phylogenetic diversity (B), Shannon diversity (C), and evenness (D). Statistical groups (a and b) were identified using post-hoc Dunn’s tests.

