Abstract
Considering the cost and invasiveness of monitoring postoperative minimal residual disease (MRD) of colorectal cancer (CRC) after adjuvant chemoradiotherapy (ACT), we developed a favorable approach based on methylated circulating tumor DNA to detect MRD after radical resection. Analyzing the public database, we identified the methylated promoter regions of the genes FGD5, GPC6, and MSC. Using digital polymerase chain reaction (dPCR), we termed the “amplicon of methylated sites using a specific enzyme” assay as “AMUSE.” We examined 180 and 114 pre‐ and postoperative serial plasma samples from 28 recurrent and 19 recurrence‐free pathological stage III CRC patients, respectively. The results showed 22 AMUSE‐positive of 28 recurrent patients (sensitivity, 78.6%) and 17 AMUSE‐negative of 19 recurrence‐free patients (specificity, 89.5%). AMUSE predicted recurrence 208 days before conventional diagnosis using radiological imaging. Regarding ACT evaluation by the reactive response, 19 AMUSE‐positive patients during their second or third blood samples showed a significantly poorer prognosis than the other patients (p = 9E‐04). The AMUSE assay stratified four groups by the altered patterns of tumor burden postoperatively. Interestingly, only 34.8% of cases tested AMUSE‐negative during ACT treatment, indicating eligibility for ACT. The AMUSE assay addresses the clinical need for accurate MRD monitoring with universal applicability, minimal invasiveness, and cost‐effectiveness, thereby enabling the timely detection of recurrences. This assay can effectively evaluate the efficacy of ACT in patients with stage III CRC following curative resection. Our study strongly recommends reevaluating the clinical application of ACT using the AMUSE assay.
Keywords: DNA methylation, drug resistance, gene expression analysis, tumor biomarker
We developed a method called AMUSE, utilizing methylated circulating tumor DNA, to detect minimal residual disease (MRD) in colorectal cancer (CRC) patients after treatment. The AMUSE assay displayed high sensitivity and specificity in predicting cancer recurrence earlier than traditional imaging methods and also evaluated the efficacy of adjuvant chemoradiotherapy in these patients. The study highlights the potential of the AMUSE assay for noninvasive, cost‐effective MRD monitoring and suggests reconsidering chemoradiotherapy application using this method.
Abbreviations
- ACT
adjuvant chemoradiotherapy
- AMUSE
amplicon of methylated sites using a specific enzyme
- CRC
colorectal cancer
- CGP
comprehensive genome profile
- dPCR
digital polymerase chain reaction
- MRD
minimal residual disease
1. INTRODUCTION
Stage III colorectal cancer (CRC) has high prevalence and mortality rates even after curative surgery. 1 , 2 , 3 Adjuvant chemotherapy (ACT) is standard for stage III CRC to enhance outcomes post surgery. Monitoring of minimal residual disease (MRD) is crucial for assessing ACT effectiveness and spotting recurrence. 4 Traditional radiological tools, like CT and MRI, diagnose recurrence. Yet, effective methods to track MRD using serum tumor markers, like carcinoembyonic antigen (CEA) and CA19‐9, are essential. The best technique for liquid biopsy systems, including transcripts and miRNAs in blood exosomes, is still under study. 5 , 6
Cancer genome medicine emerged in 2017. Agents addressing pathogenic targets in tumors can enhance malignancy outcomes. 7 , 8 , 9 Liquid biopsy assays identify genetic anomalies in circulating tumor DNA (ctDNA) in plasma. They help select treatments matching specific genomic deviations, including CDx markers and genome profiling tests. 10 Using CDx, lung cancer patients get a liquid biopsy to detect mutations for optimal drug selection. 11 , 12 Liquid biopsy surpasses traditional tools, like CT and MRI, in early recurrence detection. Regular post‐surgery blood tests prevent misdiagnosis of recurrence. However, frequent MRD monitoring via next‐generation sequencing (NGS) is currently not viable due to costs. This research suggests MRD monitoring with digital PCR, focusing on a universal biomarker.
Epigenetic changes are crucial in cancer diagnosis and treatment. Such alterations, including DNA methylation, affect cancer phenotypes. 13 Given genomic variations, methylated locations are stable, widespread, and specific to tumors. Identifying CRC‐specific methylation sites is pivotal.
Traditional methods face challenges in ctDNA detection due to limited amounts and the need for high detection power. A recent method treats cell‐free DNA (cfDNA) with enzymes to differentiate tumor‐derived ctDNA, measured by digital PCR. This approach, termed the “AMUSE assay,” gauges methylation in ctDNA.
This research pinpointed three CRC‐specific methylation sites. The study evaluated if detecting methylation in minor ctDNA amounts in plasma could monitor MRD postoperatively in stage III CRC patients. Case studies showcased the method's effectiveness.
2. MATERIALS AND METHODS
2.1. Clinical cases
We collected 173 CRC cases with pathological stage IIIa or IIIb 14 CRC and radical surgery (Figure 1A). In the 173 cases, 33 cases experienced recurrence within 2 years, 121 cases remained nonrecurrent, and 19 cases were nonrecurrent after a period exceeding 2 years (Table 1). 3 All patients received standard capecitabine plus oxaliplatin (CAPOX; eight courses in 6 months) 15 as ACT (Figure 1B). Twenty‐eight patients had recurrences within 2 years postoperatively; however, six cases were excluded from the study due to incomplete administration of the CAPOX because of the recurrence within 2 years. Nineteen cases were nonrecurrent longer than 2 years postoperatively.
FIGURE 1.
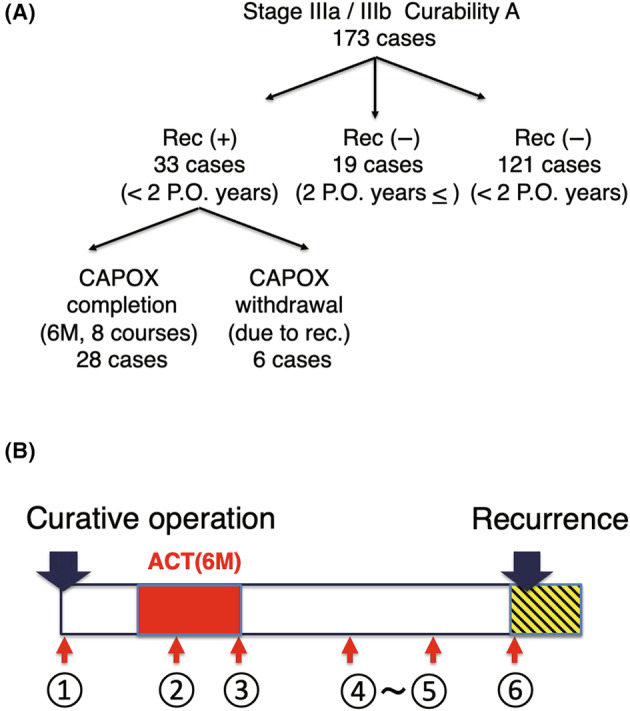
Stage III colorectal cancer (CRC) cases with curative operation analyzed in this study and regimen of adjuvant chemotherapy (ACT) in this study. (A) The chart illustrates the distribution of the 173 stage III CRC cases analyzed after radical surgery. Of these, 33 cases relapsed within 2 years post surgery, and 6 of these were excluded because they could not complete the CAPOX regimen. There are 121 cases that have not relapsed within 2 years and are still under observation. Additionally, there are 19 cases that have been nonrelapsing for over 2 years. (B) Regimen of the current study and timings of blood sampling of the study.
TABLE 1.
Clinicopathologic factors of eligible colorectal cancer cases.
| Sex | |
| Male | 23 |
| Female | 24 |
| Tumor location | |
| Ascending colon | 6 |
| Cecum | 3 |
| Transverse colon | 4 |
| Descending colon | 1 |
| Sigmoid colon | 16 |
| Rectum | 17 |
| Pathologic differentiation | |
| Well‐differentiated adenocarcinoma | 9 |
| Moderately differentiated adenocarcinoma | 34 |
| Poorly differentiated adenocarcinoma | 3 |
| Adenosquamous carcinoma | 1 |
| Depth of invasion | |
| Invading within the submucosal layer (pT1) | 1 |
| Invading within the proper muscle layer (pT2) | 5 |
| Invading within the serosal layer (pT3) | 17 |
| Invading other nearby tissues (pT4) | 24 |
| Lymph vessel permeation | |
| Absent | 6 |
| Present | 41 |
| Vascular vessel permeation | |
| Absent | 12 |
| Present | 35 |
| Lymph node metastasis | |
| pN1 | 35 |
| pN2 | 8 |
| pN3 | 4 |
| Borrman type classification | |
| Type 1 | 1 |
| Type 2 | 42 |
| Type 3 | 3 |
| Pathological stage | |
| Stage IIIa | 35 |
| Stage IIIb | 12 |
| Curability by the operation | |
| Curative operation | 47 |
| Noncurative operation | 0 |
Since April 2011, residual specimens (plasma samples) from all patients with first‐episode CRC undergoing radical resection were prospectively collected and cryopreserved at all blood‐sampling times (regardless of whether the patient had recurred or had received chemotherapy) before and during postoperative follow‐up without omission. A total of 180 blood samples were collected from relapsed patients and extracted preoperatively, postoperatively, during ACT, after ACT, and at the time of relapse. In total, 111 specimens from nonrelapsed patients were collected for analysis.
2.2. Sample preservation and extraction of cfDNA
Transudate plasma samples from the patients were centrifuged at 4°C, 2500 × g for 10 min. The supernatant was aliquoted into 2‐mL tubes and stored in a − 80°C freezer. cfDNA was extracted along with the protocol described elsewhere. 5
2.3. Restriction enzyme treatment of eluted cfDNA
A total of 15 μL of cfDNA was dissolved in 5 μL of pure water as a control. For restriction enzyme treatment, 15 μL of cfDNA, 1 μL of HpaII, 2 μL of 10× loading buffer, and 2 μL of pure water were added. The control and restriction enzyme treatment solutions were placed in a thermal cycler and incubated at 37°C for 1 h to complete the restriction enzyme treatment.
2.4. Sample preparation for digital PCR
Samples were prepared for digital PCR using the two complete solutions. First, a master solution was prepared for mixing the samples. The primers (F and R) and probes targeting FGD5, GPC6, and MSC were used. A total of 6 μL of RnaseP, 6 μL of the probe, 6 μL of each primer (F, R), 4 μL of pure water, and 60 μL of the master mix were mixed. A total of 10.5 μL of the completed solution was dispensed, and 4 μL of each sample's control and a restriction enzyme treatment solution were mixed. Of the completed solution, 14.5 μL was used for digital PCR. The sequences of the primers were as follows: FGD5 primer f, 5′‐CCTTCTCAGCCTTGGCGAG; FGD5 primer r, 5′‐GCGTCTTTCTTCGTCGTGGAA; GPC6 primer f, 5′‐GCGGGCTTTCGGCTTGAG; GPC6 primer r, 5′‐CCAAGAGGGGAAGAATCACAGC; MSC primer f, 5′‐CAGGGCAGGCTGGTCTTGA; MSC primer r, 5′‐AGCAGTCGCAGCGGAACG; FGD5 probe, 5′‐CGCCAGTATCCCACTCGCACGGC; GPC6 probe, 5′‐CCGATCCAAGAAGGCATGGTGCAACATACA; and MSC probe, 5′‐CCTGGAGAAGGCTTTGCTCAGCACGC.
2.5. Methylation‐sensitive restriction enzyme digestion
The eluted cfDNA was split into two tubes: one for restriction enzyme digestion and the other for the control without the enzyme. A reaction mixture (20 μL) containing 15 μL cfDNA, 1 μL HpaII (10 units/μL) (Takara Bio), and 1 μL L buffer (10×) (Takara Bio) was prepared and incubated at 37°C for 1 h. Control samples were prepared by diluting 15 μL cfDNA to 20 μL with water and incubating at 37°C for 1 h.
2.6. Methylation‐specific digital PCR
Digital PCR was performed using the QuantStudio 3D Digital PCR System (Thermo Fisher Scientific). A digital PCR reaction mix (14.5 μL) containing 4 μL of cfDNA, 7.25 μL of QuantStudio 3D Digital PCR Master Mix v2 (ThermoFisher Scientific), 0.725 μL of forward primer (18 μM), 0.725 μL of reverse primer (18 μM), 0.725 μL of TaqMan probe (5 μM), and 0.725 μL of TaqMan Copy Number Reference Assay Rnase P (ThermoFisher Scientific) was prepared. The digital PCR mix was loaded onto a QuantStudio 3D Digital PCR Chip v2 using a QuantStudio 3D Digital PCR Chip Loader. PCR was performed on a ProFlex 2× Flat PCR system using the following program: 96°C for 10 min, 39 cycles at 60°C for 2 min, 98°C for 30 s, 60°C for 2 min, and 10°C. The chip image was captured using a QuantStudio 3D Digital PCR Instrument and analyzed using QuantStudio 3D Analysis Suite Software.
Test samples were digested with Hpa II, and undigested control samples were prepared. Copies of both the target and RNase P were measured in each sample, and the methylation ratio was calculated as follows:
2.7. Assay design for methylation quantification based on a methylation‐sensitive restriction enzyme
A digital PCR approach was developed to quantify CRC‐specific methylation using HpaII, a methylation‐sensitive enzyme. cfDNA from plasma, digested with HpaII, allows methylated sites' amplification. To determine the exact methylation rate corrected for pipetting bias, the RNase P gene was targeted (Figure S1).
2.8. Validation of the AMUSE assay to detect cancer‐derived cfDNA
We compared the methylation score of AMUSE and the variant allele frequency in cfDNA in eight points of peripheral blood from a representative BRAFV600E CRC case. We previously conducted a targeted NGS for cfDNA using the Oncomine Pan‐Cancer Cell‐Free Assay according to the manufacturer's protocol (Life Technologies) with an input of 20 ng of cfDNA. 16 We performed the AMUSE assay on plasma samples identical to those applied in the NGS study.
2.9. Database analysis of single‐cell RNA (scRNA) to disclose the origin of three markers
We carried out the analysis of the origin of the expression of three markers using scRNA data of 111,292 cells from primary CRC (n = 6), matched liver metastases (n = 6), and peripheral blood mononuclear cells (PBMCs) (n = 3) (GSE178318). 17 In addition, we applied scRNA‐seq data of 91,103 cells from 23 tumors and 10 normal samples of CRC cases (GSE132465). 18 We validated the origin of methylated genes, FGD5, GPC6, and MSC derived from the immune microenvironment, comprising lymphoid cells and myeloid cells.
3. RESULTS
3.1. Identification of the optimal methylated sites
To select useful methylation sites, in silico analysis was implemented (Figure 2).
FIGURE 2.
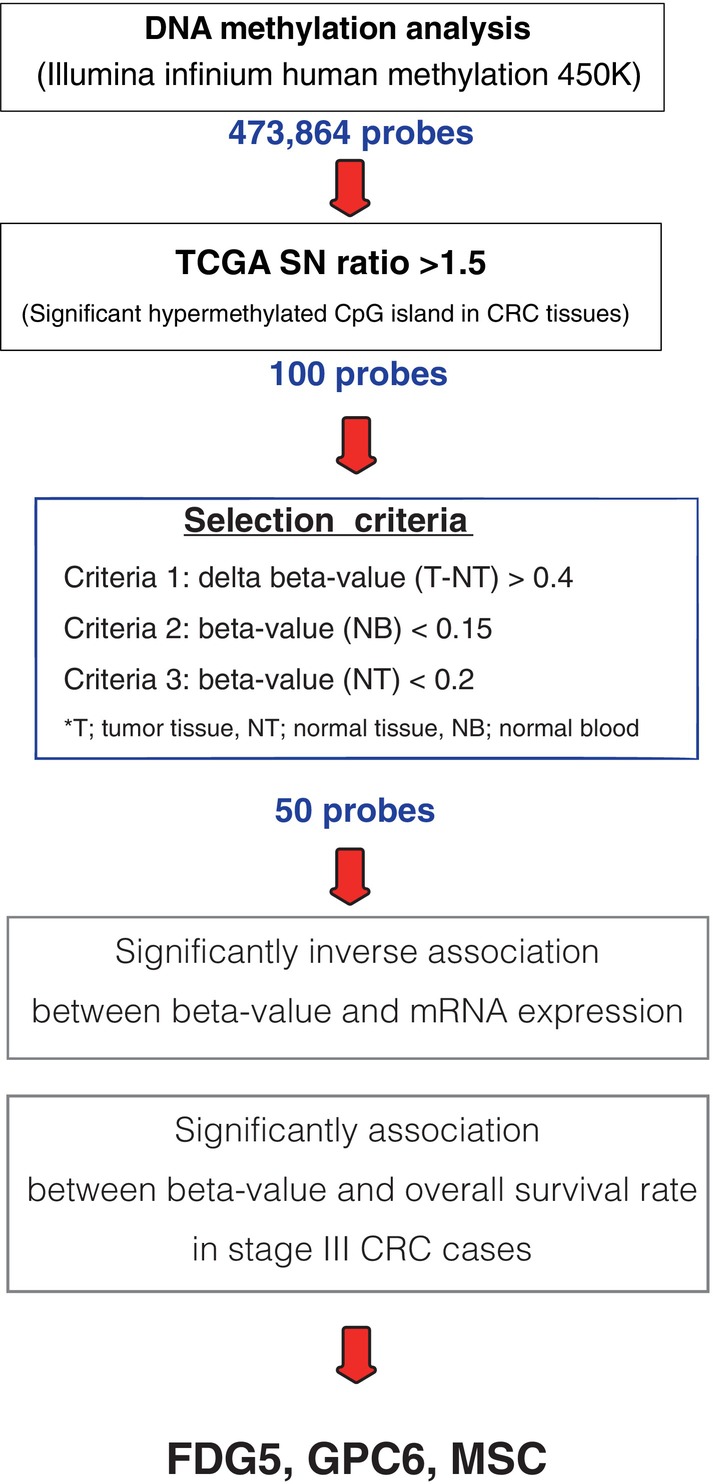
Exploring methylation biomarkers in colorectal cancer (CRC). Among the 473,864 probes in the Illumina Infinium Human Methylation 450 K, 100 sites of significantly hypermethylated CpG islands were selected, especially in CRC tissues. Three selection criteria were then applied: cancer cell specificity, no blood, or normal tissue expression. A total of 50 probes were identified, and their locations were validated in the amplified genomic regions. In addition, the probes were narrowed down under the following conditions: inverse association between the beta value of the methylated sites and the expression of target genes, and significant association between the beta value and overall survival rate in stage III CRC cases.
A total of 473,864 probes were used for selection in the Illumina Infinium Human Methylation 450 K, and the number of methylated sites (signal‐to‐noise ratio >1.5) in CRC tissues was narrowed down to 100 probes. Using The Cancer Genome Atlas (TCGA) data, the methylation rate was narrowed down to 50 probes by selecting those with a significant difference in methylation rate between tumor and normal tissues and a lower methylation rate in normal tissues and blood cells based on the following criteria: (1) beta value (tumor/normal tissue) >0.4, (2) beta value (normal blood) <0.15, and (3) beta value (normal tissue) <0.2. The beta value of methylation is the ratio of the intensity of the methylated bead type to the combined locus intensity, represented as a continuous variable between 0 and 1. Of the 50 sites identified, we have selected the top seven candidate methylated sites (Table S1) and additional two conditions, such as poor prognosis and inverse association between beta value and gene expression narrowed down to three markers (Figure 2).
We found that 59 cases of CRC with high beta values at promoter‐methylated sites of the FDG5, GPC6, and MSC genes exhibited poorer prognoses compared with the 60 cases with low beta values (Figure 3Aa). We also found a statistically significant inverse association between gene expression and the beta value of each gene in CRC cases from TCGA (Figure 3Ab). As a result, the targeted methylation sites in the three methylated genes, FGD5, GPC6, and MSC, were selected and used for further analysis of cfDNA in peripheral blood.
FIGURE 3.
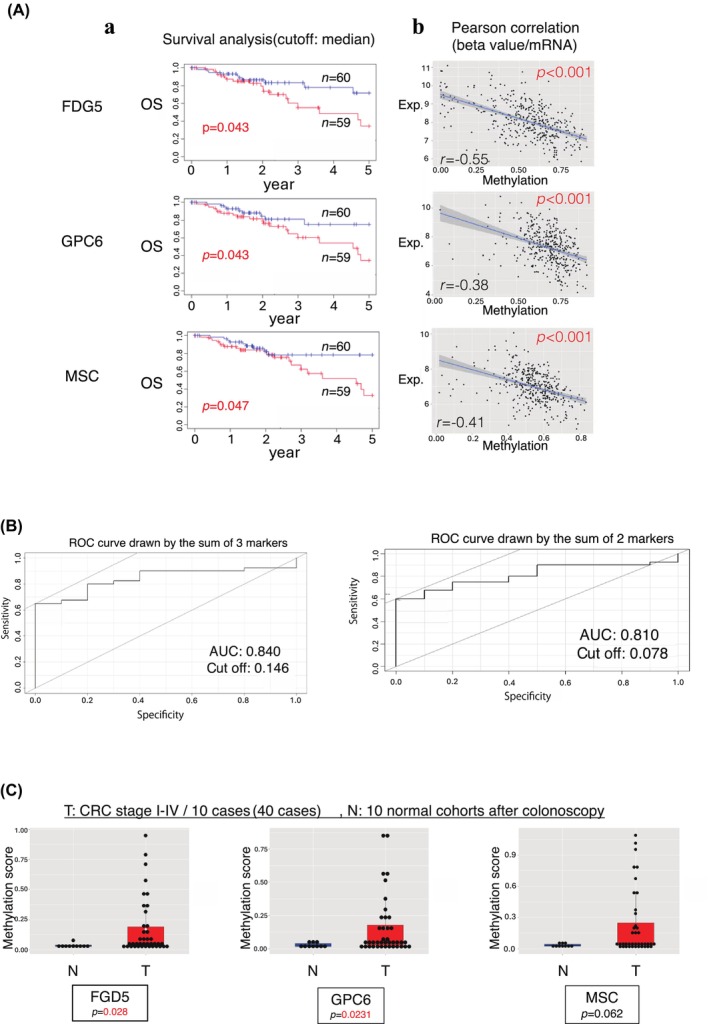
Identification of three methylated biomarkers for early detection of recurrence. (A) (a) We compared the prognostic significance between 59 colorectal cancer (CRC) cases of high and 60 cases of low methylated beta value of FDG5 (top), GPC6 (middle), and MSC (bottom). (b) Inverse association between gene expression and the methylated beta value in three genes. (B) The ROC curve is drawn by the sum of three markers (left) and two markers (right). (C) Comparison of the methylated beta value of CpG islands in FDG5, GPC6, and MSC in tumor/normal paired tissues from 40 CRC cases (stage I to IV).
These results indicate that the three markers selected for this study can identify patients with CRC, suggesting that they may be applied in cancer screening. The receiver‐operating characteristic (ROC) curve of these three markers showed a very high area under the curve (AUC) of 0.840 (Figure 3B left); only two markers, FDG5 and GPC6, exhibited an AUC of 0.810 (Figure 3B right).
The methylation status of the three target sites was used to discriminate between patients with CRC and the control group diagnosed by colonoscopy. The control group consisted of plasma samples from 10 patients with no abnormal findings who underwent colonoscopy at the Department of Surgery, Kyushu University Beppu Hospital, between January 2019 and March 2020. The tumor group used plasma from patients with CRC (stages 1–4; 40 patients, 10 in each group) collected at the Cancer Institute Hospital, Japanese Foundation for Cancer Research (JFCR). Of the three markers, FGD5 and GPC6 showed significantly increased methylation in the tumor group compared with the normal group (p = 0.028 and p = 0.0231, respectively; Figure 3C). MSC showed a tendency for higher methylation values in the tumor group compared with the normal group (p = 0.062) (Figure 3C).
3.2. Validation of methylated beta value using the AMUSE assay
In order to validate the concordance of the AMUSE data with the mutated variant allele frequency of cfDNA (Figure 4), we examined the mutated allele frequency of BRAF V600E of cfDNA from the CRC case. 16 In addition, we applied the AMUSE assay to the identical blood samples from a CRC case with BRAF V600E. The alteration of methylated beta value was significantly concordant with the mutated cfDNA.
FIGURE 4.
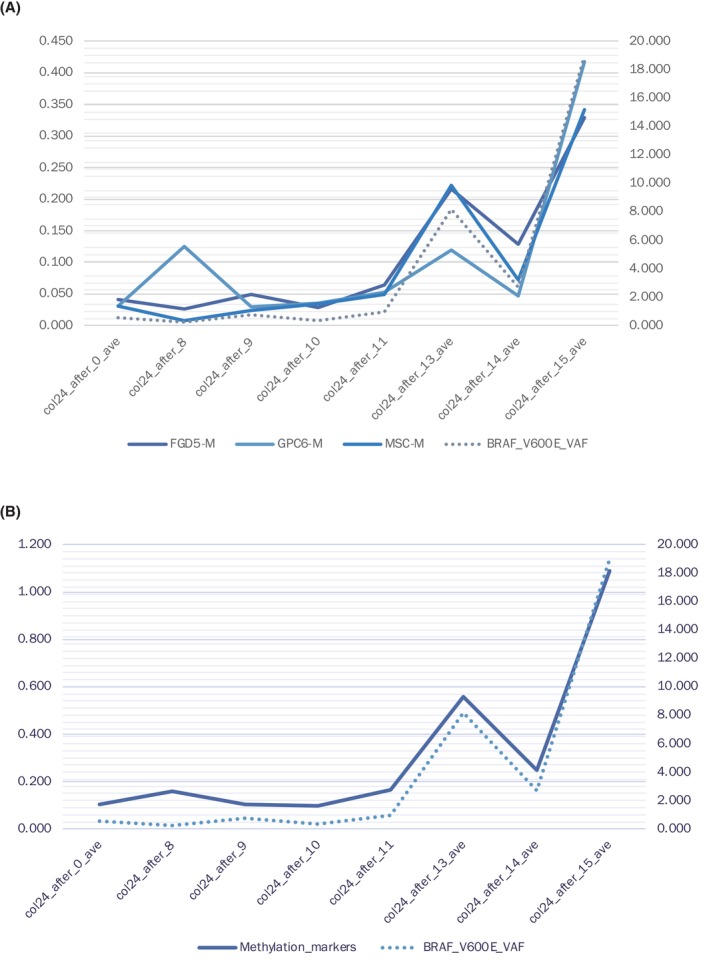
Comparison of the detectability of the abnormality in cell‐free DNA (cfDNA) between target sequencing and the AMUSE assay. (A) In this case, target sequencing of cfDNA detected BRAF V600E in eight blood samples from a representative case of colorectal cancer (CRC) (dotted line). The beta value of three markers is depicted by solid lines. (B) AMUSE data, which are the sum of three markers showed concordant with a variant allele frequency of the mutated BRAF gene.
3.3. Comparison between the sensitivities of CT and AMUSE in monitoring MRD
Forty‐seven patients with CRC (28 recurrence‐positive and 19 recurrence‐negative) with pathological stage III A/B and CurA underwent surgery at the Cancer Institute Hospital between June 2012 and June 2017. Patients usually underwent postoperative ACT with CAPOX. Pathological histological diagnosis of well to poorly differentiated adenocarcinoma was included in this study. Methylation status was measured using plasma samples collected pre‐ and postoperatively, after ACT, and at recurrence. Regarding recurrence‐free patients, nonrecurrent cases were defined as those who had no relapse for an average of 1551 days postoperatively. Patients who presented with methylation values of the three genes in cfDNA above the cutoff value were diagnosed as positive for recurrence by liquid biopsy. Before the clinical diagnosis of postoperative recurrence using CT imaging, 22 (78.5%) of the 28 patients were diagnosed with recurrence (sensitivity, 78.5%).
3.4. Representative cases with early detection of postoperative recurrence
Early detection of postoperative recurrence may enable complete removal and confer favorable clinical outcomes for CRC. However, sometimes a definitive diagnosis of recurrence cannot be made due to ambiguous findings on CT within the normal range of serum tumor markers. Therefore, we employ MRI scans for qualitative assessments of the region and to ascertain the feasibility of surgical resection.
In this study, case A (Figure 5A), following surgery (P), was observed to have a tumor‐like shadow in the liver on the abdominal CT scan on postoperative day 362 (Q1). However, the serum tumor marker CEA was within normal limits; hence, the decision was made to monitor the progression. On postoperative day 558 (Q2), the liver findings became clearer, but the CEA value remained normal. A recurrence diagnosis was made on postoperative day 650 (R), at which point the CEA value exceeded the threshold for the first time. On the other hand, when the same blood sample was analyzed using the AMUSE method, it had been consistently high since the end of ACT and was positive.
FIGURE 5.
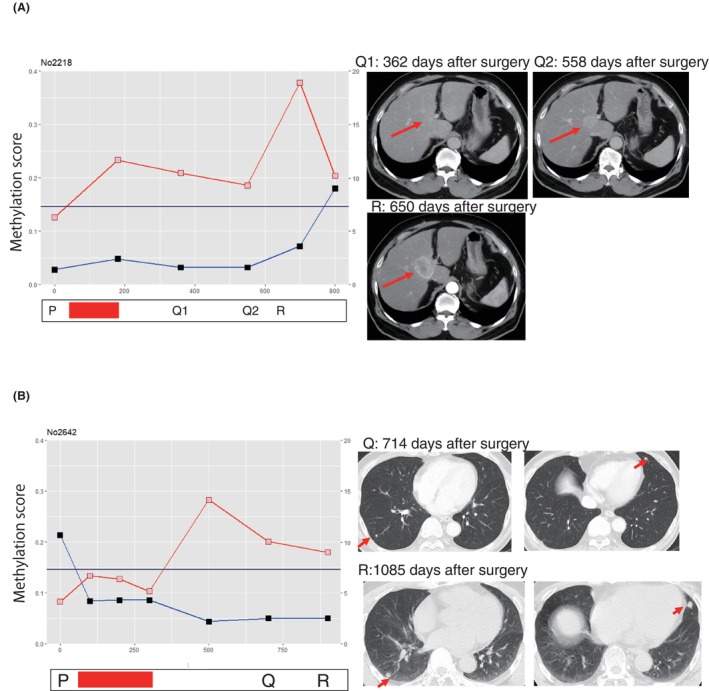
AMUSE score validates the suspected postoperative recurrence on CT imaging. Red bars show the period of adjuvant chemotherapy (ACT). The red and blue lines are the AMUSE score and serum CEA protein levels, respectively. The dates of the operation (P), suspected recurrence on imaging (Q), and recurrence diagnosis (R) are shown. (A) A representative colorectal cancer (CRC) case with liver metastasis. (B) A representative CRC case with lung metastasis. The AMUSE assay detects recurrence much earlier than serum CEA value.
Case B (Figure 5B), on postoperative day 714 (Q), showed pseudo‐positive findings in both lobes of the lungs on a chest CT scan, but with a normal serum CEA value, and was therefore left untreated. A clear recurrence focus was identified on postoperative day 1085 (R), at which point a diagnosis of recurrence was made. Analysis of the same specimen with the AMUSE method revealed that it had been rising since immediately after ACT.
We have four more CRC cases with recurrence, and the AMUSE assay could detect recurrence earlier than serum CEA (Figure S2). Follow‐ups were carried out in 19 patients with no recurrence after curative operation. Of the 19 patients, 17 (89.5%) were negative, but two points indicated false‐positive beta values in the AMUSE assay (Figure S3).
3.5. Clinical benefits of the AMUSE assay
The AMUSE assay diagnosis was made 208 days earlier than the practical clinical diagnosis of recurrence (Figure 6A). Lesions suspected of recurrence were followed up because there were no conclusive findings to diagnose recurrence. However, a definitive diagnosis of recurrence was established using CT. Some cases indicated that if the AMUSE approach had been implemented, curative treatment of the recurrent lesions could have been performed.
FIGURE 6.
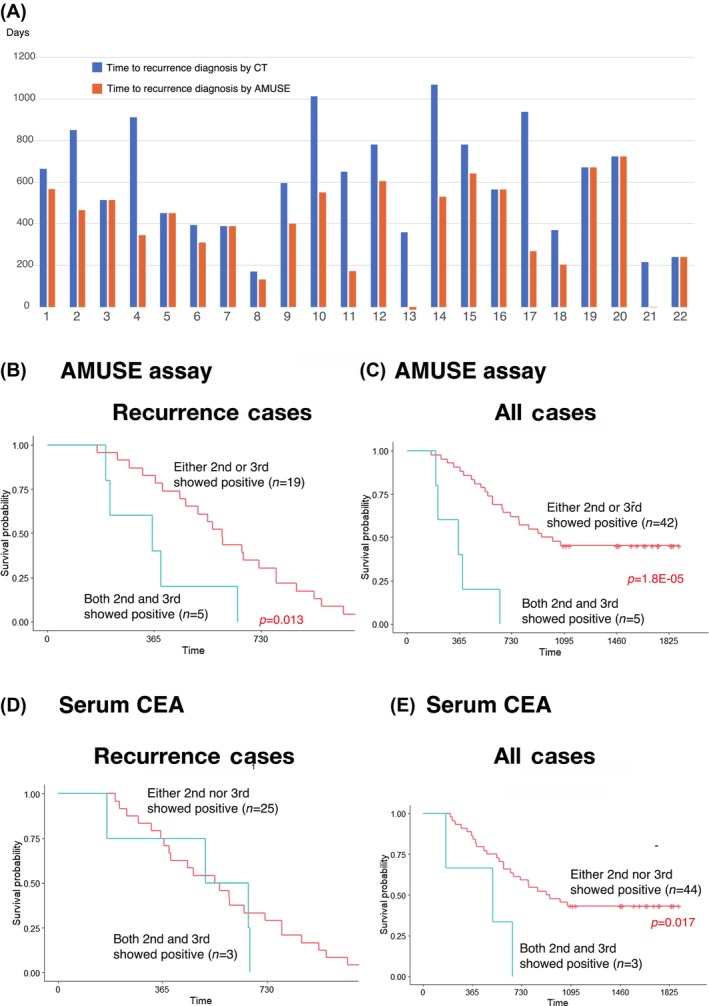
Clinical benefits of the AMUSE assay. Comparison between the time of recurrence diagnosis by CT (blue bar) and the AMUSE assay (orange bar) in 22 AMUSE assay‐positive cases (A). Comparison of the recurrence‐free survival rate between AMUSE‐positive cases for either the second or third (n = 19) and both the second and third (n = 5) time in recurrence cases (B). Comparison of the recurrence‐free survival rate between AMUSE‐positive cases for either the second or third (n = 42) and both the second and third (n = 5) time in all cases (C). Recurrence cases (D) and all cases (E) were examined with serum CEA.
Of the 28 cases, the disease‐free recurrence rate was compared between the 5 cases with positive results at both the second and third blood collection points and the remaining 23 with positive recurrence at the second blood collection point during postoperative ACT initiation and third blood collection point during ACT implementation (Table 2). Patients in the former group were significantly highly likely to experience relapse (p = 0.013) (Figure 6B). In addition, a comparison of the disease‐free recurrence rate between the 5 patients who were positive for both tests and the other 42 patients showed a significant recurrence in the former group (p = 1.8E‐05) (Figure 6C). Thus, a regression can be predicted by positive AMUSE results during the ACT period.
TABLE 2.
Univariate and multivariate analyses of clinicopathologic factors for determining postoperative recurrence.
| Variable | Object | Control | Univariate analysis | Multivariate analysis | ||||
|---|---|---|---|---|---|---|---|---|
| Hazard ratio | 95% CI | p‐Value | Hazard ratio | 95% CI | p‐Value | |||
| Age (mean) | ≧55 | <55 | 0.996 | 0.4731–2.097 | 0.991 | 1.2259 | 0.5393–2.7865 | 0.6269 |
| Gender | Male | Female | 0.8054 | 0.3807–1.704 | 0.571 | |||
| Lymphatic invasion | (+) | (−) | 5.438 | 0.7373–40.11 | 0.0967 | 10.1243 | 1.2897–79.4803 | 0.0277 |
| Vascular invasion | (+) | (−) | 1.12 | 0.3379–3.715 | 0.852 | |||
| T stage | T3‐4 | T1‐2 | 1.12 | 0.3379–3.715 | 0.852 | |||
| Patho | Poor | Well/mod | 2.59 | 0.7665–8.753 | 0.126 | 1.4625 | 0.3836–5.5757 | 0.5777 |
| N stage | N2/3 | N1 | 1.93 | 0.8864–4.203 | 0.0977 | |||
| Size (mean) | ≧40 mm | <40 mm | 1.1103 | 0.5279–2.335 | 0.783 | |||
| AMUSE (+) both ② and ③ | (+) | (−) | 7.35 | 2.543–21.25 | 0.00023 | 11.6576 | 3.4918–38.9195 | 6.53E‐05 |
| AMUSE (+) either ② or ③ | (+) | (−) | 3.4125 | 1.583–7.357 | 0.00174 | 3.70598 | 1.5962–8.604 | 0.0023 |
| CEA (+) both ② and ③ | (+) | (−) | 2.3281 | 0.6762–8.015 | 0.18 | |||
| CEA (+) either ② or ③ | (+) | (−) | 1.859 | 0.6199–5.574 | 0.268 | |||
Meanwhile, advanced CRC cases indicating positive AMUSE during the entire ACT period and at the second and third points simultaneously demonstrated positive serum CEA levels at the same sampling points (Figure 6E). However, the difference between AMUSE‐positive and AMUSE‐negative survival rates was more significant than that between CEA‐positive and CEA‐negative survival rates.
3.6. Urgent recommendations regarding the clinical settings of ACT
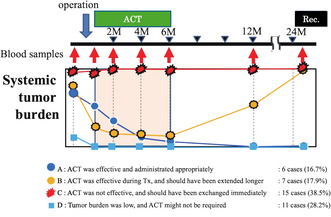
Regarding MRD after curative resection for postoperative stage III CRC, ACT was administered as the standard treatment approved by the conference. However, the ACT protocol comprises a consolidated set dose and a set period of time without considering the personalized tumor burden to prevent a recurrence. A total of 39 eligible cases were stratified after excluding 6 false‐negative and 2 false‐positive cases out of the 47 cases (Figure 7, Figure S4). It is worth noting that the proportion of cases with appropriate ACT treatment was 6 (16.9%) in group A and 7 (17.9%) in group B out of 39 eligible cases. The AMUSE assay played a definitive role in extending ACT for group B. However, ACT did not work for 15 (38.5%) in group C and was unnecessary for 11 (28.2%) in group D.
FIGURE 7.
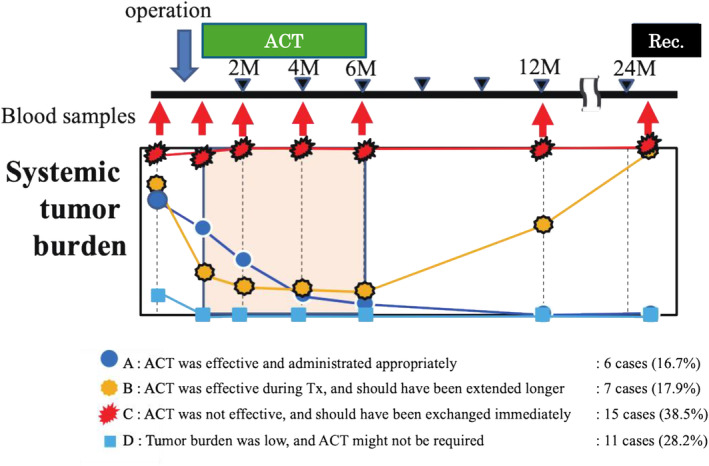
Stratification of the altered post‐operative tumor burden affected by adjuvant chemotherapy (ACT). Four groups of the alteration patterns of tumor burden affected by ACT were stratified. Group A: Tumor burden was reduced by operation, and the remaining minimal residual disease (MRD) was eliminated by ACT. Group B: Tumor burden decreased by operation; however, it increased after ACT due to the resistance or lack of susceptibility to the regimens. Group C: Tumor burden showed no change because of the abundant number of residual cancers and insensitivity to ACT. Group D: Tumor was completely eliminated just by the curative operation.
3.7. Origin of the methylated three genes by single‐cell sequencing analysis
The scRNA‐seq data of 133,132 cells from six CRC cases (GSE178318) indicated that GPC6 and MSC were derived from cancer‐associated fibroblast (CAF), and the expression of GPC6 was significantly lower in the metastatic sites than that of the primary site (p = 0.00021) (Figure 8A). Another scRNA‐seq data from 91,103 cells (GSE132465) also disclosed that none of the three markers were derived from epithelial cells but from stromal cells (Figure 8B).
FIGURE 8.
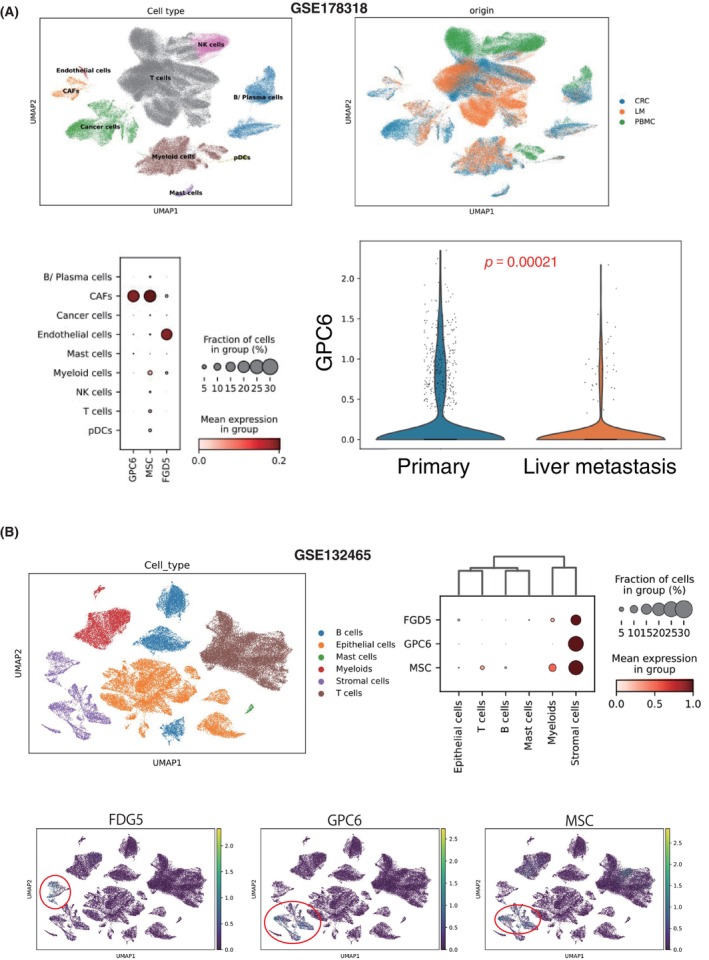
Origin of the methylated three genes by single‐cell RNA‐sequencing (scRNA‐seq) analysis. (A) We analyzed scRNA data of 111,292 cells from primary colorectal cancer (CRC) (n = 6), matched liver metastases (LM) (n = 6), and peripheral blood mononuclear cells (PBMCs) (n = 3) (GSE178318). In addition, we applied scRNA‐seq data of 91,103 cells from 23 tumors and 10 normal samples of CRC cases (GSE132465). We validated the origin of the genes FGD5, GPC6, and MSC derived from epithelial cells or the immune microenvironment, comprising lymphoid cells and myeloid cells.
4. DISCUSSION
Accurate MRD monitoring necessitates frequent assessments. Optimal methods must balance reproducibility, precision, minimality of invasiveness, and cost‐effectiveness. Presently, multiple liquid biopsy techniques strive to surpass serum tumor markers like CEA and CA19‐9. Several liquid biopsy methods, including miRNAs, 5 , 19 , 20 circulating tumor cell, 21 , 22 and somatic ctDNA mutations, have been explored. This research emphasizes that ctDNA‐targeted tests enhance MRD monitoring reliability over other methods.
This study identified methylated ctDNA and the AMUSE assay as cost‐effective tools. Current blood comprehensive genomic profiling (CGP) tests are financially prohibitive for regular MRD evaluations due to NGS analysis costs. Mutation tracking using digital PCR offers a cost‐effective alternative. 5 Recurring site mutations mirror primary site mutations, 23 allowing mutation tracing through primary‐site sequencing. However, sequencing primary tumors is obligatory to pinpoint the genes under surveillance. Digital PCR primers must be tailor‐made after post‐mutation identification. Still, the AMUSE assay offers a 78% sensitivity and 89% specificity, irrespective of the primary tumor's genomic diversity. As three methylation sites are versatile for wide‐ranging monitoring, the mass primer production can avoid patient‐specific adjustments and curtailing costs.
Multiple liquid biopsy tests have been applied to stage II/III colorectal and rectal cancers. Henriksen et al. employed multiplex PCR and NGS to assess ctDNA post treatment, which forecasted tumor recurrence. Conversely, variations in recurrence rates were observed due to different ctDNA dynamics. 24 Chen et al. 25 leveraged a 425‐gene panel, showing early ctDNA detection post surgery presaged an adverse prognosis, aligning with this study's findings. Zhou et al. 26 targeted sequencing with NGS in rectal cancer reinforced ctDNA's value in gauging carcinoma presence, by showing that positive ctDNA was associated with decreased MFS.
Several studies have probed methylated sites in cfDNA. 27 , 28 , 29 , 30 , 31 Septin 9, a methylation marker, has shown variability. 32 Pedersen et al. 33 revealed methylation in BCAT1‐ and IKZF1‐derived ctDNA as prognostic, aligning with our findings. Yet, due to the expensive NGS requirement, cost‐effective, clinically viable testing methods are in demand, with the AMUSE assay emerging as the frontrunner.
In this study, we identified three methylation markers through in silico analysis that satisfied clinical parameters, and their effectiveness was subsequently validated. Notably, single‐cell analysis revealed that these methylation markers are expressed by stromal CAFs rather than epithelial cells, a finding that diverges from initial TCGA database results which utilized total RNA from bulk cancer specimens. The detection of these markers in CAFs or endothelial cells aligns with established theories, positing that cancer metastasis proceeds after the establishment of premetastatic niches by CAFs, thus presenting no discrepancy. In clinical practice, data derived from the AMUSE assay may reflect the presence of premetastatic niches rather than quantifying cancer cells per se, offering a potential metric for assessing metastatic propensity. Moreover, in our cohort, 12 of 28 patients exhibited negative AMUSE values in preoperative blood samples. This observation underscores the notion that increased methylation of GPC6 and FDG5 is more indicative of the proliferation of CAFs critical to the formation of premetastatic niches than of tumor mass itself.
This study's design bears certain limitations that warrant acknowledgment. It was conducted as a retrospective analysis at a single institution and engaged a limited patient cohort, rather than being a prospective, randomized controlled trial. Consequently, definitive conclusions regarding the AMUSE assay's role in predicting the clinical benefit of ACT post radical treatment for advanced CRC remain out of reach. The primary intent of this research was to enable earlier identification of high‐risk recurrence cases than is possible with current imaging techniques. While imaging modalities such as CT or MRI are indispensable for the implementation of radical and localized therapies, the establishment of the AMUSE assay's clinical relevance could potentially guide the initiation of systemic treatments at a subclinical stage. To substantiate the clinical utility of the AMUSE assay, further research is imperative.
In conclusion, our investigation has yielded the AMUSE assay, an innovative and economical noninvasive methodology that utilizes methylated DNA markers to detect MRD in stage III CRC. This assay may offer a stratification of patient responses to ACT, thereby holding promise for the optimization of treatment regimens.
AUTHOR CONTRIBUTIONS
Takafumi Nakano: Formal analysis; writing – original draft. Seiichiro Takao: Methodology. Katsushi Dairaku: Formal analysis. Naoki Uno: Data curation; formal analysis; methodology; writing – original draft. Yuichi Hisamatsu: Resources. Takeo Toshima: Resources. Yusuke Yonemura: Resources; supervision. Takaaki Masuda: Conceptualization; supervision. Ken Eto: Supervision. Toru Ikegami: Supervision. Yosuke Fukunaga: Conceptualization; methodology. Atsushi Niida: Conceptualization; data curation; formal analysis; methodology; software. Satoshi Nagayama: Conceptualization; supervision. Koshi Mimori: Conceptualization; investigation; project administration; supervision. Siew‐Kee (Amanda) Low: Validation. Masahiro Hashimoto: Formal analysis. Yasuo Tsuda: Resources.
FUNDING INFORMATION
This project was supported by AMED (P‐CREATE 20cm0106475h0001, 23ck0106825h001, 23ck0106800h001, 22ama221501h0001, 21ck0106690s0201, 20ck0106547h0001, 20ck0106541h0001, 22ama221XXXh0001, 23ck0106825h001, and 23ck0106800h001); Japan Society for the Promotion of Science (JSPS) Grant‐in‐Aid for Science Research (grant numbers 20H05039, 20K08930, 20K17556, 21K07179, 22K02903, 22K09006, 23K06765, and 23K08074); The Takeda Science Foundation 2020; OITA Cancer Research Foundation (grant number: JP20cm0106475h0001); and The Princess Takamatsu Cancer Research Fund.
CONFLICT OF INTEREST STATEMENT
The authors declare no competing financial interest. The corresponding author Mimori K. is an editorial board member of the current journal, Cancer Science.
ETHICS STATEMENT
Approval of the research protocol by an Institutional Reviewer Board: Research Ethics Review Board at the Cancer Institute Hospital Ariake, IRB Receipt No. 2010‐1058 (March 7, 2019). The Ethics Review Committee for Clinical Research at Kyushu University Medical School District Department reviewed and approved the project, No. 2020‐321 (September 1, 2020).
Informed Consent: We have obtained written informed consent from all the relevant cases.
Registry and the Registration No. of the study/trial. N/A.
Animal Studies. N/A.
Supporting information
Figure S1.
ACKNOWLEDGMENTS
Supercomputing analysis identified three methylated markers provided by the Human Genome Center, Institute of Medical Science, University of Tokyo (http://sc.hgc.jp/shirokane.html). We thank M. Kasagi, S. Sakuma, M. Fukuda, N. Mishima, and T. Kawano for their assistance. We would like to express our gratitude to Editage Co. Ltd (https://www.editage.jp/services/english‐editing) for their English language editing services.
Nakano T, Takao S, Dairaku K, et al. Implementable assay for monitoring minimum residual disease after radical treatment for colorectal cancer. Cancer Sci. 2024;115:1989‐2001. doi: 10.1111/cas.16149
Takafumi Nakano, Seiichiro Takao, and Katsushi Dairaku contributed equally to this study.
REFERENCES
- 1. Marubashi S, Takahashi A, Kakeji Y, et al. Surgical outcomes in gastroenterological surgery in Japan: report of the National Clinical Database 2011‐2019. Ann Gastroenterol Surg. 2021;5:639‐658. [DOI] [PMC free article] [PubMed] [Google Scholar]
- 2. Oki E, Ando K, Taniguchi H, Yoshino T, Mori M. Sustainable clinical development of adjuvant chemotherapy for colon cancer. Ann Gastroenterol Surg. 2022;6:37‐45. [DOI] [PMC free article] [PubMed] [Google Scholar]
- 3. Watanabe T, Itabashi M, Shimada Y, et al. Japanese Society for Cancer of the colon and Rectum (JSCCR) guidelines 2014 for treatment of colorectal cancer. Int J Clin Oncol. 2015;20:207‐239. [DOI] [PMC free article] [PubMed] [Google Scholar]
- 4. Kotani D, Oki E, Nakamura Y, et al. Molecular residual disease and efficacy of adjuvant chemotherapy in patients with colorectal cancer. Nat Med. 2023;29:127‐134. [DOI] [PMC free article] [PubMed] [Google Scholar]
- 5. Iwaya T, Endo F, Takahashi F, Tokino T, Sasaki Y, Nishizuka SS. Frequent tumor burden monitoring of esophageal squamous cell carcinoma with circulating tumor DNA using individually designed digital polymerase chain reaction. Gastroenterology. 2021;160:463‐465.e4. [DOI] [PubMed] [Google Scholar]
- 6. Mimori K, Fukagawa T, Kosaka Y, et al. Hematogenous metastasis in gastric cancer requires isolated tumor cells and expression of vascular endothelial growth factor receptor‐1. Clin Cancer Res. 2008;14:2609‐2616. [DOI] [PubMed] [Google Scholar]
- 7. Sicklick JK, Kato S, Okamura R, et al. Molecular profiling of cancer patients enables personalized combination therapy: the I‐PREDICT study. Nat Med. 2019;25:744‐750. [DOI] [PMC free article] [PubMed] [Google Scholar]
- 8. Tsimberidou AM, Hong DS, Ye Y, et al. Initiative for molecular profiling and advanced cancer therapy (IMPACT): An MD Anderson precision medicine study. JCO Precis Oncologia. 2017;2017:1‐18. [DOI] [PMC free article] [PubMed] [Google Scholar]
- 9. Zehir A, Benayed R, Shah RH, et al. Mutational landscape of metastatic cancer revealed from prospective clinical sequencing of 10,000 patients. Nat Med. 2017;23:703‐713. [DOI] [PMC free article] [PubMed] [Google Scholar]
- 10. Nakamura Y, Okamoto W, Kato T, et al. Circulating tumor DNA‐guided treatment with pertuzumab plus trastuzumab for HER2‐amplified metastatic colorectal cancer: a phase 2 trial. Nat Med. 2021;27:1899‐1903. [DOI] [PMC free article] [PubMed] [Google Scholar]
- 11. Li C, Jia R, Liu H, Zhang B, Wang C. EGFR T790M detection and osimertinib treatment response evaluation by liquid biopsy in lung adenocarcinoma patients with acquired resistance to first generation EGFR tyrosine kinase inhibitors. Diagn Pathol. 2018;13:49. [DOI] [PMC free article] [PubMed] [Google Scholar]
- 12. Li M, Yang L, Hughes J, et al. Driver mutation variant allele frequency in circulating tumor DNA and association with clinical outcome in patients with non‐small cell lung cancer and EGFR‐ and KRAS‐mutated tumors. J Mol Diagn. 2022;24:543‐553. [DOI] [PubMed] [Google Scholar]
- 13. Leal A, Sidransky D, Brait M. Tissue and cell‐free DNA‐based epigenomic approaches for cancer detection. Clin Chem. 2020;66:105‐116. [DOI] [PubMed] [Google Scholar]
- 14. Japanese Society for Cancer of the C Rectum . Japanese classification of colorectal, appendiceal, and anal carcinoma: the 3d English edition [secondary publication]. J Anus Rectum Colon. 2019;3:175‐195. [DOI] [PMC free article] [PubMed] [Google Scholar]
- 15. Schmoll HJ, Tabernero J, Maroun J, et al. Capecitabine plus oxaliplatin compared with fluorouracil/Folinic acid As adjuvant therapy for stage III colon cancer: final results of the NO16968 randomized controlled phase III trial. J Clin Oncol. 2015;33:3733‐3740. [DOI] [PubMed] [Google Scholar]
- 16. Chan HT, Nagayama S, Otaki M, et al. Tumor‐informed or tumor‐agnostic circulating tumor DNA as a biomarker for risk of recurrence in resected colorectal cancer patients. Front Oncol. 2022;12:1055968. [DOI] [PMC free article] [PubMed] [Google Scholar]
- 17. Che LH, Liu JW, Huo JP, et al. A single‐cell atlas of liver metastases of colorectal cancer reveals reprogramming of the tumor microenvironment in response to preoperative chemotherapy. Cell Discov. 2021;7:80. [DOI] [PMC free article] [PubMed] [Google Scholar]
- 18. Lee HO, Hong Y, Etlioglu HE, et al. Lineage‐dependent gene expression programs influence the immune landscape of colorectal cancer. Nat Genet. 2020;52:594‐603. [DOI] [PubMed] [Google Scholar]
- 19. Takano Y, Masuda T, Iinuma H, et al. Circulating exosomal microRNA‐203 is associated with metastasis possibly via inducing tumor‐associated macrophages in colorectal cancer. Oncotarget. 2017;8:78598‐78613. [DOI] [PMC free article] [PubMed] [Google Scholar]
- 20. Yoshikawa Y, Fukunaga M, Takahashi J, et al. Identification of the minimum combination of serum microRNAs to Predict the recurrence of colorectal cancer cases. Ann Surg Oncol. 2022;30:233‐243. [DOI] [PMC free article] [PubMed] [Google Scholar]
- 21. Masuda T, Hayashi N, Iguchi T, Ito S, Eguchi H, Mimori K. Clinical and biological significance of circulating tumor cells in cancer. Mol Oncol. 2016;10:408‐417. [DOI] [PMC free article] [PubMed] [Google Scholar]
- 22. Yokobori T, Iinuma H, Shimamura T, et al. Plastin3 is a novel marker for circulating tumor cells undergoing the epithelial‐mesenchymal transition and is associated with colorectal cancer prognosis. Cancer Res. 2013;73:2059‐2069. [DOI] [PubMed] [Google Scholar]
- 23. Nagayama S, Kobayashi Y, Fukunaga M, et al. Mutated genes on ctDNA detecting postoperative recurrence presented reduced neoantigens in primary tumors in colorectal cancer cases. Sci Rep. 2023;13:1366. [DOI] [PMC free article] [PubMed] [Google Scholar]
- 24. Henriksen TV, Tarazona N, Frydendahl A, et al. Circulating tumor DNA in stage III colorectal cancer, beyond minimal residual disease detection, toward assessment of adjuvant therapy efficacy and clinical behavior of recurrences. Clin Cancer Res. 2022;28:507‐517. [DOI] [PMC free article] [PubMed] [Google Scholar]
- 25. Chen G, Peng J, Xiao Q, et al. Postoperative circulating tumor DNA as markers of recurrence risk in stages II to III colorectal cancer. J Hematol Oncol. 2021;14:80. [DOI] [PMC free article] [PubMed] [Google Scholar]
- 26. Zhou J, Wang C, Lin G, et al. Serial circulating tumor DNA in predicting and monitoring the effect of neoadjuvant chemoradiotherapy in patients with rectal cancer: a prospective multicenter study. Clin Cancer Res. 2021;27:301‐310. [DOI] [PubMed] [Google Scholar]
- 27. Huang J, Soupir AC, Wang L. Cell‐free DNA methylome profiling by MBD‐seq with ultra‐low input. Epigenetics. 2022;17:239‐252. [DOI] [PMC free article] [PubMed] [Google Scholar]
- 28. Katsman E, Orlanski S, Martignano F, et al. Detecting cell‐of‐origin and cancer‐specific methylation features of cell‐free DNA from nanopore sequencing. Genome Biol. 2022;23:158. [DOI] [PMC free article] [PubMed] [Google Scholar]
- 29. Liang N, Li B, Jia Z, et al. Ultrasensitive detection of circulating tumour DNA via deep methylation sequencing aided by machine learning. Nat Biomed Eng. 2021;5:586‐599. [DOI] [PubMed] [Google Scholar]
- 30. Shen SY, Singhania R, Fehringer G, et al. Sensitive tumour detection and classification using plasma cell‐free DNA methylomes. Nature. 2018;563:579‐583. [DOI] [PubMed] [Google Scholar]
- 31. Stackpole ML, Zeng W, Li S, et al. Cost‐effective methylome sequencing of cell‐free DNA for accurately detecting and locating cancer. Nat Commun. 2022;13:5566. [DOI] [PMC free article] [PubMed] [Google Scholar]
- 32. Nikolaou S, Qiu S, Fiorentino F, Rasheed S, Tekkis P, Kontovounisios C. Systematic review of blood diagnostic markers in colorectal cancer. Tech Coloproctol. 2018;22:481‐498. [DOI] [PMC free article] [PubMed] [Google Scholar]
- 33. Pedersen SK, Symonds EL, Roy AC, Cornthwaite KJ, LaPointe LC, Young GP. Detection of methylated BCAT1 and IKZF1 after curative‐intent treatment as a prognostic indicator for colorectal cancer recurrence. Cancer Med. 2022;12:1319‐1329. [DOI] [PMC free article] [PubMed] [Google Scholar]
Associated Data
This section collects any data citations, data availability statements, or supplementary materials included in this article.
Supplementary Materials
Figure S1.


