



Abstract
Immune checkpoint inhibitors (ICIs) have shown promising efficacy in multiple cancers including biliary tract cancers (BTCs). However, the data focusing on the efficacy of ICIs in patients with gallbladder cancer (GBC) is still limited. In this study, we aim to assess the efficacy of ICIs in GBC and explore the clinicopathologic and molecular markers associated with ICI benefit. We retrospective analyzed 69 GBC patients who had received ICI therapy between January 2016 and December 2020. Tumor samples were obtained for genomic sequencing and immunohistochemical analysis. The median progression‐free survival (PFS) and overall survival (OS) was 4.4 months and 8.5 months, respectively. Multivariate analysis indicated that alcohol intake history, carcinoma embryonic antigen (CEA) level ≥100 U/mL, and cutaneous immune‐related adverse events (irAEs) were independent prognostic factors for PFS. CEA level ≥100 U/mL and cutaneous irAEs were independent prognostic factors for OS. The objective response rate and disease control rate (DCR) were 15.9% and 37.7%, respectively. Patients with cutaneous irAEs, high CD8+ T cell infiltrated or immune inflamed GBCs had higher DCR. Patients with high CD8+ T cell infiltrated or immune inflamed GBCs also had a notably improved prognosis. These results suggest that ICIs were effective in patients with GBC. High CEA level, cutaneous irAEs, high CD8+ T cell infiltration, and immune inflamed phenotype could be useful for predicting the efficacy of ICIs in GBC.
Keywords: gallbladder cancer, immune checkpoint inhibitors, PD‐1, PD‐L1
Data on 69 gallbladder cancer (GBC) patients treated with immune checkpoint inhibitors (ICIs) were retrospectively analyzed and reported. The median progression‐free survival was 4.4 months, median overall survival was 8.5 months, and objective response and disease control rates were 15.9% and 37.7%, respectively. High carcinoma embryonic antigen level, cutaneous immune‐related adverse events, high CD8+ T cell infiltration, and immune inflamed phenotype could be useful for predicting the efficacy of ICIs in GBC.

1. INTRODUCTION
Gallbladder cancer (GBC) is relatively rare but the most malignant type of biliary tract cancer (BTC). 1 The overall 5‐year survival rate of GBC is only 5%–13%. 2 Radical resection is the most effective strategy to potentially cure GBC, but most GBC patients are diagnosed at an advanced stage and lose the opportunity to receive surgical treatment. Gemcitabine plus cisplatin is the first‐line treatment for patients with advanced GBC. However, the objective response rate (ORR) of this regimen is only approximately 21%–37%. 3 Novel effective therapeutic approaches are urgently needed to improve the clinical outcomes of patients with GBC.
In recent years, the application of immune checkpoint inhibitors (ICIs), including anti‐programmed cell death‐1 (PD‐1) and anti‐PD‐1‐ligand 1 (PD‐L1) mAbs, has emerged as a promising strategy for treating a variety of malignant tumors, including BTCs. 4 , 5 In a phase I trial (KEYNOTE‐028), pembrolizumab (an anti‐PD‐1 mAb) monotherapy achieved an ORR of 13% as a second‐line or beyond treatment for BTCs. The median progression‐free survival (PFS) and median overall survival (OS) was 1.8 months (95% confidence interval [CI], 1.9–2.1) and 6.2 months (95% CI, 5.5–9.6), respectively. 6 In another single‐arm phase II study of nivolumab (an anti‐PD‐1 mAb) in refractory BTC patients (NCT02829918), the median PFS was 3.7 months (95% CI, 2.30–5.69) and the median OS was 14.2 months (95% CI, 5.98–not reached [NR]). 7 The combination of ICIs with other therapies in BTCs has also shown promising results. In an open‐label, single‐arm phase II study of toripalimab (an anti‐PD‐1 mAb) plus chemotherapy as the first‐line treatment for advanced BTC (NCT03796429), the median PFS and median OS were 7.0 months (95% CI, 5.0–8.9) and 15.0 months (95% CI, 1.6–18.4). 8 Moreover, recently, a global phase III study (TOPAZ‐1) reported the advantages of durvalumab (an anti‐PD‐L1 mAb) combined with chemotherapy in the first‐line setting, which conferred a 20% reduction in death risk compared with chemotherapy alone (hazard ratio [HR] 0.80; 95% CI, 0.66–0.97). The PFS was also improved with chemoimmunotherapy versus chemotherapy alone (HR 0.75; 95% CI, 0.64–0.89), as was the ORR (26.7% vs. 18.7%). 9
However, it should be noted that the participants in those trials were mostly pan‐BTC patients. Biliary tract cancers are highly heterogenous entities and different BTC subtypes display distinct responses to therapy. Due to the rarity of the disease, trials and data focused on the treatment of ICIs for GBC are still limited. To address these gaps, we undertook a retrospective study to assess the real‐world efficacy of ICIs in patients with GBC and explored the clinicopathologic and molecular markers associated with ICI benefit.
2. MATERIALS AND METHODS
2.1. Study design, participants, and samples
This was a single‐center, retrospective study that consisted of patients with GBC who had received ICI (anti‐PD‐1 mAb) therapy at Eastern Hepatobiliary Surgery Hospital between January 2016 and December 2020. All patients signed the informed consent for immunotherapy. The inclusion criteria included: (1) patients with histologically or radiographically confirmed GBC, (2) have received at least two cycles of ICI treatment, (3) ECOG performance status of 0–1, and (4) complete medical records. A total of 98 patients were screened for eligibility and 29 patients were excluded (6 patients lost follow‐up; 12 patients were treated with ICI for fewer than two cycles due to the high cost of ICI treatment or other personal reasons, rather than progressive disease or adverse events; 11 patients had received ICI as adjuvant treatment). For further biomarker analysis, archival formalin‐fixed, paraffin‐embedded (FFPE) GBC samples from 31 patients who had previously underwent surgical resection before ICI therapy were obtained (22 patients were treated with ICI in the advanced setting and 9 patients were treated with ICI in the adjuvant setting). The present study was approved by the Institutional Review Board of the Eastern Hepatobiliary Surgery Hospital.
2.2. Assessments
The medical records, including clinical factors, treatment histories, and immune‐related adverse events (irAEs), were independently extracted and reviewed by two physicians. The primary outcome was PFS, which was defined as the time from the initiation of ICI treatment to disease progression or death from any cause. Secondary outcomes included OS, ORR, and disease control rate (DCR). The OS was defined as the time from the initiation of ICI treatment to death from any cause. The ORR was defined as the percentage of patients with a confirmed complete/partial response (CR/PR) as best overall response (BOR). The DCR was defined as the proportion of patients who have had CR/PR or stable disease (SD) as BOR. All tumor responses to ICI were assessed with computed tomography scan or magnetic resonance imaging every 8–9 weeks by a radiologist according to RECIST version 1.1. 10 For patients treated in the adjuvant setting, PFS was defined as the time from the initiation of ICI treatment after curative resection to disease progression or death from any cause. The OS was defined as the time from the initiation of ICI treatment after curative resection to death from any cause. Progressive disease (PD) was defined as disease progression (tumor recurrence) or death from any cause within 12 months from the initiation of ICI treatment after curative resection, and SD was defined as recurrence‐free for at least 12 months.
2.3. Whole exome sequencing
Genomic DNA was extracted from FFPE tumor tissues using the QIAamp DNA FFPE Tissue Kit (Qiagen) following the manufacturer's instructions. All samples were sequenced using the Illumina Novaseq 6000 system according to the manufacturer's instructions at an average depth of 300× by Jiangxi Haplox Clinical Laboratory Center, Ltd. Tumor mutation burden (TMB) scores were calculated from Cancer Sequencing YS panel (CSYS) data for each sample by counting somatic mutations, including coding single nucleotide variants (SNVs) and indels per mega base (Mb) of the sequence examined. Known somatic mutations in the Catalog of Somatic Mutations in Cancer (COSMIC) and known germline polymorphisms in the US NCBI's Single Nucleotide Polymorphism Database (dbSNP) were not counted.
2.4. Immunohistochemical staining
The PD‐L1 and CD8 expression was determined by immunohistochemistry (IHC) with use of the following Abs and the manufacturer's protocol: PD‐L1 (clone E1L3N [Cell Signaling Technology]) and CD8 (clone CD8/144B [Cell Signaling Technology]). Expression of PD‐L1 was calculated by using tumor proportional score (TPS), which was defined as the percentage of viable tumor cells with partial or complete membranous PD‐L1 staining relative to all viable tumor cells present in the sample; TPS ≥ 1% indicates PD‐L1‐positive status. CD8+ T cells within the tumor were counted using HALO image analysis platform (Indica Labs Inc.), and CD8 positivity was then calculated as the percentage of CD8+ T cells relative to all viable cells within the tumor. CD8 positivity >10% was defined as high CD8+ T cell infiltration. Based on the presence of CD8+ T cells and the pattern of infiltration with tumor cells, tumors were classified into three immunophenotypes: immune inflamed, immune excluded, and immune desert. Immune inflamed is defined as CD8+ T cells seen in direct contact with tumor cells. Immune excluded means CD8+ T cells were exclusively seen in stroma immediately adjacent to or within the tumor. Immune desert means the prevalence of CD8+ T cells was very low. 11
2.5. Statistical analysis
All statistical analyses were carried out using SPSS 21.0 software (IBM, SPSS). Survival curves were estimated using the Kaplan–Meier method and compared using a log‐rank test. Univariate and multivariate reporting HRs with 95% CI were determined using the Cox proportional hazards regression model for survival. Odds ratios with 95% CIs were estimated using logistic regression analysis. All p values were two‐sided, and p < 0.05 was considered statistically significant.
3. RESULTS
3.1. Patient characteristics
A flowchart of patient inclusion and study design is presented in Figure 1. From January 2016 to December 2020, a total of 98 patients were screened for eligibility and 69 patients were included. The baseline clinicopathologic characteristics of the patients are listed in Table 1. Thirty‐three patients (47.8%) were male and 36 (52.2%) were female. The median age was 61 years (range, 30–79 years), and 68 patients (98.6%) had an ECOG performance status of 1. Of 69 patients, 31 patients (44.9%) had biliary diseases, 13 patients (18.8%) had previous or current smoking history, and 11 patients (15.9%) had alcohol intake history. Fifty‐nine patients (85.5%) were with TNM stage IV GBC. For previous treatments, 15 patients (21.7%) had received radical surgery, 18 patients (26.1%) had received chemotherapy, and 10 patients (14.5%) had received locoregional therapy (LRT). Thirty‐one (44.9%), 15 (21.7%), and 15 (21.7%) patients had received ICI plus chemotherapy, multitarget tyrosine kinase inhibitors (TKIs) or LRT combination therapy, respectively (detailed therapies combined with ICI are listed in Table S1). Thirty‐two patients (46.4%) were treated with ICI for four cycles or more. For safety, irAEs were observed in 11 patients (15.9%) during ICI treatment (including 3 patients with grade3/4 irAEs) (Table S2).
FIGURE 1.
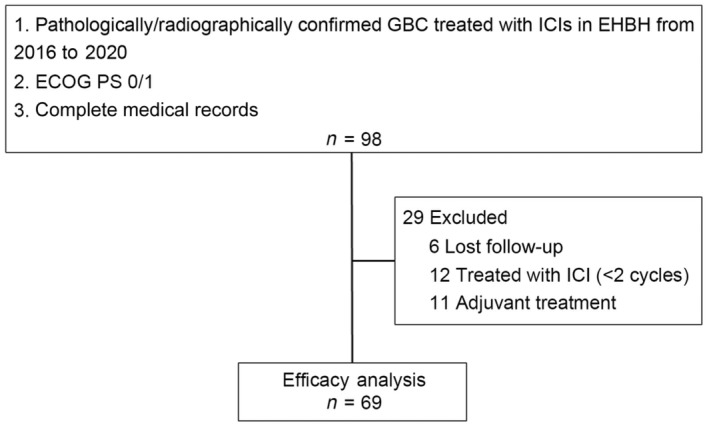
Study flowchart. EHBH, Eastern Hepatobiliary Surgery Hospital; GBC, gallbladder cancer; ICI, immune checkpoint inhibitor; PS, performance status.
TABLE 1.
Baseline characteristics of patients with gallbladder cancer (n = 69).
| Feature | No. (%) |
|---|---|
| Age (years) | |
| ≥60 | 39 (56.5) |
| <60 | 30 (43.5) |
| Gender | |
| Male | 33 (47.8) |
| Female | 36 (52.2) |
| Etiologies | |
| Biliary disease | 31 (44.9%) |
| Cholecystitis | 22 (31.9) |
| Cholangitis | 7 (10.1) |
| Schistosome | 1 (1.4) |
| Gallstones | 26 (37.7) |
| Smoking | 13 (18.8) |
| Alcohol intake | 11 (15.9) |
| ECOG performance status | |
| 0 | 1 (1.4) |
| 1 | 68 (98.6) |
| TBIL (μmol/L) n = 63 | |
| >34.2 | 11 (17.5) |
| ≤34.2 | 52 (82.5) |
| ALT (U/L) n = 63 | |
| >40 | 19 (30.2) |
| ≤40 | 44 (69.8) |
| AST (U/L) n = 58 | |
| >35 | 19 (32.8) |
| ≤35 | 39 (67.2) |
| CEA (U/mL) n = 58 | |
| ≥100 | 11 (19.0) |
| <100 | 47 (81.0) |
| CA19‐9 (U/mL) n = 60 | |
| ≥100 | 28 (46.7) |
| <100 | 32 (53.3) |
| TNM stage | |
| II–III | 10 (14.5) |
| IV | 59 (85.5) |
| Previous treatments | |
| Radical surgery | 15 (21.7) |
| Chemotherapy | 18 (26.1) |
| LRT | 10 (14.5) |
| Combined treatment | |
| Chemotherapy | 31 (44.9) |
| TKIs | 15 (21.7) |
| LRT | 15 (21.7) |
| ICI cycles | |
| ≥4 | 32 (46.4) |
| <4 | 37 (53.6) |
| irAE | |
| Yes | 11 (15.9) |
| No | 58 (84.1) |
Abbreviations: ALT, alanine aminotransferase; AST, aspartate aminotransferase; CA19‐9, carbohydrate antigen 19‐9; CEA, carcinoembryonic antigen; ICI, immune checkpoint inhibitor; irAE, immune‐related adverse event; LRT, locoregional therapy, including radiotherapy, percutaneous microwave coagulation therapy or transarterial chemoembolization; TBIL, total bilirubin; TKI, tyrosine kinase inhibitor.
3.2. Survival
The median PFS and OS was 4.4 months (95% CI, 2.88–6.04) and 8.5 months (95% CI, 6.43–10.56) for GBC patients treated with ICIs, respectively (Figure 2). To identify factors associated with PFS and OS, univariable and multivariable Cox proportional hazard regression analyses were carried out. As noted in Table 2, alcohol intake history (HR 2.679; 95% CI, 1.265–5.671; p = 0.010), carcinoembryonic antigen (CEA) level ≥100 U/mL (HR 5.608; 95% CI, 2.440–12.891; p < 0.001), and cutaneous irAEs (HR 0.120; 95% CI, 0.027–0.520; p = 0.005) were independent prognostic factors for PFS. The median PFS was worse in patients with smoking history (2.6 vs. 5.2 months; p = 0.010), alcohol intake history (2.8 vs. 5.2 months; p = 0.001), and CEA level ≥100 U/mL (2.8 vs. 5.5 months; p = 0.001), while the median PFS was better in patients with cutaneous irAEs (14.5 vs. 3.9 months; p = 0.010) (Figure 3). CEA level ≥100 U/mL (HR 3.825; 95% CI, 1.798–8.136; p ≤ 0.001) and cutaneous irAEs (HR 0.206; 95% CI, 0.050–0.859; p = 0.030) were independent prognostic factors for OS (Table S3). The median OS was worse in patients with CEA level ≥100 U/mL (3.8 vs. 9.4 months; p = 0.001), while the median OS was remarkably improved in patients with cutaneous irAEs (NR vs. 8.1 months; p = 0.022) (Figure S1).
FIGURE 2.
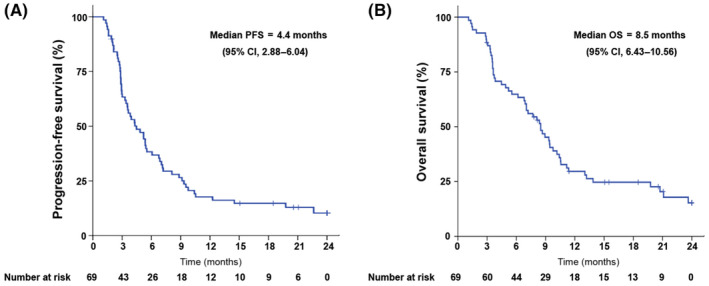
Kaplan–Meier estimates of the (A) progression‐free survival (PFS) and (B) overall survival (OS) of the entire study cohort of gallbladder cancer patients (n = 69). CI, confidence interval.
TABLE 2.
Univariable and multivariable Cox proportional hazards regression model of progression‐free survival in patients with gallbladder cancer.
| Feature | Median survival (months) | Univariable analysis | Multivariable analysis | ||||
|---|---|---|---|---|---|---|---|
| HR | 95% CI | p value | HR | 95% CI | p value | ||
| Age (years) | |||||||
| ≥60 versus <60 | 5.2 vs. 2.9 | 0.639 | 0.383–1.067 | 0.087 | – | – | – |
| Gender | |||||||
| Female vs. male | 4.8 vs. 3.9 | 0.875 | 0.526–1.455 | 0.607 | – | – | – |
| Etiologies | |||||||
| Biliary disease, yes vs. no | 4.8 vs. 3.9 | 0.935 | 0.561–1.561 | 0.798 | – | – | – |
| Smoking, yes vs. no | 2.6 vs. 5.2 | 2.278 | 1.219–4.260 | 0.010 | NA | NA | 0.209 |
| Alcohol intake, yes vs. no | 2.8 vs. 5.2 | 3.081 | 1.545–6.146 | 0.001 | 2.679 | 1.265–5.671 | 0.010 |
| ECOG PS | |||||||
| 1 vs. 0 | 4.4 vs. 3.6 | 0.564 | 0.077–4.148 | 0.574 | – | – | – |
| TBIL (μmol/L) | |||||||
| >34.2 versus ≤34.2 | 2.8 vs. 5.3 | 1.811 | 0.905–3.624 | 0.093 | – | – | – |
| ALT (U/L) | |||||||
| >40 versus ≤40 | 3.5 vs. 5.2 | 1.468 | 0.832–2.590 | 0.185 | – | – | – |
| AST (U/L) | |||||||
| >35 versus ≤35 | 3.5 vs. 5.3 | 1.451 | 0.809–2.601 | 0.211 | – | – | – |
| CEA (U/mL) | |||||||
| ≥100 vs. <100 | 2.8 vs. 5.5 | 3.488 | 1.709–7.119 | 0.001 | 5.608 | 2.440–12.891 | <0.001 |
| CA19‐9 (U/mL) | |||||||
| ≥100 vs. <100 | 4.2 vs. 5.3 | 1.053 | 0.606–1.831 | 0.854 | – | – | – |
| TNM stage | |||||||
| IV vs. III | 4.2 vs. 5.3 | 1.825 | 0.826–4.031 | 0.137 | – | – | – |
| Previous treatments | |||||||
| Radical surgery, yes vs. no | 7.0 vs. 4.3 | 0.515 | 0.259–1.024 | 0.059 | – | – | – |
| Chemotherapy, yes vs. no | 2.9 vs. 4.8 | 0.888 | 0.486–1.620 | 0.698 | – | – | – |
| LRT, yes vs. no | 3.6 vs. 4.8 | 0.756 | 0.357–1.601 | 0.465 | – | – | – |
| First‐line treatment | |||||||
| Yes vs. no | 4.8 vs. 2.9 | 1.036 | 0.575–1.865 | 0.907 | – | – | – |
| Combination | |||||||
| Chemotherapy, yes vs. no | 4.3 vs. 4.4 | 1.310 | 0.786–2.184 | 0.300 | – | – | – |
| TKIs, yes vs. no | 5.3 vs. 4.3 | 0.759 | 0.407–1.614 | 1.415 | – | – | – |
| LRT, yes vs. no | 3.0 vs. 4.4 | 1.305 | 0.727–2.344 | 0.373 | – | – | – |
| irAE | |||||||
| Cutaneous irAEs, yes vs. no | 14.5 vs. 3.9 | 0.213 | 0.066–0.687 | 0.010 | 0.120 | 0.027–0.520 | 0.005 |
| Other irAEs, yes vs. no | 5.3 vs. 4.3 | 1.524 | 0.604–3.847 | 0.372 | – | – | – |
Abbreviations: ALT, alanine aminotransferase; AST, aspartate aminotransferase; CA19‐9, carbohydrate antigen 19‐9; CEA, carcinoembryonic antigen; irAE, immune‐related adverse event; LRT, locoregional therapy; NA, not available; TBIL, total bilirubin; TKI, tyrosine kinase inhibitor.
FIGURE 3.
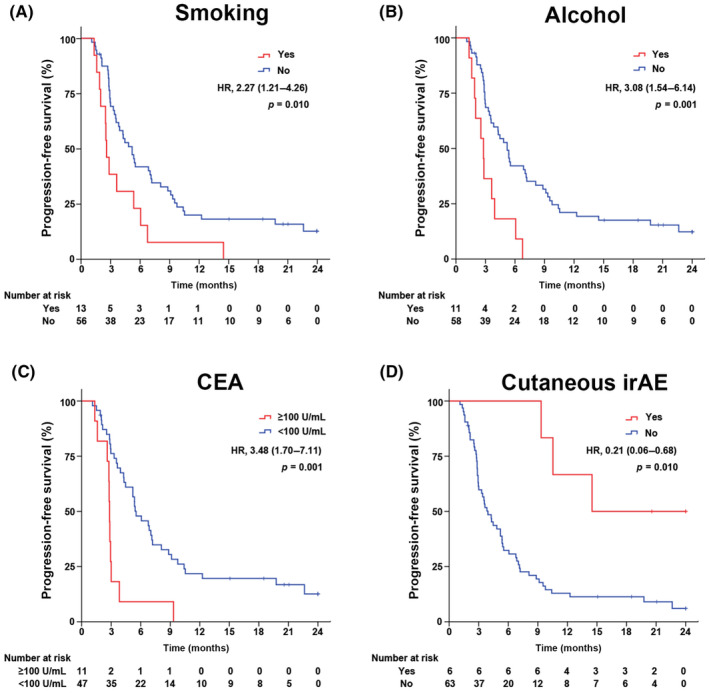
Kaplan–Meier curves are shown for progression‐free survival in gallbladder cancer patients stratified by (A) smoking history, (B) alcohol intake history, (C) carcinoma embryonic antigen (CEA) levels, and (D) cutaneous immune‐related adverse events (irAE). HR, hazard ratio.
3.3. Tumor response
Of the patients enrolled, 1 (1.5%) achieved CR, 10 (14.5%) were PR, 15 (21.7%) were SD, and 43 (62.3%) were PD. The ORR and DCR were 15.9% and 37.7%, respectively. Kaplan–Meier analysis showed that the patients with CR + PR or SD as BOR displayed significantly improved PFS and OS compared with those with PD (Figure S2). The correlations between clinicopathologic characteristics of patients and disease control (CR/PR or SD) are listed in Table S4. The DCR was remarkably higher in patients with cutaneous irAEs (100% [6/6] vs. 31.7% [20/63], p = 0.004) (Table S4). The survival and DCR was comparable between patients treated with ICI in the first line and later lines (Tables 2, S3, and S4). Additionally, the combined therapy of ICI plus chemotherapy, TKIs, or LRT was not associated with improved efficacy compared with ICI monotherapy (Table S4).
3.4. Biomarker analysis
A total of 31 GBC samples were examined for genomic alternations by whole exome sequencing (WES). Among common cancer driver genes, TP53 was the most frequently mutated, in 41.9% of cases (Figure 4A). The TMB of GBCs ranged from 0.38 to 8.08 mutations/Mb, which also did not correlate with disease control of patients (Figure 4A). Additionally, among all the mutated genes, only TMEM184A was significantly associated with disease control of patients (Table S6). Expression of PD‐L1 was examined by IHC staining and assessed with TPS. The positivity of PD‐L1 in tumors was comparable between disease control and disease progression groups (61.5% [8/13] vs. 44.4% [8/18]; p = 0.473) (Figures 4A and S3A and Table S5). In addition, the differences between the survival of patients with PD‐L1‐positive or PD‐L1‐negative GBCs were not statistically significant in the advanced setting (Figure S3B) or adjuvant setting (Figure S3C). However, patients with high CD8+ T cell‐infiltrated GBCs displayed markedly higher DCR (CD8+ T cells high vs. low, 87.5% [7/8] vs. 26.1% [6/23]; p = 0.004) (Figure 4A and Table S5). Higher positivity of CD8+ T cells was also detected in GBCs from the disease control group (Figure 4B). Furthermore, compared with patients with immune excluded/desert GBCs, the DCR was significantly increased in those with immune inflamed GBCs (inflamed vs. excluded/desert, 69.2% [9/13] vs. 22.2% [4/18]; p = 0.013) (Figure 4A,C and Table S5). Accordingly, in the advanced setting, patients with high CD8+ T cell‐infiltrated or immune inflamed GBCs also had a notably improved PFS (Figure 4D), but only patients with immune inflamed GBCs had a significantly improved OS (Figure 4E). In the adjuvant setting, although patients with high CD8+ T cell‐infiltrated or immune inflamed GBCs displayed a better survival, the differences were not significant (Figure S4).
FIGURE 4.
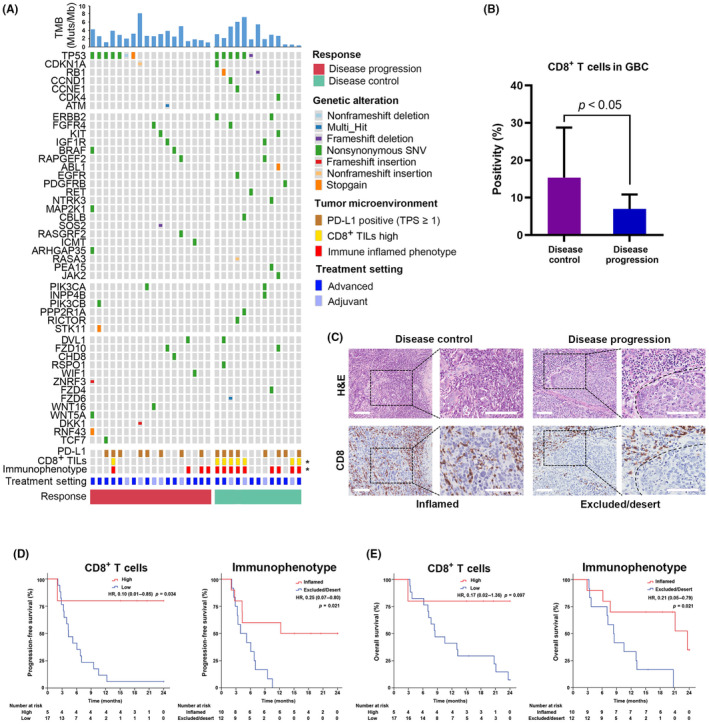
(A) Biomarker determinants of response (disease control vs. disease progression) to immune checkpoint inhibitors (ICIs) in patients with gallbladder cancer (GBC). *p < 0.05 (B) Positivity of CD8+ T cells in GBCs from disease control and disease progression groups. (C) Representative images of immune inflamed phenotype in disease control group and immune excluded/desert phenotype in disease progression group are shown with immunohistochemical staining of CD8+ T cells in GBC tissues. The tumor or stroma area was indicated by H&E staining. Scale bar, 100 μm. (D, E) Kaplan–Meier estimates of (D) progression‐free survival and (E) overall survival of patients treated with ICIs in the advanced setting. Patients were stratified by high or low CD8+ T cell‐infiltrated GBCs or different immune phenotypes. HR, hazard ratio; PD‐L1, programmed death 1 ligand 1; SNV, single nucleotide variant; TIL, tumor‐infiltrating lymphocyte; TMB, tumor mutation burden; TPS, tumor proportional score.
4. DISCUSSION
In recent years, ICIs targeting PD‐1 or PD‐L1 have shown promising efficacy in multiple cancers including BTCs. 12 However, the rarity makes it challenging to initiate trials to assess novel agents or therapies for GBC alone. To our knowledge, the data focusing on the efficacy of ICIs in patients with GBC is still limited. 13 , 14 Herein, we leveraged a retrospective cohort of GBC patients treated with ICIs and reported the median PFS (4.4 months), median OS (8.5 months), ORR (15.9%), and DCR (37.7%), determining the efficacy of ICIs in GBC and revealing potential predictors for ICIs. Hence, our real‐world data marks the most thorough investigation outside of clinical trials to date and could inform current practice and future studies in GBC.
Carcinoma embryonic antigen is a protein–polysaccharide complex present in gastrointestinal tumors, as well as in normal embryonic intestines, pancreas, and biliary tract. 15 It has been used as a common marker for the diagnosis and prognosis prediction of GBC. 16 In this study, we investigated the potential associations between the baseline, on‐treatment measures, and survival, and revealed that high CEA levels were significantly associated with inferior outcome of GBC patients treated with ICIs, suggesting that CEA could be useful in predicting the efficacy of ICIs in GBC.
Epidemiological studies indicate that smoking and alcohol intake were associated with the risk of GBC. 17 , 18 , 19 Alcohol intake was also reported to correlate with the immune escape of cancers. 20 In this study, we first identified the association between alcohol intake history and poor PFS of GBC patients treated with ICIs. Previous studies reported that smoking history was associated with a better outcome in non‐small‐cell lung cancer (NSCLC) patients treated with immunotherapy. 21 , 22 In addition, smoking history predicts high tumor‐infiltrating lymphocyte infiltration and an improved efficacy of immunotherapy in NSCLC patients. 23 However, in this study, smoking history was associated with a poor outcome of GBC patients, suggesting a different role of smoking in GBC patients treated with ICIs, which needs further investigation.
Recently, the combination of ICIs with chemotherapy or multitarget TKIs has shown encouraging results in treating BTCs. 8 , 9 , 24 However, in the subgroup analysis of TOPAZ‐1, durvalumab plus chemotherapy did not improve the OS of patients with GBC compared with chemotherapy alone. 9 Interestingly, we did not find that GBC patients treated with ICIs plus chemotherapy or multitarget TKIs showed a superior outcome compared with ICI monotherapy either. Thus, the optimal ICI‐based combination strategy for GBC remains unclear and indeed needs further investigation.
Immune‐related adverse events are regarded as toxicities resulting from excessive immunity against normal organs, mediated by B or T cells during ICI treatment. 25 Of note, the onset of irAEs was recently reported to correlate with the response and outcome of cancer patients treated with ICIs, 26 , 27 , 28 highlighting the close functional link between antitumor immunity and autoimmunity induced by ICIs. Specifically, cutaneous toxic effects were reported to be associated with superior clinical outcomes in advanced melanoma patients treated with immunotherapy. 29 In accordance with previous studies, our results of patients with cutaneous irAEs (but no other irAE types) had a higher DCR and improved survival also support the association between cutaneous irAEs and clinical benefit of ICIs, suggesting the development of cutaneous irAEs could be a potential prognostic marker for GBC patients treated with ICIs.
The predictive value of PD‐L1 expression for ICI efficacy has only been validated in certain tumor types. 30 , 31 , 32 The association between PD‐L1 expression and clinical benefit of ICIs in BTCs is controversial, 6 , 33 , 34 and the data concerning GBC is still limited. A recent retrospective study revealed that positive PD‐L1 expression might be associated with a longer PFS in advanced GBC patients treated with ICIs plus lenvatinib. 13 However, in our study, PD‐L1 expression was not associated with DCR or survival. The different treatment regimens utilized in our study could account for the inconsistency.
Mismatch repair protein deficiency or microsatellite instability (MSI) is considered to result in increased tumor neoantigen burden, which attracts tumor lymphocyte infiltration. Microsatellite instability is an emerging biomarker in predicting tumor response to immunotherapy. 35 However, MSI‐high was not detected in our samples, probably due to the rare occurrence of MSI in BTCs 36 and limited tumor samples. The present study also assessed the value of genomic mutations and TMB in predicting the response of GBC to ICIs. However, only the mutation of TMEM184A was observed to have a significant association with disease control. TMEM184A is transmembrane heparin protein and mediates anti‐inflammatory responses of endothelial cells. 37 , 38 TMEM184A is also related to the sex determination of germ cells. 39 Published reports about TMEM184A mutation in cancer or immunotherapy are still lacking. No association was observed between other genomic alterations, TMB, and disease control. Thus, the characterization of the molecular basis of GBC response to ICIs remains unsolved. A multicenter prospective assessment of tumor samples from GBC patients treated with ICIs might help to clarify the mechanisms.
Beyond tumor‐intrinsic properties such as PD‐L1 expression and genomic alterations, the tumor immune microenvironment characterized by the infiltration of CD8+ T cells and their spatial phenotypes in tumors (immune inflamed, immune excluded, and immune desert) was also closely linked to the antitumor activity of ICIs. 11 Here, to our knowledge, we first identified that high positivity of CD8+ T cells and inflamed immunophenotype of GBCs closely correlated with higher DCR and superior outcome of patients following ICI therapy, which was independent of PD‐L1 expression, emphasizing that pre‐existing CD8+ T cells and inflamed phenotype could be predictive of benefit to ICI‐based therapies in GBC. Future studies should focus on the mechanisms underlying CD8+ T cell infiltration and distinct immunophenotypes in GBC.
Although the number of GBC patients treated with ICIs herein was higher than any retrospective cohort reported, this study still has several limitations, including its retrospective nature, performance at a single center, and lack of a chemotherapy comparator cohort. In addition, the tumor specimens used in this study were limited. Due to the advanced stage of GBC at diagnosis, not all patients were suitable for surgical resection, nor could they provide sufficient tumor samples for subsequent WES and IHC analysis. In addition, due to the rarity of GBC samples, this study also included samples from patients treated with adjuvant ICIs. Notably, this study provides a unique insight into the value of irAEs in predicting benefit of ICIs in GBC patients, but a potential underestimation of irAEs could have occurred because some mild and transient irAEs might be omitted by patients or doctors during the treatment interval of ICIs, a point that should be closely monitored in prospective studies.
In conclusion, we have determined the real‐world efficacy of ICIs in patients with GBC, and explored the clinicopathologic factors, as well as biomarkers in relation to ICI response and patient outcome, which could help to identify GBC patients who are most likely to benefit from ICIs.
AUTHOR CONTRIBUTIONS
Zhuo Cheng: Formal analysis; funding acquisition; writing – original draft. Cheng Yang: Formal analysis; resources. Qian Zhao: Formal analysis; funding acquisition; methodology. Jingjiao Zhong: Formal analysis; methodology. Jin Zhang: Resources. Riming Jin: Resources. Yao Li: Resources. Na Ta: Methodology. Dong Wu: Resources. Zhengang Yuan: Project administration; supervision. Wen Sun: Conceptualization; funding acquisition; project administration; supervision; writing – review and editing. Ruoyu Wang: Conceptualization; funding acquisition; project administration; supervision.
ACKNOWLEDGMENTS
We thank Yan Zhu and Cui Lu from the department of pathology, Changhai hospital for their technical support.
FUNDING INFORMATION
This work was supported by grants from the National Natural Science Foundation of China (NSFC) (81972777, 81972810, 82373300 and 82003161), Clinical Research Plan of Shanghai Hospital Development Center (SHDC2020CR4040), Program of Science and Technology Commission of Shanghai Municipality (21Y11912600 and 20YF1459600), and Shanghai Municipal Health Commission's Health Industry Clinical Research Project (202140364).
CONFLICT OF INTEREST STATEMENT
The authors declare no conflict of interest.
ETHICS STATEMENTS
Approval of the research protocol by an institutional review board: The study was approved by the Institutional Ethics Committee of Eastern Hepatobiliary Surgery Hospital (approval no. EHBHKY2023‐H012‐P001).
Informed consent: N/A.
Registry and the registration no. of the study/trial: N/A.
Animal studies: N/A.
Supporting information
Figure S1.
Cheng Z, Yang C, Zhao Q, et al. Efficacy and predictors of immune checkpoint inhibitors in patients with gallbladder cancer. Cancer Sci. 2024;115:1979‐1988. doi: 10.1111/cas.16142
Zhuo Cheng, Cheng Yang, Qian Zhao, and Jingjiao Zhong contributed equally to this work.
Contributor Information
Zhengang Yuan, Email: yuanzg@smmu.edu.cn.
Wen Sun, Email: sunwen_sw@aliyun.com.
Ruoyu Wang, Email: wangruoyu1213@126.com.
REFERENCES
- 1. Gamboa AC, Maithel SK. The landmark series: gallbladder cancer. Ann Surg Oncol. 2020;27:2846‐2858. [DOI] [PubMed] [Google Scholar]
- 2. Siegel RL, Miller KD, Fuchs HE, Jemal A. Cancer statistics, 2021. CA Cancer J Clin. 2021;71:7‐33. [DOI] [PubMed] [Google Scholar]
- 3. Valle J, Wasan H, Palmer DH, et al. Cisplatin plus gemcitabine versus gemcitabine for biliary tract cancer. N Engl J Med. 2010;362:1273‐1281. [DOI] [PubMed] [Google Scholar]
- 4. Ribas A, Hamid O, Daud A, et al. Association of pembrolizumab with tumor response and survival among Patients with advanced melanoma. JAMA. 2016;315:1600‐1609. [DOI] [PubMed] [Google Scholar]
- 5. Garon EB, Rizvi NA, Hui R, et al. Pembrolizumab for the treatment of non‐small‐cell lung cancer. N Engl J Med. 2015;372:2018‐2028. [DOI] [PubMed] [Google Scholar]
- 6. Piha‐Paul SA, Oh DY, Ueno M, et al. Efficacy and safety of pembrolizumab for the treatment of advanced biliary cancer: results from the KEYNOTE‐158 and KEYNOTE‐028 studies. Int J Cancer. 2020;147:2190‐2198. [DOI] [PubMed] [Google Scholar]
- 7. Kim RD, Chung V, Alese OB, et al. A phase 2 multi‐institutional study of nivolumab for patients with advanced refractory biliary tract cancer. JAMA Oncol. 2020;6:888‐894. [DOI] [PMC free article] [PubMed] [Google Scholar]
- 8. Li W, Wang Y, Yu Y, et al. Toripalimab in advanced biliary tract cancer. Innovation (Camb). 2022;3:100255. [DOI] [PMC free article] [PubMed] [Google Scholar]
- 9. Oh D‐Y, He AR, Qin S, et al. A phase 3 randomized, double‐blind, placebo‐controlled study of durvalumab in combination with gemcitabine plus cisplatin (GemCis) in patients (pts) with advanced biliary tract cancer (BTC): TOPAZ‐1. J Clin Oncol. 2022;40:378. [Google Scholar]
- 10. Eisenhauer EA, Therasse P, Bogaerts J, et al. New response evaluation criteria in solid tumours: revised RECIST guideline (version 1.1). Eur J Cancer. 2009;45:228‐247. [DOI] [PubMed] [Google Scholar]
- 11. Thomas A, Vilimas R, Trindade C, et al. Durvalumab in combination with olaparib in patients with relapsed SCLC: results from a phase II study. J Thorac Oncol. 2019;14:1447‐1457. [DOI] [PMC free article] [PubMed] [Google Scholar]
- 12. Song X, Hu Y, Li Y, Shao R, Liu F, Liu Y. Overview of current targeted therapy in gallbladder cancer. Signal Transduct Target Ther. 2020;5:230. [DOI] [PMC free article] [PubMed] [Google Scholar]
- 13. Zuo B, Yang X, Yang X, et al. A real‐world study of the efficacy and safety of anti‐PD‐1 antibodies plus lenvatinib in patients with advanced gallbladder cancer. Cancer Immunol Immunother. 2022;71:1889‐1896. [DOI] [PMC free article] [PubMed] [Google Scholar]
- 14. Zheng Q, Wu C, Ye H, et al. Analysis of the efficacy and prognostic factors of PD‐1 inhibitors in advanced gallbladder cancer. Ann Transl Med. 2021;9:1568. [DOI] [PMC free article] [PubMed] [Google Scholar]
- 15. Wen Z, Si A, Yang J, et al. Elevation of CA19‐9 and CEA is associated with a poor prognosis in patients with resectable gallbladder carcinoma. HPB (Oxford). 2017;19:951‐956. [DOI] [PubMed] [Google Scholar]
- 16. Cui X, Zhu S, Tao Z, et al. Long‐term outcomes and prognostic markers in gallbladder cancer. Medicine (Baltimore). 2018;97:e11396. [DOI] [PMC free article] [PubMed] [Google Scholar]
- 17. Alkhayyat M, Abou Saleh M, Qapaja T, et al. Epidemiology of gallbladder cancer in the Unites States: a population‐based study. Chin Clin Oncol. 2021;10:25. [DOI] [PubMed] [Google Scholar]
- 18. Aune D, Vatten LJ, Boffetta P. Tobacco smoking and the risk of gallbladder disease. Eur J Epidemiol. 2016;31:643‐653. [DOI] [PMC free article] [PubMed] [Google Scholar]
- 19. McGee EE, Jackson SS, Petrick JL, et al. Smoking, alcohol, and biliary tract cancer risk: a pooling project of 26 prospective studies. J Natl Cancer Inst. 2019;111:1263‐1278. [DOI] [PMC free article] [PubMed] [Google Scholar]
- 20. Zhang H, Xia Y, Wang F, et al. Aldehyde dehydrogenase 2 mediates alcohol‐induced colorectal cancer immune escape through stabilizing PD‐L1 expression. Adv Sci (Weinh). 2021;8:2003404. [DOI] [PMC free article] [PubMed] [Google Scholar]
- 21. Zhao W, Jiang W, Wang H, He J, Su C, Yu Q. Impact of smoking history on response to immunotherapy in non‐small‐cell lung cancer: a systematic review and meta‐analysis. Front Oncol. 2021;11:703143. [DOI] [PMC free article] [PubMed] [Google Scholar]
- 22. Mo J, Hu X, Gu L, et al. Smokers or non‐smokers: who benefits more from immune checkpoint inhibitors in treatment of malignancies? An up‐to‐date meta‐analysis. World J Surg Oncol. 2020;18:15. [DOI] [PMC free article] [PubMed] [Google Scholar]
- 23. Shimoda Y, Yoshida T, Shirasawa M, et al. Smoking history predicts high presence of TILs and efficacy of PD‐1 blockade in PD‐L1 expression‐negative non‐small cell lung cancer patients. Anticancer Res. 2021;41:5739‐5747. [DOI] [PubMed] [Google Scholar]
- 24. Sun D, Ma J, Wang J, et al. Anti‐PD‐1 therapy combined with chemotherapy in patients with advanced biliary tract cancer. Cancer Immunol Immunother. 2019;68:1527‐1535. [DOI] [PMC free article] [PubMed] [Google Scholar]
- 25. Sullivan RJ, Weber JS. Immune‐related toxicities of checkpoint inhibitors: mechanisms and mitigation strategies. Nat Rev Drug Discov. 2022;21:495‐508. [DOI] [PubMed] [Google Scholar]
- 26. Topalian SL, Hodi FS, Brahmer JR, et al. Five‐year survival and correlates among patients with advanced melanoma, renal cell carcinoma, or non‐small cell lung cancer treated with nivolumab. JAMA Oncol. 2019;5:1411‐1420. [DOI] [PMC free article] [PubMed] [Google Scholar]
- 27. Shafqat H, Gourdin T, Sion A. Immune‐related adverse events are linked with improved progression‐free survival in patients receiving anti‐PD‐1/PD‐L1 therapy. Semin Oncol. 2018;45:156‐163. [DOI] [PubMed] [Google Scholar]
- 28. Rogado J, Sanchez‐Torres JM, Romero‐Laorden N, et al. Immune‐related adverse events predict the therapeutic efficacy of anti‐PD‐1 antibodies in cancer patients. Eur J Cancer. 2019;109:21‐27. [DOI] [PubMed] [Google Scholar]
- 29. Quach HT, Dewan AK, Davis EJ, et al. Association of Anti‐Programmed Cell Death 1 cutaneous toxic effects with outcomes in patients with advanced melanoma. JAMA Oncol. 2019;5:906‐908. [DOI] [PMC free article] [PubMed] [Google Scholar]
- 30. Reck M, Rodriguez‐Abreu D, Robinson AG, et al. Pembrolizumab versus chemotherapy for PD‐L1‐positive non‐small‐cell lung cancer. N Engl J Med. 2016;375:1823‐1833. [DOI] [PubMed] [Google Scholar]
- 31. Cohen EEW, Soulieres D, Le Tourneau C, et al. Pembrolizumab versus methotrexate, docetaxel, or cetuximab for recurrent or metastatic head‐and‐neck squamous cell carcinoma (KEYNOTE‐040): a randomised, open‐label, phase 3 study. Lancet. 2019;393:156‐167. [DOI] [PubMed] [Google Scholar]
- 32. Zhou ZQ, Zhao JJ, Pan QZ, et al. PD‐L1 expression is a predictive biomarker for CIK cell‐based immunotherapy in postoperative patients with breast cancer. J Immunother Cancer. 2019;7:228. [DOI] [PMC free article] [PubMed] [Google Scholar]
- 33. Ueno M, Ikeda M, Morizane C, et al. Nivolumab alone or in combination with cisplatin plus gemcitabine in Japanese patients with unresectable or recurrent biliary tract cancer: a non‐randomised, multicentre, open‐label, phase 1 study. Lancet Gastroenterol Hepatol. 2019;4:611‐621. [DOI] [PubMed] [Google Scholar]
- 34. Lee SH, Lee HS, Lee SH, Woo SM, Kim DU, Bang S. Efficacy and safety of pembrolizumab for gemcitabine/cisplatin‐refractory biliary tract cancer: a multicenter retrospective study. J Clin Med. 2020;9:1769. [DOI] [PMC free article] [PubMed] [Google Scholar]
- 35. O'Malley DM, Bariani GM, Cassier PA, et al. Pembrolizumab in patients with microsatellite instability‐high advanced endometrial cancer: results from the KEYNOTE‐158 study. J Clin Oncol. 2022;40:752‐761. [DOI] [PMC free article] [PubMed] [Google Scholar]
- 36. Winkelmann R, Schneider M, Hartmann S, et al. Microsatellite instability occurs rarely in patients with cholangiocarcinoma: a retrospective study from a German tertiary care hospital. Int J Mol Sci. 2018;19:1421. [DOI] [PMC free article] [PubMed] [Google Scholar]
- 37. Pugh RJ, Slee JB, Farwell SL, et al. Transmembrane protein 184A is a receptor required for vascular smooth muscle cell responses to heparin. J Biol Chem. 2016;291:5326‐5341. [DOI] [PMC free article] [PubMed] [Google Scholar]
- 38. Farwell SL, Kanyi D, Hamel M, et al. Heparin decreases in tumor necrosis factor alpha (TNFalpha)‐induced endothelial stress responses require transmembrane protein 184A and induction of dual specificity phosphatase 1. J Biol Chem. 2016;291:5342‐5354. [DOI] [PMC free article] [PubMed] [Google Scholar]
- 39. Best D, Sahlender DA, Walther N, Peden AA, Adams IR. Sdmg1 is a conserved transmembrane protein associated with germ cell sex determination and germline‐soma interactions in mice. Development. 2008;135:1415‐1425. [DOI] [PMC free article] [PubMed] [Google Scholar]
Associated Data
This section collects any data citations, data availability statements, or supplementary materials included in this article.
Supplementary Materials
Figure S1.