Abstract
Triple‐negative breast cancer (TNBC) exhibits heightened aggressiveness compared with other breast cancer (BC) subtypes, with earlier relapse, a higher risk of distant metastasis, and a worse prognosis. Transcription factors play a pivotal role in various cancers. Here, we found that factor forkhead box M1 (FOXM1) expression was significantly higher in TNBC than in other BC subtypes and normal tissues. Combining the findings of Gene Ontology (GO) enrichment analysis and a series of experiments, we found that knockdown of the FOXM1 gene attenuated the ability of TNBC cells to proliferate and metastasize both in vivo and in vitro. In addition, Spearman's test showed that FOXM1 significantly correlated with glycolysis‐related genes, especially centromere protein A (CENPA) in datasets (GSE76250, GSE76124, GSE206912, and GSE103091). The effect of silencing FOXM1 on the inhibition of CENPA expression, TNBC proliferation, migration, and glycolysis could be recovered by overexpression of CENPA. According to MeRIP, the level of m6A modification on FOMX1 decreased in cells treated with cycloleucine (a m6A inhibitor) compared with that in the control group. The increase in FOXM1 expression caused by YTHDC1 overexpression could be reversed by the m6A inhibitor, which indicated that YTHDC1 enhanced FOXM1 expression depending on m6A modification. Therefore, we concluded that the YTHDC1‐m6A modification/FOXM1/CENPA axis plays an important role in TNBC progression and glycolysis.
Keywords: CENPA, FOXM1 transcription factor, glycolysis, TNBC, YTHDC1‐dependent m6A modification
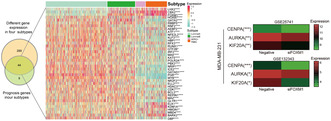
Using bioinformatics and in vivo and in vitro experiments, we identified that the YTHDC1‐dependent m6A/FOXM1/CENPA axis is involved in the regulation of glycolysis and the progression of TNBC. This discovery provides new insight into the molecular interactions driving TNBC and potential therapeutic targets for combating this aggressive cancer.
Abbreviations
- BC
breast cancer
- CENPA
centromere protein A
- FOXM1
forkhead box M1
- GO
Gene Ontology
- m6A
N 6‐methyladenosine
- TFs
transcription factors
- TNBC
triple‐negative breast cancer
1. INTRODUCTION
Breast cancer is the most common cancer among women and can be classified into three major subtypes: luminal‐like, HER2‐positive, and TNBC. 1 TNBC accounts for approximately 15%–20% of all BC cases and exhibits heightened aggressiveness compared with other BC subtypes, increasing the incidence of early relapse, treatment resistance, and distant metastasis, with a 5‐year overall survival rate below 35%. 2 Additionally, patients who were diagnosed with TNBC hardly benefit from endocrine treatment or HER2‐targeted therapies due to the absence of relevant receptor markers. 3 , 4 Consequently, it is imperative to identify novel molecular biomarkers that regulate biological processes and the development of TNBC, thereby facilitating the discovery of new targeted therapies specifically tailored for TNBC.
Transcription factors typically bind to promoter sequences to regulate downstream target gene expression. 5 The abnormal activity of TFs has long been recognized in cancer development, which is associated with aberrant gene expression and metabolic reprogramming. 6 , 7 The transcription factor FOXM1 is a member of the forkhead box (Fox) protein superfamily. 8 Recent studies have demonstrated that FOXM1 is regarded as a major predictor of adverse outcomes across 39 human malignancies through multiple mechanisms. 9 FOXM1 can activate signaling pathways such as Wnt/beta‐catenin and Raf/MEK/ERK to enhance cell growth, metastasis, and EMT. 10 , 11 In addition, growing evidence suggests that FOXM1 is involved in the regulation of cellular metabolism. 12 For instance, overexpression of FOXM1 is associated with increased glycolysis in various cancers including ovarian cancer, and myeloma. 13 , 14 , 15 Nevertheless, in TNBC, the role of FOXM1 in glycolysis and its underlying mechanisms remain poorly elucidated.
Aerobic glycolysis, also known as the “Warburg effect,” is a critical metabolic alteration that enables rapid tumor growth even under conditions of limited nutrient availability. 16 Numerous studies have identified the genes involved in the regulation of glycolysis. For instance, GLUT1 promotes glycolysis and prostate cancer progression. 17 Moreover, the Molecular Signatures Database (MSigDB) has assembled 200 genes encoding proteins associated with glycolysis, collectively referred to as HALLMARK_GLYCOLYSIS gene sets, which could be utilized to depict glycolysis in tumors. 18 CENPA is one of the HALLMARK_GLYCOLYSIS genes that has been reported to promote glycolysis in colon cancer cells, and is considered a novel prognostic risk predictor for human hepatocellular carcinoma. 19 , 20 However, no studies have been conducted to identify whether FOXM1 could regulate glycolysis through modulating CENPA expression in TNBC. Therefore, this study aimed to investigate this subject.
m6A is considered the most prevalent modification of mRNAs in eukaryotes, and plays a crucial role in regulating FOXM1 mRNA. 21 , 22 For instance, ALKBH5 has been found to increase FOXM1 expression through demethylating FOXM1 in glioblastoma stem‐like cells. 23 Additionally, ALKBH5 has been demonstrated as an m6A eraser of FOXM1 in uveal melanoma, lung adenocarcinoma, and oral squamous cell carcinoma. 24 , 25 , 26 The m6A writer KIAA1429 was also implicated in the development of gastric cancer by stabilizing FOXM1 mRNA. 27 YTHDC1, an m6A reader, had not been reported an association with FOXM1 expression. Therefore, we hypothesis that YTHDC1 modulates FOXM1 expression in an m6A‐dependent manner in TNBC.
The primary objective of this study was to investigate the biological functions and underlying regulation mechanisms of FOXM1 in TNBC by integrating the bioinformatics analysis and in vivo and in vitro experiments, to provide new insights into the molecular interactions driving TNBC and potential therapeutic targets for combating this aggressive cancer.
2. METHOD
2.1. Data collection and preprocessing
We obtained data for 355 human TFs and their corresponding target genes from the hTFtarget website. 28 For our study, we collected 12 datasets from the Gene Expression Omnibus (GEO) platform. Detailed information regarding the datasets used in this study is provided in Table S1.
We acquired the gene transcription profile and clinical information of breast cancer and normal tissue samples from The Cancer Genome Atlas (TCGA) Program using the TCGAbiolinks R package, and BC samples from the METABRIC dataset (https://www.cbioportal.org/).
Before analyzing the data, we preprocessed the data using robust multiarray analysis, as previously described. 29
2.2. Analysis of glycolysis using ssGSEA algorithm and Spearman's correlation
The enrichment score of HALLMARK_GLYCOLYSIS was calculated by the ssGSEA algorithm to investigate the relationship with FOXM1 expression by Spearman's test. Spearman's test also identified the correlation between the FOXM1 and the genes from HALLMARK_GLYCOLYSIS (https://www.gsea‐msigdb.org/gsea/msigdb/human/search.jsp.).
2.3. Clinical samples of patients with TNBC
In total, 64 pairs of TNBC and adjacent para‐carcinoma tissues were collected from the Wuhan Fourth Hospital, Wuhan, China. All patients were confirmed to have only one form of cancer through pathological examination and had not undergone any chemoradiotherapy prior to surgery. After surgical resection, fresh specimens were immediately frozen in liquid nitrogen and stored at −80°C. The study was approved by the Ethics Committee of the Wuhan Fourth Hospital, and all participants provided written informed consent.
2.4. Cell culture
All the cell lines were cultured with 10% fetal bovine serum (FBS, Gibco) and were incubated at 37°C under humidified conditions with 5% CO2.
2.5. Transfection and agents
Lentiviruses containing a specific short hairpin RNA (LV‐shFOXM1#1, LV‐shFOXM1#2) or a negative control sequence (LV‐NC) and the plasmids, including CENPA‐OE (overexpression), YTHDC1‐OE, and control, were purchased from GenePharma. The plasmids were transfected into cells using Lipofectamine 3000 (Invitrogen, USA), following the manufacturer's protocol. The sequences of lentiviruses are listed in Table S2.
Cycloleucine was purchased from Sigma‐Aldrich and used to inhibit m6A modification in cells as previously described. 30
2.6. Quantitative real‐time polymerase chain reaction (qRT‐PCR)
Total RNA was extracted using RNAiso Plus (TaKaRa, Kyoto, Japan). The qRT‐PCR was carried out and analyzed as previously described. 31 Detailed information on the primer sequences used in this study is provided in Table S2.
2.7. Immunofluorescence assay
The cells were fixed with 4% paraformaldehyde for 15 min at room temperature, permeabilized with 0.5% Triton X‐100, and blocked with 5% FBS. Subsequently, the cells were stained with phalloidin (Servicebio) for 2 h in the dark at room temperature and counterstained with DAPI (Servicebio) for 10 min. An antifade solution was used to prevent quenching. Images were captured using fluorescence microscopy.
2.8. Immunohistochemistry (IHC)
Immunohistochemistry was performed as described previously. 32 Tissues obtained from patients with TNBC and mice were fixed with 4% paraformaldehyde and embedded in paraffin. After dewaxing, dehydration, and thermal repair of the antigen, the slices were incubated with 3% hydrogen peroxide and 5% BSA for 20 and 40 min, followed by incubation with specific antibodies.
2.9. Western blot assay
Total proteins were extracted using RIPA lysis buffer (Servicebio), separated on 10% SDS‐PAGE, transferred to PVDF membranes (Millipore), and then incubated with primary antibodies at 4°C overnight (Table S3). After incubating the membrane with secondary antibodies (Santa Cruz Biotechnology), it was examined using the ECL reagent (BeyoECL Plus).
2.10. Cell proliferation assay
Cell Counting Kit‐8 (CCK‐8, AbMole) and colony formation assays were performed as described previously. 33
2.11. Invasion and migration assays
Wound healing and transwell assays were performed as previously described. 34
2.12. Glucose uptake assay
Glucose uptake was assessed using a Glucose Uptake Colorimetric Assay Kit (Abcam, Cambridge, UK) following the manufacturer's protocol. Approximately 1–2 × 10⁴ treated cells were seeded in 96‐well plates at 37°C overnight, pre‐incubated with 2% BSA and KRPH buffer for 40 min. Next, 10 μL of 2‐DG (10 mM) was added to each well for 20 min. Reaction and extraction buffers were prepared to determine the glucose uptake at a wavelength of 412 nm.
2.13. Detection of extracellular acidification rate (ECAR) and oxygen consumption rate (OCR)
Approximately 5 × 10⁴ cells per well were seeded into Agilent Seahorse XFe96 plates, incubated for 8 h without CO2, and starved for an additional hour in glucose‐free medium‐containing treatments. The ECAR and OCR were measured using a glycolytic stress test kit (103020; Agilent Technologies) and a cell mito stress test kit (103015; Agilent Technologies).
2.14. Chromatin immunoprecipitation assay (ChIP)
The EZ‐ChIP™ Chromatin Immunoprecipitation Kit (Millipore, Billerica, MA, USA) was used for the ChIP assay following the manufacturer's instructions. Briefly, cells were cross‐linked, lysed with RIPA buffer and an ultrasonic instrument was used to obtain 300–500 bp DNA fragments. The Dynabeads protein G (Thermo Fisher Scientific) was rotated with cell lysates and the corresponding antibody at 4°C overnight. qRT‐PCR was performed to detect the enriched DNA regions.
2.15. Luciferase reporter assay
After transfecting the wild‐type and mutant‐type luciferase vector (GenePharma) into cell lines, a Dual‐Luciferase Reporter Assay Kit (Beyotime, RG027) was used to measure luciferase activity.
2.16. Dot blot assay
RNA was isolated as described above, and the RNA concentration was determined using a NanoDrop spectrometer. Equal amounts of RNA were spotted on nylon membranes (GE Healthcare). The membranes were subsequently UV‐crosslinked following the step described previously. 35
2.17. MeRIP‐PCR assay
The level of m6A modifications in the target mRNA was determined using the MeRIP‐PCR assay. The 10× Fragment buffer (800 RNase‐Water, 100 μL Tris–HCl, and 100 μL of 1 M ZnCl2) was mixed to split the RNA into 100–200‐bp fragments. This was followed by incubation in 1 mL buffer containing 200 U/mL RNase inhibitor, 10 mM Tris–HCl, 150 mM NaCl, and 0.1% NP‐40 for 1 h at 4°C. Subsequently, the solution was conjugated with an antibody and incubated overnight at 4°C. Methylated RNA was immunoprecipitated using beads, eluted by competing with free m6A, and recovered using an RNeasy kit (Qiagen).
2.18. Mouse models for tumor metastasis
To establish a breast tumor metastasis model, 36 eight female BALB/c mice at the age of 4 weeks were purchased from Chengdu Gembio Co., Ltd. (Chengdu, China). The mice were divided randomly into two groups, and 4T1 mouse TNBC cell lines (LV‐NC and LV‐shFOXM1) were injected into the mammary glands. At 4 weeks later, the mice were intraperitoneally injected with d‐luciferin sodium (Beyotime, ST196) and photographed using a small‐animal imager. All animal procedures were conducted in compliance with ethical standards and approved by the Animal Care Committee of Sichuan University.
2.19. Bioinformatics and statistical analysis
Most of the statistical analyses mentioned below were conducted using R‐4.3.1 software. Univariate regression analysis and the corresponding Kaplan–Meier curves were performed using the survival and the ggsurvplot R package to select prognostic transcription factors. The chi‐squared test was performed through the stat R packages. The preprocessed data used the limma R package (|Foldchange| > 1, p‐value < 0.05) to identify differentially expressed genes (DEGs). GO enrichment analysis used the Cluster Profile R package. Additionally, Masc2 was used for peak calling in MDA‐MB‐231 m6A‐seq with a false discovery rate (FDR) < 0.05. All data were obtained from at least three independent experiments as mean ± standard deviation (SD) using GraphPad Prism7. The Kruskal–Wallis test and Student's t‐test were used to compare the multiple groups and two groups. Statistical significance was set at p < 0.05 (*p < 0.05; **p < 0.01; ***p < 0.001; ****p < 0.0001).
3. RESULTS
3.1. Identification of the characteristics of transcription factor FOXM1 in TNBC
To investigate the crucial TFs in TNBC, we identified 44 TFs with a differential expression that were significantly associated with prognosis across the four subtypes of BC from the hTFtarget dataset (Figure 1A). Additionally, a violin plot demonstrated that four TFs (KDM1A, BARX2, ELK1, and FOXM1) were significantly upregulated, whereas 12 TFs were specifically downregulated in TNBC compared with the other three subtypes (Figure 1B, Figure S1A). Among the upregulated TFs, KDM1A, ELK1, and FOXM1 showed significantly higher expression in TCGA‐TNBC than in the normal tissues (p < 0.05), whereas only FOXM1 showed the same result in the GSE61725 validation dataset (p < 0.05; Figure 1C,D). The Kaplan–Meier curve demonstrated that higher FOXM1 expression was associated with worse prognosis in TNBC and METABRIC cohorts (HR > 1, p < 0.05; Figure 1E). Furthermore, the pie plot revealed that FOXM1 expression positively correlated with the clinical characteristics such as the number of metastatic lymph nodes and had no significant correlation with age, race, tumor size, or stage of TNBC patients (chi‐squared test p < 0.05; Figure 1F). Therefore, considering the results of the bioinformatics analysis, FOXM1 was identified as a pivotal TF in TNBC.
FIGURE 1.
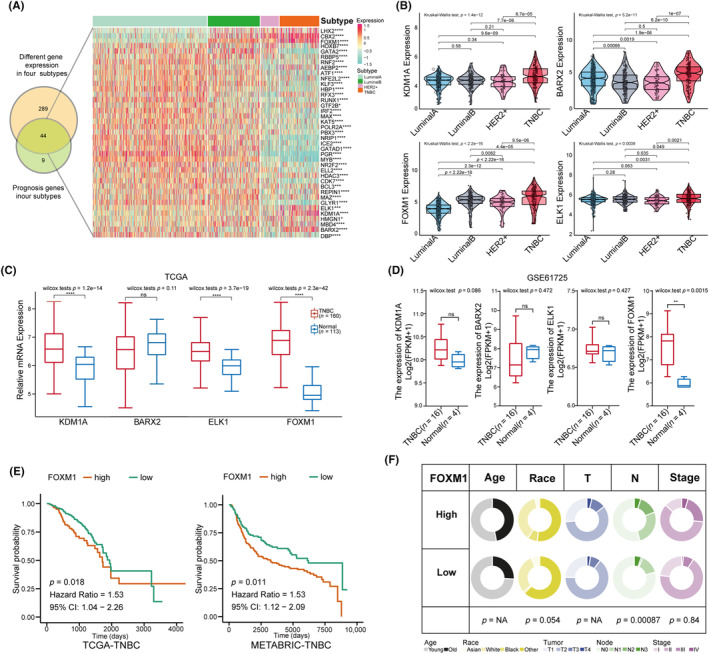
Identification of significantly different expression of transcript factors (TFs), especially FOXM1 in triple‐negative breast cancer (TNBC). (A) Venn diagram intersecting the genes among 355 TFs differentially expressed in four BC subtypes and 53 prognostics TFs in four BC subtypes; the heatmap displays the 44 intersection TF genes in four BC subtypes. (B) Violin plots displaying a higher expression of four TFs in TNBC compared with other three subtypes (Kruskal–Wallis test analyzed for multiple groups and Student's t‐test used for two groups). (C, D) Box plots showing the differential expression of the KDM1A, BARX2, ELK1 and FOXM1 in TCGA data (TNBC‐TCGA vs. Normal‐TCGA) and validation data GSE61725 (TNBC vs. Normal). (E) Comparison of the overall survival between high and low FOMX1 groups in TCGA‐TNBC and in METABRIC‐TNBC cohorts with Kaplan–Meier curves. (F) Pie plots exhibiting the association between FOXM1 expression and clinical characteristics including age, race, tumor size, numbers of lymph nodes and tumor stage in the TNBC‐TCGA cohort using the chi‐squared test. Results are displayed as *p < 0.05, **p < 0.01, ***p < 0.001.
3.2. Validation of FOXM1 expression in TNBC samples and cell lines
qRT‐PCR analysis revealed higher expression of FOXM1 mRNA in 64 TNBC tissues than in the corresponding adjacent tissues (Figure 2A). Western blotting confirmed the upregulated expression of FOXM1 protein in the four TNBC samples compared with paired normal tissue (Figure 2B). The IHC assay confirmed a higher FOXM1 protein expression in TNBC tissue samples (Figure 2C). FOXM1 expression was detected in BC cell lines, with significantly higher levels observed in TNBC cell lines when compared with other BC cell lines (Figure S2A,B). Furthermore, RT‐qPCR and western blotting detected the highest expression of FOXM1 mRNA and protein, respectively, in the two TNBC cell lines (MDA‐MB‐231 and MDA‐MB‐468) than other cell lines (Figure 2D). Additionally, the immunofluorescence (IF) results demonstrated that FOXM1 is distributed mainly in the nucleus (Figure 2E). To explore its biological functions in TNBC, a bubble plot was used to display the results of the GO analysis with FOXM1. The results indicated that FOXM1 was positively related to various biological processes, including cell growth (GO:0016049), regulation of glucose metabolic processes (GO:0010906), regulation of cell–cell adhesion (GO:0022407), and positive regulation of DNA repair (GO:0045296) (Figure 2F).
FIGURE 2.
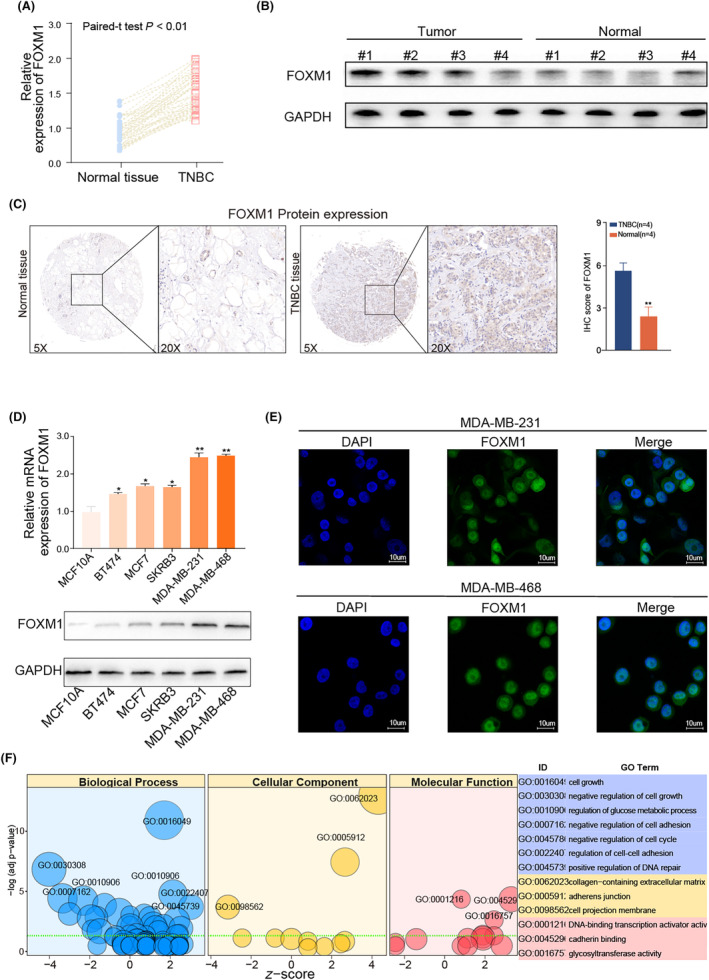
FOXM1 expression is upregulated in TNBC samples and TNBC cell lines. (A) qRT‐PCR assay showing the increased expression of FOXM1 mRNA in TNBC tissue samples compared with the adjacent tissue (n = 64). (B) Western blot assay showing higher FOXM1 protein levels in eight representative TNBC samples compared with adjacent tissue. (C) Representative IHC images of FOXM1 protein expression in TNBC tissues and adjacent tissue. (D) qRT‐PCR assay and western blot assay showing the expression of FOXM1 among normal epithelial cell (MCF10A) and four subtypes of breast cancer cell lines. (E) Representative immunofluorescence imaging of FOXM1 expression and the subcellular localization was observed by fluorescence microscopy. (F) GO function analysis with FOXM1 in TNBC samples from TCGA database. Results are displayed as mean ± SD. *p < 0.05, **p < 0.01, ***p < 0.001.
3.3. FOXM1 promotes TNBC cell growth and metastasis
To verify the potential biological functions of FOXM1 in TNBC, we first validated the knockdown efficiency of LV‐shFOXM1 in TNBC cell lines (Figure S2C,D). Then, we conducted proliferation and colony formation assays, which revealed a significant inhibition of cell growth in TNBC cell lines (MDA‐MB‐231 and MDA‐MB‐468 cell line) with LV‐shFOXM1#1 and LV‐shFOXM1#2 compared with LV‐NC groups (Figure 3A,B). Moreover, the knockdown of FOXM1 expression also significantly reduced cell migration and invasion (Figure 3C,D). Considering the more efficient knockdown of FOXM1 mRNA expression, we utilized LV‐FOXM1#1 transfected cells for subsequent experiments. Images of the metastatic mouse model representing the LV‐NC and LV‐shFOXM1#1 groups (4T1 cell line) are presented in Figure 3E. By observing the tumor volume over 28 days, we found that tumor growth was significantly more aggressive in the LV‐NC group than in the LV‐shFOXM1#1 group (Figure 3F). Additionally, the LV‐NC group had heavier tumors and a greater number of lung metastases, indicating that FOXM1 promoted TNBC development by inducing cell growth and metastasis both in vivo and in vitro (Figure 3G–J). We also observed that FOXM1 influenced the cell cycle (Figure S2E).
FIGURE 3.
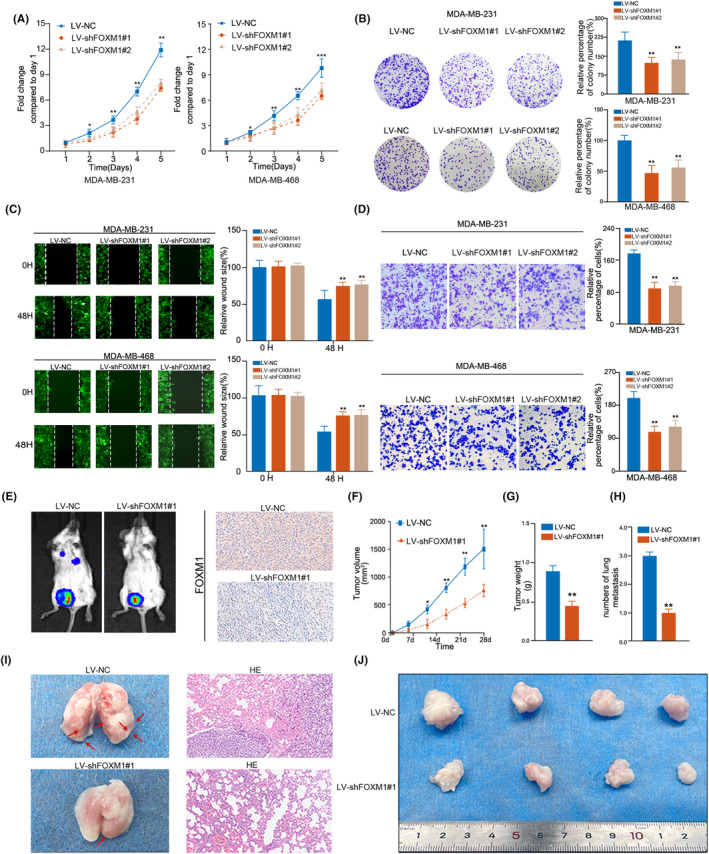
Inhibiting FOXM1 reduces proliferation and migration in TNBC cell lines. (A) Knockdown of FOXM1 suppressed the proliferation capability of MDA‐MB‐231 and MDA‐MB‐468 cells using the CCK‐8 assay. (B) Knockdown of FOXM1 suppressed the colony formation of MDA‐MB‐231 and MDA‐MB‐468 cells. (C, D) Knockdown of FOXM1 suppressed the migration and invasion rate of MDA‐MB‐231 and MDA‐MB‐468 cells using a wound healing assay and a transwell assay. (E) Representative images of metastases in mice injected with 4T1 transfected with LV‐NC and LV‐shFOXM1 groups. (F) The tumor volume in a mouse metastasis model of indicated groups was measured every fifth day. (G, H) Knockdown of FOXM1 reduced the weight of tumors and numbers of lung metastasis in a mouse metastasis model. Tumors were measured the tumor weight and numbers of metastases for mice sacrificed after 4 weeks. (I) Representative hematoxylin and eosin (HE) staining images of lung metastases in two groups, in which cells were transfected with LV‐NC and LV‐shFOXM1. (J) Images present the xenografts formed by subcutaneous injection of TNBC cell lines transfected with LV‐NC and LV‐shFOXM1 after mice were sacrificed. Results are displayed as the mean ± SD. *p < 0.05, **p < 0.01, ***p < 0.001.
3.4. FOXM1 regulates glycolysis‐related genes
Delving into the regulatory role of FOXM1 in glycolysis within TNBC, we observed a positive correlation between FOXM1 mRNA expression and HALLMARK_GLYCOLYSIS enrichment scores using Spearman's test in four datasets (GSE103909, GSE76124, GSE76250, and GSE206912) (|r| > 0.2, p < 0.05; Figure 4A). Additionally, the correlation heatmap revealed that the expression of 20 glycolysis‐related genes from the HALLMARK_GLYCOLYSIS gene set was significantly correlated with FOXM1 expression in these datasets (|r| > 0.2, p < 0.05; Figure 4B). A Venn diagram showed three intersecting glycolysis‐related genes (CENPA, AURKA, KIF20A) that were considered targets of FOXM1 (Figure 4C). The heatmap displayed the differential expression of these three genes between untreated and FOXM1 knockdown MDA‐MB‐231 cells in GSE25741 and GSE132343 (Figure 4D). To validate this finding, we performed qRT‐PCR and observed a significant decrease in mRNA expression of these three genes in LV‐shFOXM1#1 cell lines, particularly that of CENPA (p < 0.05; Figure 4E). We also discovered that the expression of CENPA protein was reduced after silencing FOXM1, and restored through CENPA overexpression (Figure 4F,G). These results were also confirmed by IF analysis (Figure 4H). Taken together, these findings strongly supported the hypothesis that FOXM1 regulates CENPA expression in TNBC cells.
FIGURE 4.
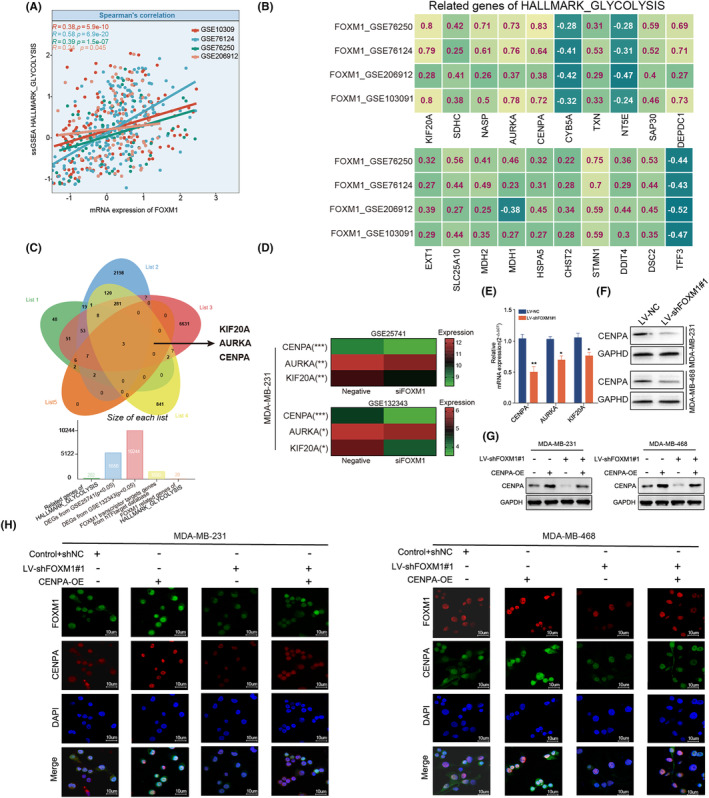
The regulation of FOXM1 in glycolysis‐related genes. (A) Scatter plot showing the correlation between FOXM1 expression and enrichment score of HALLMARK_GLYCOLYSIS using ssGSEA in five datasets. (B) Spearman's Rho showed that the FOXM1 expression correlated with 20 glycolysis‐related genes in a HALLMARK_glycolysis geneset across four different GEO datasets. (C) Venn diagram indicating the three intersecting genes (KIF20A, AURKA and CENPA) from gene lists including two differentially expressed genes (DEGs) from GSE25741 and GSE132343, target genes of FOXM1 from hTFtargeted database and glycolysis‐related genes sets. (D) Heatmap showing the differential expression of CENPA, AURKA and KIF20A between untreated and silencing FOXM1 MDA‐MB‐231 cell line. (E) qRT‐PCR comparing the mRNA expression of KIF20A, AURKA and CENPA in LV‐shFOXM1 and LV‐NC TNBC cell lines. (F) Western blot comparing the protein expression of KIF20A, AURKA and CENPA in LV‐sh FOXM1 and LV‐NC TNBC cell lines. (G, H) Rescue experiments of western blot and immunofluorescence showing that CENPA overexpression recovered the CENPA protein expression in LV‐shFOXM1 cell lines. Results are displayed as mean ± SD. *p < 0.05, **p < 0.01, ***p < 0.001.
3.5. FOXM1 regulates cell growth, metastasis, and glycolysis through binding with CENPA promoter
The results of the proliferation and colony formation assays demonstrated that FOXM1 knockdown contributed to the inhibition of cell growth, which could be rescued by increased expression of CENPA in TNBC cell lines (Figure 5A,B). This trend was consistently observed in the wound healing and transwell assays (Figure 5C,D). Furthermore, the rescue experiments indicated that ECAR was increased in CENPA‐OE cells, whereas LV‐shFOXM1 expression reversed the effects of CENPA‐OE in TNBC (Figure 5E). Conversely, the results of the OCR assay exhibited an opposite effect (Figure S3A). Collectively, these findings support the notion that FOXM1 promotes cell growth, migration, invasion, and glycolysis through its regulation of the downstream gene CENPA in TNBC.
FIGURE 5.
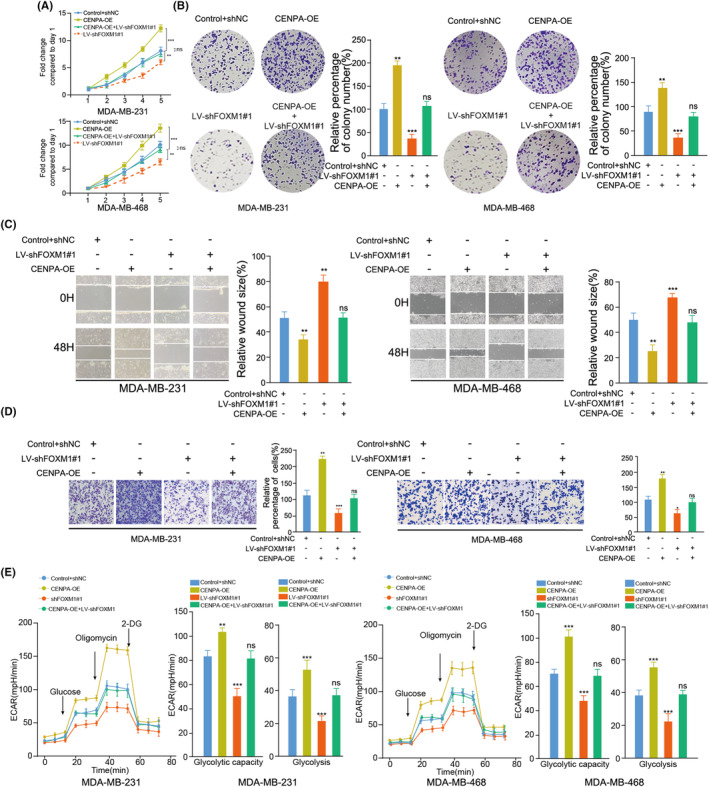
FOXM1 promotes the tumor cell growth, invasion and glycolysis by upregulating CENPA expression. (A‐B) Overexpression of CENPA recovered the effects of silencing FOXM1 on inhibiting the proliferation and colony formation capability of MDA‐MB‐231 and MDA‐MB‐468 cells using CCK‐8 assay and colony formation assay. (C, D) Overexpression of CENPA recovered the effects of silencing FOXM1 on the migration and invasion rate of MDA‐MB‐231 and MDA‐MB‐468 cells using a wound healing assay and transwell assay. (E) Overexpression of CENPA recovered the effects of silencing FOXM1 on the change of ECAR levels using the ECAR assay. Glucose (10 mmol/L), oligomycin (2 μmol/L), or 2‐deoxyglucose (2‐DG, 50 mmol/L) were used at the indicated points. Results are displayed as the mean ± SD. *p < 0.05, **p < 0.01, ***p < 0.001.
Next, we selected the top two sites with the highest scores as potential binding sites between FOXM1 and the CENPA promoter predicted by Contra3.0 (Figure 6A). We then conducted ChIP assays and confirmed the binding of the FOXM1 antibody to site 1 in both MDA‐MB‐231 and MDA‐MB‐468 cells (Figure 6B). Additionally, luciferase activity resulted from transfecting wild‐type and mutant site 1 luciferase reporter plasmids into TNBC cell lines, which indicated significant activation of the promoter by FOXM1 in the wild‐type group compared with the site 1 mutated group (Figure 6C). Moreover, the transcriptional activity of the wild‐type plasmid relied on FOXM1 expression, as demonstrated by the comparison between cells with and without FOXM1 knockdown (Figure 6D).
FIGURE 6.
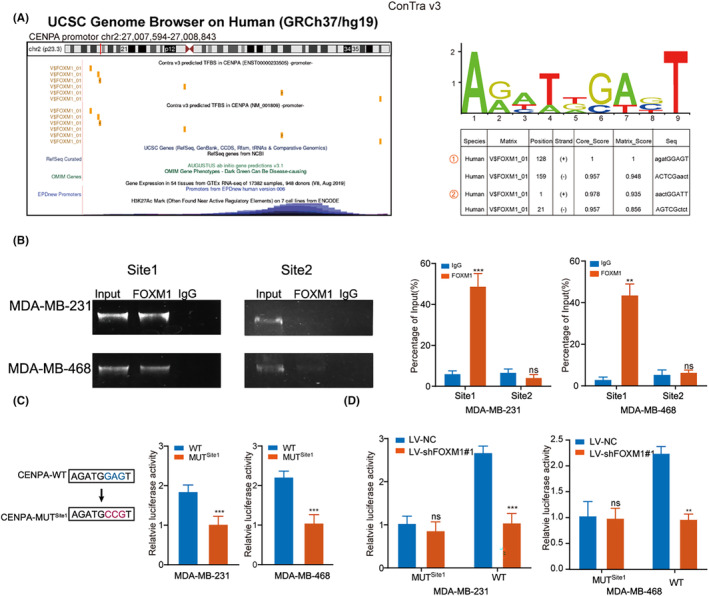
The FOXM1 binds to the CENPA promoter. (A) The Contra 3.0 database (http://bioit2.irc.ugent.be/contra/v3/#/step/1) showing that ChIP‐Seq tracked with enrichment of H3K27Ac and FOXM1 across the CENPA promoter sequence (left panel), binding motif and prediction of binding sites (right panel). (B) Relative enrichment of FOXM1 (right panel) to the CENPA promoter was detected via ChIP assays. PCR products were run on a 2% agarose gel (left panel). (C) Luciferase activity of TNBC cells transfected with luciferase reporter plasmids containing wild‐type CENPA (CENPA‐WT) or mutant CENPA (CENPA‐MUT). (D) Estimation of CENPA‐WT and CENPA‐MUT luciferase activity in LV‐NC and LV‐shFOXM1 TNBC cell lines. Results are displayed as the mean ± SD. *p < 0.05, **p < 0.01, ***p < 0.001.
3.6. YTHDC1 regulates FOXM1 in TNBC through m6A modification
Having identified the importance of the FOXM1/CENPA axis, we analyzed m6A‐seq data from GSE193155 and observed a significant enrichment of m6A modifications in FOXM1 compared with the IP and input groups (Figure 7A). Additionally, we identified the predominant distribution of m6A modification on the FOXM1 mRNA 3′UTR and determined the most frequent m6A motifs (Figure 7B). We also validated the m6A modification sites on the human FOXM1 mRNA using the SRAMP website (Figure 7B).
FIGURE 7.
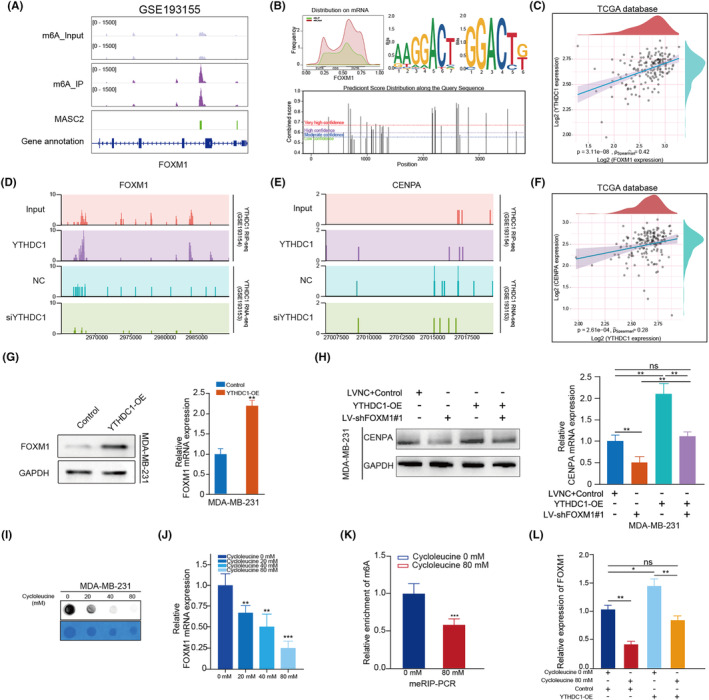
YTHDC1 regulates FOXM1 depending on m6A modification. (A) Integrative Genomics Viewer (IGV) visualizing the m6A‐seq in data track and m6A peaks in MASC2 track. (B) Distribution plot showing the m6A modification on FOXM1 mRNA (upper left panel), and two predicted sequence motifs for m6A modification based on m6A‐seq data (upper right panel). The m6A modification on FOXM1 mRNA was also predicted on SRAMP website (bottom panel). (C) Scatter plot showing the correlation between YTHDC1 and FOXM1 mRNA expression. (D, E) RIP‐seq data showing the enrichment of YTHDC1 on FOXM1 mRNA and CENPA mRNA (upper left and right panels). RNA‐seq data showing the expression of FOXM1 and CENPA in NC and siYTHDC1 groups (bottom left and right panel). (F) Scatter plot showing the correlation between YTHDC1 and CENPA mRNA expression. (G) qRT‐PCR and western blot assays showing the mRNA and protein expression of FOXM1 in YTHDC1‐OE and control cells. (H) CENPA expression was detected by western blot and qRT‐PCR in cell lines cotransfected with empty vector, LV‐NC, YTHDC1‐OE and LV‐shFOXM1. (I, J) The m6A modification level and FOXM1 expression decreased in cells treated with indicated concentration of cycloleucine (0, 20, 40 and 80 μm). (K) m6A RNA immunoprecipitation (MeRIP) assay measure the level of FOXM1 mRNA m6A methylation in untreated TNBC cells and cells treated with 80 μm cycloleucine. (L) YTHDC1 overexpression induced FOXM1 expression, and this effect was attenuated by cycloleucine. Results are displayed as mean ± SD. *p < 0.05, **p < 0.01, ***p < 0.001.
Moreover, the heatmap and network depicted the associations between 23 m6A genes and FOXM1 in TNBC in a prior investigation 37 , 38 (Figure S3B,C). We found that only YTHDC1 could bind to FOXM1 and be associated with FOXM1 expression. The significantly positive correlation between YTHDC1 and FOXM1 expression was validated in TNBC‐TCGA samples (Figure 7C). Furthermore, we observed YTHDC1 antibody bound to FOXM1 mRNA in the RIP‐seq (GSE193154) and decreased FOXM1 expression with silenced YTHDC1 compared with the negative control in RNA‐seq data (GSE193153) (Figure 7D). Additionally, in GSE193154, GSE193153 and TCGA‐TNBC datasets, we observed that the expression of YTHDC1 was positively correlated with CENPA expression, even though it did not directly bind to CENPA (Figure 7E,F). Subsequently, we observed the upregulation of mRNA and protein expression of FOXM1 in both MDA‐MB‐231 and MDA‐MB‐468 cell lines transfected with YTHDC1‐OE compared with the control group (Figure 7G, Figure S3D,E). Moreover, YTHDC1 overexpression promoted CENPA expression, which could be reversed by silencing FOXM1 at both the mRNA and protein levels (Figure 7H).
To further explore the role of m6A modification in FOXM1, we detected m6A levels in TNBC, which decreased with increasing concentrations of cycloleucine in MDA‐MB‐231 cells (Figure 7I). Moreover, FOXM1 expression decreased in a cycloleucine‐dependent manner (Figure 7J). By comparing the FOXM1 m6A modification levels in untreated cycloleucine and 80 mM cycloleucine‐treated MDA‐MB‐231 cells, we observed a significant reduction in the enrichment of m6A in treated cells (Figure 7K). Furthermore, we found that treatment with 80 mM cycloleucine counteracted the effects of YTHDC1‐OE on FOXM1 expression, suggesting that YTHDC1 promoted FOXM1 expression in a m6A modification manner (Figure 7L).
4. DISCUSSION
Transcription factors are widely expressed in various organs and tissues and could regulate the expression of target genes by promoting or reducing the transcription of target genes. There are several master regulator TFs whose abnormal expression had been proven to be involved in the occurrence and development of cancers. For example, the inhibitor TF JQ1 suppresses tumor growth in endometrial cancer. 39 SOX18 affected cell cycle regulation in non–small‐cell lung cancer (NSCLC) cell lines. 37 Thus, considering their important effects on cancers, our study mainly focused on exploring key TFs in TNBC. Using bioinformatics analysis, FOXM1 was recognized as one of the most important prognostic TF in TNBC, whose differential expression was consistently validated in both published datasets, in‐house tissue samples, and several cell lines.
To fully understand the role of FOXM1 in TNBC, we discovered that FOXM1 inhibition could significantly reduce cell growth and metastasis. The role of TFs in metabolic reprogramming, particularly in glycolysis, has also been reported in several studies. For example, ZEB1 binds to E2‐box‐like sequences in the promoter region of PFKM and induces its expression to enhance the Warburg effect in hepatocellular carcinoma (HCC). 40 Increased expression of FOXM1 mediating HIF‐1α expression to affect aerobic glycolysis in glioblastoma. 41 A similar effect of FOXM1 on glycolysis has also been reported in HCC, head and neck cancer, and ovarian cancer. 42 , 43 , 44 To detect the association between glycolysis and FOXM1 expression in TNBC, we used Spearman correlation analysis and found that FOXM1 was positively related to three genes (CENPA, AURKA, and KIF20A) from HALLMARK_GLYCOLYSIS. CENPA, as the target of FOXM1, has shown the regulation of FOXM1/CENPA in pancreatic β‐cell proliferation. 15 , 45 Here, this study first provides evidence supporting the fact that FOXM1 induced CENPA expression by directly binding to its promoter and subsequently promoted TNBC progression and glycolysis.
Several studies have revealed that m6A‐related genes, especially YTHDF1 and ALKBH5, could modulate FOXM1 depending on m6A modifications in cancers. However, no studies have found any link between the m6A gene and FOXM1 expression in TNBC. Therefore, by performing correlation analysis in the three TNBC expression datasets and CLIP‐seq of FOXM1, we identified YTHDC1 upstream of FOXM1, which promotes FOXM1 expression. To prove this, we analyzed m6A‐seq in the TNBC cell line and found that m6A modification occurred at the 3′UTR of FOXM1 mRNA. CLIP‐seq and RNA‐seq analyses also showed that YTHDC1 could bind to FOXM1 and interrupt FOXM1 expression after the inhibition of YTHDC1. To obtain further evidence, we detected increased FOXM1 expression in YTHDC1‐OE cells. CENPA, a FOXM1 target, was also upregulated after YTHDC1 overexpression. To further explore this, we used an m6A inhibitor to decrease m6A levels in TNBC, which resulted in decreased FOXM1 expression in accordance with decreasing concentrations of the m6A inhibitor in the cell. Moreover, YTHDC1 overexpression increased FOXM1 expression, which was reversed by an m6A inhibitor, indicating that the YTHDC1/FOXM1/CENPA axis plays an important role in TNBC progression.
Overall, our study is the first to reveal that YTHDC1, dependent on m6A modification, promotes the FOXM1/CENPA axis in TNBC progression and glycolysis. This provides new insight into the mechanism of FOXM1 and a new target for clinical therapy in TNBC.
AUTHOR CONTRIBUTIONS
Xi Shen: Conceptualization; data curation; writing – original draft. Jianxin Zhong: Data curation; methodology. Pan Yu: Investigation. Feng Liu: Resources; software. Haoran Peng: Project administration. Nianyong Chen: Supervision; writing – review and editing.
FUNDING INFORMATION
None.
CONFLICT OF INTEREST STATEMENT
The authors declare no conflict of interest.
ETHICS STATEMENTS
Approval of the research protocol by an Institutional Reviewer Board: N/A.
Informed Consent: The study was approved by the Ethics Committee of the Wuhan Fourth Hospital, and all participants provided written informed consent.
Registry and the Registration No. of the study/trial: N/A.
Animal Studies: All operations of experimental animals were performed in accordance with the National Institutes of Health's Guide for the Care and Use of Laboratory Animals. All operations were approved by the Animal Care and Use Committee of West China Hospital of Sichuan University (2022351A).
Supporting information
Figure S1.
Figure S2.
Figure S3.
Table S1.
Table S2.
Table S3.
ACKNOWLEDGMENTS
None.
Shen X, Zhong J, Yu P, Liu F, Peng H, Chen N. YTHDC1‐dependent m6A modification modulated FOXM1 promotes glycolysis and tumor progression through CENPA in triple‐negative breast cancer. Cancer Sci. 2024;115:1881‐1895. doi: 10.1111/cas.16137
Xi Shen and Jianxin Zhong contributed equally to this work.
DATA AVAILABILITY STATEMENT
The original contributions presented in the study are included in the article/Supplementary Material. Further inquiries can be directed to the corresponding author.
REFERENCES
- 1. Harbeck N, Gnant M. Breast cancer. Lancet. 2017;389(10074):1134‐1150. doi: 10.1016/S0140-6736(16)31891-8 [DOI] [PubMed] [Google Scholar]
- 2. Garrido‐Castro AC, Lin NU, Polyak K. Insights into molecular classifications of triple‐negative breast cancer: improving patient selection for treatment. Cancer Discov. 2019;9(2):176‐198. [DOI] [PMC free article] [PubMed] [Google Scholar]
- 3. Won K‐A, Spruck C. Triple‐negative breast cancer therapy: current and future perspectives (Review). Int J Oncol. 2020;57(6):1245‐1261. doi: 10.3892/ijo.2020.5135 [DOI] [PMC free article] [PubMed] [Google Scholar]
- 4. Li Y, Zhang H, Merkher Y, et al. Recent advances in therapeutic strategies for triple‐negative breast cancer. J Hematol Oncol. 2022;15(1):121. doi: 10.1186/s13045-022-01341-0 [DOI] [PMC free article] [PubMed] [Google Scholar]
- 5. Lambert A, Jolma A, Campitelli LF, et al. The human transcription factors. Cell. 2018;172(4):650‐665. [DOI] [PubMed] [Google Scholar]
- 6. Lee TI, Young RA. Young, transcriptional regulation and its misregulation in disease. Cell. 2013;152(6):1237‐1251. [DOI] [PMC free article] [PubMed] [Google Scholar]
- 7. Morgan MP, Finnegan E, Das S. The role of transcription factors in the acquisition of the four latest proposed hallmarks of cancer and corresponding enabling characteristics. Semin Cancer Biol. 2022;86(Pt 3):1203‐1215. doi: 10.1016/j.semcancer.2022.10.002 [DOI] [PubMed] [Google Scholar]
- 8. Koo CY, Muir KW, Lam EW. FOXM1: from cancer initiation to progression and treatment. Biochim Biophys Acta. 2012;1819:28‐37. [DOI] [PubMed] [Google Scholar]
- 9. Andrei L. Gartel.FOXM1 in cancer: interactions and vulnerabilities. Cancer Res. 2017;77(12):3135‐3139. doi: 10.1158/0008-5472.CAN-16-3566 [DOI] [PMC free article] [PubMed] [Google Scholar]
- 10. Yang K, Jiang B, Lu Y, et al. FOXM1 promotes the growth and metastasis of colorectal cancer via activation of beta‐catenin signaling pathway. Cancer Manag Res. 2019;11:3779‐3790. [DOI] [PMC free article] [PubMed] [Google Scholar]
- 11. Kong FF, Zhu YL, Yuan HH, et al. FOXM1 regulated by ERK pathway mediates TGF‐beta1‐induced EMT in NSCLC. Oncol Res. 2014;22(1):29‐37. [DOI] [PMC free article] [PubMed] [Google Scholar]
- 12. Cui J, Shi M, Xie D, et al. FOXM1 promotes the warburg effect and pancreatic cancer progression via transactivation of LDHA expression. Clin Cancer Res. 2014. May 15;20(10):2595‐2606. doi: 10.1158/1078-0432.CCR-13-2407 [DOI] [PMC free article] [PubMed] [Google Scholar]
- 13. Cheng Y, Sun F, Thornton K, et al. FOXM1 regulates glycolysis and energy production in multiple myeloma. Oncogene. 2022;41(32):3899‐3911. [DOI] [PMC free article] [PubMed] [Google Scholar]
- 14. Shang RZ, Pu M, Li Y, Wang DS. FOXM1 regulates glycolysis in hepatocellular carcinoma by transactivating glucose transporter 1 expression. Oncol Rep. 2017;37(4):2261‐2269. [DOI] [PubMed] [Google Scholar]
- 15. Zhao LQ, Sun W, Zhang P, Gao W, Fang CY, Zheng AW. MFAP2 aggravates tumor progression through activating FOXM1/β‐catenin‐mediated glycolysis in ovarian cancer. Kaohsiung J Med Sci. 2022;38(8):772‐780. [DOI] [PubMed] [Google Scholar]
- 16. Warburg O. On the origin of cancer cells. Science. 1956;123:309‐314. [DOI] [PubMed] [Google Scholar]
- 17. Xiao H, Wang J, Yan W, et al. GLUT1 regulates cell glycolysis and proliferation in prostate cancer. Prostate. 2018;78(2):86‐94. doi: 10.1002/pros.23448 [DOI] [PubMed] [Google Scholar]
- 18. Powers RK, Goodspeed A, Pielke‐Lombardo H, Tan A‐C, Costello JC. GSEA‐InContext: identifying novel and common patterns in expression experiments. Bioinformatics. 2018;34(13):i555‐i564. [DOI] [PMC free article] [PubMed] [Google Scholar]
- 19. Liang Y‐C, Qi S, Liu Y‐J, Xiao H, Yin H‐Z. Centromere protein A (CENPA) regulates metabolic reprogramming in the colon cancer cells by transcriptionally activating karyopherin subunit alpha 2 (KPNA2). Am J Pathol. 2021;191(12):2117‐2132. [DOI] [PubMed] [Google Scholar]
- 20. Jiang L, Zhao L, Bi J, et al. Glycolysis gene expression profilings screen for prognostic risk signature of hepatocellular carcinoma. Aging. 2019;11(23):10861‐10882. [DOI] [PMC free article] [PubMed] [Google Scholar]
- 21. Hu X, Peng WX, Zhou H, et al. IGF2BP2 regulates DANCR by serving as an N6‐methyladenosine reader. Cell Death Differ. 2020;27:1782‐1794. [DOI] [PMC free article] [PubMed] [Google Scholar]
- 22. Ji F, Yang L, Chen S, et al. IGF2BP2‐modified circular RNA circARHGAP12 promotes cervical cancer progression by interacting m6A/FOXM1 manner. Cell Death Dis. 2021;7(1):215. [DOI] [PMC free article] [PubMed] [Google Scholar]
- 23. Zhang S, Zhao BS, Zhou A, et al. The m6A demethylase ALKBH5 maintains tumorigenicity of glioblastoma stem‐like cells by sustaining FOXM1 expression and cell proliferation program. Cancer Cell. 2017;31(4):591‐606.e6. doi: 10.1016/j.ccell.2017.02.013 [DOI] [PMC free article] [PubMed] [Google Scholar]
- 24. Hao L, Yin J, Yang H, et al. ALKBH5‐mediated m6A demethylation of FOXM1 mRNA promotes progression of uveal melanoma. Aging. 2021;13(3):4045‐4062. [DOI] [PMC free article] [PubMed] [Google Scholar]
- 25. Chao Y, Shang J, Ji W. ALKBH5‐m6A‐FOXM1 signaling axis promotes proliferation and invasion of lung adenocarcinoma cells under intermittent hypoxia. Biochem Biophys Res Commun. 2020;521(2):499‐506. [DOI] [PubMed] [Google Scholar]
- 26. Shriwas O, Priyadarshini M, Samal SK, et al. Rupesh Dash.DDX3 modulates cisplatin resistance in OSCC through ALKBH5‐mediated m6A‐demethylation of FOXM1 and NANO. Apoptosis. 2020;25(3–4):233‐246. [DOI] [PubMed] [Google Scholar]
- 27. Zhu Z, Zhou Y, Chen Y, et al. m6A methyltransferase KIAA1429 regulates the cisplatin sensitivity of gastric cancer cells via stabilizing FOXM1 mRNA. Cancers. 2022;14(20):5025. [DOI] [PMC free article] [PubMed] [Google Scholar]
- 28. Zhang Q, Liu W, Zhang H‐M, et al. hTFtarget: a comprehensive database for regulations of human transcription factors and their targets. Genomics Proteomics Bioinformatics. 2020;18(2):120‐128. [DOI] [PMC free article] [PubMed] [Google Scholar]
- 29. Zhang N, Yan X, O'Hely M, Speed TP, Scharfe C, Wang W. SRMA: an R package for resequencing array data analysis. Bioinformatics. 2012;28(14):1928‐1930. [DOI] [PMC free article] [PubMed] [Google Scholar]
- 30. Wang Z, Cai D, Li K, Xing J, Nie Q. Transcriptome analysis of the inhibitory effect of cycloleucine on myogenesis. Poult Sci. 2022;101(12):102219. [DOI] [PMC free article] [PubMed] [Google Scholar]
- 31. Shen Y, Zhao S, Wang S, et al. S1P/S1PR3 axis promotes aerobic gly colysis by YAP/c‐MYC/PGAM1 axis in osteosarcoma. EBioMedicine. 2019;40:210‐223. [DOI] [PMC free article] [PubMed] [Google Scholar]
- 32. Zhao SJ, Shen YF, Li Q, et al. SLIT2/ROBO1 axis contributes to the Warburg effect in osteosarcoma through activation of SRC/ERK/cMYC/PFKFB2 pathway. Cell Death Dis. 2018;9(3):390. [DOI] [PMC free article] [PubMed] [Google Scholar]
- 33. Zhou J, Jiang Y‐Y, Chen H, Yi‐Chao W, Zhang L. Tanshinone I attenuates the malignant biological properties of ovarian cancer by inducing apoptosis and autophagy via the inactivation of PI3K/AKT/mTOR pathway. Cell Prolif. 2020;53(2):e12739. [DOI] [PMC free article] [PubMed] [Google Scholar]
- 34. Pijuan J, Barceló C, Moreno DF, et al. In vitro cell migration, invasion, and adhesion assays: from cell imaging to data analysis. Front Cell Dev Biol. 2019;7:107. [DOI] [PMC free article] [PubMed] [Google Scholar]
- 35. Chen Y, Peng C, Chen J, et al. WTAP facilitates progression of hepatocellular carcinoma via m6A‐HuR‐dependent epigenetic silencing of ETS1. Mol Cancer. 2019;18(1):127. [DOI] [PMC free article] [PubMed] [Google Scholar]
- 36. Shengyu Yang J, Zhang J, Huang X‐Y. Mouse models for tumor metastasis. Methods Mol Biol. 2012;928:221‐228. [DOI] [PMC free article] [PubMed] [Google Scholar]
- 37. Pang Y, Bai G, Zhao J, et al. The BRD4 inhibitor JQ1 suppresses tumor growth by reducing c‐Myc expression in endometrial cancer. J Transl Med. 2022;20(1):336. [DOI] [PMC free article] [PubMed] [Google Scholar]
- 38. Shen X, Zhong J, He J, Han J, Chen N. Identification of m6A modification patterns and development of m6A‐hypoxia prognostic signature to characterize tumor microenvironment in triple‐negative breast cancer. Front Immunol. 2022;13:978092. [DOI] [PMC free article] [PubMed] [Google Scholar]
- 39. Rodak O, Mrozowska M, Rusak A, et al. Targeting SOX18 transcription factor activity by small‐molecule inhibitor Sm4 in non‐small lung cancer cell lines. Int J Mol Sci. 2023;24(14):11316. [DOI] [PMC free article] [PubMed] [Google Scholar]
- 40. Li Z, Yang H‐Y, Xiao‐Lan Zhang X, et al. Kinesin family member 23, regulated by FOXM1, promotes triple negative breast cancer progression via activating Wnt/β‐catenin pathway. J Exp Clin Cancer Res. 2022;41(1):168. [DOI] [PMC free article] [PubMed] [Google Scholar]
- 41. Zhou Y, Lin F, Wan T, et al. ZEB1 enhances Warburg effect to facilitate tumorigenesis and metastasis of HCC by transcriptionally activating PFKM. Theranostics. 2021;11(12):5926‐5938. [DOI] [PMC free article] [PubMed] [Google Scholar]
- 42. Li Y‐P, Liu Y, Xia L‐M, et al. Induction of cancer cell stemness in glioma through glycolysis and the long noncoding RNA HULC‐activated FOXM1/AGR2/HIF‐1α axis. Lab Invest. 2022;102(7):691‐701. [DOI] [PubMed] [Google Scholar]
- 43. Ziwu X, Pei C, Cheng H, et al. Comprehensive analysis of FOXM1 immune infiltrates, m6a, glycolysis and ceRNA network in human hepatocellular carcinoma. Front Immunol. 2023;14:1138524. [DOI] [PMC free article] [PubMed] [Google Scholar]
- 44. Huang T‐L, Chang C‐R, Chien C‐Y, et al. DRP1 contributes to head and neck cancer progression and induces glycolysis through modulated FOXM1/MMP12 axis. Mol Oncol. 2022;16(13):2585‐2606. [DOI] [PMC free article] [PubMed] [Google Scholar]
- 45. Shirakawa J, Fernandez M, Takatani T, et al. Insulin signaling regulates the FoxM1/PLK1/CENP‐A pathway to promote adaptive pancreatic β cell proliferation. Cell Metab. 2017;25(4):868‐882.e5. [DOI] [PMC free article] [PubMed] [Google Scholar]
Associated Data
This section collects any data citations, data availability statements, or supplementary materials included in this article.
Supplementary Materials
Figure S1.
Figure S2.
Figure S3.
Table S1.
Table S2.
Table S3.
Data Availability Statement
The original contributions presented in the study are included in the article/Supplementary Material. Further inquiries can be directed to the corresponding author.


