

Summary
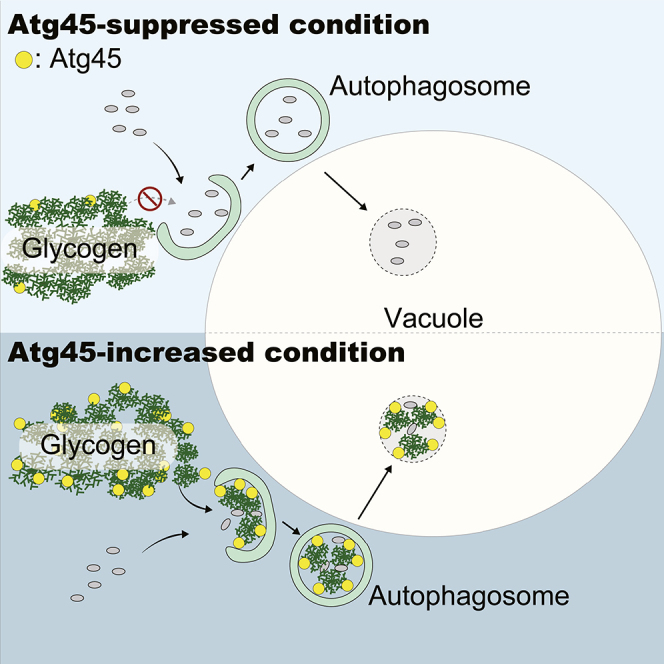
The mechanisms governing autophagy of proteins and organelles have been well studied, but how other cytoplasmic components such as RNA and polysaccharides are degraded remains largely unknown. In this study, we examine autophagy of glycogen, a storage form of glucose. We find that cells accumulate glycogen in the cytoplasm during nitrogen starvation and that this carbohydrate is rarely observed within autophagosomes and autophagic bodies. However, sequestration of glycogen by autophagy is observed following prolonged nitrogen starvation. We identify a yet-uncharacterized open reading frame, Yil024c (herein Atg45), as encoding a cytosolic receptor protein that mediates autophagy of glycogen (glycophagy). Furthermore, we show that, during sporulation, Atg45 is highly expressed and is associated with an increase in glycophagy. Our results suggest that cells regulate glycophagic activity by controlling the expression level of Atg45.
Subject areas: Biomolecules, Glycobiology, Cell biology, Model organism
Graphical abstract
Highlights
-
•
Glycogen is a non-preferred cargo of bulk autophagy
-
•
Glycophagy gradually increases with prolonged nitrogen starvation
-
•
Atg45 functions as a glycophagy receptor
-
•
During sporulation, glycophagy is strongly induced with increased amount of Atg45
Biomolecules; Glycobiology; Cell biology; Model organism
Introduction
The vacuole (lysosome in mammals) is an organelle responsible for degradation of cellular components, as well as the storage of ions and molecules such as amino acids. Macroautophagy (hereafter autophagy) is a major degradation system that delivers cytoplasmic constituents to the vacuole. In autophagy, various cargoes are engulfed by an expanding membrane sac called the isolation membrane, which eventually becomes a double-membrane vesicle called an autophagosome. The outer membrane of the autophagosome fuses with the vacuole, which results in the release of the inner membrane-bound structure, the autophagic body, into the vacuolar lumen, allowing degradation by the vacuolar lipase Atg15 and a range of proteases.1,2,3,4,5,6 Degradation products arising from autophagy, such as amino acids, are subsequently transported back to the cytoplasm for reuse.7,8,9
Autophagosomes are generally thought to sequester cytoplasmic components in a random manner (termed bulk autophagy). In some cases, autophagosomes selectively enclose specific cargoes such as protein aggregates or organelles in a regulated process called selective autophagy.10 In selective autophagy, a specific cargo is engulfed by isolation membranes via cargo-specific receptors.10 Receptors generally bind to Atg8-family proteins on the isolation membrane, and the scaffold protein Atg11 (in yeast) or FIP200 (in mammals).11,12,13 These scaffold proteins recruit autophagic machinery proteins, allowing the formation of autophagosomal membranes that surround the cargo.11,12,13,14
Although much is known about autophagy of proteins and organelles, the mechanisms of autophagy for other cellular components such as RNAs and polysaccharides are still largely unclear. Glycogen, which is a highly branched polysaccharide, is reported to be delivered to lysosomes by autophagy (glycophagy) in mammalian and insect cells.15,16,17 When the lysosomal acid α-glucosidase, which hydrolyzes glycogen to glucose, is defective in mammalian cells, glycogen accumulates in the lysosome, causing Pompe disease.18 Thus, control of the delivery of glycogen to the lysosome is physiologically important. Although the mechanism of glycophagy is not fully understood, a putative trans-membrane protein Stbd1 is reported to be a glycophagy receptor in mammals.15,16 This protein contains a glycogen-binding domain (GBD) called CBM20, as well as an Atg8 family-interacting motif (AIM, also called the LC3-interacting region [LIR]).15,16
In the budding yeast Saccharomyces cerevisiae, which is an excellent model organism for studies of autophagy, glycogen is synthesized in the cytosol by glycogenins (Glg1, Glg2), glycogen synthases (Gsy1, Gsy2), and glycogen branching enzyme (Glc3) in a concerted manner.19 Synthesis is induced under stress conditions, such as nitrogen starvation.20 Accumulated glycogen is subsequently broken down into glucose-1-phosphate via glycogenolysis by glycogen phosphorylases (Gph1) and glycogen debranching enzyme (Gdb1) in the cytosol according to cellular needs.19 Glycogen is also degraded by the glucoamylase Sga1 which localizes in the vacuole or to prospore membranes during sporulation.21,22 It has been suggested that autophagy may be involved in the delivery of glycogen to vacuoles,23,24 but the molecular details of this process remain uncharacterized.23,24,25
We recently conducted a comprehensive proteomic analysis of autophagic bodies and reported that glycogen metabolism-related enzymes are excluded from autophagic bodies.26 In this study, we find that glycogen is a non-preferred cargo of bulk autophagy. We further determine that glycogen metabolism-related enzymes escape from autophagy, most likely due to their binding to glycogen. However, we find that glycogen becomes a target of autophagy during prolonged nitrogen starvation and identify Atg45 as the receptor that regulates this glycophagy process. Finally, we uncover that glycophagy is strongly induced in an Atg45-dependent manner during sporulation, with this induction required for intracellular glycogen storage. Thus, glycogen is a non-preferred cargo of bulk autophagy and the degradation is positively regulated by the receptor-dependent process.
Results
Glycogen and glycogen metabolism-related enzymes are non-preferred cargoes of conventional nitrogen starvation-induced autophagy
In our comprehensive proteomic analysis of autophagic bodies, we found that some glycogen metabolism-related enzymes (e.g., Gsy2, Glc3, Gph1) are non-preferred cargoes of bulk autophagy. 26 To validate this result, we assessed autophagic degradation of Gsy2, Glc3, and Gph1 by the GFP-cleavage assay, whereby a protein of interest is expressed in fusion with GFP. Upon delivery to the vacuole, vacuolar protease-resistant GFP moieties (free GFP) are generated and can be detected using antibodies, allowing the assessment of the degree of autophagic degradation of the GFP-tagged protein by measuring the amounts of free GFP and intact GFP-tagged proteins. We constructed GFP-tagged Gsy2, Glc3, and Gph1, as well as Pgk1 and Trp4 (cytosolic proteins), expressing each of these from their native promoter in wild-type (WT) cells. Consistent with our comprehensive proteomic analyses, western blotting with anti-GFP antibodies revealed that Gsy2, Glc3, and Gph1 were only marginally degraded up to 8 h of nitrogen starvation (Figure 1A). Previous works have suggested that some glycogen metabolism-related enzymes bind to glycogen27,28,29,30,31,32,33 (Figure 1B). For example, glycogen synthetase tightly binds to glycogen, which is observed as co-localization by microscopy.27,28,33 Upon nitrogen starvation, we observed the synthesis and accumulation of glycogen in the cytoplasm of WT cells, as previously reported;34 this was completely absent in glg1Δglg2Δ cells (Figure S1A). Thus, we assumed that glycogen metabolism-related enzymes would escape from autophagy by binding to glycogen. We investigated the localization of the glycogen synthetase Gsy2 using fluorescence microscopy to observe cells subjected to nitrogen starvation. 2 h after shifting to nitrogen starvation medium (SD-N medium), Pgk1 in the cytoplasm was uniformly distributed, whereas Gsy2 was unevenly distributed (Figure S1B). In addition, Gsy2 co-localized with other glycogen metabolism-related proteins such as Glc3 and Gph1, but not with membrane-bound organelles such as the endoplasmic reticulum (ER) (Sec63), nucleus (Ndc1), or mitochondria (Om45) (Figures S1C and S1D). In addition, in glg1Δglg2Δ cells, Gsy2 showed a cytoplasmically diffused pattern under nitrogen starvation (Figure S1E). These observations suggest that glycogen metabolism-related enzymes bind to glycogen granules. Furthermore, the majority of Gsy2 was recovered in the pellet fraction after centrifugation of cellular lysates at 100,000 g in the presence of endogenous glycogen (WT cell lysate) or exogenously added glycogen (glg1Δglg2Δ cells lysate with added glycogen) (Figure 1C, see also Figure 5A), confirming that Gsy2 binds glycogen in this condition.
Figure 1.

Glycogen and glycogen metabolism-related enzymes are non-preferred cargoes of nitrogen starvation-induced autophagy
(A) GFP-cleavage assay of Pgk1, Gsy2, Glc2, Gph1, and Trp4 in SD-N medium (upper). Quantified band intensities are indicated (lower). Error bars represent SD (n = 3).
(B) Schematic illustration of roles of Gsy2, Gph1, and Glc3 in glycogen metabolism.
(C) Assessment of Gsy2-GFP binding to glycogen by sedimentation assay. T: Total lysate, S: Supernatant, P: Pellet. Pgk1 was used as a representative cytosolic protein.
(D) GFP-cleavage assay of Pgk1, Gsy2, Glc2, Gph1, and Trp4 in WT cells and glg1Δglg2Δ cells (upper). Quantified band intensities are indicated (lower). Error bars represent SD (n = 3).
(E) Electron micrographs of PATAg-stained atg15Δ cells and glg1Δglg2Δatg15Δ cells after 6 h of nitrogen starvation. The diameters of each PATAg-stained structure were roughly estimated as follows: 1: 200 nm, 2: 70 nm, and 3: 40 nm. Bar: 2 μm.
See also Figure S1.
Figure 5.

Atg45 is a glycophagy receptor
(A) Assessment of the binding ability of Gsy2, Atg45, Atg4597−189, and Atg451−96-GFP to glycogen by sedimentation assay (left). Atg45 and its variants were expressed under the control of the ACT1 promoter. An overview of Atg45 and assessed deletion mutants is shown at right. T: Total lysate, S: Supernatant, P: Pellet. Pgk1 was used as a representative cytosolic protein.
(B) GFP-cleavage assay of Gsy2 in SD-N cultured cells expressing Atg45, Atg451−96, or Atg4597−189-mScarlet under the control of the ATG45 or ACT1 promoters. Expression levels of mScarlet-tagged proteins were also assessed by western blotting (bottom panel).
(C) Overview of the candidate AIM amino acid sequence within Atg45 (left). The interaction of GFP-Atg8 with Atg45 or Atg45AIMm-FLAG was assessed by co-immunoprecipitation of GFP-Atg8 (right). Atg45 and Atg45AIMm were expressed under the control of the ACT1 promoter.
(D) GFP-cleavage assay of Gsy2 in atg45Δ cells harboring an empty vector or vector-borne Atg45-FLAG and Atg45AIMm-FLAG under the control of the ACT1 promoter. Cells were cultured in SD-N medium for indicated time periods. The expression levels of FLAG-tagged proteins were also assessed by western blotting. Quantification results are shown at right. Error bars represent SD (n = 3).
See also Figures S4 and S5.
Next, we assessed autophagic degradation of glycogen metabolism-related enzymes in glg1Δglg2Δ cells and found that autophagic degradation of Gsy2, Glc3, and Gph1 was largely enhanced, while Pgk1 and Trp4 remained constant (Figure 1D). As expected, a similar increase was observed in an alternative glycogen-deficient strain, gsy1Δgsy2Δ (Figure S1F). These results indicate that glycogen suppresses autophagic degradation of these enzymes. To investigate whether glycogen is also a non-preferred cargo of autophagy under these conditions, we examined the localization of glycogen by transmission electron microscopy (TEM). To this end, we used atg15Δ cells, which accumulate autophagic bodies in the vacuole (Figures 1E and S1G).1,3,6 Periodic acid-thiocarbohydrazide-silver proteinate (PATAg) was used to stain polysaccharides including glycogen.35,36,37,38 Under nitrogen starvation, atg15Δ cells accumulated PATAg-stained structures that were not seen in glg1Δglg2Δatg15Δ cells (Figure 1E). The size of these glycogen structures in the cytoplasm varied from about 40 nm to 200 nm (Figure 1E), suggesting the formation of higher-order glycogen assemblies such as α-granules, as observed in the mammalian liver.39 Autophagic bodies rarely contained glycogen, though glycogen was widely distributed in the cytoplasm (Figure 1E), indicating that glycogen is a non-preferred cargo of nitrogen starvation-induced autophagy. These results support the conclusion that glycogen is a non-preferred cargo of nitrogen starvation-induced autophagy and that proteins bound to glycogen (such as Gsy2) thereby escape autophagic degradation upon nitrogen starvation.
Glycophagy occurs after prolonged nitrogen starvation
While glycogen and glycogen metabolism-related enzymes are non-preferred cargoes of nitrogen starvation-induced autophagy, we noticed that Gsy2 was gradually degraded after 8 h (Figure 2A), suggesting that autophagy of glycogen (glycophagy) does occur upon prolonged nitrogen starvation. TEM analysis of PATAg-stained cells subjected to prolonged nitrogen starvation showed that the percentage of individual autophagic bodies that contained glycogen was increased relative to samples subjected to a shorter (6 h) period of nitrogen starvation (Figures 2B and 2C), and most autophagosomes contained glycogen at 48 h (Figure 2B). Glycophagy was in fact enhanced upon prolonged nitrogen starvation. We also concluded that Gsy2 can be used as a reliable reporter of glycophagy.
Figure 2.

Gsy2 is degraded by autophagy after prolonged nitrogen starvation
(A) GFP-cleavage assay of Gsy2 and Pgk1 in WT cells cultured in SD-N medium.
(B) Electron micrographs of PATAg-stained atg15Δ cells after 6, 24, or 48 h of nitrogen starvation. Yellow arrowheads, autophagic bodies containing glycogen. Green arrows, autophagosomes containing glycogen. Scale bar: 2 μm.
(C) Percentages of individual autophagic bodies containing glycogen per cell (related to Figure 2B) are indicated as boxplots (n = 20, 32, or 52). Significance is calculated by the Steel test.
(D) GFP-cleavage assay of Gsy2 in WT, atg2Δ, atg11Δ, atg17Δ, or atg24Δ cells after 48 h of nitrogen starvation (upper). In quantification results (lower), the values of WT cells were set to 1.0. Error bars represent SD (n = 3).
(E) GFP-cleavage assay of Pgk1 in WT, atg2Δ, atg11Δ, atg17Δ, or atg24Δ cells after 48 h of nitrogen starvation (upper). For quantification (lower), all values are shown relative to WT as 1.0. Error bars represent SD (n = 3).
To characterize glycophagy during prolonged nitrogen starvation, we examined whether ATG genes (ATG2, ATG11, ATG17, and ATG24) are required for the degradation of Gsy2 using the GFP-cleavage assay. While Atg2 is essential for all types of autophagy, the scaffold protein Atg11 is required for most forms of selective autophagy11,40,41 and Atg17 is known to be important for bulk autophagy as well as some types of selective autophagy, including mitophagy and pexophagy.42,43 In atg2Δ and atg17Δ cells, the degradation of Gsy2 was significantly decreased (Figures 2D and 2E). In atg11Δ cells, the degradation of Gsy2 was slightly reduced to a similar extent to that of a representative bulk autophagy cargo protein, Pgk1 (Figures 2D and 2E), indicating that Atg11 is not specifically involved in the degradation of Gsy2. Atg24 (also termed Snx4) is required for autophagy of large cargoes such as organelles, ribosomes, and proteasomes.44,45,46,47 In atg24Δ cells, the degradation of Gsy2 was clearly impaired, while that of Pgk1 was only slightly decreased (Figures 2D and 2E). Together, these results show that prolonged starvation-induced glycophagy does not require Atg11 but does require Atg24.
Atg45 is a positive regulator of glycophagy
A possible explanation for the late-onset delivery of glycogen to the vacuole is that glycogen may become more accessible to autophagosomes after prolonged nitrogen starvation. We considered that a protein may facilitate this, thereby regulating glycophagy. To search for such a protein, we focused on proteins containing the GBD. Mammalian AMP-activated protein kinase (AMPK) β subunits have a GBD called the carbohydrate-binding module 48 (CBM48). We focused on six genes in yeast that encode candidate GBD domains that have sequence similarity with CBM48 (Figure 3A, Pfam: PF16561). Among these, Sip1, Sip2, and Gal83 are β subunits of yeast AMPK (Snf1), which has been reported to regulate glycogen synthesis.48,49 On the other hand, the function of Crp1, Mdg1, and Yil024c has not been defined. Fluorescence microscopy showed that Crp1 and Yil024c co-localize with Gsy2 in the cell periphery and in the cytosol, respectively, under nitrogen starvation conditions but that Sip1, Sip2, and Gal83 do not (Figures 3B and S2A–S2E). Hence, we focused on Yil024c, Crp1, and its paralog Mdg1.
Figure 3.

Glycophagy occurs in an Atg45-dependent manner upon prolonged nitrogen starvation
(A) An overview of proteins containing a putative glycogen-binding domain (GBD) (Pfam: PF16561).
(B) Localization of Crp1, Yil024c (Atg45), or Mdg1-GFP with Gsy2-mScarlet in cells after 2 h of nitrogen starvation. Arrowheads indicate Crp1 or Atg45 co-localization with Gsy2. Scale bar, 2 μm. The localizations of Sip1, Sip2, or Gal83-GFP with Gsy2-mScarlet are shown in Figure S2A.
(C) GFP-cleavage assay of Gsy2 in WT, atg45Δ, crp1Δ, mdg1Δ, or crp1Δmdg1Δ cells after 48 h of nitrogen starvation (upper) and quantification of band intensities (lower). Ponceau S staining was used to determine total protein loading in each lane. For quantification, the value for WT was set to 1.0. Error bars represent SD (n = 3). One-way ANOVA with Dunnett’s test was used to assess statistically significant differences. p values indicated in the figure.
(D) GFP-cleavage assay of Gsy2 in WT, atg45Δ, glg1Δglg2Δ, or glg1Δglg2Δatg45Δ cells subjected to 48 h nitrogen starvation (upper). Ponceau S staining was used to determine total protein loading in each lane. For quantification (lower), the values for WT or glg1Δglg2Δ were set to 1.0. Error bars represent SD (n = 3). Welch’s t test was used to assess statistically significant differences.
See also Figure S2.
We investigated the effect of the disruption of these genes on the autophagic degradation of Gsy2. Degradation was slightly lower in crp1Δ or crp1Δmdg1Δ cells and was nearly the same in mdg1Δ cells as in WT cells (Figure 3C). On the other hand, it was clearly lower in yil024cΔ cells as compared with WT cells (Figure 3C), indicating that glycophagy is strongly dependent on Yil024c. We then tested the contribution of Yil024c to the degradation of Gsy2 in the absence of glycogen. In glg1Δglg2Δ cells, Gsy2 degradation was not affected by Yil024c deletion (Figure 3D), suggesting that Yil024c targets glycogen, not Gsy2. Taken together, we conclude that Yil024c is a positive regulator of glycophagy and therefore name this protein Atg45.
Increased expression of Atg45 enhances glycophagy
Previous comprehensive microarray analyses have suggested that the amount of ATG45 mRNA increases 1–2 days after shifting to starvation medium.50 This suggests that glycophagy induction by prolonged starvation may be due to the upregulation of Atg45 expression. We assessed the expression of Atg45 by western blotting in a nitrogen starvation time course experiment. We observed that the expression of Atg45 is induced during nitrogen starvation, especially at 24 and 48 h after shifting to SD-N medium (Figure 4A). The amount of ATG45 mRNA also gradually increased during nitrogen starvation (Figure S3A), confirming that transcription of Atg45 is upregulated in this condition.
Figure 4.

Increased expression of Atg45 facilitates glycophagy
(A) Assessment of Atg45-GFP protein levels in WT cells cultured in SD-N medium by western blotting. β-actin was used as a loading control. For band intensity quantifications (lower panel), data were normalized to 1.0 using 0 h samples.
(B) GFP-cleavage assay of Gsy2 in cells overexpressing Atg45 (ACT1pr), atg45Δ, or WT cells. Cells cultured in SD-N medium.
(C) GFP-cleavage assay of Gsy2 in WT, atg2Δ, atg11Δ, atg17Δ, or atg24Δ cells, all overexpressing Atg45 (ACT1pr). Cells cultured in SD-N medium.
(D) Electron micrographs of PATAg-stained atg15Δ and Atg45-overexpressing (ACT1pr) atg15Δ cells after 6 h of nitrogen starvation (left). Yellow arrowheads, autophagic bodies containing glycogen. Green arrows, autophagosomes containing glycogen. Scale bar: 2 μm. Percentages of individual autophagic bodies containing glycogen per cell are indicated as boxplots at right (n = 30). The Wilcoxon rank-sum test was used to assess statistically significant differences.
(E) Autophagosomes in cells under same conditions as D. Bars: 0.2 μm.
See also Figure S3.
We next generated cells overexpressing Atg45 under the control of the ACT1 promoter. In these cells, Gsy2 was more rapidly degraded than in WT cells (Figure 4B). Moreover, the degradation of Gsy2 under these conditions was dependent on Atg2, Atg17, and Atg24, but only slightly reduced on Atg11 (Figure 4C), which was consistent with cells expressing Atg45 under the control of its own promoter (Figure 2B). We observed that bulk-autophagic activity was slightly reduced in atg11Δ cells even at 2 h of nitrogen starvation (Figure S3B), as previously reported,51,52,53 suggesting that the effect of Atg11 is not specific to the degradation of Gsy2 even during early-term nitrogen starvation. TEM analysis of PATAg-stained samples showed that, in cells overexpressing Atg45, about 40% of autophagic bodies contained glycogen, while in WT cells less than 10% of autophagic bodies did (Figure 4D), providing further evidence that Atg45 facilitates glycophagy. Notably, the amounts of glycogen in individual autophagic bodies exhibited heterogeneity; given that the amount of glycogen is rapidly increased during nitrogen starvation (Figure S1A), variation in the amounts of glycogen in autophagic bodies may reflect the timing of autophagosome formation. Indeed, at 6 h (i.e., when cells had accumulated glycogen), most autophagosomes contained high levels of glycogen in cells overexpressing Atg45 (Figure 4D).
In contrast to cells overexpressing Atg45, autophagosomes contained little glycogen in cells expressing Atg45 at WT levels, despite the presence of glycogen in the cytoplasm. Furthermore, in cells overexpressing Atg45, we observed that glycogen was enriched on the inner membrane of autophagosomes, which was also observed in WT cells after prolonged nitrogen starvation (48 h, Figures 2B and 4E). This suggests that Atg45 facilitates the sequestration of glycogen into autophagosomes by enhancing the binding of glycogen to autophagosomal membranes.
Atg45 functions as a glycogen receptor
To elucidate the mechanistic bases of Atg45-mediated glycophagy, we first examined whether the N-terminal half (1–96) of Atg45, which contains a putative GBD, binds to glycogen. We compared the amount of Atg45 recovered in the pellet fraction of cell lysates in the presence or absence of glycogen by sedimentation assay. In this assay, lysates from glg1Δglg2Δ cells were mixed with exogenous glycogen and subjected to centrifugation. Full-length Atg45 and the N-terminal region of Atg45 (Atg451−96) were recovered in the pellet when sedimented in the presence of glycogen (Figure 5A), while the C-terminal half of Atg45 (Atg4597−189) was not (Figure 5A), suggesting that Atg45 binds to glycogen through the GBD identified within Atg451−96.
To determine whether both regions of Atg45 are required for glycophagy, we assessed the cleavage of Gsy2-GFP in cells overexpressing Atg45-, Atg451−96-, or Atg4597−189-mScarlet chimeric proteins. We found that neither Atg451−96 nor Atg4597−189 facilitated glycophagy (Figure 5B), confirming that both regions of Atg45 are necessary for glycophagy.
We next assessed the autophagic degradation of GFP-tagged Atg45, Atg451−96, and Atg4597−189 under nitrogen starvation. The degradation of Atg4597−189 was comparable to that of Atg45, but Atg451−96 was less degraded than Atg45 (Figure S4A). In addition, Atg45 and Atg4597−189 tagged with mScarlet co-localized with GFP-Atg8, an autophagosomal marker, but Atg451−96-mScarlet did not (Figure S4B). Taken together, these results indicate that the C-terminal half of Atg45 is required for sequestration into autophagosomes, not binding to glycogen.
These results suggest that an AIM is present within the C-terminal half of Atg45. We identified 127YVNL130 as the sole candidate for an AIM within the region. To investigate whether this site functions as AIM, we carried out co-immunoprecipitation of GFP-Atg8 and Atg45-FLAG using the GFP-Trap magnetic agarose system. While WT Atg45 exhibited binding to Atg8, the alanine-substituted mutant of the putative AIM (Y127A and L130A, herein Atg45AIMm) had a low binding ability (Figure 5C). In cells expressing Atg45AIMm, glycophagic activity was lower than that in cells expressing WT Atg45, even when it was overexpressed (Figures 5D and S5A), confirming that 127YVNL130 functions as the AIM. We also noticed that cells harboring a single-copy plasmid encoding ATG45 under the control of its own promoter showed higher levels of Atg45 expression, and consequently, glycophagic activity was increased compared to WT cells (Figure S5B).
Taken togerther, we concluded that Atg45 is a glycophagy receptor protein. Even in cells expressing Atg45AIMm, glycophagic activity was not completely abolished, possibly due to residual Atg8 binding of Atg45AIMm through the mutant AIM or another region of the protein that allows limited localization to the isolation membrane.
The C-terminal region of Atg45 is important for glycophagy
We next examined glycophagic activity in cells expressing the C-terminal-truncated Atg45 mutants Atg451−164 and Atg451−122. As expected, the expression of Atg451−123 resulted in severely impaired glycophagy as the mutant lacks an AIM (Figure 6A). We also found that the Atg451−164 mutant was partially defective in glycophagy (Figure 6A), suggesting that the Atg45165−189 residues at the C-terminus of Atg45 play a role in glycophagy.
Figure 6.

The C-terminal membrane-binding region of Atg45 is important for glycophagy
(A) Schematic of Atg45 and assessed truncation mutants (left). Gsy2-GFP-cleavage in cells cultured in SD-N medium (right). Atg45 and its variants were expressed under the control of the ACT1 promoter. The expression levels of mScarlet-tagged proteins were also determined by western blotting.
(B) Overview of the predicted sequence of the C-terminal putative helix of Atg45 (JPred 4) (upper). The helical wheel of the putative helix predicted by HeliQuest (lower).
(C) Localization of Atg45165−189-GFP and Atg45165−189(6A) -GFP expressed under the control of the ACT1 promoter in cells after 2 h of nitrogen starvation. Scale bar, 2 μm.
(D) GFP-cleavage assay of Gsy2 performed in indicated strains cultured in SD-N media. The expression levels of FLAG-tagged proteins were also assessed by western blotting.
See also Figure S6.
We found that these terminal 172–187 residues likely constitute an amphipathic helix using JPred4 and HeliQuest (Figure 6B). It is known that some amphipathic helices bind to membranes via their hydrophobic surface.54 We found that Atg45165−189-GFP localized to various membranes, including the vacuolar membrane (Figure 6C). When six hydrophobic residues within Atg45165−189 were substituted with alanine (6A; Figure 6B), membrane localization was abolished (Figure 6C). To examine whether this finding is relevant to glycophagy, we examined cells expressing Atg45(6A)-FLAG, showing clearly lower glycophagic activity than cells expressing WT Atg45-FLAG (Figure 6D). This suggests that the membrane-binding ability of the Atg45165−189 region is important for glycophagy. When Atg45(6A) was overexpressed using the ACT1 promoter, glycophagic activity was recovered to the level of cells overexpressing WT Atg45 (Figure S6A). However, cells harboring both 6A and AIMm mutations showed more severe defects than AIMm mutant cells (Figure S6A), indicating that the C-terminal region and the AIM function synergistically. We further tested the effect of the 6A and AIMm mutation on the co-localization of Atg45 with Atg8 in cells expressing Atg45 under its own promotor. Both mutants of Atg45 exhibited a defect in co-localization with Atg8 (Figure S6B).
Taken together, our findings suggest that both the C-terminal region and the AIM of Atg45 collaborate in facilitating glycophagy through their involvement in binding to isolation membranes.
Glycophagy is strongly induced during sporulation
We next sought to identify physiological conditions under which glycophagy is strongly induced. While glycogen is observed to accumulate during the early stages of sporulation, it has been reported that the amount of glycogen decreases later during this process,55,56 leading us to consider whether glycophagy is activated during sporulation. Because the X2180 background strain exhibits a low sporulation rate, we used the SEY6210/SEY6211 background strain to study sporulation.
We induced sporulation in diploid (MATa/α) cells and conducted TEM analyses of PATAg-stained samples. In WT cells, glycogen accumulated in some vacuoles 12 h after induction of sporulation (Figure 7A). Most glycogen was observed in the vacuolar sap, while a fraction was also detected in unruptured autophagic bodies (Figure 7A). This suggests that glycogen is delivered to vacuoles by autophagy, but that it is not efficiently degraded even after autophagic bodies are ruptured. (Figure 7A). In atg45Δ cells, the amount of glycogen in vacuoles was clearly lower than that in WT cells (Figure 7A). These results indicate that glycophagy is strongly induced during sporulation and that sporulation-induced glycophagy is dependent on Atg45.
Figure 7.

Glycophagy is strongly induced during sporulation
(A) Electron micrographs of PATAg-stained WT (MATa/α) and atg45Δ (MATa/α) cells cultured for 12 h in sporulation medium. Yellow arrowhead, autophagic body containing glycogen. Green arrow, autophagosome containing glycogen. Scale bar: 2 μm.
(B) GFP-cleavage assay of Gsy2 in WT (MATα), WT (MATa/α), WT (MATa/a), and atg45Δ (MATa/α) cells cultured in sporulation medium. See also Figure S7C.
(C) Assessment of Atg45-GFP protein levels in MATα, MATa/α, or MATa/a cells cultured for 12 h in sporulation medium by western blotting (left). Ponceau S staining was used to determine total protein loading in each lane. For quantification (right), the values of MATα were set to 1.0. Error bars represent SD (n = 3). One-way ANOVA with Tukey’s multiple comparisons test was used to assess statistically significant differences. p values indicated in the figure.
(D) Expression of ATG45 mRNA in MATα, MATa/α, or MATa/a cells cultured for 12 h in sporulation medium. Error bars represent SD (n = 3). One-way ANOVA with Tukey’s multiple comparisons test was used to assess statistically significant differences. p values indicated in the figure.
(E) Quantification of glycogen in lysates of WT (MATa/α) and atg45Δ (MATa/α) cells, cultured in sporulation medium. The amounts of glycogen (μg) per 1 OD600 unit are shown (n = 2).
See also Figure S7.
The expression of sporulation-related genes is controlled by the MAT locus. Thus, MATa/α cells are capable of sporulation, whereas MAT-homozygous diploid cells (MATa/a cells) and haploid cells (MATa and MATα cells) are not. To investigate whether the induction of glycophagy is also regulated by the MAT locus, we compared the glycophagic activity of MATa/α, MATa/a, and MATα cells. Fluorescence microscopy showed that Gsy2-GFP was delivered to the vacuoles in MATa/α cells but not in MATa/a or MATα cells 12 h after induction of sporulation (Figure S7A). The accumulation of GFP signal in vacuoles was not observed in atg45Δ (MATa/α) cells (Figure S7B), and GFP-cleavage analyses of Gsy2-GFP validated microscopic analyses (Figures 7B and S7C). These results indicate that sporulation-induced glycophagy also depends on the expression of genes controlled by the MAT locus.
We next examined the expression of Atg45-GFP in MATa/α, MATa/a, and MATα cells by western blotting. The amount of Atg45-GFP was higher in MATa/α cells compared to other cells (Figure 7C). Transcription of ATG45 mRNA was induced in MATa/α cells (Figure 7D), which is consistent with a previous study showing that the expression of ATG45 is regulated by Ume6, the transcriptional regulator of early meiotic genes.57 Therefore, the expression of Atg45 is controlled by the MAT locus, and this increased expression of Atg45 is important for the high activity of glycophagy during sporulation.
Finally, we examined the amount of intracellular glycogen during sporulation. The amount of glycogen increased up to 12 h in both WT and atg45Δ cells after shifting to sporulation medium, following which a decrease was observed over time (Figure 7E). This suggests that glycogen is utilized by cells from ∼12 h following exposure to sporulation conditions. We found that glycogen was consumed faster in atg45Δ cells than in WT cells (Figure 7E). Given that glycogen was sequestered into vacuoles in WT cells but not in atg45Δ cells (Figure 7A), glycophagy may play a role in the suppression of glycogen consumption, rather than enhancing degradation.
Discussion
The molecular mechanism of glycophagy in yeast has remained largely unexplored.25 In this study, we find for the first time that glycogen is a non-preferred cargo of bulk autophagy under nitrogen starvation conditions. On the other hand, glycogen gradually becomes a target of autophagy following prolonged nitrogen starvation. We found that Atg45 is important for glycophagy and that this protein binds to both glycogen and Atg8. We therefore conclude that Atg45 functions as a glycophagy receptor. Furthermore, we showed that, during sporulation, the expression of Atg45 is increased and that glycophagic activity is enhanced in an Atg45-dependent manner under these conditions.
How glycogen escapes sequestration by isolation membranes during canonical nitrogen starvation is an interesting question. We observed that glycogen is plentiful in regions adjacent to forming autophagosomes (Figure 4E). This observation suggests that the autophagosome formation site (pre-autophagosomal structure, or PAS) is not physically separated from glycogen in the cytoplasm. For this reason, we speculate that the physicochemical features of glycogen disfavor its sequestration by isolation membranes. While glycogen granules have been reported to be approximately 10–40 nm in diameter,39 we observed that a large portion of glycogen in cells appears to form large assemblies, the size of which can be up to ∼200 nm (Figure 1E). This is possibly too large for efficient sequestration by autophagosomes forming during bulk autophagy. Autophagy of large protein complexes such as ribosomes and proteasomes is dependent on Atg2445,47; the large size of glycogen assemblies might also be the reason that glycophagy requires Atg24. Given that Atg45 is a glycophagy receptor, Atg45 may enhance the affinity of glycogen for isolation membranes, which may, in turn, facilitate the enclosure of glycogen granules into autophagosomes by releasing them from assemblies of glycogen or altering the membrane morphology and/or direction of membrane expansion. Further studies are needed to uncover molecular details of how glycogen escapes engulfment by the isolation membrane, as well as how Atg45 mediates engulfment. Our findings provide a novel insight into the nature of disfavored cargo engulfment by autophagosomes that has previously been overlooked.
Interestingly, we observed that Atg45 requires not only an AIM but also a C-terminal region for efficient glycophagy. When the C-terminal region alone is expressed, it associates with various membranes (Figure 6C), indicating that the C-terminal region of Atg45 may enhance association with isolation membranes by direct binding to these membranes. We also observed the dense localization of glycogen on the inner membrane of autophagosomes in cells overexpressing Atg45 (Figures 4E and 7A). The tight binding of Atg45 to isolation membranes via its AIM and the C-terminal region may enhance the affinity of glycogen for isolation membranes, resulting in efficient glycophagy.
Selective forms of autophagy, such as mitophagy and pexophagy, generally require receptor proteins that recruit Atg11 to the cargo for isolation membrane formation site.11 However, we observed that the deletion of ATG11 did not result in a strong effect on the degradation of Gsy2, with the defect similar in extent to that of Pgk1. The reduction of Gsy2 degradation in atg11Δ cells is likely explained by a general decrease in autophagy activity, and we thus conclude that glycophagy does not require Atg11. As mentioned earlier, Atg45 possibly enhances the affinity of glycogen for the isolation membrane through its AIM and the C-terminal region. Our data indicate that autophagic sequestration of glycogen, which is widely distributed in the cytoplasm including around the PAS, is achieved through enhanced affinity of glycogen with the isolation membrane rather than Atg11-dependent recruitment of the autophagy machinery. Examination of other Atg11-independent receptor proteins including Cue5 may shed light on common mechanisms that govern such forms of degradation.58
While in silico Protein Basic Local Alignment Search Tool (Protein BLAST) analyses indicate that Atg45 is conserved among the Saccharomycetaceae family and that Candida albicans orthologs of Atg45 also exist (such as C1_01930W), direct homologs of Atg45 were not identified in other yeasts. We were also unable to detect any sequence homology between the mammalian glycophagy receptor Stbd1 and Atg45. Stbd1 contains a predicted transmembrane domain sequence in its N-terminal region and localizes to some organelles, such as the ER and lysosomes.16,59,60 However, it has been reported that glycogen is transported to lysosomes in a Stbd1-independent manner in skeletal muscle.61,62 It is possible that soluble receptors like Atg45 exist in mammalian cells in addition to Stbd1. In Drosophila melanogaster, the glycogen synthase GlyS contains an LIR motif, which is also conserved in mammals, and is important for glycophagy.17 Since glycogen synthase works by binding to glycogen, it is also a candidate for a soluble type of glycophagy receptor in these organisms.
Further, a previous report has suggested that glycogen is stored in the vacuole and prevented from degradation by cytosolic enzymes during stationary phase,24 but this has not been clearly proven. We clearly show that glycogen is accumulated in vacuoles in an Atg45-dependent manner during sporulation. It has been reported that Sga1 is induced and relocated to the prospore membrane from vacuoles21,22,63 during spore maturation, which is required for the efficient degradation of glycogen. Therefore, the degradation of glycogen possibly occurs in the cytosol, especially around the prospore membrane, whereas vacuoles are not substantially involved in the degradation of glycogen during sporulation. This implies that glycophagy delivers glycogen to the vacuole, where it is protected from degradation in the cytosol, as Wang et al. previously proposed.24 Indeed, the amount of glycogen was decreased in atg45Δ cells compared with WT cells during sporulation. The accumulated glycogen preserved in the vacuole may subsequently be used as an energy source at a later phase, or during the metabolically demanding process of spore germination.
Limitations of the study
Our study indicates that, under nitrogen starvation, glycogen is a non-preferred cargo for autophagy and that Atg45 enhances the affinity of glycogen for isolation membranes, facilitating glycophagy. However, we cannot rule out the possibility that the physicochemical properties of glycogen, such as low fluidity or physical size, as well as changes between nitrogen starvation and sporulation conditions, affect glycophagic activity differently under each condition. The development of tools that specifically describe the state of glycogen will contribute to uncovering more insights into the mechanisms of glycophagy.
While we found that the Gsy2-GFP-cleavage assay is a suitable assay for glycophagy, the assay is potentially unreliable if a portion of Gsy2-GFP does not bind glycogen. Therefore, it is necessary to confirm the binding of Gsy2 with glycogen under the conditions used and to validate results using other methods, such as electron microscopy.
STAR★Methods
Key resources table
| REAGENT or RESOURCE | SOURCE | IDENTIFIER |
|---|---|---|
| Antibodies | ||
| Monoclonal ANTI-FLAG® M5 antibody | Sigma–Aldrich | Cat# F-4042; RRID: AB_439686 |
| PGK1 Monoclonal Antibody (22C5D8) | Thermo Fisher Scientific | Cat# 459250; RRID: AB_2532235 |
| Anti β-Actin, Monoclonal Antibody | Fujifilm Wako Pure Chemical Corporation | Cat# 011-24554 |
| Anti-GFP | Roche | Cat# 11814460001; RRID: AB_390913 |
| Anti-mCherry antibody | Abcam | Cat# ab125096; RRID: AB_11133266 |
| Anti-mouse IgG, HRP-linked antibody | Jackson Immuno Research | Cat# 315-035-003; RRID: AB_2340061 |
| Chemicals, peptides, and recombinant proteins | ||
| PrimeScript™ RT reagent Kit with gDNA Eraser | TaKaRa | Cat# RR047 |
| PrimeSTAR Mutagenesis Basal Kit | TaKaRa | Cat# R046A |
| Quetol-651 | Nisshin EM Co. | Cat# 371 |
| Ponceau S | nacalai tesque | Cat# 283-22-25G |
| cOmplete protease inhibitor cocktail | Roche | Cat# 11836170001 |
| PhosSTOP phosphatase inhibitor cocktail | Roche | Cat# 4906845001 |
| TB Green Premix Ex Taq II (Tli RNase H Plus) | TaKaRa | Cat# RR820 |
| amyloglucosidase from Aspergillus niger | Sigma-Aldrich | Cat# 10115-1G-F |
| Glycogen from Oyster | Sigma-Aldrich | Cat# G8751-5G |
| Femtoglow HRP Substrat | Michigan Diagnostics, | Cat# 21008 |
| Critical commercial assays | ||
| Glucose (GO) Assay Kit | Sigma-Aldrich | Cat# GAGO20-1KT |
| Experimental models: Organisms/strains | ||
| S. cerevisiae strains, see Table S1 | This study | N/A |
| Oligonucleotides | ||
| Primers, see Table S2 | This study | N/A |
| Recombinant DNA | ||
| Plasmids, see Table S3 | This study | N/A |
| Software and algorithms | ||
| imageJ/Fiji | National Institutes of Health | https://imagej.net/Fiji |
| CellSens | Olympus | https://www.olympus-lifescience.com/en/software/cellsens/ |
| Vision-Capt | Vilber-Lourmat | N/A |
| JMP 16 | JMP Statistical Discovery, North Carolina, United States | https://www.jmp.com/en_us/home.html |
| Other | ||
| GFP-Trap_M beads | ChromoTek | Cat# gtma-20 |
| PrimeScript™ RT reagent Kit with gDNA Eraser | TaKaRa | Cat# RR047 |
| PrimeSTAR Mutagenesis Basal Kit | TaKaRa | Cat# R046A |
| 0.5 mm zirconia beads | Yasui Kikai | Cat# YZB05 |
| 0.45 μm PVDF membranes | Millipore | Cat# IPVH00010 |
Resource availability
Lead contact
Further information and requests for resources should be directed to the lead contact, Yoshinori Ohsumi (ohsumi.y.aa@m.titech.ac.jp).
Materials availability
This study did not generate new unique reagents. Plasmids and cell lines generated in this paper are available from the lead contact upon request.
Data and code availability
-
•
All data reported in this paper will be shared by the lead contact upon request.
-
•
This paper does not report original code.
-
•
Any additional information required to reanalyze the data reported in this paper is available from the lead contact upon request.
Experimental model and study participant details
Yeast strains and media
Strains used in this study are listed in Table S1. Gene disruption and tagging were performed using a standard PCR-based method with specific primers, as listed in Table S2.64,65 Cells were grown in rich medium (YPD medium: 1% yeast extract, 2% peptone, and 2% glucose), synthetic defined medium (SD medium: 0.17% Difco yeast nitrogen base without amino acids and ammonium sulfate, 0.5% ammonium sulfate, and 2% glucose) or SDCA medium which is SD medium containing 0.5% BactoTM casamino acid (Difco). To induce autophagy, yeast cells were grown in liquid medium at 30°C to a density of around OD600 = 1.0, were washed twice with sterile water and then shifted to SD-N medium (0.17% Difco yeast nitrogen base without amino acids and ammonium sulfate, and 2% glucose). To induce sporulation, cells were grown in YPD medium at 30°C for 24 h and shifted to YPA medium (1% CH3COOK, 1% yeast extract, 2% Peptone) at OD600 = 0.2, then cultured for 12 h before being transferred to sporulation medium (1% CH3COOK) at OD600 = 1.0 after washing twice with sterile water.
Plasmids
Plasmids used in this study are listed in Table S3. For the construction of pTA1, the full length of ATG45, including the 500 bp upstream and 500 bp downstream regions, was cloned into the pRS416 vector. A 3xFLAG-tag sequence was then inserted downstream of ATG45 by inverse PCR. For the construction of pTA2, the Tyr127 and Leu130 residues of Atg45 were replaced with Ala, using the PrimeSTAR Mutagenesis Basal Kit (Takara) and pTA1 as the template. For the construction of pTA5 and pTA6, the ACT1 promoter and ATG45- or ATG45 AIMm-3xFLAG were amplified from pET103 and pTA1 or pTA2, respectively, with the resulting DNA fragments then assembled by the SLiCE method.66 For the construction of pTA7, the Leu173, Leu176, Ile179, Val183, Tyr186, and Trp187 residues of Atg45 were replaced with Ala, using pTA5 as the template. For the construction of pTA8, the Tyr127 and Leu130 residues of Atg45 were replaced with Ala, using pTA7 as the template. For the construction of pTA3 and pTA4, the full length of ATG45, including the 500 bp upstream region, and ATG45(6A)- or ATG45AIMm(6A)-3xFLAG were amplified from pTA1 and pTA7 or pTA8, respectively, and assembled by the SLiCE method. For the construction of pTA9, GFP was amplified from pFA6a-GFP-natNT2 and a DNA fragment from pRS416-ACT1pr-ATG45-3xFLAG (pTA5) without the 3xFLAG region was amplified from pTA5. pRS416-ACT1pr-ATG45-GFP was constructed by the SLiCE method using these DNA fragments. pTA9 was amplified by a standard PCR mutagenesis technique using plasmid pRS416-ACT1pr-ATG45-GFP as the template DNA. For the construction of pTA10, GFP was amplified from pFA6a-mGFPhy-natNT2, and the DNA fragment containing pRS416-ACT1pr-ATG45(6A)-3xFLAG (pTA7) without the 3xFLAG sequence was amplified from pTA7. pRS416-ACT1pr-ATG45(6A)-GFP was constructed by the SLiCE method using these DNA fragments. For the construction of pTA11, mScarlet was amplified from pFA6a-mScarlet-hphNT1 and a DNA fragment from pRS416-ATG45pr-ATG45-3xFLAG without the 3xFLAG region was amplified from pTA1. pRS416-ATG45pr-ATG45-mScarlet was constructed by the SLiCE method using these DNA fragments. For the construction of pTA12, mScarlet was amplified from pFA6a-mScarlet-hphNT1 and a DNA fragment from pRS416-ATG45pr-ATG45AIMm-3xFLAG (pTA2) without the 3xFLAG region was amplified from pTA2. pRS416-ATG45pr-ATG45AIMm-mScarlet was constructed by the SLiCE method using these DNA fragments. For the construction of pTA13, mScarlet was amplified from pFA6a-mScarlet-hphNT1 and a DNA fragment from pRS416-ATG45pr-ATG45(6A)-3xFLAG (pTA3) without the 3xFLAG region was amplified from pTA3. pRS416-ATG45pr-ATG45(6A)-mScarlet was constructed by the SLiCE method using these DNA fragments.
Method details
Protein extraction
1 OD600 unit of cells was treated with 10% trichloroacetic acid (TCA) for at least 30 min on ice. Samples were centrifuged at 20,000 g at 4°C for 15 min. The supernatant was removed, and the pellet was washed with ice-cold acetone and resuspended in HU sample buffer (0.5 M NaH2PO4-Na2HPO4 pH 6.8, 50 mM EDTA, 8 M urea, 10% SDS, 10% glycerol, 25 mM dithiothreitol [DTT], 0.2 mg/mL bromophenol blue). Samples were homogenized using 0.5 mm zirconia beads (Yasui Kikai, YZB05) and a FastPrep-24 (MP Biomedicals, 6004-500) with a setting of 60 s at 6.0 m/s, before incubation at 65°C for 15 min.
Western blotting
10% polyacrylamide gels (375 mM Tris-HCl pH 8.8, 10% acrylamide/bis mixed solution [nacalai tesque], 0.1% SDS, 0.16% APS, and 0.09% TEMED) were overlayed with a stacking gel (125 mM Tris-HCl pH 6.8, 5% acrylamide/bis mixed solution, 0.1% SDS, 0.16% APS, and 0.09% TEMED). Samples (except for those used for the detection of Pgk1-GFP) were loaded into wells directly following the preparation described above; Pgk1-GFP samples were diluted 1:25 before loading into wells. In Figure 4A, the protein concentrations were measured and samples loaded at equivalent concentrations. Samples were run at 40 mA (per gel) for 70 min using a myPower Ⅱ 300 power supply (ATTO, AE-8135). Separated proteins were then transferred onto 0.45 μm PVDF membranes (Millipore, IPVH00010) using a Trans-Blot Turbo transfer system (Bio-Rad). Membranes were stained with 1% Ponceau S (nacalai tesque, 283-22-25G) dissolved in 5% CH3COOH and digitized using a scanner (EPSON, GT-X970). Membranes were washed with TBS-T three times and blocked in 1% skim milk in TBS-T for 30 min. Membranes were then incubated with the relevant primary antibody at 4°C overnight, or at room temperature for 1 h, were washed three times with TBS-T before incubation with a relevant secondary antibody at room temperature for 30 min. After washing with TBS-T three times, Femtoglow HRP Substrate (Michigan Diagnostics, 21008) was used to initiate chemiluminescence and blots were visualized using a FUSION-FX7 (Vilber-Lourmat) imaging system.
GFP-cleavage assay
Cells expressing proteins tagged with GFP were incubated in SD-N medium or sporulation medium. The amounts of GFP-tagged proteins and free GFP were assessed by western blotting using anti-GFP antibodies. The density of blots was quantified by using Vision-Capt (Vilber-Lourmat), and the ratio of free GFP to the sum of full-length fusion protein and GFP were calculated.
Antibodies
Anti-FLAG (Sigma-Aldrich, F-4042, 1:1000), anti-Pgk1 (Thermo Fisher Scientific, 459250, 1:2000), anti-β-actin (Fujifilm Wako Pure Chemical Corporation, 011-24554, 1:500), anti-GFP (Roche,11814460001, 1:1000), and anti-mCherry (Abcam, ab125096, 1:1000) antibodies were used as primary antibodies. Anti-mouse IgG, HRP-linked antibody (Jackson Immuno Research, 315-035-003, 1:5000) was used as the secondary antibody.
Electron microscopy
Electron microscopy was performed by Tokai-EMT Inc. Cells were sandwiched between copper disks and quickly frozen in liquid propane at −175°C. The frozen samples were substituted with 2% glutaraldehyde, and 1% tannic acid in ethanol at −80°C for 2 days and then kept at −20°C for 2 h, followed by a warm-up to 4°C for 2 h. These samples were dehydrated through ethanol three times for 30 min each, and then dehydrated with ethanol at room temperature overnight. The samples were infiltrated with propylene oxide (PO) twice for 30 min each and were put into a 50:50 mixture of PO and resin (Quetol-651; Nisshin EM Co.) for 3 h. Samples were then transferred to 100% resin and incubated overnight. These samples were polymerized at 60°C for 48 h. After polymerization, the blocks were ultra-thin sectioned at 80 nm with a diamond knife using an ultramicrotome (ULTRACUT, UCT, Leica). These sections were placed on nickel grids, and incubated with 1% periodic acid for 20 min, followed by washing with distilled water. These grids were incubated with 0.5% thiocarbohydrazide in 20% acetic acid for 60 min, and were then washed with 10% acetic acid and distilled water. Finally, grids were incubated in 1% silver proteinate for 60 min and then washed with distilled water. The grids were observed by a transmission electron microscope (JEM-1400Plus; JEOL Ltd.) at an acceleration voltage of 100 kV. Digital images were taken with a CCD camera (EM-14830RUBY2; JEOL Ltd.).
Fluorescence microscopy
Cells were cultured in SD, SD-N, or sporulation medium for the indicated times. Fluorescence microscopy was carried out using a confocal microscope (IXplore SpinSR10) equipped with an sCMOS camera (ORCA-Flash4.0, Hamamatsu), a 100x objective lens (UPLAPO 100xOHR, NA/1.50; Olympus) and appropriate lasers and filters. Images were acquired and processed using CellSens (Olympus) software and Fiji distribution of ImageJ.67
In Figures S2B–S2E, fluorescence intensities were obtained using the Plot Profile function in Fiji. The average of the value of 2 pixels was calculated, and the minimum and maximum values from individual fluorescent channels were normalized to 0 and 100, respectively.
Co-immunoprecipitation
Cells were cultured in SD-N medium at 30°C for 1 h and 50 OD600 units of cells were harvested. The cells were disrupted in lysis buffer (10 mM Tris-HCl pH 7.5, 30 mM NaCl, 1 mM EDTA, 2% glycerol, 50 mM NaF, 1 mM DTT, 2 mM phenylmethylsulfonyl fluoride [PMSF], 2× cOmplete protease inhibitor cocktail [Roche], and 0.1× PhosSTOP phosphatase inhibitor cocktail [Roche]), using a Multi-beads Shocker (Yasui Kikai) and 0.5-mm zirconia beads. The lysates were solubilized by rotation at 4°C for 15 min with 0.5% Triton X-100, and were then centrifuged twice at 500 g for 5 min each. The supernatants were incubated with GFP-Trap_M beads (ChromoTek) at 4°C for 2 h. The beads were washed with lysis buffer containing 0.3% Triton X-100 three times, and then incubated in SDS sample buffer at 95°C for 5 min to elute bound proteins.
Glycogen pellet assay
WT or glg1Δglg2Δ cells expressing each GFP-tagged protein were grown in SD medium at 30°C to a density of around OD600 = 1.0, and 50 OD600 units of cells were harvested for sample preparation. In Figure 1C, cells were shifted to SD-N medium and incubated for 6 h before sample preparation. Samples were disrupted in lysis buffer, as described for co-immunoprecipitation, using a Multi-beads Shocker and 0.5-mm zirconia beads. In Figure 5A, the lysates were centrifuged twice at 20,000 g for 5 min at 4°C. The supernatants were mixed with the same volume of the lysis buffer or the lysis buffer containing 20 mg/mL glycogen by rotation at 4°C for 1 h. In Figure 1C, the lysates were centrifuged twice at 2,000 g for 5 min at 4°C. In both figures, a portion of lysates was collected as total lysate, and the remaining samples were centrifuged at 100,000 g and 4°C for 1 h. the supernatants were collected, and the pellets were resuspended in an equal volume of lysis buffer to the supernatants. Each sample was mixed with the same volume of 2x SDS sample buffer and incubated at 95°C for 5 min.
RNA extraction
Total cellular RNA was extracted by a hot phenol method, as described previously.52 10 OD600 units of cells were harvested and frozen. 400 μL of AE buffer (50 mM CH3COONa and 10 mM EDTA pH 5.0) with 1% SDS were added to cell pellets on ice, and 0.5-mm zirconia beads and 500 μL of AE buffer-saturated hot phenol, pre-warmed at 65°C, were added. The samples were homogenized using a FastPrep-24 for 30 sec at 5.5 m/s in four cycles. The homogenized samples were incubated on ice for 1 min and centrifuged. The supernatants were mixed with ANE buffer (10 mM sodium acetate, 100 mM NaCl, and 2 mM EDTA)-saturated phenol: chloroform and vortexed for 1 min and then centrifuged for 5 min. The supernatants were mixed with chloroform: isoamyl alcohol and vortexed for 1 min. Samples were centrifuged for 5 min, and the supernatants were mixed with 2.5 times the volume of ethanol with 300 mM CH3COONa (pH 5.3), and then stored overnight at −20°C. The samples were centrifuged at 4°C and supernatants were removed. 500 μL of 70% ethanol was added to pellets and samples were centrifuged at 4°C. After removing the supernatant, pellets were resuspended in RNase-free water.
qPCR
Complementary DNAs (cDNAs) were synthesized from 1 mg of RNA using the PrimeScript RT reagent kit with gDNA eraser (TAKARA, RR047). A random hexamer was used for cDNA synthesis. qPCR was performed using TB Green Premix Ex Taq II (Tli RNase H Plus) (TAKARA, RR820) with the target mRNA-specific primers listed in Table S2.
Serial dilutions of cDNA were used for the qPCR standard. Melting-curve analyses confirmed the amplification of a single product for each mRNA. The relative amount of ATG45 mRNA and TAF10 mRNA68 or ACT1 mRNA (internal control) was calculated from CT value, using the qPCR standard. The expression level of ATG45 was normalized by calculating the relative amount of ATG45 mRNA to that of TAF10 in Figure 7D. In Figure S3A, transcripts of ACT1 and TAF10 mRNA were markedly reduced after nitrogen starvation induction compared to 0 hours. Therefore, the relative amount of ATG45 and these internal controls was shown together rather than the normalized expression level of ATG45 mRNA .
Quantification of intracellular glycogen
The amount of glycogen was measured by a method previously reported.69 5 OD600 units of cells were harvested. The cells were lysed by incubation in 125 μL of 0.25 M Na2CO3 at 95°C for 4 h. 75 μL of 1 M CH3COOH and 300 μL of CH3COONa were added to each sample, and the samples were vortexed for 10 s. 250 μL of each sample was mixed with 10 μL of 20 mg/mL amyloglucosidase from Aspergillus niger (Sigma-Aldrich, 10115-1G-F), dissolved in 0.2 M CH3COONa (pH 5.2) and was then incubated at 58°C for 17 h. These samples were centrifuged and supernatants were collected. The amount of glucose of the supernatants was measured using a Glucose (GO) Assay Kit (Sigma-Aldrich, GAGO20-1KT). Note that the removal of intracellular glucose is unnecessary because most intracellular glucose is converted to a phosphorylated form (e. g. glucose-6-phosphate) that is not detected in this assay.
Quantification and statistical analyses
Error bars represent SD as indicated in the figure legends. Data were processed in Excel 2016, R, or JMP 16. Statistical analysis of differences between two groups was performed using Wilcoxon rank sum test or Welch’s t-test, and three or more groups were One-way ANOVA with Dunnett’s test, One-way ANOVA with Tukey’s multiple comparisons test, or Steel test as indicated in figure legends.
Acknowledgments
We are grateful to all the members of Ohsumi laboratory for helpful discussions, the Biomaterials Analysis Division (Tokyo Institute of Technology) for DNA sequencing, the National BioResource Project (NBRP) for providing the SEY6211 strain, Akira Matsuura for providing the pYC50-GAL-HO plasmid, and Hiroshi Iwasaki for supporting my PhD research. We would like to thank Alexander I May for editing the manuscript and Yui Jin for the critical comments on the manuscript. This work was supported by JSPS KAKENHI (16H06375 and 19H05708 to Y.O., 19K16121 and 22K15101 to E.T.).
Author contributions
T.I., E.T., and Y.O. designed the project. T.I., E.T., S.H., and S.H.-R. performed the experiments. T.I. and Y.O. wrote the manuscript. All authors discussed the results and commented on the manuscript.
Declaration of interests
The authors declare no competing interests.
Published: April 26, 2024
Footnotes
Supplemental information can be found online at https://doi.org/10.1016/j.isci.2024.109810.
Supplemental information
References
- 1.Epple U.D., Eskelinen E.-L., Thumm M. Intravacuolar membrane lysis in Saccharomyces cerevisiae. Does vacuolar targeting of Cvt17/Aut5p affect its function? J. Biol. Chem. 2003;278:7810–7821. doi: 10.1074/jbc.M209309200. [DOI] [PubMed] [Google Scholar]
- 2.Epple U.D., Suriapranata I., Eskelinen E.L., Thumm M. Aut5/Cvt17p, a putative lipase essential for disintegration of autophagic bodies inside the vacuole. J. Bacteriol. 2001;183:5942–5955. doi: 10.1128/JB.183.20.5942-5955.2001. [DOI] [PMC free article] [PubMed] [Google Scholar]
- 3.Teter S.A., Eggerton K.P., Scott S.V., Kim J., Fischer A.M., Klionsky D.J. Degradation of lipid vesicles in the yeast vacuole requires function of Cvt17, a putative lipase. J. Biol. Chem. 2001;276:2083–2087. doi: 10.1074/jbc.C000739200. [DOI] [PMC free article] [PubMed] [Google Scholar]
- 4.Ramya V., Rajasekharan R. ATG15 encodes a phospholipase and is transcriptionally regulated by YAP1 in Saccharomyces cerevisiae. FEBS Lett. 2016;590:3155–3167. doi: 10.1002/1873-3468.12369. [DOI] [PubMed] [Google Scholar]
- 5.Takeshige K., Baba M., Tsuboi S., Noda T., Ohsumi Y. Autophagy in yeast demonstrated with proteinase-deficient mutants and conditions for its induction. J. Cell Biol. 1992;119:301–311. doi: 10.1083/jcb.119.2.301. [DOI] [PMC free article] [PubMed] [Google Scholar]
- 6.Kagohashi Y., Sasaki M., May A.I., Kawamata T., Ohsumi Y. The mechanism of Atg15-mediated membrane disruption in autophagy. J. Cell Biol. 2023;222 doi: 10.1083/jcb.202306120. [DOI] [PMC free article] [PubMed] [Google Scholar]
- 7.Onodera J., Ohsumi Y. Autophagy is required for maintenance of amino acid levels and protein synthesis under nitrogen starvation. J. Biol. Chem. 2005;280:31582–31586. doi: 10.1074/jbc.M506736200. [DOI] [PubMed] [Google Scholar]
- 8.May A.I., Prescott M., Ohsumi Y. Autophagy facilitates adaptation of budding yeast to respiratory growth by recycling serine for one-carbon metabolism. Nat. Commun. 2020;11:5052. doi: 10.1038/s41467-020-18805-x. [DOI] [PMC free article] [PubMed] [Google Scholar]
- 9.Liu K., Sutter B.M., Tu B.P. Autophagy sustains glutamate and aspartate synthesis in Saccharomyces cerevisiae during nitrogen starvation. Nat. Commun. 2021;12:57. doi: 10.1038/s41467-020-20253-6. [DOI] [PMC free article] [PubMed] [Google Scholar]
- 10.Kirkin V., Rogov V.V. A Diversity of Selective Autophagy Receptors Determines the Specificity of the Autophagy Pathway. Mol. Cell. 2019;76:268–285. doi: 10.1016/j.molcel.2019.09.005. [DOI] [PubMed] [Google Scholar]
- 11.Zientara-Rytter K., Subramani S. Mechanistic Insights into the Role of Atg11 in Selective Autophagy. J. Mol. Biol. 2020;432:104–122. doi: 10.1016/j.jmb.2019.06.017. [DOI] [PMC free article] [PubMed] [Google Scholar]
- 12.Zhou Z., Liu J., Fu T., Wu P., Peng C., Gong X., Wang Y., Zhang M., Li Y., Wang Y., et al. Phosphorylation regulates the binding of autophagy receptors to FIP200 Claw domain for selective autophagy initiation. Nat. Commun. 2021;12:1570. doi: 10.1038/s41467-021-21874-1. [DOI] [PMC free article] [PubMed] [Google Scholar]
- 13.Turco E., Witt M., Abert C., Bock-Bierbaum T., Su M.-Y., Trapannone R., Sztacho M., Danieli A., Shi X., Zaffagnini G., et al. FIP200 Claw Domain Binding to p62 Promotes Autophagosome Formation at Ubiquitin Condensates. Mol. Cell. 2019;74:330–346.e11. doi: 10.1016/j.molcel.2019.01.035. [DOI] [PMC free article] [PubMed] [Google Scholar]
- 14.Kamber R.A., Shoemaker C.J., Denic V. Receptor-Bound Targets of Selective Autophagy Use a Scaffold Protein to Activate the Atg1 Kinase. Mol. Cell. 2015;59:372–381. doi: 10.1016/j.molcel.2015.06.009. [DOI] [PMC free article] [PubMed] [Google Scholar]
- 15.Jiang S., Wells C.D., Roach P.J. Starch-binding domain-containing protein 1 (Stbd1) and glycogen metabolism: Identification of the Atg8 family interacting motif (AIM) in Stbd1 required for interaction with GABARAPL1. Biochem. Biophys. Res. Commun. 2011;413:420–425. doi: 10.1016/j.bbrc.2011.08.106. [DOI] [PMC free article] [PubMed] [Google Scholar]
- 16.Jiang S., Heller B., Tagliabracci V.S., Zhai L., Irimia J.M., DePaoli-Roach A.A., Wells C.D., Skurat A.V., Roach P.J. Starch binding domain-containing protein 1/genethonin 1 is a novel participant in glycogen metabolism. J. Biol. Chem. 2010;285:34960–34971. doi: 10.1074/jbc.M110.150839. [DOI] [PMC free article] [PubMed] [Google Scholar]
- 17.Zirin J., Nieuwenhuis J., Perrimon N. Role of autophagy in glycogen breakdown and its relevance to chloroquine myopathy. PLoS Biol. 2013;11 doi: 10.1371/journal.pbio.1001708. [DOI] [PMC free article] [PubMed] [Google Scholar]
- 18.Zhao H., Tang M., Liu M., Chen L. Glycophagy: An emerging target in pathology. Clin. Chim. Acta. 2018;484:298–303. doi: 10.1016/j.cca.2018.06.014. [DOI] [PubMed] [Google Scholar]
- 19.François J., Parrou J.L. Reserve carbohydrates metabolism in the yeast Saccharomyces cerevisiae. FEMS Microbiol. Rev. 2001;25:125–145. doi: 10.1111/j.1574-6976.2001.tb00574.x. [DOI] [PubMed] [Google Scholar]
- 20.Aris J.P., Alvers A.L., Ferraiuolo R.A., Fishwick L.K., Hanvivatpong A., Hu D., Kirlew C., Leonard M.T., Losin K.J., Marraffini M., et al. Autophagy and leucine promote chronological longevity and respiration proficiency during calorie restriction in yeast. Exp. Gerontol. 2013;48:1107–1119. doi: 10.1016/j.exger.2013.01.006. [DOI] [PMC free article] [PubMed] [Google Scholar]
- 21.Pugh T.A., Shah J.C., Magee P.T., Clancy M.J. Characterization and localization of the sporulation glucoamylase of Saccharomyces cerevisiae. Biochim. Biophys. Acta. 1989;994:200–209. doi: 10.1016/0167-4838(89)90294-x. [DOI] [PubMed] [Google Scholar]
- 22.Lam C., Santore E., Lavoie E., Needleman L., Fiacco N., Kim C., Neiman A.M. A visual screen of protein localization during sporulation identifies new components of prospore membrane-associated complexes in budding yeast. Eukaryot. Cell. 2014;13:383–391. doi: 10.1128/EC.00333-13. [DOI] [PMC free article] [PubMed] [Google Scholar]
- 23.Wilson W.A., Wang Z., Roach P.J. Systematic identification of the genes affecting glycogen storage in the yeast Saccharomyces cerevisiae: implication of the vacuole as a determinant of glycogen level. Mol. Cell. Proteomics. 2002;1:232–242. doi: 10.1074/mcp.m100024-mcp200. [DOI] [PubMed] [Google Scholar]
- 24.Wang Z., Wilson W.A., Fujino M.A., Roach P.J. Antagonistic controls of autophagy and glycogen accumulation by Snf1p, the yeast homolog of AMP-activated protein kinase, and the cyclin-dependent kinase Pho85p. Mol. Cell Biol. 2001;21:5742–5752. doi: 10.1128/MCB.21.17.5742-5752.2001. [DOI] [PMC free article] [PubMed] [Google Scholar]
- 25.Parzych K.R., Klionsky D.J. Vacuolar hydrolysis and efflux: current knowledge and unanswered questions. Autophagy. 2019;15:212–227. doi: 10.1080/15548627.2018.1545821. [DOI] [PMC free article] [PubMed] [Google Scholar]
- 26.Takeda E., Isoda T., Hosokawa S., Oikawa Y., Hotta-Ren S., May A.I., Ohsumi Y. Receptor-mediated cargo hitchhiking on bulk autophagy. EMBO J. 2024 doi: 10.1038/s44318-024-00091-8. [DOI] [PMC free article] [PubMed] [Google Scholar]
- 27.Wilson W.A., Boyer M.P., Davis K.D., Burke M., Roach P.J. The subcellular localization of yeast glycogen synthase is dependent upon glycogen content. Can. J. Microbiol. 2010;56:408–420. doi: 10.1139/w10-027. [DOI] [PMC free article] [PubMed] [Google Scholar]
- 28.Baskaran S., Chikwana V.M., Contreras C.J., Davis K.D., Wilson W.A., DePaoli-Roach A.A., Roach P.J., Hurley T.D. Multiple glycogen-binding sites in eukaryotic glycogen synthase are required for high catalytic efficiency toward glycogen. J. Biol. Chem. 2011;286:33999–34006. doi: 10.1074/jbc.M111.264531. [DOI] [PMC free article] [PubMed] [Google Scholar]
- 29.Froese D.S., Michaeli A., McCorvie T.J., Krojer T., Sasi M., Melaev E., Goldblum A., Zatsepin M., Lossos A., Álvarez R., et al. Structural basis of glycogen branching enzyme deficiency and pharmacologic rescue by rational peptide design. Hum. Mol. Genet. 2015;24:5667–5676. doi: 10.1093/hmg/ddv280. [DOI] [PMC free article] [PubMed] [Google Scholar]
- 30.Mathieu C., Dupret J.-M., Rodrigues Lima F. The structure of brain glycogen phosphorylase-from allosteric regulation mechanisms to clinical perspectives. FEBS J. 2017;284:546–554. doi: 10.1111/febs.13937. [DOI] [PubMed] [Google Scholar]
- 31.Zhai L., Feng L., Xia L., Yin H., Xiang S. Crystal structure of glycogen debranching enzyme and insights into its catalysis and disease-causing mutations. Nat. Commun. 2016;7 doi: 10.1038/ncomms11229. [DOI] [PMC free article] [PubMed] [Google Scholar]
- 32.Meyer F., Heilmeyer L.M., Haschke R.H., Fischer E.H. Control of phosphorylase activity in a muscle glycogen particle. I. Isolation and characterization of the protein-glycogen complex. J. Biol. Chem. 1970;245:6642–6648. [PubMed] [Google Scholar]
- 33.Díaz A., Martínez-Pons C., Fita I., Ferrer J.C., Guinovart J.J. Processivity and subcellular localization of glycogen synthase depend on a non-catalytic high affinity glycogen-binding site. J. Biol. Chem. 2011;286:18505–18514. doi: 10.1074/jbc.M111.236109. [DOI] [PMC free article] [PubMed] [Google Scholar]
- 34.Parrou J.L., Enjalbert B., Plourde L., Bauche A., Gonzalez B., François J. Dynamic responses of reserve carbohydrate metabolism under carbon and nitrogen limitations in Saccharomyces cerevisiae. Yeast. 1999;15:191–203. doi: 10.1002/(SICI)1097-0061(199902)15:3<191::AID-YEA358>3.0.CO;2-O. [DOI] [PubMed] [Google Scholar]
- 35.Baba M., Takeshige K., Baba N., Ohsumi Y. Ultrastructural analysis of the autophagic process in yeast: detection of autophagosomes and their characterization. J. Cell Biol. 1994;124:903–913. doi: 10.1083/jcb.124.6.903. [DOI] [PMC free article] [PubMed] [Google Scholar]
- 36.Baba M. Electron microscopy in yeast. Methods Enzymol. 2008;451:133–149. doi: 10.1016/S0076-6879(08)03210-2. [DOI] [PubMed] [Google Scholar]
- 37.Testoni G., Duran J., García-Rocha M., Vilaplana F., Serrano A.L., Sebastián D., López-Soldado I., Sullivan M.A., Slebe F., Vilaseca M., et al. Lack of Glycogenin Causes Glycogen Accumulation and Muscle Function Impairment. Cell Metabol. 2017;26:256–266.e4. doi: 10.1016/j.cmet.2017.06.008. [DOI] [PubMed] [Google Scholar]
- 38.Gehre L., Gorgette O., Perrinet S., Prevost M.-C., Ducatez M., Giebel A.M., Nelson D.E., Ball S.G., Subtil A. Sequestration of host metabolism by an intracellular pathogen. Elife. 2016;5 doi: 10.7554/eLife.12552. [DOI] [PMC free article] [PubMed] [Google Scholar]
- 39.Prats C., Graham T.E., Shearer J. The dynamic life of the glycogen granule. J. Biol. Chem. 2018;293:7089–7098. doi: 10.1074/jbc.R117.802843. [DOI] [PMC free article] [PubMed] [Google Scholar]
- 40.Kim J., Kamada Y., Stromhaug P.E., Guan J., Hefner-Gravink A., Baba M., Scott S.V., Ohsumi Y., Dunn W.A., Klionsky D.J. Cvt9/Gsa9 functions in sequestering selective cytosolic cargo destined for the vacuole. J. Cell Biol. 2001;153:381–396. doi: 10.1083/jcb.153.2.381. [DOI] [PMC free article] [PubMed] [Google Scholar]
- 41.Shintani T., Klionsky D.J. Cargo proteins facilitate the formation of transport vesicles in the cytoplasm to vacuole targeting pathway. J. Biol. Chem. 2004;279:29889–29894. doi: 10.1074/jbc.M404399200. [DOI] [PMC free article] [PubMed] [Google Scholar]
- 42.Kanki T., Wang K., Baba M., Bartholomew C.R., Lynch-Day M.A., Du Z., Geng J., Mao K., Yang Z., Yen W.-L., Klionsky D.J. A genomic screen for yeast mutants defective in selective mitochondria autophagy. Mol. Biol. Cell. 2009;20:4730–4738. doi: 10.1091/mbc.e09-03-0225. [DOI] [PMC free article] [PubMed] [Google Scholar]
- 43.Cheong H., Yorimitsu T., Reggiori F., Legakis J.E., Wang C.-W., Klionsky D.J. Atg17 regulates the magnitude of the autophagic response. Mol. Biol. Cell. 2005;16:3438–3453. doi: 10.1091/mbc.e04-10-0894. [DOI] [PMC free article] [PubMed] [Google Scholar]
- 44.Zhao D., Liu X.-M., Yu Z.-Q., Sun L.-L., Xiong X., Dong M.-Q., Du L.-L. Atg20- and Atg24-family proteins promote organelle autophagy in fission yeast. J. Cell Sci. 2016;129:4289–4304. doi: 10.1242/jcs.194373. [DOI] [PubMed] [Google Scholar]
- 45.Nemec A.A., Howell L.A., Peterson A.K., Murray M.A., Tomko R.J. Autophagic clearance of proteasomes in yeast requires the conserved sorting nexin Snx4. J. Biol. Chem. 2017;292:21466–21480. doi: 10.1074/jbc.M117.817999. [DOI] [PMC free article] [PubMed] [Google Scholar]
- 46.Kanki T., Klionsky D.J. Mitophagy in yeast occurs through a selective mechanism. J. Biol. Chem. 2008;283:32386–32393. doi: 10.1074/jbc.M802403200. [DOI] [PMC free article] [PubMed] [Google Scholar]
- 47.Kotani T., Sakai Y., Kirisako H., Kakuta C., Kakuta S., Ohsumi Y., Nakatogawa H. A mechanism that ensures non-selective cytoplasm degradation by autophagy. Nat. Commun. 2023;14:5815. doi: 10.1038/s41467-023-41525-x. [DOI] [PMC free article] [PubMed] [Google Scholar]
- 48.Ha J., Guan K.-L., Kim J. AMPK and autophagy in glucose/glycogen metabolism. Mol. Aspect. Med. 2015;46:46–62. doi: 10.1016/j.mam.2015.08.002. [DOI] [PubMed] [Google Scholar]
- 49.Wilson W.A., Roach P.J., Montero M., Baroja-Fernández E., Muñoz F.J., Eydallin G., Viale A.M., Pozueta-Romero J. Regulation of glycogen metabolism in yeast and bacteria. FEMS Microbiol. Rev. 2010;34:952–985. doi: 10.1111/j.1574-6976.2010.00220.x. [DOI] [PMC free article] [PubMed] [Google Scholar]
- 50.Gasch A.P., Spellman P.T., Kao C.M., Carmel-Harel O., Eisen M.B., Storz G., Botstein D., Brown P.O. Genomic expression programs in the response of yeast cells to environmental changes. Mol. Biol. Cell. 2000;11:4241–4257. doi: 10.1091/mbc.11.12.4241. [DOI] [PMC free article] [PubMed] [Google Scholar]
- 51.Zhang Y., Xie Y., Liu W., Deng W., Peng D., Wang C., Xu H., Ruan C., Deng Y., Guo Y., et al. DeepPhagy: a deep learning framework for quantitatively measuring autophagy activity in Saccharomyces cerevisiae. Autophagy. 2020;16:626–640. doi: 10.1080/15548627.2019.1632622. [DOI] [PMC free article] [PubMed] [Google Scholar]
- 52.Huang H., Kawamata T., Horie T., Tsugawa H., Nakayama Y., Ohsumi Y., Fukusaki E. Bulk RNA degradation by nitrogen starvation-induced autophagy in yeast. EMBO J. 2015;34:154–168. doi: 10.15252/embj.201489083. [DOI] [PMC free article] [PubMed] [Google Scholar]
- 53.Bhattacharya A., Torggler R., Reiter W., Romanov N., Licheva M., Ciftci A., Mari M., Kolb L., Kaiser D., Reggiori F., et al. Decoding the function of Atg13 phosphorylation reveals a role of Atg11 in bulk autophagy initiation. EMBO Rep. 2024;25:813–831. doi: 10.1038/s44319-023-00055-9. [DOI] [PMC free article] [PubMed] [Google Scholar]
- 54.Giménez-Andrés M., Čopič A., Antonny B. The Many Faces of Amphipathic Helices. Biomolecules. 2018;8:45. doi: 10.3390/biom8030045. [DOI] [PMC free article] [PubMed] [Google Scholar]
- 55.Hopper A.K., Magee P.T., Welch S.K., Friedman M., Hall B.D. Macromolecule synthesis and breakdown in relation to sporulation and meiosis in yeast. J. Bacteriol. 1974;119:619–628. doi: 10.1128/jb.119.2.619-628.1974. [DOI] [PMC free article] [PubMed] [Google Scholar]
- 56.Yamashita I., Fukui S. Transcriptional control of the sporulation-specific glucoamylase gene in the yeast Saccharomyces cerevisiae. Mol. Cell Biol. 1985;5:3069–3073. doi: 10.1128/mcb.5.11.3069-3073.1985. [DOI] [PMC free article] [PubMed] [Google Scholar]
- 57.Williams R.M., Primig M., Washburn B.K., Winzeler E.A., Bellis M., Sarrauste de Menthiere C., Davis R.W., Esposito R.E. The Ume6 regulon coordinates metabolic and meiotic gene expression in yeast. Proc. Natl. Acad. Sci. USA. 2002;99:13431–13436. doi: 10.1073/pnas.202495299. [DOI] [PMC free article] [PubMed] [Google Scholar]
- 58.Lu K., Psakhye I., Jentsch S. Autophagic clearance of polyQ proteins mediated by ubiquitin-Atg8 adaptors of the conserved CUET protein family. Cell. 2014;158:549–563. doi: 10.1016/j.cell.2014.05.048. [DOI] [PubMed] [Google Scholar]
- 59.Demetriadou A., Morales-Sanfrutos J., Nearchou M., Baba O., Kyriacou K., Tate E.W., Drousiotou A., Petrou P.P. Mouse Stbd1 is N-myristoylated and affects ER-mitochondria association and mitochondrial morphology. J. Cell Sci. 2017;130:903–915. doi: 10.1242/jcs.195263. [DOI] [PMC free article] [PubMed] [Google Scholar]
- 60.Lytridou A.A., Demetriadou A., Christou M., Potamiti L., Mastroyiannopoulos N.P., Kyriacou K., Phylactou L.A., Drousiotou A., Petrou P.P. Stbd1 promotes glycogen clustering during endoplasmic reticulum stress and supports survival of mouse myoblasts. J. Cell Sci. 2020;133 doi: 10.1242/jcs.244855. [DOI] [PMC free article] [PubMed] [Google Scholar]
- 61.Sun T., Yi H., Yang C., Kishnani P.S., Sun B. Starch Binding Domain-containing Protein 1 Plays a Dominant Role in Glycogen Transport to Lysosomes in Liver. J. Biol. Chem. 2016;291:16479–16484. doi: 10.1074/jbc.C116.741397. [DOI] [PMC free article] [PubMed] [Google Scholar]
- 62.Yi H., Fredrickson K.B., Das S., Kishnani P.S., Sun B. Stbd1 is highly elevated in skeletal muscle of Pompe disease mice but suppression of its expression does not affect lysosomal glycogen accumulation. Mol. Genet. Metabol. 2013;109:312–314. doi: 10.1016/j.ymgme.2013.05.004. [DOI] [PubMed] [Google Scholar]
- 63.Colonna W.J., Magee P.T. Glycogenolytic enzymes in sporulating yeast. J. Bacteriol. 1978;134:844–853. doi: 10.1128/jb.134.3.844-853.1978. [DOI] [PMC free article] [PubMed] [Google Scholar]
- 64.Janke C., Magiera M.M., Rathfelder N., Taxis C., Reber S., Maekawa H., Moreno-Borchart A., Doenges G., Schwob E., Schiebel E., Knop M. A versatile toolbox for PCR-based tagging of yeast genes: new fluorescent proteins, more markers and promoter substitution cassettes. Yeast. 2004;21:947–962. doi: 10.1002/yea.1142. [DOI] [PubMed] [Google Scholar]
- 65.Knop M., Siegers K., Pereira G., Zachariae W., Winsor B., Nasmyth K., Schiebel E. Epitope tagging of yeast genes using a PCR-based strategy: more tags and improved practical routines. Yeast. 1999;15:963–972. doi: 10.1002/(SICI)1097-0061(199907)15:10B<963::AID-YEA399>3.0.CO;2-W. [DOI] [PubMed] [Google Scholar]
- 66.Zhang Y., Werling U., Edelmann W. SLiCE: a novel bacterial cell extract-based DNA cloning method. Nucleic Acids Res. 2012;40:e55. doi: 10.1093/nar/gkr1288. [DOI] [PMC free article] [PubMed] [Google Scholar]
- 67.Schindelin J., Arganda-Carreras I., Frise E., Kaynig V., Longair M., Pietzsch T., Preibisch S., Rueden C., Saalfeld S., Schmid B., et al. Fiji: an open-source platform for biological-image analysis. Nat. Methods. 2012;9:676–682. doi: 10.1038/nmeth.2019. [DOI] [PMC free article] [PubMed] [Google Scholar]
- 68.Teste M.-A., Duquenne M., François J.M., Parrou J.-L. Validation of reference genes for quantitative expression analysis by real-time RT-PCR in Saccharomyces cerevisiae. BMC Mol. Biol. 2009;10:99. doi: 10.1186/1471-2199-10-99. [DOI] [PMC free article] [PubMed] [Google Scholar]
- 69.Chen Y., Futcher B. Assaying Glycogen and Trehalose in Yeast. Bio. Protoc. 2017;7 doi: 10.21769/BioProtoc.2371. [DOI] [PMC free article] [PubMed] [Google Scholar]
Associated Data
This section collects any data citations, data availability statements, or supplementary materials included in this article.
Supplementary Materials
Data Availability Statement
-
•
All data reported in this paper will be shared by the lead contact upon request.
-
•
This paper does not report original code.
-
•
Any additional information required to reanalyze the data reported in this paper is available from the lead contact upon request.