

Summary
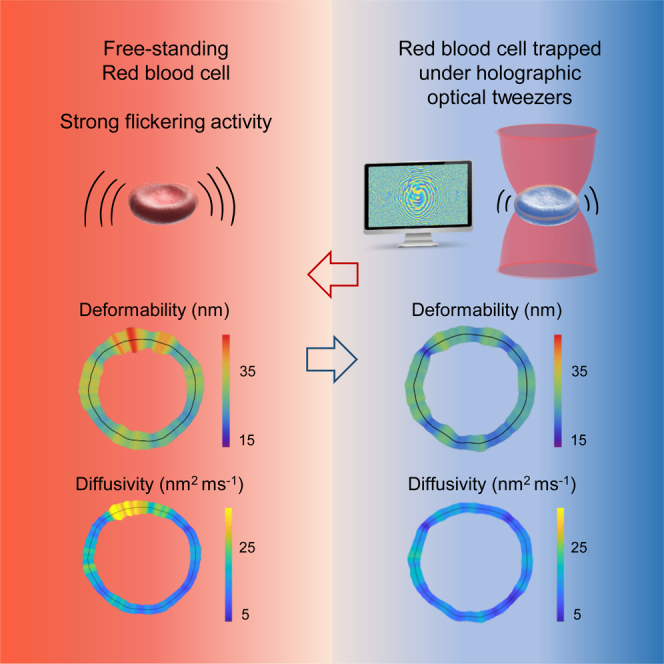
Red blood cells possess a singular mechanobiology, enabling efficient navigation through capillaries smaller than their own size. Their plasma membrane exhibits non-equilibrium shape fluctuation, often reported as enhanced flickering activity. Such active membrane motion is propelled by motor proteins that mediate interactions between the spectrin skeleton and the lipid bilayer. However, modulating the flickering in living red blood cells without permanently altering their mechanical properties represents a significant challenge. In this study, we developed holographic optical tweezers to generate a force field distributed along the equatorial membrane contour of individual red blood cells. In free-standing red blood cells, we observed heterogeneous flickering activity, attributed to localized membrane kickers. By employing holographic optical forces, these active kickers can be selectively halted under minimal invasion. Our findings shed light on the dynamics of membrane flickering and established a manipulation tool that could open new avenues for investigating mechanotransduction processes in living cells.
Subject areas: Natural sciences, Optical imaging
Graphical abstract
Highlights
-
•
Biocompatible manipulation of RBC membrane by holographic optical tweezers
-
•
Identification of active kickers heterogeneously distributed across the membrane
-
•
Active kickers inhibition by deploying an optical trap along the membrane contour
-
•
Potential energy landscape for free-standing and trapped RBCs populations
Natural sciences; Optical imaging
Introduction
Exploring cellular mechanics and the intricate interplay between mechanotransduction and metabolism is pivotal for understanding fundamental physiological processes and pathological pathways.1 Investigating these dynamics offers insights into cellular function and response to external mechanical stimuli.2 Within this context, the mapping and manipulation of mechanical forces in living cells emerge as indispensable tools for various applications, including minimally invasive therapies such as cell-machine interfacing,3 tissue manipulation4 and regeneration,5 osteogenic differentiation,6 and microsurgery.7 Subcellular-scale forces are commonly generated using techniques such as atomic force microscopy,8 traction force microscopy,9 and optical tweezers.10,11,12,13 Optical tweezers are a high-resolution, cost-effective, flexible, and contact-less approach, particularly advantageous when operating in the near-IR, since biological samples exhibit minimal light absorption or scattering in this spectral range, allowing for trapping intracellular elements without phototoxicity.14,15 The micro-manipulation of red blood cells (RBCs), either by employing force-mediator beads16,17 or by directly trapping the cell has been achievied.18,19,20,21,22 A significant innovation can be the introduction of programmable holographic techniques, which allow for controlling both the amplitude and phase of the trapping optical field.23,24 The advancement in coherent optics led to the development of holographic optical tweezers (HOTs), which can exert multiple dynamical optical traps in three dimensions.25,26,27 Additionally, HOTs can transfer orbital angular momentum of light to trapped objects making them rotate or spin by manipulating vortex and non-Gaussian beams.28,29 To generate the requested hologram, diffractive optical elements such as spatial light modulators (SLMs) are commonly employed. They can be programmed to modulate the amplitude and phase of the optical wavefront in a plane transverse to the beam propagation, and seamlessly integrated into microscopy platforms.30 An outstanding advantage that HOTs offer over standard tweezers is the generation of three-dimensional holograms, which can induce spatially extended and temporally varying trapping forces and provide orbital angular momentum. With these capabilities at hand, HOTs enable the simultaneous manipulation of multiple objects, even when they are positioned away from the objective focal plane. Consequently, they have emerged as a valuable and flexible tool for studying cell biomechanics.31,32
In this work, we introduced a custom-designed HOTs to manipulate living RBCs by creating a trapping potential with a spatial distribution aligned with the cellular shape. This approach allowed us to regulate the mechanical behavior of RBCs, which have served as a valuable model for single-cell biomechanics in the absence of specialized energy organelles,33,34 since their mechanical activity is fueled by glycolytic production of ATP.35,36 RBCs, also referred to as erythrocytes, are autonomous anucleate cells with a flexible plasma membrane mechanically connected to a highly dynamic cytoskeleton.33,34 This structurally active configuration allows RBCs to undergo significant deformations while maintaining the characteristic discocyte shape, which is essential for fulfilling their physiological functions as circulatory transporters.37 Given the crucial role of RBC mechanics in enabling them to navigate through narrow capillaries, understanding these mechanics has profound medical implications, especially in diseases characterized by compromised or impaired RBC deformability.38,39 As observed under an optical microscope, live RBCs exhibit membrane undulations at the equatorial cell rim, a phenomenon known as flickering.40,41,42 Active RBC flickering has been identified as a distinctive marker of ATP-dependent metabolic activity.43,44 The RBC flickers violate the balanced fluctuation-dissipation relation for the active membrane deformations,45 hence driving the biological system out-of-the-equilibrium and leading to a net entropy production.46 At the molecular level, RBC flickering originates from biochemical interactions between the plasma membrane, a lipid bilayer containing phospholipids, cholesterol and embedded proteins, and the cytoskeleton, which is formed by a quasi-hexagonal network of spectrin and actine filaments.47 Other membrane components with a related phosphorylating activity, such as ion transporters, inositol lipids, ankyrin and Band 3 tethers, and proteins such as band 4.1 R may play crucial roles.48,49 Additionally, long filaments of non-muscular myosin, anchored to the cytoskeleton via actin, have also been proposed as force effectors that induce flickering through their mechanical activities.50
Here, we employed the custom-built HOTs to prove the active nature of the RBC flickering motions by exerting optical forces directly on the membrane of individual RBCs. The spatial maps of flickering activity were evaluated for both free-standing and optically trapped cells. In freely flickering cells, we found heterogeneously localized active hot spots identified as membrane kickers due to their large membrane deformations. We inhibited these active kickers by applying the HOTs force field with minimal invasiveness and negligible phototoxicity. By analysing the potential energy, mean square displacement, power spectral density, and diffusivity, we discerned between the active and passive behavior of the two RBC populations, thus demonstrating a direct intervention on living cell membranes.
Results
Holographic optical tweezers
We begin by outlining the HOTs design and operational methodology, which allows for the direct manipulation of the membrane contour of individual RBCs. To simultaneously achieve optical trapping and fast imaging of living RBCs, we implemented a custom-built inverted microscope, in which a near-IR laser was coupled to an SLM to generate the holograms required for HOTs operation.30 Figure 1A provides an overview of the optical platform (see STAR Methods for details). The high-magnification microscopy setup allows for detecting dividual RBCs within their equatorial plane and recording videos at 1 kHz acquisition rate. We used the observed RBC as a template to generate the hologram by evaluating a binary image, , that represents the membrane contour and subsequently calculated the phase distribution of such image by the iterative Gerchberg-Saxton algorithm51 (see Figures S1 and S2). The phase distribution was digitally encoded into the SLM screen, that is a liquid-crystal able to change the phase of reflected laser light, thereby displaying the hologram intensity distribution, , in the reciprocal Fourier plane of the SLM.24,52 To ensure the hologram matching RBC’s morphology in the sample plane, i.e., , we designed a relay optical system that images the laser beam reflected at the SLM plane to the back-focal plane of the microscope objective. By focusing the phase-sculptured laser beam on the sample plane, we induced locally optical forces due to the intensity gradient . RBCs can be directly trapped under optical forcing because of the refractive index difference established between their interior () and the surrounding cell culture medium ().43,53 Therefore, by illuminating the RBCs with a stationary hologram that resembles their membrane contour, we deployed a trapping potential extended along the equatorial membrane rim (see Figures 1B and 1C). In summary, through the feedback regulation between camera observation and hologram generation, the HOTs system effectively ensured stable trapping of RBCs.
Figure 1.

Holographic optical tweezers
(A) Schematics of the HOTs coupled to an inverted microscope. SLM is the spatial light modulator, Mi mirrors, Li lenses, half-wave plate, Pol linear polarizer, D dichroic mirror, Ob1 condenser objective, Ob2 imaging objective, that also focuses the laser beam on the sample plane .
(B) Schematics of single erythrocyte trapped by a laser hologram that reproduces the membrane contour. is the trapping potential. Red arrows indicate the laser propagation, yellow arrows represent the direction of in plane optical forces.
(C) Image of an RBC in the equatorial plane without laser trapping. The membrane contour is retrieved as the high-contrast border between inner (black) and outer (white) circles (see STAR Methods). Scale bar is .
Single cell flickering maps
We studied the local membrane fluctuations and mapped the flickering along the cell contour, both for free-standing and trapped RBCs under physiological conditions. Initially, we recorded a high-speed video of an individual RBCs lying on glass substrate. Subsequently, we acquired a video of the same cell while applying the static optical trapping potential . We confirmed the reversibility of this process by performing repeated sequences. To estimate the flickering activity, we tracked the RBC membrane contour by exploiting high-resolution detection schemes,54 in which we corrected any small spurious drift that might occur due to global cell translation or rotation.55 By analyzing the membrane contour as a function of time in polar coordinates, we evaluated local radial fluctuations with respect to the average, , where represents the total recording time (see STAR Methods and Figure S3). For healthy human RBCs, the mean radius is approximately ,56 with maximum local fluctuations ranging from .45 Since , the time-averaged variance of membrane fluctuations is . We compared the flickering activity of free-standing RBCs () with that of the same cells subject to a trapping potential deployed along the membrane contour (), as reported in Figure 2. The time series of membrane deformations, , tracked at representative positions are shown in Figure 2A. The flickering in a hot spot of free-standing RBC exhibits large fluctuations, (top panel), whereas in a cold spot of a trapped RBC it shows smaller deformations, (bottom panel). The fluctuations of free-standing cells display strong volatility, characterized by transient pulses, or localized membrane kicks, in several hot sites. These transient kicking events involved large deformations sustained over times ms, as indicated by green arrows in the upper panel of Figure 2A. In contrast, optical trapping decreased the fluctuation strength and inhibited the volatility bursts. In Figure 2B we highlighted the difference in the fluctuation distribution of the two cases by reporting the number of events detected for each . The distribution of free-standing cells is broader compared to that of trapped RBCs. To evaluate landscapes of flickering activity, in Figure 2C we reported as spatial maps along the membrane contour.54,57 These maps prove that the deformation activity of the membrane depends on its trapping status and on local rim emplacement. For free-standing RBCs, they reveal a heterogeneous mechanical activity with sparse hot spots of small lateral size, nmand nm (Figure 2C top panel). These hot spots can be considered as membrane flickers, since their lateral size resembles the dimensions of the triangular meshwork of the spectrin cytoskeleton to which the protein that undergo phosphorylation are anchored.58 Moreover, the kicker size agrees with estimations based on previous observations (see supplemental information Discussion). The stationary HOT trapping resulted in a reduction of the flickering activity, as indicated by , particularly noticeable in the warmer regions of free-standing RBCs. This led to uniformly thermalized flickering maps (Figure 2C bottom panel). Additional examples of RBCs passivated by HOTs are provided in Figure S4. Finally, we confirmed that the induced optical trapping did not alter the shape of the RBCs or converted them into echinocytes (see Figure S5).
Figure 2.

Flickering maps
(A) Time series membrane deformations, , tracked at a hot spot of a free-standing RBC (red line), and at a cold spot of the same specimen under optically trapping (blue line). The colored bands represent the standard deviation, , of free-standing time series. Green arrows indicate kicking events, with amplitude , exceeding (dashed lines).
(B) Distribution of events for the time series reported in a).
(C) Map showing the time averaged flickering activity along the cell contour, estimated as , for the free-standing (top) and trapped RBC (bottom). Black lines represent the mean position of the membrane observed in the equatorial plane. Scale bar is .
Population energy landscape
We evaluated the flickering probability density function (PDF) of both RBC ensembles to determine the associated potential energy distribution and quantify population differences. Additionally, we proposed a model to describe active flickering as a propulsion process in a flexible membrane anchored to the cytoskeleton, hence highlighting the impact of HOTs trapping on membrane flickering. The PDF of each ensemble was evaluated as the number of fluctuation events normalized to their integral. Figure 3 shows the flickering PDFs for both free and trapped ensembles, obtained through the accumulation of approximately microstates. The PDFs exhibit symmetrical distributions with . For free-standing RBCs, we found nm, consistent with previous results.44,45,59 The trapped population displays significantly lower deformations, with nm. Dashed lines in Figure 3A represent Gaussian fits of the PDFs. Free-standing cells show augmented tails that notably deviate from the normal distribution. These outlier events correspond to the large membrane excursions represented by hot spots in the flickering maps. Therefore, we identified them as the active kickers fueled by ATP.57,60 Trapped cells PDF adhere to the Gaussian distribution across the entire range of , as if they were experimenting a harmonic elastic potential. The differences in PDF tails can be statistically described by the distribution kurtosis, , reported in the lower panel of Figure 3A, and typically referenced to the Gaussian distribution, which exhibits . Free-standing RBCs show larger kurtosis, , indicative of excessive tailed distribution and anharmonic elasticity.61 Conversely, the flickering PDF for trapped RBCs is Gaussian, , suggesting the inhibition of the active kickers. In Figure 3B) we modeled active flickering as a propulsion process in a flexible membrane anchored to an ordered cytoskeleton with a lattice period equal to . We hypothesized that the equatorial flickers are composed of flickering units, either passive (), or active kickers (), such that . The propelling motors are activated upon ATP-availability only in a small fraction of sites . The trade-off applied to a local flickering element gives rise to a net force , encompassing stochastic propelling () and thermal () forces, counteracted by restoring elastic forces due to membrane rigidity () and optical trapping (), all contributing to the observed flickering action. Within the harmonic approximation, the linear relationship holds under local membrane rigidity . Additionally, the kicking force is approached as . Hence, the global harmonic potential can be defined as , where is the effective global hardness obtained by averaging the local rigidity over the membrane rim and population ensemble. Since active flickering induces a membrane softening, the global hardness is expected to be larger for the passivated () specimens compared to living trapped () and free-standing RBCs (), following the sequence: .
Figure 3.

Population energy landscape
(A) Normalized probability density functions (PDFs) for free-standing (red dots) and trapped RBC population (blue dots). Dashed lines are Gaussian fits. Green arrows highlight non-Gaussian tails in free-standing RBCs. Lower panels show ensemble averaged flickering standard deviation () and kurtosis, with error bars reported as standard deviations. , .
(B) Schematics of flickering membrane deformations for free-standing (top panel) and trapped cell (bottom panel). is the local force exerted by active kickers upon ATP consumption; is the force induced by thermal fluctuations; is the restoring force due to membrane elasticity, is the optical trapping force.
(C) Potential energy landscape in free-standing (red) and trapped (blue) RBCs. Raw data are reproduced by Equation 1 with and , respectively (straight lines). is the rigidity of passivated RBCs. Gray areas indicate exclusion regions where the flickering is absent. Dashed line corresponds to the thermal driving energy .
To connect the normalized PDFs with the potential energy landscape, , we assumed a Boltzmann-Gibbs statistics at the experimental temperature (): with the partition function due to normalization. Figure 3C shows the energy landscapes evaluated for both free and trapped ensembles. They are distributed upon the common ground energy . For free-standing RBCs, given the large PDF kurtosis, we inferred a non-Gaussian anharmonic potential. To model the observed potential landscapes, active sources and nonlinearity must be added to the harmonic potential description. Since the membrane kickers were only present in a small subset of active nodes () and the kickers exhibited an average force , they gave rise to an active potential term . Moreover, due to the symmetric distribution of the data, we argued that the active kickers might induce a nonlinear membrane softening that can be modeled by a quartic potential term , with a softening parameter. The global potential energy is given by . Therefore, we fitted the data reported in Figure 3C by using the expression:
| (Equation 1) |
Where is the ground energy, the membrane hardness, the fraction of active nodes, the active kicker displacement, and the softening parameter. The best fitting parameters for free RBCs (considering ) were , and . Therefore, the kicking force was of the order of . However, an almost harmonic potential was obtained for trapped RBCs with , and .
Mean square deformation displacement
We investigated the stochastic behavior of RBC flickering by analyzing the mean squared displacement (MSD) of the equatorial deformations, providing insights into the dynamics of the cell membrane in response to stimuli. The MSD is defined as , with representing the lag time between flickering events. Figure 4 shows ensemble-averaged MSDs for both free and trapped populations. A combined diffusion-confinement behavior is present in both cases across the characteristic viscoelastic time ms. At shorter lag times (), the flickering displacements follows a generalized diffusion law , where is the effective diffusivity and is a scaling exponent ( for free diffusion, for sub-diffusivity). As reported in the inset of Figure 4, short-time sub-diffusivity was detected in both populations, without a free diffusion regime. At very short times (), free-standing RBCs exhibit a sub-diffusivity characterized by a power-law exponent , whereas the trapped RBCs show a higher exponent , signature of a reduced diffusivity (). In free-standing flickers, an active sub-diffusional crossover was detected at , representing a threshold for faster active events. This active sub-diffusivity can be driven by the fastest transverse motions produced as membrane propelling events. In fact, for the active kickers behave as uncorrelated permeation mode62 (), while for , they present a slightly lower exponent. Conversely, the trapped RBCs exhibit a passivated sub-diffusivity closer to a flexural-like dynamics, highly correlated under membrane rigidity.63,64 These short-time flexural correlations lay between conservative bending behavior in an elastic membrane () and that expected for hybrid curvature friction modes ().63,64 Global active softening effects arise due to elasticity-confinement correlations over lag times longer than the viscoelastic time (). In this range, the flickering displacements asymptotically reach a saturation plateau due to membrane confinement under flexural rigidity as , where is the effective membrane tension.63,65 For the free RBCs we found , implying a naturally softened stiffness . For the trapped RBCs we obtained , indicating . Both stiffness values agree with the effective spring constants obtained from the energy landscapes reported in Figure 3.
Figure 4.

Mean square displacement (MSD)
MSD averaged over all membrane positions and RBC ensemble as a function of lag time for the free (purple line) and trapped (light blue line) RBCs, along with corresponding 90% variability bands. The microscopic time (threshold for instantaneous flickering events) and (viscoelastic correlation time) are highlighted by arrows. The inset shows the Log-Log plot compared with the characteristic slope decay for free diffusion (, gray line), membrane flexural modes (, blue line) and membrane permeation modes (, red line).
Power spectral density
We compared active RBC flickering to passive Brownian noise by examining the amplitudes of spectral components in the fluctuation series, quantified through the power spectral density (PSD). This was achieved by Fourier transforming the time series , resulting in . Figure 5 shows the average for both free and trapped RBC populations. In both spectra, we observed a terminal domain where a collective activity plummet for (viscoelastic threshold), and a crossover frequency (). The collective activity of free RBCs predominantly occur in the low frequency regime (), but it also re-emerges in the high-frequency spectral tails (), which evidences the propulsion by rapid kicking events. In this frequency range we detected a pink noise spectrum corresponding to stochastic behavior ().66
Figure 5.

Power spectral density (PSD)
(A) Ensemble-averaged PSDs for both free-standing (red line) and trapped population (blue line), reported in Log-Log scale. Shaded areas represent the 90% variability intervals. Dashed lines decay as (pink noise spectrum), and as (Brownian spectrum). Arrows highlight the active frequency , and the rheological crossover frequency .
(B and C) PSD in the low frequency regime, depicted in linear scale, for free-standing (red dots) and trapped RBCs (blue dots). Error bars correspond to standard deviations. Black lines represent the fits obtained by using Equation 2, and the dashed regions correspond to the integrated power. The best fitting parameters are reported for each case.
In the intermediate range (), s appear independent on the trapping status, exhibiting . This behavior suggests a rheologically passive regime that corresponds to thermal modes dissipating energy via bulk friction.44,59,67 To characterize the RBC flickering in this frequency range, we employed the Milner-Safran (MS) theory, which models the fluctuations of passively deformable vesicles.68,69 In the low frequency domain (), we observed the maximum RBCs flickering activity, which can be included in the MS theory as a Lorentzian contribution, corresponding to the relaxation of direct kicking mode.44,59 Therefore, the RBCs fluctuation spectra can be reproduced by a superposition of MS-modes (defined by spherical harmonics ), with a Lorentzian mode describing the membrane collective activity:70
| (Equation 2) |
where is the average membrane radius, are MS-amplitudes defined, in terms of the bending modulus and the membrane tension , as , are MS-frequencies defined as , where is the bulk viscosity, and . The collective activity is described by a dimensionless parameter, , accounting for the kicking amplitude at the turnover frequency .70,71 At intermediate frequencies (), the discrete sum of MS-modes reproduces the collective RBC’s flickering. For lower frequency (), only a small number of active flickering units () is present.71 In Figures 5B and 5C we focused on the low frequency domain where the PSDs data were fitted by Equation 2 imposing , , and (see Figures 5B and 5C). The best fitting values for all the parameters are reported in the insets together with associated uncertainties. For free RBCs, the activity amplitude is , while for trapped cells it decreases down to . Moreover, we calculated an integrated power of for the free-standing population and of for the trapped RBCs. These findings show a reduced RBC activity under optical trapping, by approximately 25%, in agreement with the conclusions drawn from the PDFs analysis. Finally, it is worth mentioning that the passive parameters (, , ) are consistent between free-standing and trapped populations, and with previous analyses under similar metabolic conditions.44,59
Diffusivity maps
We analyzed the effective diffusivity maps along RBCs contours, and evaluated the distributions of events within a phase space defined by diffusivity and flickering variance as independent variables. This analysis offers insights into membrane dynamics for both free-standing and trapped populations. We obtained the effective diffusivity, , by using the one-dimensional Einstein relationship, , to reproduce the local obtained in the short time range . Figures 6A and 6B shows the and maps obtained for a representative RBC in both the free (left panels), and the trapped states (right panels). Similar to membrane deformation, diffusivity maps of free-standing RBCs reveal a heterogeneous distribution of hot spots characterized by rapid membrane displacements. Additional maps for different RBCs are reported in Figure S6. Since each membrane location exhibits distinct kinetic diffusivity and elastic deformability, we evaluated the density of states in the and space for both populations, as depicted in Figure 6C.
Figure 6.

Diffusivity maps
(A and B) Maps of flickering deformation, , and effective diffusivity, , evaluated for the same free-standing (left panels) and trapped RBC (right panels). Black lines represent the mean position of the membrane. Scale bar is 2 μm.
(C) Density of states of flickering events in the space given by reported as the logarithm of the number of events for free-standing (left panel) and trapped RBC populations (right panel).
These maps highlight the differences between the two groups: free-standing RBCs (left panel) show a widespread distribution with strong diffusion nm2ms−1 and large fluctuations nm2, whereas trapped RBCs (right panel) show a more localized behavior, predominantly confined within the range nm2ms−1 and nm2. To quantify the dispersion of the density of states, we calculated the Pearson coefficient72 that measures the linear correlation between kinetic () and potential () parameters. A higher correlation was observed in the trapped population (), compared to the free RBCs (), indicating a stronger association between diffusion and deformability in trapped cells. This distinction emphasizes the relationship in the space as a reliable indicator of cell activity.
Discussion
As proof-of-concept experiment, we developed HOTs to trap individual metabolically active RBCs by creating a potential landscape across the equatorial rim of their membrane. These stationary optical potentials were designed ad hoc based on real-time observation of the target cell, allowing for rapid deployment of the desired optical field (faster than 30 s after cell observation). Our HOTs operated under minimal invasiveness, avoiding the perturbative chemical binding required for bead-probe force transduction in conventional optical trapping. In addition, we employed a continuous-wave near-IR laser, which largely prevented cell aggregation or shape transformation due to irradiation, unlike visible and pulsed lasers due to hemoglobin light absorption.73,74 The trapping process exhibited negligible phototoxicity and had no discernible impact on cell morphology. Furthermore, we observed no significant changes in mechanical properties such as membrane tension, rigidity, and viscosity. Importantly, this optical manipulation was reversible, with all physical and biological degrees of freedom effectively restored upon deactivation of the HOTs.
Flickering maps and statistical analysis
By fast recording the fluctuations of healthy RBC membrane in a HOTs setting, we obtained the flickering maps both under trapping conditions and in the free-standing scenario. We evaluated the flickering probability density function (PDF), standard deviation, , and kurtosis, (Figure 3A). In HOTs-trapped RBCs an effective inhibition of the active kickers was proved by the significant reduction of both parameters with respect to the free-standing cells, i.e., , and . However, the trapped RBCs showed broader PDFs compared to those found in passivated cells under ATP-inhibition, nm, and under tight membrane rigidization due to protein crosslinking, and nm, both reported in our previous work.44 Since in these two passivated cases the flickering was mainly due to thermal fluctuations, here we proved that our HOTs induced an effective optical trapping on the RBC while maintaining the membrane flexible status sustained by biological activity. Furthermore, it is important to highlight that variations in the cellular environment, such as alterations in chemical composition, glucose concentration, temperature, mechanical forces, or the presence of nanoparticles and other cells, can impact the physical condition of the RBC membrane and affect the flickering.75,76,77 By evaluating the and diffusivity maps (Figures 2 and 6), we highlighted the spatial heterogeneities in flickering activity across free RBC membranes, as compared to much more uniform and thermalized maps observed in trapped cells. The regions exhibiting enhanced flickering activity were identified as the locations of active kicking, consistent with observed asymmetries in the cytoskeletal complex.78
By analyzing the PDFs within the framework of statistical mechanics, we derived the potential energy landscapes for both RBC populations. By employing the anharmonic model summarized by Equation 1, we characterized active flickering and accurately replicated the experimental data. Consequently, we extracted key parameters, including hardness, number of active kickers, and softening constant. For trapped RBCs, the hardness was larger with respect to free RBCs, , but lower than the bare flexural rigidity of passivated RBCs, , as previously evaluated using a different spectral decomposition method44 (see supplemental information). Hence, the membrane hardness decreased following the expected sequence, . The reported values are in qualitative agreement the erythroid membrane rigidities evaluated in previous studies.17,44,59,79 To quantify the global rigidization induced by HOTs trapping, we estimated a stiffening increase %. This effective membrane hardening was due to the HOTs-trapping inhibition of the anharmonic components, since and . During HOTs operation, the trapping stiffness inhibited the most active kickers, leading to a significant reduction, if not a complete elimination, of active softening. Conversely, deactivating the tweezers allowed the membrane to resume active flickering. We also evaluated the membrane stiffness by means of the asymptotically MSDs (Figure 4). Both values agree with the effective spring constant obtained from energy landscapes but presented a larger uncertain due to the MSD calculation. By studying the flickering in the frequency domain (Figure 5), we validated the presence of heightened activity within the free-standing RBC population. The collective activity was more pronounced in the low frequency range (), signifying a breakdown in the thermodynamic equilibrium. This deviation has been previously reported as a violation of the fluctuation-dissipation relation45 and a net production of entropy, which can be interpreted as the heat dissipated by the cell into the environment.46 However, in the intermediate-frequency range , both spectra exhibited a decay consistent with , indicative of a Brownian response attributed to thermal motion. Provided that the collective activity was primarily driven by the rapid membrane kickers, , we estimated the reduction in activity due to optical trapping as . This suggests that approximately 60% of kicking elements were rendered inactive under trapping conditions. Notably, this finding aligns with the estimations obtained from fitting the energy landscapes: .
The distinction between active free-standing and HOT-trapped RBCs was underscored by the differences in membrane diffusivity (Figure 6). In free cells, the membrane exhibited a softer behavior, leading to elastic decorrelations between and . Such mechanical connections evidenced the out-of-equilibrium nature of the active flickering state, where thermodynamically active RBCs dissipated kinetic energy through active kickers as due to the presence of softer membrane regions. Conversely, optically trapped RBCs can be regarded as biologically cold due to their reduced kinetic energy dissipation. In the cells trapped by HOTs, passive physical correlations prevailed, suggesting an overall equilibrium between elastic and dissipative energy. This observation is consistent with the idea that trapping stiffness inhibits active propulsion, resulting in a decrease in active softening. Therefore, our findings demonstrate a dynamic interplay between metabolic activity and mechanical properties, with active RBCs exhibiting a softer membrane driven by active biochemical processes, while trapped RBCs undergo a stiffened response. This biological distinction highlights the complex relationship between cellular activity and mechanical dynamics, offering insights into the physiological state of RBCs under different conditions.
Outlooks and possible implications
Biophysical research on RBC deformability has been instrumental in linking specific diseases such as spherocytosis, elliptocytosis, metabolic disorders, oxidative stress, and paroxysmal nocturnal hemoglobinuria to alterations in biomechanical properties.38 These include changes in cytoplasm viscosity, dominated by hemoglobin, as well as alterations in plasma membrane viscoelasticity and morphological deformability.39 From a biological point of view, our study provides insights into erythrocyte activity that can be useful in various contexts. By employing our HOTs, valuable information can be obtained regarding the response of RBCs to physiological stimuli and their ability to adjust to microenvironmental fluctuations. From a physical point of view, building upon our flickering measurements, future analysis based on RBC heat mapping could leverage the recently developed method to evaluate entropy production rates along the membrane contour of individual RBCs.46 Those novel cell mappings could have important implications not only for enhancing the methods for quantitative diagnosis, but also in developing better therapies for hematological disorders, as well as in designing novel approaches for tissue engineering and regenerative medicine. Additionally, investigating the impact of disease states on RBC mechanical properties can provide insights into disease progression and facilitate the pharmacological identification of new therapeutic targets, particularly in conditions such as hemolytic anemia, malaria, and sickle cell disease. In considering potential applications, HOT trapping offers an opportunity to explore new physiological aspects, with an emphasis on RBCs membrane adaptivity within the bloodstream.34,80 Employing a HOT-trapping platform within a microfluidic setup to mimic blood flow dynamics,38 could enable exploration not only of unanticipated functions of mechanical membrane deformability,39,81 but also sheds light on various physiological roles of deformable RBC flicker, including metabolic, signaling, and immunological functions, among others. In fact, RBCs are recognized as active immunological adaptors, facilitating interactions with circulating molecules and pathogens.82,83 Using the HOT-trapping platform, we can investigate membrane-localized interactions of various antigens while modulating the surface RBC antibody activity at specific membrane sites, facilitated by HOT-mediated activation or passivation. By extending this approach to other cell types, HOTs hold potential for applying force fields during critical cellular processes, including cell cycle regulation, cell division, and nuclear cytokinetic reorganization. Specifically, holographic trapping methods offer exciting prospects for applications in immunomechanics. For instance, applying controlled, highly localized mechanical forces to individual T cells presenting surface antigens could yield valuable insights.84 In those experiments, HOTs would serve as a platform for studying T cell mechanobiology and enhancing antigen screening for specific immune responses simulated through mechanical single-cell manipulation.
Conclusions
To summarize, through a custom-designed HOTs, we introduced a biocompatible tool to manipulate the erythrocyte plasma membrane, and to modulate the flickering activity in individual RBCs, while preserving their structural integrity. We identified the active kickers as rigidity softeners heterogeneously distributed across the membrane and inhibited their propulsion activity. Additionally, we devised a MATLAB algorithm to operate the HOTs, allowing for nearly real-time manipulation of the observed RBCs membrane contour. Compared to conventional single-focused optical tweezers, our HOTs represent a significant advancement in cell manipulation that extends beyond RBCs. Our programmable approach is adaptable to generate various holograms for other cells or cellular structures, including organelles, offering flexibility for future extensions. For instance, by adjusting the hologram dynamically, temporal force fields could enable the control of RBCs and other objects flowing within cellular environments. By harnessing the capabilities of HOTs and computational algorithms, we can establish a versatile platform promising transformative advancements in cellular mechanics. We envision future refinements of this HOTs technique and related biophysics, offering innovative applications across various contexts. These range from basic biological research on cell biomechanics to prototype validation in translational settings for new diagnostic methods and therapeutic approaches.
Limitations of the study
Limited sample size. The study’s reliance on a limited number of RBCs () extracted from a single healthy donor might limit the generalizability and reproducibility of observed phenomena across diverse and broader populations.
Absence of direct force measurement. While HOTs enabled precise manipulation and characterization of the membrane flickering dynamics, a direct quantification of the applied forces was not incorporated into the setup. Although estimations derived from membrane flicker probability density functions (PDFs) provided insights into the strengths of the confinement potential, integrating a direct force measurement module would offer a more comprehensive understanding of the exerted forces on the RBCs.
Static trap configuration. We employed a static trap configuration over time, limiting the exploration of diverse spatiotemporal force field configurations and restricting the exploration of a broader range of force distribution patterns and magnitudes. Finally, while this study marks a foundational proof-of-concept in employing HOTs for the manipulation and analysis of RBC membrane dynamics, future developments encompassing dynamic variations in spatial and temporal parameters could significantly refine and broaden HOTs applications.
STAR★Methods
Key resources table
| REAGENT or RESOURCE | SOURCE | IDENTIFIER |
|---|---|---|
| Deposited data | ||
| Cell images dataset | https://figshare.com/ | https://doi.org/10.6084/m9.figshare.24018015 |
| Software and algorithms | ||
| Code for membrane tracking (Wolfram Mathematica) | https://figshare.com/ | https://doi.org/10.6084/m9.figshare.24066387 |
| Code for driving holographic optical tweezers (MATLAB) | https://figshare.com/ | https://doi.org/10.6084/m9.figshare.24973908 |
| Wolfram Mathematica | https://www.wolfram.com/mathematica/ | Version 12.1.0 |
| MATLAB | https://www.mathworks.com/products/matlab.html | Version R2022b |
| gpt-3.5 | https://platform.openai.com/docs/models/gpt-3-5/ | Version gpt-3.5-turbo-0613 |
| OriginPro | https://www.originlab.com/ | Version 2021 |
Resource availability
Lead contact
Further information and requests for resources should be directed to and will be fulfilled by the lead contact: Prof. Niccolò Caselli (ncaselli@ucm.es).
Materials availability
This study did not generate new materials.
Data and code availability
-
•
All raw images data derived from human samples have been deposited at Figshare repository and are publicly available as of the date of publication. Accession numbers DOIs are listed in the key resources table. Data are in the form of TIF images acquired in our microscopy setup for free-standing and optically trapped red blood cells.
-
•
The original codes developed for driving the HOT setup, analysing the raw data images, and tracking the RBC membranes have been deposited at Figshare repository and is publicly available as of the date of publication. DOIs are listed in the key resources table.
-
•
Any additional information required to reanalyze the data reported in this paper is available from the lead contact upon request.
Experimental model and study participant details
Human red blood cells analyzed in this study were extracted from a human donor with the following characteristics:
-
•
Sample size: one single donor.
-
•
Gender: male.
-
•
Status: healthy.
-
•
The subject was not involved in previous procedures.
Method details
Sample preparation
RBCs were extracted from a single healthy donor by venipuncture employing the finger-prick method. 20 μl of blood were resuspended in 480 μl phosphate saline buffer (130 mM NaCl, 20 mM Na3PO4, 10 mM glucose, and 1 mg mL-1 bovine serum albumin, BSA, pH 7.4) at 37°C and denoted as PBS+. The erythrocyte concentrate was obtained after 3 cycles of centrifugation of 10 min at 5000 rpm. The supernatant was discarded, and the pellet rinsed in PBS+ (480 μl). From this suspension, a 1:20 dilution was stored at 37°C. Samples were mounted on microscope glass slides with a square-shaped well in the middle of the slide made of double-side adhesive tape. Aliquots of 20 μl from the 1:20 suspension were poured into the well and a thin cover-glass was placed on top and sealed by the adhesive tape. The chamber volume was equal to 1 cm x 1 cm x 50 μm. To avoid RBCs adsorption to the glass surfaces of the chamber, both the well and the cover-glass were coated with 40 mg mL-1 BSA.
Microscopy setup
The illumination source of white light was a LED (WFA1010, by Thorlabs) whose beam was collimated by lens L1 (focal length f1=10 cm) and then focused on the sample plane by a condenser objective Ob1 (5X, NA=0.25, by Nikon). The glass slide containing the sample was mounted on a two-axis (x,y) translation stage (by Newport) for precise alignment at the sub-micron scale. The collection objective Ob2 was a 100 X achromat oil-immersion objective with NA=1.45 (by Nikon) and it was placed on a single axis (z) translational stage (by Thorlabs) with 10 nm resolution. The collected light was transmitted through a dichroic mirror (D, short-pass at 650 nm) and finally focused by the tube lens L2 (focal length f2=20 cm) on a CCD camera or, alternatively, on a high-speed CMOS camera (PROMON U750, by AOS Technologies) by switching the movable mirror M2. To filter out from the acquired image the residual laser reflection, a low-pass filter () was placed in front of both camaras. The images were recorded at 1 kHz repetition rate (integration time of 1 ms) and a total of 5000 frames for each sample. Overall, we estimated the shortest flickering time in the Nyquist limit ms.
Holographic optical tweezers
The light source for HOT operation was a continuous-wave laser diode emitting at nm (ONDAX, by COHERENT), operating at a stable output power of 150 mW. We controlled the laser power that reached the sample (about 10 mW) by acting on a rotating half-wave plate to change the polarization of the beam, in conjunction with a linear polarizer. This also allowed us to align the electric field of the beam parallel to the larger dimension of the SLM screen. A telescope with magnification 8 X (made by lenses L3, f3=20 cm, and L4, f4=2.5 cm) increased the size of the collimated laser beam. Iris P1 selected the central and homogeneous part of the beam, therefore a constant wavefront impinges on the central area of the SLM (LCoS Pluto 4.0, by HOLOEYE) that worked in reflection. Each SLM’s pixel (1980 x1080) induced an independent phase shift in the range [0, ], controlled by applied voltage defined via computer. To display the hologram on the RBC plane, the SLM was placed in the Fourier plane of the sample. The SLM response was programmed by a dedicated MATLAB script to induce a phase mask that sculptures the laser phase to accomplish two tasks: i) to draw an intensity pattern that resemble the membrane of the observed RBC; ii) to act as a virtual lens with focal length fV=38 cm. We placed the lens L3 (f3=30 cm) in the optical path 68 cm after the SLM and at 30 cm before the objective back aperture. Therefore, the virtual lens and lens L3 formed a relay optics that imaged the beam reflected at the SLM plane to the back-focal plane of Ob2. Finally, the laser beam was reflected by the dichroic mirror to overfills the objective back aperture, thus generating an optical trap on the sample plane.
Hologram generation
The hologram displayed on the sample plane replicated the membrane profile of the observed RBC. We evaluated the RBC profile by generating a binary image of the cell rim from the image acquired by the camera, using a dedicated MATLAB script, as detailed in Figures S1 and S2. The binary image’s phase distribution was calculated using the iterative Gerchberg-Saxton algorithm, which employs Fourier-transform loops to converge on an 8-bit phase distribution image matching the dimension of the SLM screen. This phase distribution was digitally encoded on the SLM screen to modify the reflection of the incoming laser beam. The virtual lens was programmed directly into the SLM by adding the phase distribution of a lens with focal length 38 cm to the phase calculated by Gerchberg-Saxton algorithm and then by unwrapping the total phase mask in the range . We assessed the spatial correspondence between the binary image of the cell contour and the hologram intensity distribution on the sample plane through calibration, which was performed by trapping polyester beads of 1 μm diameter using a single trap encoded in the HOT and shifting the trap position across the field of view.
RBC trapping protocol
We positioned horizontally lying RBCs on the microscopy slide, allowing them to naturally adhere due to gravity. In free-standing conditions, we recorded a video capturing the RBC's flickering motions under healthy physiological conditions. Once the desired phase mask representing the observed RBC membrane contour was digitally encoded in the SLM, we activated the HOT system by turning on the laser, delivering a power of 10 mW to the sample plane. We recorded a video of the trapped cell under the same parameters used previously. To ensure that laser trapping did not induce irreversible changes, we followed this sequence for a given cell: i) video of free RBC flickering; ii) video of RBC flickering under optical trapping; iii) video of free RBC.
Flickering analysis
Each frame of the video acquired by the fast camera was saved as TIF file and analysed by MATHEMATICA software to evaluate the position of the circular RBC membrane as a function of time. The rim halos at the RBC membrane allowed us to estimate the radial positions of the contours by interpolation at subpixel resolution with an accuracy of few nm. We recorded the time series of the local membrane fluctuations for segmented elements, corresponding to an angular step , and to an arc length of , that was smaller than the estimated size of the flickering unit. By tracking the membrane position over time, we evaluated the fluctuations and corrected global drift that the RBC might experience due to global translation or rotation. To remove global translations, we evaluated the in-plane position of the centre of mass of each tracked contour and subtracted its trajectory to the contour coordinates. To eliminate rigid rotations, we evaluated the best alignment between consecutive frames, i.e., the rigid transformation that conserved the distances among the traced membrane elements.
Quantification and statistical analysis
Regarding the values of and kurtosis estimated in Figure 3, we performed the t-test to assess the statistical difference between the two groups of free and trapped RBCs in specimens. For a level of significance lower than 5% for the null hypothesis (), we observed for and for kurtosis. When fitting procedure was performed the goodness of the nonlinear fits was proven by the high likelihood -estimator.
Acknowledgments
The authors acknowledge Comunidad de Madrid for funding this research under grants Y2018/BIO-5207 and S2018/NMT-4389, and Spanish Ministry of Science and Innovation (MICINN) – Agencia Española de Investigación AEI under grant PID2019-108391RB-100 and TED2021-132296B-C52 (to F.M.) and TED2021-132296A-C53 (to D.H.A.). This study was also funded by a REACT-EU grant from the Comunidad de Madrid to the ANTICIPA project of Complutense University of Madrid. The funders had no role in study design, data collection and analysis, preparation of the manuscript or decision to publish.
Author contributions
N.C. conceived the experiments, mounted the optical setup, and analyzed the data, with F.M. designing the research. N.C. and M.G.V. conducted the experiments, supported by M.C. and N.H.O. in sample preparation, with F.M. designing both conceptualizations. J.A.S. helped in developing the theoretical model, D.H.A. designed the code for membrane tracking. N.C. and F.M. wrote the manuscript.
Declaration of interests
The authors declare no competing interest.
Declaration of generative AI and AI-assisted technologies in the writing process
During the preparation of this work the authors used ChatGPT3.5 to check English grammar and increase the readability of the text in some parts of the paper. After using this tool, the authors reviewed and edited the content as needed and take full responsibility for the content of the publication.
Published: May 8, 2024
Footnotes
Supplemental information can be found online at https://doi.org/10.1016/j.isci.2024.109915.
Contributor Information
Niccolò Caselli, Email: ncaselli@ucm.es.
Francisco Monroy, Email: monroy@ucm.es.
Supplemental information
References
- 1.Romani P., Valcarcel-Jimenez L., Frezza C., Dupont S. Crosstalk between mechanotransduction and metabolism. Nat. Rev. Mol. Cell Biol. 2021;22:22–38. doi: 10.1038/s41580-020-00306-w. [DOI] [PubMed] [Google Scholar]
- 2.Wu P.-H., Aroush D.R.-B., Asnacios A., Chen W.-C., Dokukin M.E., Doss B.L., Durand-Smet P., Ekpenyong A., Guck J., Guz N.V., et al. A comparison of methods to assess cell mechanical properties. Nat. Methods. 2018;15:491–498. doi: 10.1038/s41592-018-0015-1. [DOI] [PMC free article] [PubMed] [Google Scholar]
- 3.Lugagne J.-B., Dunlop M.J. Cell-machine interfaces for characterizing gene regulatory network dynamics. Curr. Opin. Syst. Biol. 2019;14:1–8. doi: 10.1016/j.coisb.2019.01.001. [DOI] [PMC free article] [PubMed] [Google Scholar]
- 4.Nelson B.J., Kaliakatsos I.K., Abbott J.J. Microrobots for Minimally Invasive Medicine. Annu. Rev. Biomed. Eng. 2010;12:55–85. doi: 10.1146/annurev-bioeng-010510-103409. [DOI] [PubMed] [Google Scholar]
- 5.Orapiriyakul W., Tsimbouri M.P., Childs P., Campsie P., Wells J., Fernandez-Yague M.A., Burgess K., Tanner K.E., Tassieri M., Meek D., et al. Nanovibrational Stimulation of Mesenchymal Stem Cells Induces Therapeutic Reactive Oxygen Species and Inflammation for Three-Dimensional Bone Tissue Engineering. ACS Nano. 2020;14:10027–10044. doi: 10.1021/acsnano.0c03130. [DOI] [PMC free article] [PubMed] [Google Scholar]
- 6.Hodgkinson T., Tsimbouri P.M., Llopis-Hernandez V., Campsie P., Scurr D., Childs P.G., Phillips D., Donnelly S., Wells J.A., O’Brien F.J., et al. The use of nanovibration to discover specific and potent bioactive metabolites that stimulate osteogenic differentiation in mesenchymal stem cells. Sci. Adv. 2021;7 doi: 10.1126/sciadv.abb7921. [DOI] [PMC free article] [PubMed] [Google Scholar]
- 7.Shakoor A., Gao W., Zhao L., Jiang Z., Sun D. Advanced tools and methods for single-cell surgery. Microsyst. Nanoeng. 2022;8 doi: 10.1038/s41378-022-00376-0. [DOI] [PMC free article] [PubMed] [Google Scholar]
- 8.Dufrêne Y.F., Ando T., Garcia R., Alsteens D., Martinez-Martin D., Engel A., Gerber C., Müller D.J. Imaging modes of atomic force microscopy for application in molecular and cell biology. Nat. Nanotechnol. 2017;12:295–307. doi: 10.1038/nnano.2017.45. [DOI] [PubMed] [Google Scholar]
- 9.Style R.W., Boltyanskiy R., German G.K., Hyland C., MacMinn C.W., Mertz A.F., Wilen L.A., Xu Y., Dufresne E.R. Traction Force Microscopy in Physics and Biology. Soft Matter. 2014;10:4047–4055. doi: 10.1039/C4SM00264D. [DOI] [PubMed] [Google Scholar]
- 10.Ashkin A., Dziedzic J.M., Bjorkholm J.E., Chu S. Observation of a single-beam gradient force optical trap for dielectric particles. Opt. Lett. 1986;11:288–290. doi: 10.1364/ol.11.000288. [DOI] [PubMed] [Google Scholar]
- 11.Bowman R.W., Padgett M.J. Optical trapping and binding. Rep. Prog. Phys. 2013;76 doi: 10.1088/0034-4885/76/2/026401. [DOI] [PubMed] [Google Scholar]
- 12.Dholakia K., Reece P., Gu M. Optical micromanipulation. Chem. Soc. Rev. 2008;37:42–55. doi: 10.1039/b512471a. [DOI] [PubMed] [Google Scholar]
- 13.Volpe G., Maragò O.M., Rubinsztein-dunlop H., Pesce G., Stilgoe A.B., Volpe G., Tkachenko G., Truong V.G., Chormaic S.N., Kalantarifard F., et al. Roadmap for optical tweezers. J. Phys. Photonics. 2023;5 [Google Scholar]
- 14.Blázquez-Castro A. Optical tweezers: Phototoxicity and thermal stress in cells and biomolecules. Micromachines. 2019;10:1–42. doi: 10.3390/mi10080507. [DOI] [PMC free article] [PubMed] [Google Scholar]
- 15.Ermolinskiy P.B., Lugovtsov A.E., Semenov A.N., Priezzhev A.V. Red blood cell in the field of a beam of optical tweezers. Quant. Electron. 2022;52:22–27. doi: 10.1070/QEL17962. [DOI] [Google Scholar]
- 16.Lenormand G., Hénon S., Richert A., Siméon J., Gallet F. Direct measurement of the area expansion and shear moduli of the human red blood cell membrane skeleton. Biophys. J. 2001;81:43–56. doi: 10.1016/S0006-3495(01)75678-0. [DOI] [PMC free article] [PubMed] [Google Scholar]
- 17.Yoon Y.Z., Kotar J., Brown A.T., Cicuta P. Red blood cell dynamics: From spontaneous fluctuations to non-linear response. Soft Matter. 2011;7:2042–2051. doi: 10.1039/c0sm01117g. [DOI] [Google Scholar]
- 18.Bambardekar K., Dharmadhikari A.K., Dharmadhikari J.A., Mathur D., Sharma S. Measuring erythrocyte deformability with fluorescence, fluid forces, and optical trapping. J. Biomed. Opt. 2008;13 doi: 10.1117/1.3037342. [DOI] [PubMed] [Google Scholar]
- 19.Paul A., Padmapriya P., Natarajan V. Diagnosis of malarial infection using change in properties of optically trapped red blood cells. Biomed. J. 2017;40:101–105. doi: 10.1016/j.bj.2016.10.001. [DOI] [PMC free article] [PubMed] [Google Scholar]
- 20.Guck J., Ananthakrishnan R., Mahmood H., Moon T.J., Cunningham C.C., Käs J. The Optical Stretcher: A Novel Laser Tool to Micromanipulate Cells. Biophys. J. 2001;81:767–784. doi: 10.1016/S0006-3495(01)75740-2. [DOI] [PMC free article] [PubMed] [Google Scholar]
- 21.Agrawal R., Smart T., Nobre-Cardoso J., Richards C., Bhatnagar R., Tufail A., Shima D., H. Jones P., Pavesio C. Assessment of red blood cell deformability in type 2 diabetes mellitus and diabetic retinopathy by dual optical tweezers stretching technique. Sci. Rep. 2016;6 doi: 10.1038/srep15873. [DOI] [PMC free article] [PubMed] [Google Scholar]
- 22.Xie Y., Liu X. Multifunctional manipulation of red blood cells using optical tweezers. J. Biophot. 2022;15 doi: 10.1002/jbio.202100315. [DOI] [PubMed] [Google Scholar]
- 23.Curtis J.E., Koss B.A., Grier D.G. Dynamic holographic optical tweezers. Opt Commun. 2002;207:169–175. doi: 10.1016/S0030-4018(02)01524-9. [DOI] [Google Scholar]
- 24.Grier D.G., Roichman Y. Holographic optical trapping. Appl. Opt. 2006;45:880–887. doi: 10.1364/AO.45.000880. [DOI] [PubMed] [Google Scholar]
- 25.Eriksen R., Daria V., Glückstad J. Fully dynamic multiple-beam optical tweezers. Opt Express. 2002;10:597–602. doi: 10.1364/OE.10.000597. [DOI] [PubMed] [Google Scholar]
- 26.Bhebhe N., Williams P.A.C., Rosales-Guzmán C., Rodriguez-Fajardo V., Forbes A. A vector holographic optical trap. Sci. Rep. 2018;8 doi: 10.1038/s41598-018-35889-0. [DOI] [PMC free article] [PubMed] [Google Scholar]
- 27.Stilgoe A.B., Kashchuk A.V., Balanant M.-A., Santangelo D., Nieminen T.A., Sauret E., Flower R., Rubinsztein-Dunlop H. Tired and stressed: direct holographic quasi-static stretching of aging echinocytes and discocytes in plasma using optical tweezers [Invited] Biomed. Opt Express. 2024;15:656–671. doi: 10.1364/BOE.504779. [DOI] [PMC free article] [PubMed] [Google Scholar]
- 28.Muñoz-Pérez F.M., Ferrando V., Furlan W.D., Castro-Palacio J.C., Arias-Gonzalez J.R., Monsoriu J.A. Multiplexed vortex beam-based optical tweezers generated with spiral phase mask. iScience. 2023;26 doi: 10.1016/j.isci.2023.107987. [DOI] [PMC free article] [PubMed] [Google Scholar]
- 29.Abramochkin E.G., Kotova S.P., Korobtsov A.V., Losevsky N.N., Mayorova A.M., Rakhmatulin M.A., Volostnikov V.G. Microobject manipulations using laser beams with nonzero orbital angular momentum. Laser Phys. 2006;16:842–848. doi: 10.1134/s1054660x06050161. [DOI] [Google Scholar]
- 30.Pesce G., Volpe G., Maragó O.M., Jones P.H., Gigan S., Sasso A., Volpe G. Step-by-step guide to the realization of advanced optical tweezers. J. Opt. Soc. Am. B. 2015;32 doi: 10.1364/JOSAB.32.000B84. [DOI] [Google Scholar]
- 31.Hörner F., Meissner R., Polali S., Pfeiffer J., Betz T., Denz C., Raz E. Holographic optical tweezers-based in vivo manipulations in zebrafish embryos. J. Biophot. 2017;10:1492–1501. doi: 10.1002/jbio.201600226. [DOI] [PubMed] [Google Scholar]
- 32.Chen H.-C., Cheng C.-J. Holographic Optical Tweezers: Techniques and Biomedical Applications. Appl. Sci. 2022;12 doi: 10.3390/app122010244. [DOI] [Google Scholar]
- 33.Discher D.E., Mohandas N., Evans E.A. Molecular Maps of Red Cell Deformation: Hidden Elasticity and in Situ Connectivity. Science. 1994;266:1032–1035. doi: 10.1126/science.7973655. [DOI] [PubMed] [Google Scholar]
- 34.Diez-Silva M., Dao M., Han J., Lim C.-T., Suresh S. Shape and Biomechanical Characteristics of Human Red Blood Cells in Health and Disease. MRS Bull. 2010;35:382–388. doi: 10.1557/mrs2010.571. [DOI] [PMC free article] [PubMed] [Google Scholar]
- 35.Zhu R., Avsievich T., Popov A., Meglinski I. Optical Tweezers in Studies of Red Blood Cells. Cells. 2020;9:545. doi: 10.3390/cells9030545. [DOI] [PMC free article] [PubMed] [Google Scholar]
- 36.Avsievich T., Zhu R., Popov A., Bykov A., Meglinski I. The advancement of blood cell research by optical tweezers. Rev. Phys. 2020;5 doi: 10.1016/j.revip.2020.100043. [DOI] [Google Scholar]
- 37.Yawata Y. Wiley-Blackwell; 2003. Cell Membrane: The Red Blood Cell as a Model. [Google Scholar]
- 38.Tomaiuolo G. Biomechanical properties of red blood cells in health and disease towards microfluidics. Biomicrofluidics. 2014;8 doi: 10.1063/1.4895755. [DOI] [PMC free article] [PubMed] [Google Scholar]
- 39.Bernecker C., Lima M., Kolesnik T., Lampl A., Ciubotaru C., Leita R., Kolb D., Fröhlich E., Schlenke P., Holzapfel G.A., et al. Biomechanical properties of native and cultured red blood cells–Interplay of shape, structure and biomechanics. Front. Physiol. 2022;13 doi: 10.3389/fphys.2022.979298. [DOI] [PMC free article] [PubMed] [Google Scholar]
- 40.Blowers R., Clarkson E.M., Maizels M. Flicker phenomenon in human erythrocytes. J. Physiol. 1951;113:228–239. doi: 10.1113/jphysiol.1951.sp004568. [DOI] [PMC free article] [PubMed] [Google Scholar]
- 41.Costa M., Ghiran I., Peng C.K., Nicholson-Weller A., Goldberger A.L. Complex dynamics of human red blood cell flickering: Alterations with in vivo aging. Phys. Rev. E Stat. Nonlin. Soft Matter Phys. 2008;78 doi: 10.1103/PhysRevE.78.020901. [DOI] [PMC free article] [PubMed] [Google Scholar]
- 42.Park Y., Best C.A., Badizadegan K., Dasari R.R., Feld M.S., Kuriabova T., Henle M.L., Levine A.J., Popescu G. Measurement of red blood cell mechanics during morphological changes. Proc. Natl. Acad. Sci. USA. 2010;107:6731–6736. doi: 10.1073/pnas.0909533107. [DOI] [PMC free article] [PubMed] [Google Scholar]
- 43.Park Y., Best C.A., Auth T., Gov N.S., Safran S.A., Popescu G., Suresh S., Feld M.S. Metabolic remodeling of the human red blood cell membrane. Proc. Natl. Acad. Sci. USA. 2010;107:1289–1294. doi: 10.1073/pnas.0910785107. [DOI] [PMC free article] [PubMed] [Google Scholar]
- 44.Rodríguez-García R., López-Montero I., Mell M., Egea G., Gov N.S., Monroy F. Direct Cytoskeleton Forces Cause Membrane Softening in Red Blood Cells. Biophys. J. 2015;108:2794–2806. doi: 10.1016/j.bpj.2015.05.005. [DOI] [PMC free article] [PubMed] [Google Scholar]
- 45.Turlier H., Fedosov D.A., Audoly B., Auth T., Gov N.S., Sykes C., Joanny J.F., Gompper G., Betz T. Equilibrium physics breakdown reveals the active nature of red blood cell flickering. Nat. Phys. 2016;12:513–519. doi: 10.1038/nphys3621. [DOI] [Google Scholar]
- 46.Di Terlizzi I., Gironella M., Herraez-Aguilar D., Betz T., Monroy F., Baiesi M., Ritort F. Variance sum rule for entropy production. Science. 2024;383:971–976. doi: 10.1126/science.adh1823. [DOI] [PubMed] [Google Scholar]
- 47.Fowler V.M. 1st ed. Elsevier Inc.; 2013. The Human Erythrocyte Plasma Membrane: A Rosetta Stone for Decoding Membrane-Cytoskeleton Structure. [DOI] [PubMed] [Google Scholar]
- 48.Bennett V., Baines A.J. Spectrin and ankyrin-based pathways: Metazoan inventions for integrating cells into tissues. Physiol. Rev. 2001;81:1353–1392. doi: 10.1152/physrev.2001.81.3.1353. [DOI] [PubMed] [Google Scholar]
- 49.Gov N.S., Safran S.A. Red blood cell membrane fluctuations and shape controlled by ATP-induced cytoskeletal defects. Biophys. J. 2005;88:1859–1874. doi: 10.1529/biophysj.104.045328. [DOI] [PMC free article] [PubMed] [Google Scholar]
- 50.Smith A.S., Nowak R.B., Zhou S., Giannetto M., Gokhin D.S., Papoin J., Ghiran I.C., Blanc L., Wan J., Fowler V.M. Myosin IIA interacts with the spectrin-actin membrane skeleton to control red blood cell membrane curvature and deformability. Proc. Natl. Acad. Sci. USA. 2018;115:E4377–E4385. doi: 10.1073/pnas.1718285115. [DOI] [PMC free article] [PubMed] [Google Scholar]
- 51.Gerchberg R.W., Saxton W.O. A Practical Algorithm for the Determination of Phase from Image and Diffraction Plane Pictures. Optik. 1972;35:237–246. [Google Scholar]
- 52.Melville H., Milne G., Spalding G., Sibbett W., Dholakia K., McGloin D. Optical trapping of three-dimensional structures using dynamic holograms. Opt Express. 2003;11:3562–3567. doi: 10.1364/OE.11.003562. [DOI] [PubMed] [Google Scholar]
- 53.Avsievich T., Popov A., Bykov A., Meglinski I. Mutual interaction of red blood cells assessed by optical tweezers and scanning electron microscopy imaging. Opt. Lett. 2018;43:3921–3924. doi: 10.1364/ol.43.003921. [DOI] [PubMed] [Google Scholar]
- 54.Mell M., Monroy F. A gradient-based, GPU-accelerated, high-precision contour-segmentation algorithm with application to cell membrane fluctuation spectroscopy. PLoS One. 2018;13 doi: 10.1371/journal.pone.0207376. [DOI] [PMC free article] [PubMed] [Google Scholar]
- 55.Herráez-Aguilar D., Madrazo E., López-Menéndez H., Ramírez M., Monroy F., Redondo-Muñoz J. Multiple particle tracking analysis in isolated nuclei reveals the mechanical phenotype of leukemia cells. Sci. Rep. 2020;10:1–12. doi: 10.1038/s41598-020-63682-5. [DOI] [PMC free article] [PubMed] [Google Scholar]
- 56.Aarts P.A., Bolhuis P.A., Sakariassen K.S., Heethaar R.M., Sixma J.J. Red blood cell size is important for adherence of blood platelets to artery subendothelium. Blood. 1983;62:214–217. doi: 10.1182/blood.v62.1.214.214. [DOI] [PubMed] [Google Scholar]
- 57.Almendro-Vedia V.G., Natale P., Mell M., Bonneau S., Monroy F., Joubert F., López-Montero I. Nonequilibrium fluctuations of lipid membranes by the rotating motor protein F 1 F 0 -ATP synthase. Proc. Natl. Acad. Sci. USA. 2017;114:11291–11296. doi: 10.1073/pnas.1701207114. [DOI] [PMC free article] [PubMed] [Google Scholar]
- 58.Pan L., Yan R., Li W., Xu K. Super-Resolution Microscopy Reveals the Native Ultrastructure of the Erythrocyte Cytoskeleton. Cell Rep. 2018;22:1151–1158. doi: 10.1016/j.celrep.2017.12.107. [DOI] [PubMed] [Google Scholar]
- 59.Betz T., Lenz M., Joanny J.-F., Sykes C. ATP-dependent mechanics of red blood cells. Proc. Natl. Acad. Sci. USA. 2009;106:15320–15325. doi: 10.1073/pnas.0904614106. [DOI] [PMC free article] [PubMed] [Google Scholar]
- 60.Arriaga L.R., Rodríguez-García R., Moleiro L.H., Prévost S., López-Montero I., Hellweg T., Monroy F. Dissipative dynamics of fluid lipid membranes enriched in cholesterol. Adv. Colloid Interface Sci. 2017;247:514–520. doi: 10.1016/j.cis.2017.07.007. [DOI] [PubMed] [Google Scholar]
- 61.Schmidt D., Monzel C., Bihr T., Merkel R., Seifert U., Sengupta K., Smith A.-S. Signature of a Nonharmonic Potential as Revealed from a Consistent Shape and Fluctuation Analysis of an Adherent Membrane. Phys. Rev. X. 2014;4 doi: 10.1103/PhysRevX.4.021023. [DOI] [Google Scholar]
- 62.Moleiro L.H., Mell M., Bocanegra R., López-Montero I., Fouquet P., Hellweg T., Carrascosa J.L., Monroy F. Permeability modes in fluctuating lipid membranes with DNA-translocating pores. Adv. Colloid Interface Sci. 2017;247:543–554. doi: 10.1016/j.cis.2017.07.009. [DOI] [PubMed] [Google Scholar]
- 63.Granek R. From semi-flexible polymers to membranes: anomalous diffusion and reptation. J. Phys. II. 1997;7:1761–1788. [Google Scholar]
- 64.Mell M., Moleiro L.H., Hertle Y., López-Montero I., Cao F.J., Fouquet P., Hellweg T., Monroy F. Fluctuation dynamics of bilayer vesicles with intermonolayer sliding: Experiment and theory. Chem. Phys. Lipids. 2015;185:61–77. doi: 10.1016/j.chemphyslip.2014.11.005. [DOI] [PubMed] [Google Scholar]
- 65.Seifert U. Configurations of fluid membranes and vesicles. Adv. Phys. X. 1997;46:13–137. doi: 10.1080/00018739700101488. [DOI] [Google Scholar]
- 66.Szendro P., Vincze G., Szasz A. Pink-noise behaviour of biosystems. Eur. Biophys. J. 2001;30:227–231. doi: 10.1007/s002490100143. [DOI] [PubMed] [Google Scholar]
- 67.Brochard F., Lennon J.F. Frequency spectrum of the flicker phenomenon in erythrocytes. J. Phys. 1975;36:1035–1047. doi: 10.1051/jphys:0197500360110103500. [DOI] [Google Scholar]
- 68.Milner S.T., Safran S.A. Dynamical fluctuations of droplet microemulsions and vesicles. Phys. Rev. A. 1987;36:4371–4379. doi: 10.1103/PhysRevA.36.4371. [DOI] [PubMed] [Google Scholar]
- 69.Arriaga L.R., López-Montero I., Orts-Gil G., Farago B., Hellweg T., Monroy F. Fluctuation dynamics of spherical vesicles: Frustration of regular bulk dissipation into subdiffusive relaxation. Phys. Rev. E. 2009;80 doi: 10.1103/PhysRevE.80.031908. [DOI] [PubMed] [Google Scholar]
- 70.Gov N. Membrane Undulations Driven by Force Fluctuations of Active Proteins. Phys. Rev. Lett. 2004;93 doi: 10.1103/PhysRevLett.93.268104. [DOI] [PubMed] [Google Scholar]
- 71.Granek R., Pierrat S. Enhanced Transverse Diffusion in Active Biomembranes. Phys. Rev. Lett. 1999;83:872–875. doi: 10.1103/PhysRevLett.83.872. [DOI] [Google Scholar]
- 72.Lee Rodgers J., Nicewander W.A. Thirteen Ways to Look at the Correlation Coefficient. Am. Stat. 1988;42:59–66. doi: 10.1080/00031305.1988.10475524. [DOI] [Google Scholar]
- 73.Zhu R., Avsievich T., Su X., Bykov A., Popov A., Meglinski I. Hemorheological alterations of red blood cells induced by 450-nm and 520-nm laser radiation. J. Photochem. Photobiol., B. 2022;230 doi: 10.1016/j.jphotobiol.2022.112438. [DOI] [PubMed] [Google Scholar]
- 74.Zhu R., Avsievich T., Bykov A., Popov A., Meglinski I. Influence of Pulsed He–Ne Laser Irradiation on the Red Blood Cell Interaction Studied by Optical Tweezers. Micromachines. 2019;10:853. doi: 10.3390/mi10120853. [DOI] [PMC free article] [PubMed] [Google Scholar]
- 75.Tapia J., Vera N., Aguilar J., González M., Sánchez S.A., Coelho P., Saavedra C., Staforelli J. Correlated flickering of erythrocytes membrane observed with dual time resolved membrane fluctuation spectroscopy under different d-glucose concentrations. Sci. Rep. 2021;11:2429. doi: 10.1038/s41598-021-82018-5. [DOI] [PMC free article] [PubMed] [Google Scholar]
- 76.Avsievich T., Zhu R., Popov A.P., Yatskovskiy A., Popov A.A., Tikhonowsky G., Pastukhov A.I., Klimentov S., Bykov A., Kabashin A., Meglinski I. Impact of Plasmonic Nanoparticles on Poikilocytosis and Microrheological Properties of Erythrocytes. Pharmaceutics. 2023;15:1046. doi: 10.3390/pharmaceutics15041046. [DOI] [PMC free article] [PubMed] [Google Scholar]
- 77.Ivanov I.T., Paarvanova B.K. Differential dielectroscopic data on the relation of erythrocyte membrane skeleton to erythrocyte deformability and flicker. Eur. Biophys. J. 2021;50:69–86. doi: 10.1007/s00249-020-01491-4. [DOI] [PubMed] [Google Scholar]
- 78.Hoffman J.F. Evidence that asymmetry of the membrane/cytoskeletal complex in human red blood cell ghosts is responsible for their biconcave shape. Proc. Natl. Acad. Sci. USA. 2018;115:1641–1645. doi: 10.1073/pnas.1721463115. [DOI] [PMC free article] [PubMed] [Google Scholar]
- 79.Strey H., Peterson M., Sackmann E. Measurement of erythrocyte membrane elasticity by flicker eigenmode decomposition. Biophys. J. 1995;69:478–488. doi: 10.1016/S0006-3495(95)79921-0. [DOI] [PMC free article] [PubMed] [Google Scholar]
- 80.Pretorius E. The adaptability of red blood cells. Cardiovasc. Diabetol. 2013;12:63. doi: 10.1186/1475-2840-12-63. [DOI] [PMC free article] [PubMed] [Google Scholar]
- 81.Mohandas N., Chasis J.A. Red blood cell deformability, membrane material properties and shape: regulation by transmembrane, skeletal and cytosolic proteins and lipids. Semin. Hematol. 1993;30:171–192. [PubMed] [Google Scholar]
- 82.Anderson H.L., Brodsky I.E., Mangalmurti N.S. The Evolving Erythrocyte: Red Blood Cells as Modulators of Innate Immunity. J. Immunol. 2018;201:1343–1351. doi: 10.4049/jimmunol.1800565. [DOI] [PMC free article] [PubMed] [Google Scholar]
- 83.Lam L.K.M., Murphy S., Kokkinaki D., Venosa A., Sherrill-Mix S., Casu C., Rivella S., Weiner A., Park J., Shin S., et al. DNA binding to TLR9 expressed by red blood cells promotes innate immune activation and anemia. Sci. Transl. Med. 2021;13 doi: 10.1126/scitranslmed.abj1008. [DOI] [PMC free article] [PubMed] [Google Scholar]
- 84.Feng Y., Zhao X., White A.K., Garcia K.C., Fordyce P.M. A bead-based method for high-throughput mapping of the sequence- and force-dependence of T cell activation. Nat. Methods. 2022;19:1295–1305. doi: 10.1038/s41592-022-01592-2. [DOI] [PubMed] [Google Scholar]
Associated Data
This section collects any data citations, data availability statements, or supplementary materials included in this article.
Supplementary Materials
Data Availability Statement
-
•
All raw images data derived from human samples have been deposited at Figshare repository and are publicly available as of the date of publication. Accession numbers DOIs are listed in the key resources table. Data are in the form of TIF images acquired in our microscopy setup for free-standing and optically trapped red blood cells.
-
•
The original codes developed for driving the HOT setup, analysing the raw data images, and tracking the RBC membranes have been deposited at Figshare repository and is publicly available as of the date of publication. DOIs are listed in the key resources table.
-
•
Any additional information required to reanalyze the data reported in this paper is available from the lead contact upon request.