

Abstract
The COVID-19 pandemic has highlighted the need to use infection testing databases to rapidly estimate effectiveness of prior infection in preventing reinfection ( ) by novel severe acute respiratory syndrome coronavirus 2 (SARS-CoV-2) variants. Mathematical modeling was used to demonstrate a theoretical foundation for applicability of the test-negative, case–control study design to derive
  . Apart from the very early phase of an epidemic, the difference between the test-negative estimate for
  and true value of
  was minimal and became negligible as the epidemic progressed. The test-negative design provided robust estimation of
  and its waning. Assuming that only 25% of prior infections are documented, misclassification of prior infection status underestimated
  , but the underestimate was considerable only when > 50% of the population was ever infected. Misclassification of latent infection, misclassification of current active infection, and scale-up of vaccination all resulted in negligible bias in estimated
  . The test-negative design was applied to national-level testing data in Qatar to estimate
  for SARS-CoV-2.
  against SARS-CoV-2 Alpha and Beta variants was estimated at 97.0% (95% CI, 93.6-98.6) and 85.5% (95% CI, 82.4-88.1), respectively. These estimates were validated using a cohort study design. The test-negative design offers a feasible, robust method to estimate protection from prior infection in preventing reinfection.
Keywords: reinfection, test-negative design, effectiveness, mathematical model, SARS-CoV-2, COVID-19
Introduction
Estimating effectiveness of prior infection in preventing reinfection ( ) is essential to understanding the epidemiology of a given infection. Various studies estimated
  for severe acute respiratory syndrome coronavirus 2 (SARS-CoV-2) variants.1-9 However, there are challenges in estimating
  using conventional epidemiologic study designs. Such designs require extensive, complete electronic health records to be feasible. Vaccination scale-up makes it difficult to disentangle immunity induced by prior infection from that induced by vaccination.
Even when it is feasible to apply conventional designs, estimates can be prone to strong bias, due to misclassification of prior infection status, since many prior infections are not documented.10-12 Effects of this bias increase with increased cumulative infection exposure in the population.13 Emergence of the Omicron14 (B.1.1.529) variant and its subsequent subvariants emphasized the need to estimate  rapidly once a new variant/subvariant emerges.
Here, we demonstrate a robust, practical method to estimate  using a test-negative, case–control study design. This is, to our knowledge, the first use of this method to estimate
  . While it has been used to study vaccine effectiveness,15-22 it does not appear to have been used to estimate
  , perhaps because of a perception that it is not applicable, as most prior and current infections are undocumented, unlike vaccinations, which are typically documented and tracked in health systems. We also provide an application of this method by estimating
  for SARS-CoV-2 infection in Qatar, at a time when the Alpha14 (B.1.1.7) and Beta14 (B.1.351) variants dominated incidence.21-26
This article includes two components. The first is a parsimonious mathematical modeling component whose purpose is to motivate the test-negative design and to demonstrate that theoretically it can be applied to provide credible estimates for  despite specific sources of bias. This modeling exercise is not intended to provide a simulation of a specific empirical study or discuss all sources of potential bias, but to provide a theoretical foundation of the applicability of such design to estimate
  . The second component is a real-world application of the test-negative design to actual routine data to generate estimates for
  . This specific application was conducted because there are already published estimates for
  using a cohort study design applied to the same data, population, and duration of study.4 Therefore, the cohort study design provides a validation for the test-negative design, as both the cohort and test-negative designs yielded the same results when applied to the same data source.
Methods
Test-negative case–control study design
The test-negative, case–control study design has emerged as a robust and practical method to assess vaccine effectiveness for respiratory tract infections.15-22,27-32 In this design, which resembles a case–control design although it is not strictly a case–control design, persons seeking health care because of symptoms are recruited into the study.15,16,27,28,30-32 Those testing positive for the infection (cases) are then matched to those testing negative (controls).15,16,27,28,30-32 Matching is done to control for differences in the risk of exposure to the infection.21,22,33 Vaccine effectiveness is then derived as 1 minus the ratio of the odds of vaccination in subjects testing positive to the odds of vaccination in subjects testing negative.15,16 A key strength of this design is removal of differences in health care–seeking behavior between vaccinated and unvaccinated persons, thereby minimizing bias.15,16,27-32 Another strength is minimization of bias arising from misclassification of infection.15,16,27-32
Mathematical modeling and simulation of the test-negative design
Mathematical modeling was used to demonstrate a theoretical foundation for the applicability of the test-negative, case–control study design for deriving effectiveness of prior infection in preventing reinfection ( ), that is, the proportional reduction in susceptibility to infection among those with prior infection versus those without.2 Modeling was also used to investigate effects of biases on estimated
  . While this demonstration was done for SARS-CoV-2 infection, the approach is generic and should be broadly applicable to a range of infections. Moreover, while this demonstration was done for any SARS-CoV-2 infection, regardless of symptoms, the same approach can be applied to other outcomes such as symptomatic infection, asymptomatic infection, severe or critical COVID-19,34 or COVID-19 death,35 as long as these outcomes are defined as specific subsets of the broad any-infection outcome or its direct disease progression.
Several models were devised to simulate SARS-CoV-2 infection transmission in the population and to investigate applicability of the test-negative design. The models were based on previously published models and their parameters for SARS-CoV-2 infection.12,36-42 To keep only the essential details for the investigations of this study, the models were parsimonious and not structured by age, nor by infection type and severity. The instantaneous prevalence at each time point, for each population compartment, was used in the analyses of these models.
The first model was the classic susceptible-exposed-infectious-recovered (SEIR) model, but extended to allow for reinfections (baseline model; Figure 1A). This model was used to demonstrate applicability of the test-negative design and to investigate sources of bias. In this model and its analysis all controls were either susceptible or recovered individuals, and all cases were either infected or reinfected individuals.
Figure 1.

Schematic diagrams of mathematical models used in this study. A) Classic susceptible-exposed-infectious-recovered (SEIR) model extended to allow for reinfections (baseline model). B) Baseline model extended to include vaccination (vaccination model). C) Baseline model extended to include waning in protection of prior infection against reinfection (waning-of-immunity model).
Building on previous modeling studies of vaccine effectiveness and its waning,13,43-47 the second model was an extension of the baseline model to incorporate scale-up of vaccination in the population (vaccination model; Figure 1B). This model was used to investigate whether vaccination could affect applicability of this method to estimate  . Vaccine effectiveness (
 ) was defined as the proportional reduction in susceptibility to infection among those vaccinated versus those unvaccinated.40,41
 was set at 75%, a representative value for the range of coronavirus disease 2019 (COVID-19) vaccines available during times in which incidence was due to pre-Omicron variants.21,33,48,49 Duration of vaccine-induced protection was assumed to be 6 months in light of documented waning of COVID-19 vaccine protection.25,48-52
The third model was also an extension of the baseline model, incorporating gradual (linear) waning in protection offered by prior infection against reinfection (waning-of-immunity model; Figure 1C). Time after recovery from infection was modeled as an aging process whereby the recovered population transitions from one population compartment to the next with the average duration spent in each compartment being one month. Each 1-month recovered-population compartment had a set  value.
  was modeled to decline linearly month by month. Accordingly, the recovered population is tracked month by month after recovery to allow for test-negative-study estimation of waning of natural immunity, as is described in the literature for waning of vaccine immunity after the second or booster doses.25,52,53
These models consisted of coupled nonlinear differential equations that stratified the population into compartments (groups) based on infection status (infected, reinfected, or uninfected) and vaccination status (vaccinated, unvaccinated). Susceptible individuals (vaccinated or unvaccinated) were assumed at risk of acquiring the infection at a force of infection that varied throughout the epidemic due to variation in the contact rate. Recovered individuals (vaccinated or unvaccinated) were also assumed at risk of acquiring the infection, but the force of infection was reduced by the effect of  .
.
These models were calibrated to mimic the actual evolution of the COVID-19 epidemic in Qatar.12,36 The contact rate was varied to generate 2 major epidemic waves several months apart, as actually occurred.12,25,36,54 Parameters of the models are summarized in Table 1. Further details on these models, their equations, and their parameterization can be found in previous publications.12,36-42 Modeling analyses were performed using MATLAB R2019a (Natick, MA).55
Table 1.
Model parameters and assumptions.
| Parameter | Symbol | Value | Justification |
|---|---|---|---|
| Duration of latent infection | 3.69 days | Based on existing estimate83 and based on a median incubation period of 5.1 days84 adjusted by observed viral load among infected persons85 and reported transmission before onset of symptoms86 | |
| Duration of infectiousness | 3.48 days | Based on existing estimate83 and based on observed time to recovery among persons with mild infection83,87 and observed viral load in infected persons85,86 | |
| Infection fatality rate | 1.85 per 100 000 infections | Estimate based on fitting the epidemic in Qatar38 | |
| Life expectancy in Qatar | 80.7 years | United Nations World Population Prospects database88 | |
| Vaccine effectiveness in reducing susceptibility to infection |

|
75% | Representative value for the range of COVID-19 vaccines available at present21,33,48,49 |
| Duration of vaccine protection | 6 months | Based on evidence on waning of vaccine protection25,48-52 | |
| Model-assumed “true” effectiveness of prior infection in preventing reinfection |

|
80% | Informed by evidence from existing studies1-9 |
| Proportion of prior infections that are undocumented |

|
75% | Informed by evidence from existing studies10-12,38 |
| Proportion of latent infections that are undocumented |

|
75% | Informed by evidence from existing studies10-12,38 |
| Proportion of current active infections that are undocumented |

|
75% | Informed by evidence from existing studies10-12,38 |
Effectiveness of prior infection against reinfection and impact of bias
Applying the test-negative, case–control study design,  was derived as 1 minus the ratio of the odds of prior infection in subjects testing positive (such as by polymerase chain reaction [PCR] testing) to the odds of prior infection in subjects testing negative for the infection. The 2-by-2 table used to derive the odds ratio is shown in Figure 2A, as expressed in terms of the baseline model’s population variables. The mathematical expression for
  is also shown in Figure 2A, assuming no form of bias. An underlying assumption is that those being tested are a specific fixed proportion (random sample) of all population variables; that is, the same sampling proportion is applied for each population compartment in the model. We also assumed that those latently infected (E compartment) are as diagnosable as those in acute infection (I compartment), given the wide application of the highly sensitive PCR testing for SARS-CoV-2 infection, and because of existence of large-scale routine testing in many countries, in addition to testing for symptomatic cases. A departure of the latter assumption has been investigated in a sensitivity analysis.
Figure 2.

The 2-by-2 tables and equations used to estimate effectiveness of prior infection in preventing reinfection ( ) using the test-negative, case–control study design. A)
  estimated in absence of bias. B)
  estimated in presence of misclassification of prior infection. C)
  estimated in presence of misclassification of latent infection. D)
  estimated in presence of misclassification of current active infection. E)
  estimated in presence of vaccination scale-up.
Several forms of bias may affect estimation of  using the test-negative method. The most critical is misclassification of prior infection status. A proportion
  of those previously infected may not have been diagnosed and may have been unaware of their infections. It is reasonable to assume that most persons with a prior infection may not have had it documented.10-12 Here, we assumed that 75% of prior infections are undocumented, that is, an ascertainment rate of only 25% (Table 1). This ascertainment rate was based on fitting epidemic models to national seroprevalence survey data in Qatar,12,38,56-59 and is consistent with the ascertainment rate estimated for the United States, also, using serological surveys.10
Unlike vaccine effectiveness studies, in which records are typically available to track vaccinations,15-22,33 most persons with prior infection could be misclassified as persons with no prior infection. Similarly, most currently active infections may not be documented. The 2-by-2 table is thus modified for this bias along with the expression for  (Figure 2B). It was assumed that this bias affects both cases and controls similarly, a valid assumption considering that both cases and controls are seeking health care because of symptoms. This assumption is central to the test-negative design strategy.15,16,27,28,30-32
A second source of bias is misclassification of latent infection status. A proportion  of those with latent infections are asymptomatic, thereby remaining untested and undiagnosed. These cases would be misclassified as controls. The 2-by-2 table is thus modified to accommodate this bias along with the expression for
  (Figure 2C). We assumed that
  (Table 1). We also assumed that this bias similarly affects those with and without prior infection. This is a valid assumption considering that both are seeking health care for the same reason, another assumption central to the test-negative design strategy.15,16,27,28,30-32
A proportion  of cases (current active infections) could be misclassified as controls, because of lack of testing or due to imperfect sensitivity of the testing method, thereby introducing bias. The 2-by-2 table is thus modified for this bias along with the expression for
  (Figure 2D). We assumed that
  (Table 1). We also assumed that this bias similarly affects those with and without prior infection.15,16,27,28,30-32
Estimation of  may occur at a time when vaccination is being scaled up, as in the current COVID-19 pandemic. This could introduce bias as vaccination is another form of immune protection. Using the vaccination model, the 2-by-2 table is modified in the presence of vaccination along with the expression for
  (Figure 2E). We assumed that vaccination is being linearly scaled up to reach the vaccine coverage attained in Qatar during the duration of the simulation. We also assumed that protection of natural immunity and of vaccine immunity act independently of each other, as suggested recently for the effect of hybrid immunity.53 Accordingly, protection of hybrid immunity of prior infection (
 ) and vaccination (
 ) combines as a multiplicative protection effect53—hybrid immunity of prior infection and vaccination is superior to that of either prior infection or vaccination separately.53,54,60
Since different forms of bias may act synergistically when present together, the impact of the above biases was also investigated by applying all of them together at the same time.
Sensitivity analyses
Four sensitivity analyses were conducted. In the first sensitivity analysis, presented analyses were repeated using the real-world, detailed reference mathematical model that was used to describe the epidemic and forecast its progression in Qatar, to inform policy decision-making (the Qatar model; Figure S1).12,36,38 This model stratified the population into compartments according to age group, infection status (uninfected, infected, reinfected), infection type (asymptomatic/mild, severe, and critical), COVID-19 disease type (severe or critical disease), and vaccination status (vaccinated, unvaccinated). The model was fitted to the national standardized, integrated, and centralized databases of SARS-CoV-2 diagnosed cases, SARS-CoV-2 PCR and antibody testing, COVID-19 hospitalizations, and COVID-19 mortality,12 as well as to data of a series of SARS-CoV-2 epidemiologic studies in Qatar.1-3,38,42,57-59 The model-fitted indicators and the measured indicators and their comparison have been published previously, as well as an array of model projections for different infection and disease outcomes.12,36-41,61 Model fitting was used to estimate key epidemiologic indicators including the ascertainment rates among others. Detailed description of the model, its input data, and fitting are available in the references.12,36,38
The second sensitivity analysis investigated the representativeness of  as derived using the test-negative study design of the true
  , over the full spectrum of possible
  values. The third sensitivity analysis investigated whether the
  estimate can vary by using incidence instead of instantaneous prevalence in deriving the estimate. The fourth sensitivity analysis investigated the impact on
  of full misclassification bias of those latently infected. That is, none of those latently infected are being diagnosed; only those in acute infection are being diagnosed.
Real-world application: effectiveness of prior infection in preventing reinfection in Qatar
To validate the test-negative design,  was estimated in Qatar using national-level routine PCR testing data. Databases include all SARS-CoV-2-related data, with no missing information since pandemic onset, such as PCR tests and vaccinations. Only persons being PCR tested for clinical suspicion of infection due to symptoms between March 8 and April 21, 2021, were eligible for inclusion in this analysis. This study duration was chosen because there are existing estimates for
  during this time but using a conventional, cohort study design.4 This allows validation of the estimate generated using the test-negative design.
Prior infection was defined as a PCR-confirmed infection ≥90 days before a new PCR-positive test.2,6 Individuals infected during the 90 days preceding the PCR test were thus excluded. Based on existing evidence62-64 and viral genome sequencing,3,21 a SARS-CoV-2 Alpha variant case was defined as an S-gene “target failure” case using the TaqPath COVID-19 Combo Kit (Thermo Fisher Scientific, Waltham, MA65) applying the criterion of a PCR cycle threshold (Ct) value ≤ 30 for both the N and ORF1ab genes but a negative outcome for the S gene.3,4,64 With essentially only Beta and Alpha cases identified between March 8 and April 21, 2021,21-26 a Beta case was proxied as the complement of the Alpha criterion, that is, any case with a Ct value ≤ 30 for the N, ORF1ab, and S genes.
Only the first PCR-positive test during the study was included for each case, and only the first PCR-negative test during the study was included for each control, per established protocol for the test-negative design.21,22,25,33 No Beta-positive cases were included as Alpha-negative controls, or vice versa. The negative controls in both the Alpha and Beta analyses were chosen from the same population of those who tested negative during the study. Alpha and Beta cases were exact-matched 1-to-1 to controls (PCR-negative persons) by sex, 10-year age group, nationality, and calendar week of PCR test. Matching of cases and controls was done to control for known differences in the risk of exposure to SARS-CoV-2 infection in Qatar.12,42,57-59
This applied test-negative design, including these specific inclusion and exclusion criteria, was developed over a series of studies17,21,22,25,52,66 to minimize effects of potential bias, such as retesting after a positive test to check for clearance of infection, or to control the effect of repeat testers.25 Extensive sensitivity and additional analyses were conducted in these prior studies to investigate effects of different kinds of potential bias in this design, including investigating different adjustments in the analysis, different approaches for matching,67 different approaches for factoring prior infection in the analysis, and other different study inclusion and exclusion criteria.17,21,22,25,52,66 The applied test-negative design is an outcome of these analyses to optimize the design by minimizing different sources of bias in real-world data. The design was also validated using studies that used control groups to test for null effects,22,25,52,68,69 and also validated using cohort study designs applied to the same population and that yielded findings similar to those of the test-negative design.21,22,66 Further description of Qatar’s databases and methods of analysis can be found in previous publications.1-4,21,22,25,33,42,54
Sociodemographic characteristics of study samples were described using frequency distributions and measures of central tendency. The odds ratio, comparing odds of prior infection among cases versus controls, and its associated 95% confidence interval (CI) were derived using conditional logistic regression, that is, factoring matching in the study design. This analytical approach is done to minimize potential bias due to variation in epidemic phase15,70 and other confounders.12,42,57-59,71,72 and its associated 95% CI were calculated by applying the following equation:
 |
Statistical analyses were performed using STATA/SE, version 17.0.73 The study was approved by the Hamad Medical Corporation and Weill Cornell Medicine–Qatar institutional review boards with waiver of informed consent. The study was reported following the Strengthening the Reporting of Observational Studies in Epidemiology (STROBE) guidelines. The STROBE checklist is found in Table S1.
Results
Protection of prior infection using the test-negative design and impact of bias
Figure 3 shows simulated evolution of the SARS-CoV-2 epidemic in its 2 waves (Figure 3A), the proportion of the population ever infected (Figure 3B), and vaccine coverage (Figure 3C). Figure 4A shows the estimated  using the test-negative design (labeled as
  ), by application of the expression in Figure 2A, compared with the true
  (labeled as
  ), here assumed at 80% (Table 1). Apart from the very early phase of the epidemic, when the number of reinfections was minimal, the difference between
  and
and  was no more than several percentage points. The difference became negligible as the epidemic progressed.
Figure 3.
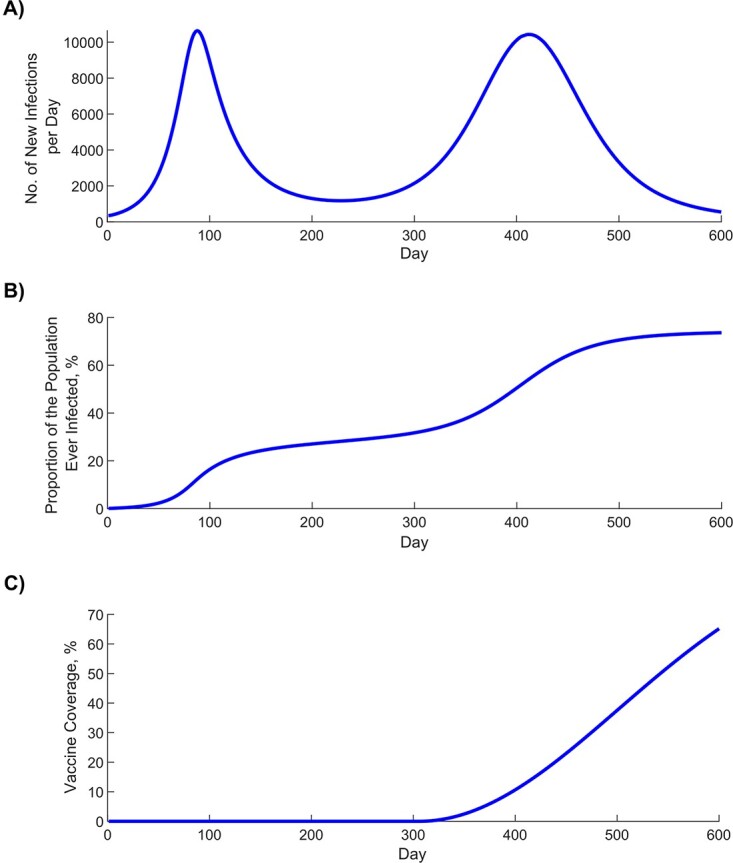
Simulated severe acute respiratory syndrome coronavirus 2 (SARS-CoV-2) epidemic through 2 epidemic waves. A) Daily number of new infections. B) Proportion of the population ever infected. C) Scale-up of vaccine coverage.
Figure 4.
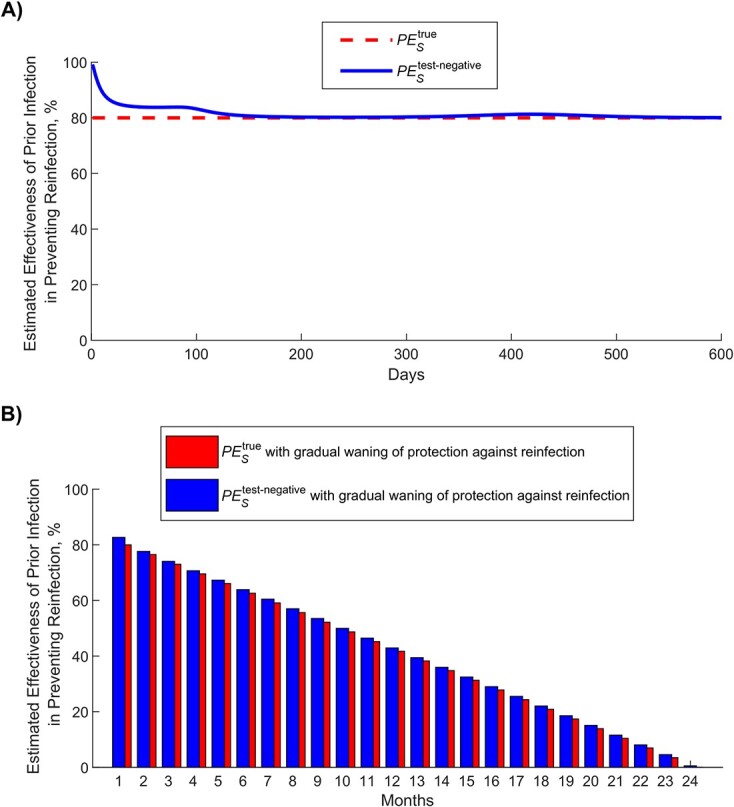
Estimated effectiveness of prior infection in preventing reinfection using the test-negative study design ( ) compared with the true effectiveness of prior infection in preventing reinfection (
 ). A)
). A)  versus
  in presence of no waning of protection (baseline model). B)
  versus
  month by month after the prior infection in presence of gradual waning of protection against reinfection (waning-of-immunity model). This figure was generated using the instantaneous prevalence at each time point for each population.
Assuming that only 25% of prior infections are documented (Table 1), Figure 5A shows the impact of misclassification of prior infection, by application of the expression in Figure 2B. This form of bias resulted in underestimation of  . When the proportion of the population ever infected was below 50% (Figure 3B),
  was only few percentage points lower than that of
  . However, the underestimation increased to as much as 30 percentage points when the proportion of the population ever infected was approximately 75%. Therefore,
  would provide only a lower bound for
  in situations where nearly everyone is infected, such as for influenza.
Figure 5.

Impact of bias in estimating effectiveness of prior infection in preventing reinfection using the test-negative study design ( ). A) Impact of misclassification of prior infection. B) Impact of misclassification of latent infection. C) Impact of misclassification of current active infection. D) Impact of scale-up of vaccination in the population. This figure was generated using the instantaneous prevalence at each time point for each population.
Misclassification of latent infection (Figure 5B), misclassification of current active infection (Figure 5C), and scale-up of vaccination (Figure 5D) all resulted in negligible bias in estimated  . Application of the above forms of bias at the same time suggested that there is no synergy when biases are combined (Figure S2).
Applying the waning-of-immunity model, Figure 4B shows  versus
  , month by month after prior infection, assuming that there is a gradual linear waning in protection of prior infection against reinfection. This comparison was done after the second wave at day 600 after the virus introduction (Figure 3A).
  provided a robust approximation of
  and its waning month by month.
Above analyses were repeated in the first sensitivity analysis that used the real-world Qatar model. The analysis confirmed the same findings as those of the main analysis using the parsimonious models (Figure S3). Impact of bias due to scale-up of vaccination was not investigated using the Qatar model, as this model’s fitting already factors in the scale-up of vaccination in Qatar.36
The second sensitivity analysis showed that  reflects the value of
  regardless of the actual value of
  and over the full spectrum of possible
  values (Figure S4). The third sensitivity analysis showed that the
  estimate using incidence is similar to that using instantaneous prevalence (Figure S5). The fourth sensitivity analysis showed that full misclassification bias of those latently infected has virtually no impact on estimated
  (Figure S6).
Application: effectiveness of prior infection in preventing reinfection in Qatar
Figure 6 presents a flowchart describing the population selection process for estimating  in Qatar using the test-negative design. The median age of study subjects was 32-34 years, at least half were male, and they came from diverse countries (Table 2). Study samples were broadly representative of Qatar’s demographic distributions.42,74
Figure 6.

Flowchart describing the population selection process to estimate effectiveness of prior infection in preventing reinfection using the test-negative study design, using data from Qatar, March 8 to April 21, 2021. Individuals with a polymerase chain reaction (PCR)-confirmed infection with severe acute respiratory syndrome coronavirus 2 (SARS-CoV-2) Alpha or Beta variant were exact matched on a 1:1 ratio by sex, 10-year age group, nationality, and PCR test calendar week to the first eligible PCR-negative individual. Prior infection records were retrieved for all matched individuals.
Table 2.
Demographic characteristics of subjects in the samples used to estimate effectiveness of prior infection in preventing reinfection using the test-negative study design, Qatar, 2021
|
Cases
a
(PCR-confirmed infection with the Alpha variant) |
Controls
a
(PCR-negative) |
Cases
a
(PCR-confirmed infection with the Beta variant) |
Controls
a
(PCR-negative) |
SMD b | ||||||
|---|---|---|---|---|---|---|---|---|---|---|
| n = 4645 | n = 4645 | n = 13 753 | n = 13 753 | |||||||
| Characteristic | No. | % | No. | % | SMD b | No. | % | No. | % | |
| Age, years | 33 (25-40)c | 32 (24-40)c | 0.01d | 34 (27-40)c | 33 (27-40)c | 0.01d | ||||
| Age category, years | 0.00 | 0.00 | ||||||||
| <20 years | 868 | 18.7 | 868 | 18.7 | 1767 | 12.9 | 1767 | 12.9 | ||
| 20-29 years | 923 | 19.9 | 923 | 19.9 | 2931 | 21.3 | 2931 | 21.3 | ||
| 30-39 years | 1648 | 35.5 | 1648 | 35.5 | 5213 | 37.9 | 5213 | 37.9 | ||
| 40-49 years | 871 | 18.8 | 871 | 18.8 | 2877 | 20.9 | 2877 | 20.9 | ||
| 50-59 years | 272 | 5.9 | 272 | 5.9 | 797 | 5.8 | 797 | 5.8 | ||
| 60-69 years | 53 | 1.1 | 53 | 1.1 | 132 | 1.0 | 132 | 1.0 | ||
| ≥70 years | 10 | 0.2 | 10 | 0.2 | 36 | 0.3 | 36 | 0.3 | ||
| Sex | 0.00 | 0.00 | ||||||||
| Male | 2339 | 50.4 | 2339 | 50.4 | 9467 | 68.8 | 9467 | 68.8 | ||
| Female | 2306 | 49.6 | 2306 | 49.6 | 4286 | 31.2 | 4286 | 31.2 | ||
| Nationalitye | 0.00 | 0.00 | ||||||||
| Bangladeshi | 235 | 5.1 | 235 | 5.1 | 1334 | 9.7 | 1334 | 9.7 | ||
| Egyptian | 358 | 7.7 | 358 | 7.7 | 990 | 7.2 | 990 | 7.2 | ||
| Filipino | 764 | 16.5 | 764 | 16.5 | 1610 | 11.7 | 1610 | 11.7 | ||
| Indian | 789 | 17.0 | 789 | 17.0 | 3481 | 25.3 | 3481 | 25.3 | ||
| Nepalese | 170 | 3.7 | 170 | 3.7 | 1283 | 9.3 | 1283 | 9.3 | ||
| Pakistani | 192 | 4.1 | 192 | 4.1 | 542 | 3.9 | 542 | 3.9 | ||
| Qatari | 762 | 16.4 | 762 | 16.4 | 1288 | 9.4 | 1288 | 9.4 | ||
| Sri Lankan | 125 | 2.7 | 125 | 2.7 | 538 | 3.9 | 538 | 3.9 | ||
| Sudanese | 166 | 3.6 | 166 | 3.6 | 442 | 3.2 | 442 | 3.2 | ||
| Other nationalitiesf | 1084 | 23.3 | 1084 | 23.3 | 2245 | 16.3 | 2245 | 16.3 | ||
| Prior infectiong | 0.31 | 0.28 | ||||||||
| No prior infection | 4638 | 99.8 | 4413 | 95.0 | 13 629 | 99.1 | 12 938 | 94.1 | ||
| >90 days | 7 | 0.2 | 232 | 5.0 | 124 | 0.9 | 815 | 5.9 | ||
Abbreviations: PCR, polymerase chain reaction; SMD, standardized mean difference.
aCases and controls were matched 1-to-1 by sex, 10-year age group, nationality, and calendar week of PCR test.
bSMD is the difference in the mean of a covariate between groups divided by the pooled standard deviation. An SMD < 0.1 indicates adequate matching.
cValues are expressed as median (interquartile range).
dSMD is the mean difference between groups divided by the pooled standard deviation.
eNationalities were chosen to represent the most populous groups in Qatar.
fThese comprise 61 other nationalities in Qatar in the Alpha variant analysis and 78 other nationalities in the Beta variant analysis.
gGiven our interest in quantifying differentials in the odds of exposure to prior infection between cases and controls, this variable was not included as a matching factor.
Among the 4645 Alpha cases (PCR-positive persons), 7 had a record of prior infection, compared with 232 among their matched controls (PCR-negative persons).  against Alpha was estimated at 97.0% (95% CI, 93.6-98.6). Among the 13 753 Beta cases, 124 had a record of prior infection, compared with 815 among their matched controls.
  against Beta was estimated at 85.5% (95% CI, 82.4-88.1).
There were 239 discordant pairs and 4406 concordant pairs in the Alpha analysis and 925 discordant pairs and 12 828 concordant pairs in the Beta analysis. The analyses were conducted on large samples of paired cases and controls and should not be affected by bias due to small samples or sparse data.75
During the study duration (March 8 to April 21, 2021), we conducted 2 earlier matched cohort studies to estimate  for Alpha and for Beta.4 For Alpha, cohort-study estimates were 97.6% (95% CI, 95.7-98.7) and 96.4% (95% CI, 92.1-98.3).4 For Beta, cohort-study estimates were 92.3% (95% CI, 90.3-93.8) and 86.4% (95% CI, 82.5-89.5).4
Power analysis
The above application for Alpha and Beta protections demonstrates an actual empirical application, but the number of cases may not be sufficient in other applications to provide a precise and meaningful estimate for  . Therefore, we conducted a power analysis to provide an estimate of the sample size necessary to apply this method using Power and Sample Size, version 3.1.2,76 following Dupont principles.77
Assuming the proportion of controls with prior infection at 25% and a high correlation between cases and controls of 0.5,78 an estimated sample size of 71 individuals for each of cases and controls is needed to detect an odds ratio of 0.2, that is, assuming  of 80%, at 2-sided type I error probability of 5% and power of 80%.
Assuming an attrition of 80% due to exclusion for study ineligibility and an additional attrition of 5% from loss to matching, as informed by the above applications for Alpha and Beta protections, the required sample size would be 374 for each cases and controls. If  was 50% instead (an odds ratio of 0.5), the required sample size would be 1474 for each of cases and controls.
Discussion
This study’s results show that the test-negative design can be used to generate rigorous estimates for protection afforded by prior infection against reinfection, even though most prior infections are undocumented. Estimates were robust despite several forms of potential bias, and even under rather extreme assumptions for these biases. The test-negative design was also applied to Qatar’s routine PCR testing data, and results were validated by comparing test-negative estimates with those generated using conventional cohort study designs.4 Application of the test-negative design should be feasible in different countries as long as there are databases for infection testing that are of reasonable quality and that can be linked to documented prior infection status (and preferably to vaccination status). Such databases are available and have been used extensively in vaccine effectiveness studies using the test-negative design, such as for SARS-CoV-2 infection,17-22,33 and recently to estimate  for the Omicron variant.79 This is a key strength for test-negative studies in that such studies are typically implemented on full eligible routine datasets where the large sample sizes optimize the statistical precision of the estimates.
Of the considered biases, only misclassification of prior infection status could have a large effect on  estimation, but mainly where more than 50% of the population already had a prior infection. This situation is not likely to have been reached for SARS-CoV-2 infection before the introduction the Omicron variant in most countries.56 Even in such situations, the direction (and magnitude) of bias is known; it underestimates
  . Therefore, the test-negative design can still provide a lower bound for the true
  , which may be sufficient to inform public health decision making, such as in relation to differential application of restrictions according to prior infection status, timing of vaccination following documented infection, and protocols for isolation and quarantine. Thus, this bias may not restrict the utility of this method.
The test-negative study design has strengths that conventional designs may lack. Cohort study designs can be affected by bias resulting from different infection testing frequencies in the different arms of the study. This bias does not affect the test-negative design, as it uses only those who are tested. An example can be seen in comparing the results of the test-negative design with the results of our earlier cohort design.4 In the cohort design, adjustment for testing frequency reduced  from 97.6% (95% CI, 95.7-98.7) to 95.8% (95% CI, 92.5-97.7) for Alpha,4 very similar to the test-negative estimate of 97.0% (95% CI, 93.6-98.6). Similarly for Beta, adjustment for testing frequency reduced
  from 92.3% (95% CI, 90.3-93.8) to 86.5% (95% CI, 83.0-89.2),4 very similar to the test-negative estimate of 85.5% (95% CI, 82.4-88.1). Accordingly, the test-negative design may provide a more representative estimate than the cohort design.
The test-negative design may also be preferable to the cohort design for other reasons. Cohort designs rely on cohorts that may not be strictly comparable, and it may not be possible to control for all differences in risk of exposure to the infection by matching and analysis adjustments. For example, in our earlier cohort study,4 we compared those who had a record of a prior PCR-confirmed infection with those who had an antibody-negative test, but these groups may differ in ways that cannot be controlled. Meanwhile, the test-negative design is perhaps less susceptible to such differences, as cases and controls are selected to meet certain clinical criteria that presumably imply the same health care–seeking behavior. That said, use of administrative databases may still be prone to bias due to unmeasured differences in health care–seeking behavior. Last, while the test-negative design can be biased by misclassification of prior infection, the cohort design is perhaps more affected by this bias. The odds ratio metric in the test-negative design is less affected by this bias than the relative risk, incidence rate ratio, or hazard ratio metrics in the cohort design.
With regard to limitations, we used a heuristic approach to motivate the test-negative design through mathematical modeling, but this approach may not exactly match an actual empirical test-negative-design application. The ultimate validity and utility of this design rests on actual validation studies, including comparison with results of other conventional designs. We provided 2 such validation studies in the present study for each of the Alpha and Beta variants. Considering the demonstrated utility of this design in providing timely results in emergent situations during the COVID-19 pandemic,53,79-81 this study should be seen as a call for further investigation and methodological development to enhance this design and its applications.
Specific forms of bias were investigated, but other sources of bias are possible, and these may also depend on the database being analyzed.25 There is already a volume of literature investigating other forms of bias for the test-negative design in the context of vaccine effectiveness estimation,15,16,27-32 some of which may also apply in the context of  estimation, such as for issues relating to testing and applicability of this design for different testing modalities.25 More studies are needed to investigate different methodological aspects of this design and other sources of bias, such as the uncertainty/power to estimate effect and validity of the assumption of proportional random sampling of the different epidemiologic classes/compartments.
While this study demonstrated use of the test-negative design to estimate  , other factors need to be considered in actual application. For instance, the algorithm for matching67,82 needs to be developed with knowledge of the local epidemiology to ensure that matching can effectively control differences in the risk of exposure to the infection. Of note, with Qatar’s young population, the estimates presented here for
  may not be generalizable to other countries where elderly citizens constitute a larger proportion of the total population.
The models used to investigate applicability of the test-negative design were not structured by age, nor by infection type and severity. However, the sensitivity analysis that used the real-world Qatar model, with its detailed stratifications, confirmed the same findings as those of the study’s parsimonious models. Moreover, the 3 other sensitivity analyses confirmed the applicability of the test-negative design regardless of the value of  , irrespective of whether incidence is used instead of instantaneous prevalence in the estimation, and whether or not there was full misclassification bias of those latently infected.
In conclusion, the test-negative design offers a feasible and robust method to estimate protection of prior infection in preventing reinfection. This method should be considered to provide rapid, rigorous estimates of protection offered by prior infection for different variants of SARS-CoV-2, including those that emerged recently.
Supplementary material
Supplementary material is available at American Journal of Epidemiology online.
Acknowledgments
We acknowledge the many dedicated individuals at Hamad Medical Corporation, the Ministry of Public Health, the Primary Health Care Corporation, the Qatar Biobank, Sidra Medicine, and Weill Cornell Medicine—Qatar for their diligent efforts and contributions to make this study possible.
Funding
H.H.A. acknowledges the support of Qatar University collaborative grant QUCG-CAS-23/24-114 and Marubeni grant M-QJRC-2020-5. The authors are grateful for support from the Biomedical Research Program and the Biostatistics, Epidemiology, and Biomathematics Research Core, at Weill Cornell Medicine–Qatar, as well as for support provided by the Ministry of Public Health, Hamad Medical Corporation, and Sidra Medicine. The authors are also grateful for the Qatar Genome Programme and Qatar University Biomedical Research Center for institutional support for the reagents needed for the viral genome sequencing. The developed mathematical models were made possible thanks to modeling infrastructure developed through National Priorities Research Program (NPRP) grant number 9-040-3-008 (PI: L.J.A.) and NPRP grant number 12S-0216-190094 (PI: L.J.A.) from the Qatar National Research Fund (a member of Qatar Foundation; https://www.qnrf.org). Open Access funding provided by the Qatar National Library.
Conflict of interest
A.A.B. has received institutional grant funding from Gilead Sciences unrelated to the work presented in this paper. The other authors declare no conflicts of interest.
Disclaimer
The statements made herein are solely the responsibility of the authors. The funders had no role in study design, data collection and analysis, decision to publish, or preparation of the manuscript.
Data availability
The dataset of this study is a property of the Qatar Ministry of Public Health that was provided to the researchers through a restricted-access agreement that prevents sharing the dataset with a third party or publicly. The data are available under restricted access for preservation of confidentiality of patient data. Access can be obtained through a direct application for data access to Her Excellency the Minister of Public Health (https://www.moph.gov.qa/english/OurServices/eservices/Pages/Governmental-Health-Communication-Center.aspx). The raw data are protected and are not available due to data privacy laws. Aggregate data are available within the manuscript and its Supplementary Material. The models’ MATLAB codes can be found at the following URL: https://github.com/HousseinAyoub/Estimating-protection-afforded-by-prior-infection-in-preventing-reinfection.git
Supplementary Material
Contributor Information
Houssein H Ayoub, Mathematics Program, Department of Mathematics and Statistics, College of Arts and Sciences, Qatar University, Doha, Qatar.
Milan Tomy, Mathematics Program, Department of Mathematics and Statistics, College of Arts and Sciences, Qatar University, Doha, Qatar; Infectious Disease Epidemiology Group, Weill Cornell Medicine–Qatar, Cornell University, Doha, Qatar; World Health Organization Collaborating Centre for Disease Epidemiology Analytics on HIV/AIDS, Sexually Transmitted Infections, and Viral Hepatitis, Weill Cornell Medicine–Qatar, Cornell University, Qatar Foundation–Education City, Doha, Qatar.
Hiam Chemaitelly, Infectious Disease Epidemiology Group, Weill Cornell Medicine–Qatar, Cornell University, Doha, Qatar; World Health Organization Collaborating Centre for Disease Epidemiology Analytics on HIV/AIDS, Sexually Transmitted Infections, and Viral Hepatitis, Weill Cornell Medicine–Qatar, Cornell University, Qatar Foundation–Education City, Doha, Qatar; Department of Population Health Sciences, Weill Cornell Medicine, Cornell University, New York, NY 10065, United States.
Heba N Altarawneh, Infectious Disease Epidemiology Group, Weill Cornell Medicine–Qatar, Cornell University, Doha, Qatar; World Health Organization Collaborating Centre for Disease Epidemiology Analytics on HIV/AIDS, Sexually Transmitted Infections, and Viral Hepatitis, Weill Cornell Medicine–Qatar, Cornell University, Qatar Foundation–Education City, Doha, Qatar; Department of Population Health Sciences, Weill Cornell Medicine, Cornell University, New York, NY 10065, United States.
Peter Coyle, Hamad Medical Corporation, Doha, Qatar; Biomedical Research Center, Member of QU Health, Qatar University, Doha, Qatar; Wellcome-Wolfson Institute for Experimental Medicine, Queens University, Belfast BT9 7BL, United Kingdom.
Patrick Tang, Department of Pathology, Sidra Medicine, Doha, Qatar.
Mohammad R Hasan, Department of Pathology, Sidra Medicine, Doha, Qatar.
Zaina Al Kanaani, Hamad Medical Corporation, Doha, Qatar.
Einas Al Kuwari, Hamad Medical Corporation, Doha, Qatar.
Adeel A Butt, Department of Population Health Sciences, Weill Cornell Medicine, Cornell University, New York, NY 10065, United States; Hamad Medical Corporation, Doha, Qatar.
Andrew Jeremijenko, Hamad Medical Corporation, Doha, Qatar.
Anvar Hassan Kaleeckal, Hamad Medical Corporation, Doha, Qatar.
Ali Nizar Latif, Hamad Medical Corporation, Doha, Qatar.
Riyazuddin Mohammad Shaik, Hamad Medical Corporation, Doha, Qatar.
Gheyath K Nasrallah, Biomedical Research Center, Member of QU Health, Qatar University, Doha, Qatar; Department of Biomedical Science, College of Health Sciences, Member of QU Health, Qatar University, Doha, Qatar.
Fatiha M Benslimane, Biomedical Research Center, Member of QU Health, Qatar University, Doha, Qatar; Department of Biomedical Science, College of Health Sciences, Member of QU Health, Qatar University, Doha, Qatar.
Hebah A Al Khatib, Department of Biomedical Science, College of Health Sciences, Member of QU Health, Qatar University, Doha, Qatar.
Hadi M Yassine, Biomedical Research Center, Member of QU Health, Qatar University, Doha, Qatar; Department of Biomedical Science, College of Health Sciences, Member of QU Health, Qatar University, Doha, Qatar.
Mohamed G Al Kuwari, Primary Health Care Corporation, Doha, Qatar.
Hamad Eid Al Romaihi, Ministry of Public Health, Doha, Qatar.
Hanan F Abdul-Rahim, Department of Public Health, College of Health Sciences, Member of QU Health, Qatar University, Doha, Qatar.
Mohamed H Al-Thani, Ministry of Public Health, Doha, Qatar.
Abdullatif Al Khal, Hamad Medical Corporation, Doha, Qatar.
Roberto Bertollini, Ministry of Public Health, Doha, Qatar.
Laith J Abu-Raddad, Infectious Disease Epidemiology Group, Weill Cornell Medicine–Qatar, Cornell University, Doha, Qatar; World Health Organization Collaborating Centre for Disease Epidemiology Analytics on HIV/AIDS, Sexually Transmitted Infections, and Viral Hepatitis, Weill Cornell Medicine–Qatar, Cornell University, Qatar Foundation–Education City, Doha, Qatar; Department of Population Health Sciences, Weill Cornell Medicine, Cornell University, New York, NY 10065, United States; Department of Public Health, College of Health Sciences, Member of QU Health, Qatar University, Doha, Qatar.
References
- 1. Abu-Raddad LJ, Chemaitelly H, Malek JA, et al. Assessment of the risk of severe acute respiratory syndrome coronavirus 2 (SARS-CoV-2) reinfection in an intense reexposure setting. Clin Infect Dis. 2021;73(7):e1830-e1840. 10.1093/cid/ciaa1846 [DOI] [PMC free article] [PubMed] [Google Scholar]
- 2. Abu-Raddad LJ, Chemaitelly H, Coyle P, et al. SARS-CoV-2 antibody-positivity protects against reinfection for at least seven months with 95% efficacy. EClinicalMedicine. 2021;35:100861. 10.1016/j.eclinm.2021.100861 [DOI] [PMC free article] [PubMed] [Google Scholar]
- 3. Abu-Raddad LJ, Chemaitelly H, Ayoub HH, et al. Introduction and expansion of the SARS-CoV-2 B.1.1.7 variant and reinfections in Qatar: a nationally representative cohort study. PLoS Med. 2021;18(12):e1003879. 10.1371/journal.pmed.1003879 [DOI] [PMC free article] [PubMed] [Google Scholar]
- 4. Chemaitelly H, Bertollini R, Abu-Raddad LJ, et al. Efficacy of natural immunity against SARS-CoV-2 reinfection with the Beta variant. N Engl J Med. 2021;385(27):2585-2586. 10.1056/NEJMc2110300 [DOI] [PMC free article] [PubMed] [Google Scholar]
- 5. Hansen CH, Michlmayr D, Gubbels SM, et al. Assessment of protection against reinfection with SARS-CoV-2 among 4 million PCR-tested individuals in Denmark in 2020: a population-level observational study. Lancet. 2021;397(10280):1204-1212. 10.1016/S0140-6736(21)00575-4 [DOI] [PMC free article] [PubMed] [Google Scholar]
- 6. Kojima N, Shrestha NK, Klausner JD. A systematic review of the protective effect of prior SARS-CoV-2 infection on repeat infection. Eval Health Prof. 2021;44(4):327-332. 10.1177/01632787211047932 [DOI] [PMC free article] [PubMed] [Google Scholar]
- 7. Leidi A, Koegler F, Dumont R, et al. Risk of reinfection after seroconversion to SARS-CoV-2: a population-based propensity-score matched cohort study. Clin Infect Dis. 2021;ciab495. [DOI] [PMC free article] [PubMed] [Google Scholar]
- 8. Lumley SF, O'Donnell D, Stoesser NE, et al. Antibody status and incidence of SARS-CoV-2 infection in health care workers. N Engl J Med. 2021;384(6):533-540. 10.1056/NEJMoa2034545 [DOI] [PMC free article] [PubMed] [Google Scholar]
- 9. Pilz S, Chakeri A, Ioannidis JPA, et al. SARS-CoV-2 re-infection risk in Austria. Eur J Clin Invest. 2021;51(4):e13520. 10.1111/eci.13520 [DOI] [PMC free article] [PubMed] [Google Scholar]
- 10. Angulo FJ, Finelli L, Swerdlow DL. Estimation of US SARS-CoV-2 infections, symptomatic infections, hospitalizations, and deaths using seroprevalence surveys. JAMA Netw Open. 2021;4(1):e2033706. 10.1001/jamanetworkopen.2020.33706 [DOI] [PMC free article] [PubMed] [Google Scholar]
- 11. Jones JM, Stone M, Sulaeman H, et al. Estimated US infection- and vaccine-induced SARS-CoV-2 Seroprevalence based on blood donations, July 2020-May 2021. JAMA. 2021;326(14):1400-1409. 10.1001/jama.2021.15161 [DOI] [PMC free article] [PubMed] [Google Scholar]
- 12. Ayoub HH, Chemaitelly H, Seedat S, et al. Mathematical modeling of the SARS-CoV-2 epidemic in Qatar and its impact on the national response to COVID-19. J Glob Health. 2021;11:05005. 10.7189/jogh.11.05005 [DOI] [PMC free article] [PubMed] [Google Scholar]
- 13. Kahn R, Schrag SJ, Verani JR, et al. Identifying and alleviating bias due to differential depletion of susceptible people in postmarketing evaluations of COVID-19 vaccines. Am J Epidemiol. 2022;191(5):800-811. 10.1093/aje/kwac015 [DOI] [PMC free article] [PubMed] [Google Scholar]
- 14. World Health Organization . Tracking SARS-CoV-2 variants. 2021. Accessed June 5, 2021. https://www.who.int/en/activities/tracking-SARS-CoV-2-variants/
- 15. Jackson ML, Nelson JC. The test-negative design for estimating influenza vaccine effectiveness. Vaccine. 2013;31(17):2165-2168. 10.1016/j.vaccine.2013.02.053 [DOI] [PubMed] [Google Scholar]
- 16. Verani JR, Baqui AH, Broome CV, et al. Case-control vaccine effectiveness studies: preparation, design, and enrollment of cases and controls. Vaccine. 2017;35(25):3295-3302. 10.1016/j.vaccine.2017.04.037 [DOI] [PMC free article] [PubMed] [Google Scholar]
- 17. Lopez Bernal J, Andrews N, Gower C, et al. Effectiveness of Covid-19 vaccines against the B.1.617.2 (Delta) Variant. N Engl J Med. 2021;385(7):585-594. 10.1056/NEJMoa2108891 [DOI] [PMC free article] [PubMed] [Google Scholar]
- 18. Sheikh A, McMenamin J, Taylor B, et al. SARS-CoV-2 Delta VOC in Scotland: demographics, risk of hospital admission, and vaccine effectiveness. The Lancet. 2021;397(10293):2461-2462. 10.1016/S0140-6736(21)01358-1 [DOI] [PMC free article] [PubMed] [Google Scholar]
- 19. Nasreen S, Chung H, He S, et al. Effectiveness of COVID-19 vaccines against variants of concern, Canada. medRxiv. 10.1038/s41564-021-01053-0, February 7, 2022, preprint: not peer reviewed. [DOI] [Google Scholar]
- 20. Dean NE, Hogan JW, Schnitzer ME. Covid-19 vaccine effectiveness and the test-negative design. N Engl J Med. 2021;385(15):1431-1433. 10.1056/NEJMe2113151 [DOI] [PMC free article] [PubMed] [Google Scholar]
- 21. Abu-Raddad LJ, Chemaitelly H, Butt AA, et al. Effectiveness of the BNT162b2 Covid-19 vaccine against the B.1.1.7 and B.1.351 variants. N Engl J Med. 2021;385(2):187-189. 10.1056/NEJMc2104974 [DOI] [PMC free article] [PubMed] [Google Scholar]
- 22. Chemaitelly H, Yassine HM, Benslimane FM, et al. mRNA-1273 COVID-19 vaccine effectiveness against the B.1.1.7 and B.1.351 variants and severe COVID-19 disease in Qatar. Nat Med. 2021;27(9):1614-1621. 10.1038/s41591-021-01446-y [DOI] [PubMed] [Google Scholar]
- 23. National Project of Surveillance for Variants of Concern and Viral Genome Sequencing . Qatar viral genome sequencing data. Data on randomly collected samples. 2021. Accessed December 4, 2023. https://www.gisaid.org/phylodynamics/global/nextstrain/
- 24. Hasan MR, Kalikiri MKR, Mirza F, et al. Real-time SARS-CoV-2 genotyping by high-throughput multiplex PCR reveals the epidemiology of the variants of concern in Qatar. Int J Infect Dis. 2021;112:52-54. 10.1016/j.ijid.2021.09.006 [DOI] [PubMed] [Google Scholar]
- 25. Chemaitelly H, Tang P, Hasan MR, et al. Waning of BNT162b2 vaccine protection against SARS-CoV-2 infection in Qatar. N Engl J Med. 2021;385(24):e83. 10.1056/NEJMoa2114114 [DOI] [PMC free article] [PubMed] [Google Scholar]
- 26. Benslimane FM, Khatib HA, Jamal O, et al. One year of SARS-CoV-2: genomic characterization of COVID-19 outbreak in Qatar. Front Cell Infect Microbiol. 2021;11:768883. 10.3389/fcimb.2021.768883 [DOI] [PMC free article] [PubMed] [Google Scholar]
- 27. Foppa IM, Haber M, Ferdinands JM, et al. The case test-negative design for studies of the effectiveness of influenza vaccine. Vaccine. 2013;31(30):3104-3109. 10.1016/j.vaccine.2013.04.026 [DOI] [PubMed] [Google Scholar]
- 28. Sullivan SG, Feng S, Cowling BJ. Potential of the test-negative design for measuring influenza vaccine effectiveness: a systematic review. Expert Rev Vaccines. 2014;13(12):1571-1591. 10.1586/14760584.2014.966695 [DOI] [PMC free article] [PubMed] [Google Scholar]
- 29. Jackson ML, Rothman KJ. Effects of imperfect test sensitivity and specificity on observational studies of influenza vaccine effectiveness. Vaccine. 2015;33(11):1313-1316. 10.1016/j.vaccine.2015.01.069 [DOI] [PMC free article] [PubMed] [Google Scholar]
- 30. Lewnard JA, Tedijanto C, Cowling BJ, et al. Measurement of vaccine direct effects under the test-negative design. Am J Epidemiol. 2018;187(12):2686-2697. 10.1093/aje/kwy163 [DOI] [PMC free article] [PubMed] [Google Scholar]
- 31. Sullivan SG, Tchetgen Tchetgen EJ, Cowling BJ. Theoretical basis of the test-negative study design for assessment of influenza vaccine effectiveness. Am J Epidemiol. 2016;184(5):345-353. 10.1093/aje/kww064 [DOI] [PMC free article] [PubMed] [Google Scholar]
- 32. Lipsitch M, Jha A, Simonsen L. Observational studies and the difficult quest for causality: lessons from vaccine effectiveness and impact studies. Int J Epidemiol. 2016;45(6):2060-2074. 10.1093/ije/dyw124 [DOI] [PMC free article] [PubMed] [Google Scholar]
- 33. Tang P, Hasan MR, Chemaitelly H, et al. BNT162b2 and mRNA-1273 COVID-19 vaccine effectiveness against the SARS-CoV-2 Delta variant in Qatar. Nat Med. 2021;27(12):2136-2143. 10.1038/s41591-021-01583-4 [DOI] [PubMed] [Google Scholar]
- 34. World Health Organization (WHO) . Living guidance for clinical management of COVID-19. 2021. Accessed February 27, 2023. https://www.who.int/publications/i/item/WHO-2019-nCoV-clinical-2021-2
- 35. World Health Organization (WHO) , International guidelines for certification and classification (coding) of COVID-19 as cause of death. 2020. Accessed February 27, 2023. https://www.who.int/publications/m/item/international-guidelines-for-certification-and-classification-(coding)-of-covid-19-as-cause-of-death
- 36. Ayoub HH, Chemaitelly H, Makhoul M, et al. Epidemiological impact of prioritising SARS-CoV-2 vaccination by antibody status: mathematical modelling analyses. BMJ Innov. 2021;7(2):327-336. 10.1136/bmjinnov-2021-000677 [DOI] [PubMed] [Google Scholar]
- 37. Ayoub HH, Chemaitelly H, Mumtaz GR, et al. Characterizing key attributes of COVID-19 transmission dynamics in China's original outbreak: model-based estimations. Glob Epidemiol. 2020;2:100042. 10.1016/j.gloepi.2020.100042 [DOI] [PMC free article] [PubMed] [Google Scholar]
- 38. Seedat S, Chemaitelly H, Ayoub HH, et al. SARS-CoV-2 infection hospitalization, severity, criticality, and fatality rates in Qatar. Sci Rep. 2021;11(1):18182. 10.1038/s41598-021-97606-8 [DOI] [PMC free article] [PubMed] [Google Scholar]
- 39. Mumtaz GR, Jardali F, Jabbour M, et al. Modeling the impact of COVID-19 vaccination in Lebanon: a call to speed-up vaccine roll out. Vaccines (Basel). 2021;9(7):697. 10.3390/vaccines9070697 [DOI] [PMC free article] [PubMed] [Google Scholar]
- 40. Makhoul M, Ayoub HH, Chemaitelly H, et al. Epidemiological impact of SARS-CoV-2 vaccination: mathematical modeling analyses. Vaccines (Basel). 2020;8(4):668. 10.3390/vaccines8040668 [DOI] [PMC free article] [PubMed] [Google Scholar]
- 41. Makhoul M, Chemaitelly H, Ayoub HH, et al. Epidemiological differences in the impact of COVID-19 vaccination in the United States and China. Vaccines (Basel). 2021;9(3):223. 10.3390/vaccines9030223 [DOI] [PMC free article] [PubMed] [Google Scholar]
- 42. Abu-Raddad LJ, Chemaitelly H, Ayoub HH, et al. Characterizing the Qatar advanced-phase SARS-CoV-2 epidemic. Sci Rep. 2021;11(1):6233. 10.1038/s41598-021-85428-7 [DOI] [PMC free article] [PubMed] [Google Scholar]
- 43. Ray GT, Lewis N, Klein NP, et al. Depletion-of-susceptibles bias in analyses of intra-season waning of influenza vaccine effectiveness. Clin Infect Dis. 2020;70(7):1484-1486. 10.1093/cid/ciz706 [DOI] [PMC free article] [PubMed] [Google Scholar]
- 44. Halloran ME, Haber M, Longini IM Jr. Interpretation and estimation of vaccine efficacy under heterogeneity. Am J Epidemiol. 1992;136(3):328-343. 10.1093/oxfordjournals.aje.a116498 [DOI] [PubMed] [Google Scholar]
- 45. Halloran ME, Haber M, Longini IM Jr, et al. Direct and indirect effects in vaccine efficacy and effectiveness. Am J Epidemiol. 1991;133(4):323-331. 10.1093/oxfordjournals.aje.a115884 [DOI] [PubMed] [Google Scholar]
- 46. Yang Y, Sugimoto JD, Halloran ME, et al. The transmissibility and control of pandemic influenza a (H1N1) virus. Science. 2009;326(5953):729-733. 10.1126/science.1177373 [DOI] [PMC free article] [PubMed] [Google Scholar]
- 47. Halloran ME, Longini IM Jr, Nizam A, et al. Containing bioterrorist smallpox. Science. 2002;298(5597):1428-1432. 10.1126/science.1074674 [DOI] [PubMed] [Google Scholar]
- 48. International Vaccine Access Center (IVAC) . VIEW-hub COVID-19 vaccines effectiveness data. Accessed May 5, 2022. https://view-hub.org/covid-19/effectiveness-studies
- 49. The COVID-NMA initiative . COVID-19 vaccine effectiveness on variants of concern. 2022. Accessed May 5, 2022. https://covid-nma.com/vaccines/os_vaccines/
- 50. Feikin DR, Higdon MM, Abu-Raddad LJ, et al. Duration of effectiveness of vaccines against SARS-CoV-2 infection and COVID-19 disease: results of a systematic review and meta-regression. Lancet. 2022;399(10328):924-944. 10.1016/S0140-6736(22)00152-0 [DOI] [PMC free article] [PubMed] [Google Scholar]
- 51. Chemaitelly H, Abu-Raddad LJ. Waning effectiveness of COVID-19 vaccines. Lancet. 2022;399(10327):771-773. 10.1016/S0140-6736(22)00277-X [DOI] [PMC free article] [PubMed] [Google Scholar]
- 52. Abu-Raddad LJ, Chemaitelly H, Bertollini R, et al. Waning mRNA-1273 vaccine effectiveness against SARS-CoV-2 infection in Qatar. N Engl J Med. 2022;386(11):1091-1093. 10.1056/NEJMc2119432 [DOI] [PMC free article] [PubMed] [Google Scholar]
- 53. Altarawneh HN, Chemaitelly H, Ayoub HH, et al. Effects of previous infection and vaccination on symptomatic omicron infections. N Engl J Med. 2022;387(1):21-34. 10.1056/NEJMoa2203965 [DOI] [PMC free article] [PubMed] [Google Scholar]
- 54. Abu-Raddad LJ, Chemaitelly H, Ayoub HH, et al. Association of prior SARS-CoV-2 infection with risk of breakthrough infection following mRNA vaccination in Qatar. JAMA. 2021;326(19):1930-1939. 10.1001/jama.2021.19623 [DOI] [PMC free article] [PubMed] [Google Scholar]
- 55. MathWorks . MATLAB: the Language of Technical Computing. Natick, MA: The MathWorks, Inc.; 2019. [Google Scholar]
- 56. Ayoub HH, Mumtaz GR, Seedat S, et al. Estimates of global SARS-CoV-2 infection exposure, infection morbidity, and infection mortality rates in 2020. Glob Epidemiol. 2021;3:100068. 10.1016/j.gloepi.2021.100068 [DOI] [PMC free article] [PubMed] [Google Scholar]
- 57. Jeremijenko A, Chemaitelly H, Ayoub HH, et al. Herd immunity against severe acute respiratory syndrome coronavirus 2 infection in 10 communities, Qatar. Emerg Infect Dis. 2021;27(5):1343-1352. 10.3201/eid2705.204365 [DOI] [PMC free article] [PubMed] [Google Scholar]
- 58. Al-Thani MH, et al. SARS-CoV-2 infection is at herd immunity in the majority segment of the population of Qatar. Open forum. Infect Dis. 2021;8(8):ofab221. 10.1093/ofid/ofab221 [DOI] [PMC free article] [PubMed] [Google Scholar]
- 59. Coyle PV, Chemaitelly H, Ben Hadj Kacem MA, et al. SARS-CoV-2 seroprevalence in the urban population of Qatar: an analysis of antibody testing on a sample of 112,941 individuals. iScience. 2021;24(6):102646. 10.1016/j.isci.2021.102646 [DOI] [PMC free article] [PubMed] [Google Scholar]
- 60. Goldberg Y, Mandel M, Bar-On YM, et al. Protection and waning of natural and hybrid immunity to SARS-CoV-2. N Engl J Med. 2022;386(23):2201-2212. 10.1056/NEJMoa2118946 [DOI] [PMC free article] [PubMed] [Google Scholar]
- 61. Bsat R, Chemaitelly H, Coyle P, et al. Characterizing the effective reproduction number during the COVID-19 pandemic: insights from Qatar's experience. J Glob Health. 2022;12:05004. 10.7189/jogh.12.05004 [DOI] [PMC free article] [PubMed] [Google Scholar]
- 62. European Centre for Disease Prevention and Control . Rapid increase of a SARS-CoV-2 variant with multiple spike protein mutations observed in the United Kingdom. 2020. Accessed February 10, 2021. https://www.ecdc.europa.eu/sites/default/files/documents/SARS-CoV-2-variant-multiple-spike-protein-mutations-United-Kingdom.pdf
- 63. Galloway SE, Paul P, MacCannell DR, et al. Emergence of SARS-CoV-2 B.1.1.7 lineage - United States, December 29, 2020-January 12, 2021. MMWR Morb Mortal Wkly Rep. 2021;70(3):95-99. 10.15585/mmwr.mm7003e2 [DOI] [PMC free article] [PubMed] [Google Scholar]
- 64. Challen R, et al. Risk of mortality in patients infected with SARS-CoV-2 variant of concern 202012/1: matched cohort study. BMJ. 2021;372:n579. 10.1136/bmj.n579 [DOI] [PMC free article] [PubMed] [Google Scholar]
- 65. Thermo Fisher Scientific , TaqPath™ COVID-19 CE-IVD RT-PCR Kit instructions for use. 2020. Accessed December 2, 2020. https://assets.thermofisher.com/TFS-Assets/LSG/manuals/MAN0019215_TaqPathCOVID-19_CE-IVD_RT-PCR%20Kit_IFU.pdf
- 66. Butt AA, Chemaitelly H, Khal A, et al. SARS-CoV-2 vaccine effectiveness in preventing confirmed infection in pregnant women. J Clin Invest. 2021;131(23):e153662. 10.1172/JCI153662 [DOI] [PMC free article] [PubMed] [Google Scholar]
- 67. Rose S, Laan MJ. Why match? Investigating matched case-control study designs with causal effect estimation. Int J Biostat. 2009;5(1):Article 1. 10.2202/1557-4679.1127 [DOI] [PMC free article] [PubMed] [Google Scholar]
- 68. Abu-Raddad LJ, Chemaitelly H, Yassine HM, et al. Pfizer-BioNTech mRNA BNT162b2 Covid-19 vaccine protection against variants of concern after one versus two doses. J Travel Med. 2021;28(7):taab083. 10.1093/jtm/taab083 [DOI] [PMC free article] [PubMed] [Google Scholar]
- 69. Abu-Raddad LJ, Chemaitelly H, Bertollini R. Effectiveness of mRNA-1273 and BNT162b2 vaccines in Qatar. N Engl J Med. 2022;386(8):799-800. 10.1056/NEJMc2117933 [DOI] [PMC free article] [PubMed] [Google Scholar]
- 70. Jacoby P, Kelly H. Is it necessary to adjust for calendar time in a test negative design?: Responding to: Jackson ML, Nelson JC. The test negative design for estimating influenza vaccine effectiveness. Vaccine 2013;31(April (17)):2165-8. Vaccine. 2014;32(25):2942. 10.1016/j.vaccine.2013.08.048 [DOI] [PubMed] [Google Scholar]
- 71. Pearce N. Analysis of matched case-control studies. BMJ. 2016;352:i969. 10.1136/bmj.i969 [DOI] [PMC free article] [PubMed] [Google Scholar]
- 72. Rothman KJ, Greenland S, Lash TL. Modern Epidemiology. 3rd ed. Philadelphia: Wolters Kluwer Health/Lippincott Williams & Wilkins; 2008. [Google Scholar]
- 73. StataCorp . Stata Statistical Software: Release 17. College Station, TX: StataCorp, LLC.; 2021. [Google Scholar]
- 74. Planning and Statistics Authority-State of Qatar . Qatar monthly statistics. 2020. Accessed May 26, 2020. https://www.psa.gov.qa/en/pages/default.aspx
- 75. Greenland S, Schwartzbaum JA, Finkle WD. Problems due to small samples and sparse data in conditional logistic regression analysis. Am J Epidemiol. 2000;151(5):531-539. 10.1093/oxfordjournals.aje.a010240 [DOI] [PubMed] [Google Scholar]
- 76. Dupont W, Plummer W. PS: Power and Sample Size Calculation 3.1.2. 2023. Accessed on March 7, 2023. https://ps-power-and-sample-size-calculation.software.informer.com/3.1/
- 77. Dupont WD. Power calculations for matched case control studies. Biometrics. 1988;44(4):1157-1168. 10.2307/2531743 [DOI] [PubMed] [Google Scholar]
- 78. Hennessy S, Bilker WB, Berlin JA, et al. Factors influencing the optimal control-to-case ratio in matched case-control studies. Am J Epidemiol. 1999;149(2):195-197. 10.1093/oxfordjournals.aje.a009786 [DOI] [PubMed] [Google Scholar]
- 79. Altarawneh HN, Chemaitelly H, Hasan MR, et al. Protection against the Omicron variant from previous SARS-CoV-2 infection. N Engl J Med. 2022;386(13):1288-1290. 10.1056/NEJMc2200133 [DOI] [PMC free article] [PubMed] [Google Scholar]
- 80. Altarawneh HN, Chemaitelly H, Ayoub HH, et al. Protective effect of previous SARS-CoV-2 infection against omicron BA.4 and BA.5 subvariants. N Engl J Med. 2022;387(17):1620-1622. 10.1056/NEJMc2209306 [DOI] [PMC free article] [PubMed] [Google Scholar]
- 81. Chemaitelly H, Tang P, Coyle P, et al. Protection against reinfection with the omicron BA.2.75 subvariant. N Engl J Med. 2023;388(7):665-667. 10.1056/NEJMc2214114 [DOI] [PMC free article] [PubMed] [Google Scholar]
- 82. Abu-Raddad LJ, Dargham S, Chemaitelly H, et al. COVID-19 risk score as a public health tool to guide targeted testing: a demonstration study in Qatar. PloS One. 2022;17(7):e0271324. 10.1371/journal.pone.0271324 [DOI] [PMC free article] [PubMed] [Google Scholar]
- 83. Li R, Pei S, Chen B, et al. Substantial undocumented infection facilitates the rapid dissemination of novel coronavirus (SARS-CoV2). Science. 2020;368(6490):489-493. [DOI] [PMC free article] [PubMed] [Google Scholar]
- 84. Lauer SA, Grantz KH, Bi Q, et al. The incubation period of coronavirus disease 2019 (COVID-19) from publicly reported confirmed cases: estimation and application. Ann Intern Med. 2020;172(9):577-582. 10.7326/M20-0504 [DOI] [PMC free article] [PubMed] [Google Scholar]
- 85. Zou L, Ruan F, Huang M, et al. SARS-CoV-2 viral load in upper respiratory specimens of infected patients. N Engl J Med. 2020;382(12):1177-1179. 10.1056/NEJMc2001737 [DOI] [PMC free article] [PubMed] [Google Scholar]
- 86. Rothe C, Schunk M, Sothmann P, et al. Transmission of 2019-nCoV infection from an asymptomatic contact in Germany. N Engl J Med. 2020;382(10):970-971. 10.1056/NEJMc2001468 [DOI] [PMC free article] [PubMed] [Google Scholar]
- 87. World Health Organization . Report of the WHO-China Joint Mission on Coronavirus Disease 2019 (COVID-19). 2020. Accessed March 10, 2020. https://www.who.int/docs/default-source/coronaviruse/who-china-joint-mission-on-covid-19-final-report.pdf
- 88. United Nations Department of Economic and Social Affairs Population Dynamics . The 2019 revision of world population prospects. 2020. Accessed March 1, 2020. https://population.un.org/wpp/
Associated Data
This section collects any data citations, data availability statements, or supplementary materials included in this article.
Supplementary Materials
Data Availability Statement
The dataset of this study is a property of the Qatar Ministry of Public Health that was provided to the researchers through a restricted-access agreement that prevents sharing the dataset with a third party or publicly. The data are available under restricted access for preservation of confidentiality of patient data. Access can be obtained through a direct application for data access to Her Excellency the Minister of Public Health (https://www.moph.gov.qa/english/OurServices/eservices/Pages/Governmental-Health-Communication-Center.aspx). The raw data are protected and are not available due to data privacy laws. Aggregate data are available within the manuscript and its Supplementary Material. The models’ MATLAB codes can be found at the following URL: https://github.com/HousseinAyoub/Estimating-protection-afforded-by-prior-infection-in-preventing-reinfection.git