

During the first 2 years of the COVID-19 pandemic, subgroups of people experience deterioration/improvement in pain and depressive symptoms but that revert back to baseline.
Keywords: Low back pain, COVID-19, Cortisol, Trajectories, Depression
Abstract
Introduction: We explored trajectories of pain intensity and depressive symptoms over the first 24 months of the pandemic in people with low back pain.
Methods: This longitudinal study was conducted alongside the Quebec Low Back Pain Study. Starting in April 2020 and every 3 months until July 2022, 291 participants completed an online survey. Group-based trajectory modeling was used to identify patterns of pain intensity and depressive symptoms. Onset outbreak characteristics were then put in relation with trajectory groups using multivariate logistic regression.
Results: The analysis revealed 5 trajectories of pain intensity and depressive symptoms, respectively. The pain trajectories were stable mild (n = 17, 5.8%); stable moderate (n = 103, 35.4%); stable severe (n = 81, 27.8%); U-shape (n = 24, 8.3%), and inverted U-shape (n = 66, 22.7%). The trajectories of depressive symptoms were stable none (n = 58, 19.9%); stable very mild (n = 61, 21.0%); stable mild (n = 85, 29.2%); stable moderate (n = 59, 21.7%); and severe slightly improving (n = 24, 8.3%). Pre-COVID everyday/nearly everyday pain, average pain intensity, and widespread bodily pain were predictive of pain trajectory groups. Higher pre-COVID depression, acute stress disorder, and lockdown measures-related stress were associated with moderate/severe depressive trajectories.
Discussion: Our findings indicated relative stability of pain and depressive symptoms among participants during the COVID-19 pandemic but also highlighted subgroups of people who experienced temporary deterioration or improvement over the first months of the pandemic that then reverted back to baseline levels. Modifiable risk factors were identified before the onset of the pandemic, which could give preventive measures in targeted populations.
1. Introduction
The coronavirus disease-2019 (COVID-19) pandemic and its health, social, and economic consequences initially led to a global impact on mental health compared with pre–COVID-19 levels.37 Lockdowns and restrictions have affected people's lives, including limited social contact, increased global stress, decreased physical activity levels, and negative mental health effects.3 These effects could be amplified in vulnerable populations such as people with chronic low back pain (LBP).3
Studies investigating the worsening of pain severity during COVID-19 among people living with chronic pain were mainly cross-sectional and focused on perceptions of change in pain symptoms.38 Other studies retrospectively reported pre–COVID-19 pain severity.11,33 These studies are limited by recall biases.14,39,40 Moreover, a systematic review showed a rise in the prevalence and intensity of LBP related to COVID-19.34
Only a few longitudinal studies have considered pain characteristics among people with LBP during the pandemic. Studies comparing prepandemic and postpandemic scores point toward the presence of subgroups, with some individuals showing improved pain scores, whereas others showing pain deterioration.1,10 Similarly, unchanged pain, emotional distress, and opioid misuse patterns were found over a 1-year period among adults with chronic pain,27 whereas improvements in pain intensity and depression scores were found in patients with chronic pain when studied over the course of the first 2 years of the pandemic.47 Such understanding of individuals' long-term pain and psychological distress trajectories taking into account prepandemic status, however, is lacking. It is possible that individual's stress response plays a role in the observed interindividual variability in pain trajectories.9,31,43
Surprisingly, although the prevalence of psychological distress among general population during the COVID-19 pandemic has been well covered, biological variables such as cortisol have been less studied.45 Cortisol is a hormone produced by the adrenal glands in response to stress, and it plays a vital role in regulating various physiological processes.46 In general, high levels of cortisol have been associated with increased pain sensitivity and exacerbation of chronic pain conditions.18 Elevated cortisol levels in response to stress have also been associated with major depressive disorder.29
Further research, particularly when pre–COVID-19 data are available, is crucial to understand the longitudinal evolution of onset outbreak and post–COVID-19 pain-related outcomes as well as identifying subgroups of patients with LBP who share similar patterns. Well-designed studies incorporating trajectory analysis can help elucidate how the COVID-19 pandemic has influenced long-term pain outcomes among people living with LBP and their associated factors. The findings of such research can inform clinical practice, public health interventions, and strategies for managing LBP in the aftermath of the pandemic. Hence, this study aimed to (1) identify trajectories of pain intensity and depressive symptoms and (2) determine whether prepandemic and onset outbreak variables (including biological measurements of stress) are associated with trajectory groups.
2. Methodology
STROBE reporting guidelines were followed.
2.1. Recruitment and procedures
This cohort study was conducted using data from the Quebec LBP Study (QLBPS).32 This cohort began recruiting participants with LBP in 11/2018 (clinicaltrials.gov: NCT04791891) through mostly social and mass media, individual and institutions by email list servers, emails to patient organizations and professional societies, unions of workers at risk of LBP, and health care clinics. Participants completed online questionnaires over a 24-month period. In March 2020, 1 month after the declaration of the state of emergency in Quebec, Canada, all active QLBPS cohort participants were invited to participate in a special COVID-19 study, which required them to complete specific questionnaires every 3 months until July 2022 and, if interested, provide hair sample 3 months after the start of the pandemic (June 2020). For this study, eligible participants were adults (≥18 years old) fluent in French, who had LBP for more than 3 months, were active participants in the QLBPS, and completed at least 2 time points of the COVID-19 study questionnaires.
2.2. Measures
2.2.1. Outcomes
Pain intensity was evaluated using the Numeric Rating Scale (NRS-11) from the Canadian Minimum Dataset for Chronic LBP Research, as follows: “In the past 7 days, how would you rate your average lower back pain?”.23 Possible answers range from 0 (no pain) to 10 (worst imaginable pain). Depressive symptoms were evaluated using the Emotional Distress—Depression PROMIS Short-Form 4a,21 which had 4 questions (In the past 7 days, (a) I felt hopeless, (b) I felt helpless, (c) I felt depressed, and (d) I felt hopeless) on a 5-point Likert scale (Cronbach alpha >0.9019). The raw score was computed summing the 4 items and then rescaled into a T-score as per recommendations about this scale.36
2.2.2. Potential predictors
The predictors of trajectory groups included pre–COVID-19 and onset outbreak COVID-19–related variables.
The pre–COVID-19 variables were taken from the latest evaluation (between 0 and 17 months) from the QLBPS (nearest to the COVID-19 study time 0), which was based on the Canadian Minimum Dataset for Chronic LBP Research.2,13,23 This included the following characteristics: LBP status and type; comorbid painful conditions; history of LBP surgical interventions; pain interference (PROMIS Short-Form 4a36); LBP treatments (opioid use, infiltrations/injections, exercise therapy, and psychological counselling); LBP-related workplace absenteeism and compensation benefits; physical function (PROMIS Short-Form 4a36); kinesiophobia (an item from the STarT Back Screening Tool5); catastrophizing (an item from the STarT Back Screening Tool5); LBP-related lawsuits and legal claims; substance abuse; sociodemographic profile (age, sex identity, indigenous membership, racialized groups membership, employment, and education level); cigarette use; and height/weight to calculate body mass index. Sex at birth and administrative region were also available in the QLBPS. Internal consistency for the multi-item measures of the PROMIS is excellent (Cronbach alpha >0.9019).
Onset outbreak COVID-19 pandemic variables were selected by a group of pain researchers, clinicians, and persons with lived experience involved in the QLBPS who developed a questionnaire to measure stressors related to the onset of the pandemic. Acute stress disorder symptoms (19-item Acute Stress Disorder Scale) were collected by asking the extent to which they experienced symptoms of acute stress such as hypervigilance, numbing, arousal, and reactivity when they thought or heard about COVID-19 on a scale from 0 (not at all) to 4 (extremely) (Cronbach alpha >0.90).8 Participants also reported their level of stress by answering the following questions developed for the purpose of this study: “To what extent do you find the COVID-19 pandemic stressful?” and “To what extent do you find the lockdown measures associated with the COVID-19 pandemic stressful?” with possible answers ranging from 0 (not at all) to 10 (extremely).33 In addition, samples measuring 6 centimeters of hair were collected between June 2020 and July 2020 by mail to assess cortisol levels (stress hormone). Samples were taken by the participants themselves with instructions and material sent to them by mail. As hair grows an estimated 1 cm/month, the centimeters closest to the scalp represent the previous month.17 By collecting 6 cm of hair sample, it was possible to produce an estimate of cortisol levels on average in the first 3 months of the pandemic (first 3 cm of hair closest to the scalp—March 2020 to June 2020) and in the 3 months before the onset of the pandemic (next 3 cm of hair—December 2019 to March 2020) to obtain percentage of changes in cortisol levels. Hair samples provide a cumulative measure of cortisol levels, thus eliminating the drastic variations by timing of sample collection using saliva, urine, or serum.24 The hair samples were stored at room temperature in a dark and dry environment. The samples were centrally assayed to determine hair cortisol. Information regarding COVID-19 diagnosis during each evaluation was collected by inquiring, “Have you been diagnosed with COVID-19 (confirmed by a test that was administered by a health care professional)?” Finally, given that the pre–COVID-19 questionnaire was not filled at the same time by all participants (we took their latest QLPBS survey completed from this cohort before the pandemic), a time variable representing the number of months elapsed between the pre–COVID-19 QLPBS survey and the pandemic onset was calculated.
2.3. Statistical analysis
The pain intensity and depression scores collected from time 0 (April 2020) to time 9 (July 2022) were modelled into trajectories using group-based trajectory modelling (GBTM).28 Trajectory groups were then used as categorical dependent variables.
The GBTM determines the form and number of groups that best fit the data and provides a metric for evaluating the precision of group assignments.30 It tolerates missing data well.30 Up to 5 trajectories (groups) and 3 trajectory shapes (linear, quadratic, and cubic) were tested. To select the right number of trajectories, several censored normal (CNORM) models were evaluated. We evaluated up to 5 distinct trajectories and 3 trajectory shapes: (1) linear (straight line), (2) quadratic (U-shaped curve/parabola), and (3) cubic. Each trajectory within the same model could have its own shape. Therefore, there were 3 possible combinations of trajectory shapes for models including only 1 trajectory (eg, 1, 2, or 3), 9 models with 2 trajectories (eg, 11, 22, 33, 12, 13, 23, 21, 31, and 32), 27 models with 3 trajectories (eg, 112, 221, and 333), 81 models with 4 trajectories (eg, 1121, 3221, and 3333), and 243 models with 5 trajectories (eg, order: 11211, 32211, and 33333). In total, GBTM led to the testing of 363 models. For pain and depression, respectively, the models with the lower value (absolute value) of the Bayesian information criterion (BIC), with posterior probabilities >0.70, and with all trajectories being represented by at least 5% of participants were selected.28 The trajectory group profiles were compared using medians and percentages and the 95% confidence interval for multinomial proportions and medians.
Multiple logistic regression models using LASSO with k-fold cross-validation (k = 10) were then applied across the study sample to assess the association between prepandemic and onset outbreak variables (independent variables) and dichotomized pain intensity trajectory groups (dependent variables) while accounting for covariables. In the 4 regression models, pain intensity trajectory groups were dichotomized as follows: (1) stable severe and moderate pain intensity vs other trajectory groups, (2) U-shape pain intensity vs other trajectory groups, (3) inverted U-shape pain intensity vs other trajectory groups, and (4) stable mild pain intensity vs other trajectory groups. As for depressive symptoms trajectory groups, 3 regression models were compared: (1) severe slightly improving and stable moderate depressive symptoms vs other trajectory groups, (2) stable mild depressive symptoms vs other trajectory groups, and (3) stable none and very mild depressive symptoms vs other trajectory groups. Although a broad set of a priori determined variables potentially associated with changes in pain intensity and depressive symptoms were included in the bivariate logistic regression models, only the most valuable variables according to the Least Absolute Shrinkage and Selection Operator (LASSO41) regression were included in the final model. Age, sex, acute stress disorder symptoms, how stressful the COVID-19 pandemic was perceived, how stressful the lockdown measures associated with the COVID-19 pandemic were perceived, and having received a COVID-19 positive screening were forced in the models. Multicollinearity was tested according to variance inflation factors.44
Finally, the comparison of the pre-onset of the COVID-19 pandemic and post-onset of the COVID-19 pandemic percentage of changes in cortisol levels (pg/mg) among the trajectory groups was conducted using medians and their corresponding 95% confidence intervals in a subset of participants. Multiple logistic regression models, which included the pre-onset of the COVID-19 pandemic and post-onset of the COVID-19 pandemic percentage changes in cortisol levels, were adjusted for various factors. These factors encompassed age in years, pre-onset of the COVID-19 pandemic pain intensity, pre-onset of the COVID-19 pandemic depressive symptoms, pre-onset of the COVID-19 pandemic pain interference, pre-onset of the COVID-19 pandemic physical function, scores indicating the perception of the COVID-19 pandemic as stressful, and the perception of lockdown measures associated with the COVID-19 pandemic as stressful during the early pandemic stages, as well as the duration in months between the pre-onset of the COVID-19 pandemic and onset-of-pandemic surveys. All analyses were performed using SAS (version 9.4, Cary, NC).
3. Results
The analysis was conducted among 291 participants living with LBP for at least 3 months (Fig. 1). Percentage of missing data ranged from 0.7% at baseline to 55% at 24-month follow-up, with an average of 36% of missing data per time point. The sample characteristics are shown in Table 1. Mean age at the onset of pandemic was 47.4 ± 12.3 years, and 69.4% were female.
Figure 1.

Flowchart of the study.
Table 1.
Sample characteristics.
| Variables | Category | Frequency | Percent |
|---|---|---|---|
| Pre–COVID-19 variables | |||
| Sex at birth | Missing Female Male |
3 202 86 |
1.0 69.4 29.6 |
| Working (full time or part-time) | No Yes |
257 34 |
88.3 11.7 |
| Low back pain been an ongoing problem over the past 6 mo | Every day or nearly every day in the past 6 mo At least half the days in the past 6 months Less than half the days in the past 6 mo |
132 85 74 |
45.4 29.2 25.4 |
| Low back pain spread down your leg(s) during the past 2 wk | No/not sure Yes |
131 160 |
45.0 55.0 |
| Widespread pain (pain in most of the body) | Missing No Yes |
7 129 155 |
2.4 44.3 53.3 |
| Opioid painkillers | No/not sure Yes |
220 71 |
75.6 24.4 |
| Infiltrations/injections | Missing No/not sure Yes |
2 253 36 |
0.7 86.9 12.4 |
| It is not really safe for a person with my low back problem to be physically active | Agree Disagree |
57 234 |
19.6 80.4 |
| Feeling that my low back pain is terrible and never going to get any better | Agree Disagree |
125 166 |
43.0 57.0 |
| Excess of alcohol or drugs | Missing No Yes |
1 105 185 |
0.3 36.1 63.6 |
| Current smoker | Missing No Yes |
10 234 47 |
3.4 80.4 16.2 |
| Body mass index ≥30 | Missing <30 ≥30 |
7 167 117 |
2.4 57.4 40.2 |
| Score, n | Mean ± SD | Median (IQR) | |
| Pain intensity before COVID-19 | Score from 0 = no pain to 10 = worst imaginable pain) n = 291 | 5.9 ± 1.9 | 6.0 (5.0, 7.0) |
| Depression score before COVID-19 | T score from 41.0 to 79.4, n = 287 | 57.2 ± 9.4 | 58.9 (51.8, 63.9) |
| Pain interference before COVID-19 | T score from 41.6 to 75.6, n = 286 | 61.8 ± 6.7 | 62.5 (57.1, 66.6) |
| Physical function before COVID-19 | T score from 22.9 to 56.9, n = 286 | 41.0 ± 6.5 | 40.4 (36.7, 45.3) |
| Onset-of-pandemic variables | Category | Frequency | Percent |
| Age groups (y) | Missing ≤50 >50 |
10 172 109 |
3.4 59.1 37.5 |
| Score range, n | Mean ± SD | Median (IQR) | |
| Acute stress disorder | Score from 0 to 76, n = 291 | 17.0 ± 13.4 | 14.0 (7.0, 23.0) |
| Finding the COVID-19 pandemic stressful | Score from 0 (not at all) to 10 (extremely), n = 290 | 6.8 ± 2.5 | 7.0 (5.0, 9.0) |
| Finding lockdown measures associated with the COVID-19 pandemic stressful | Score from 0 (not at all) to 10 (extremely), n = 291 | 5.6 ± 2.8 | 6.0 (4.0, 8.0) |
| Cortisol variables | Score range, n | Mean ± SD | Median (IQR) |
| Cortisol before COVID-19 | pg/mg, n = 89 | 34.6 ± 52.6 | 16.3 (10.1, 33.9) |
| Cortisol after COVID-19 | pg/mg, n = 74 | 30.1 ± 70.9 | 11.8 (7.5, 21.0) |
| Percentage of change in cortisol | pg/mg, n = 74 | 37.5 ± 55.9 | 24.5 (−3.0, 58.3) |
| Time-variant variable | Category | Frequency | Percent |
| COVID-19 diagnosis at any point | No Yes |
245 46 |
84.2 15.8 |
| Methodological variable | Score range, n | Mean ± SD | Median (IQR) |
| Months between pre–COVID-19 and onset-of-pandemic surveys | 0–17 mo, n = 289 | 5.2 ± 4.2 | 4.0 (1.0, 9.0) |
IQR, interquartile range.
The best fit for the data keeping at least 5% of participants in the smallest group trajectory was a five-trajectory model for pain (23321) and a five-trajectory model for depressive symptoms (11111). Model fit indices for the best 15 models tested are shown in Appendix A and B, http://links.lww.com/PR9/A234.
The trajectories of pain intensity were (1) stable mild (n = 17, 5.8%, median score = 1.5 (IQR = 1.0, 3.0)); (2) stable moderate (n = 103, 35.4%, median score = 5.0 (IQR = 4.0, 7.0)); stable severe (n = 81, 27.8%, median score = 7.0 (IQR = 7.0, 8.0)); U-shape (n = 24, 8.3%, median score = 4.0 (IQR = 2.0, 5.0)); and inverted U-shape (n = 66, 22.7%, median score = 4.0 (IQR = 3.0, 5.0)). Pain intensity trajectories can be found in Figure 2. Group-based trajectory modelling parameter coefficients are available in Appendix C, http://links.lww.com/PR9/A234 and pain intensity scores by trajectory groups in Appendix D, http://links.lww.com/PR9/A234.
Figure 2.
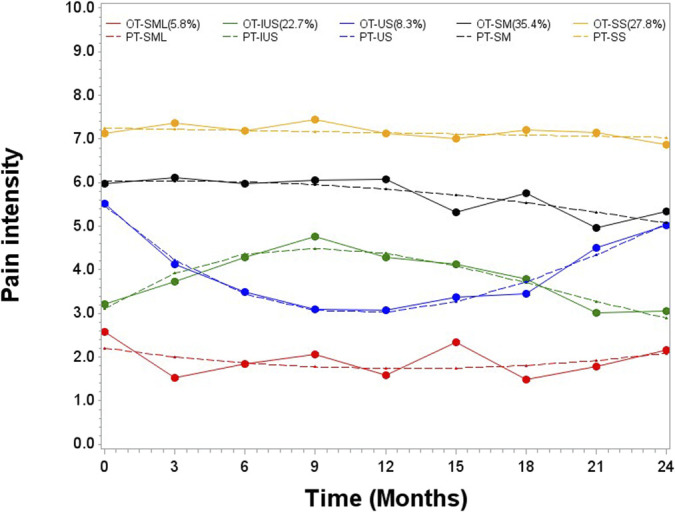
Observed (OT) and predicted (PT) trajectories of pain intensity. IUS, inverted U-shape; S, stable severe; SM, stable moderate; SS, stable slight; US, U-shape.
The trajectories of depressive symptoms were (1) stable none (n = 58, 19.9%, median score 41.0 (IQR = 41.0, 41.0)); (2) stable very mild (n = 61, 21,0%, median score = 51.8 (IQR = 49.0,53.9)); (3) stable mild (n = 85, 29,2%, median score = 57.3 (IQR = 53.9, 58.9)); (4) stable moderate (n = 63, 21.6%, median score = 62.2 (IQR = 58.9, 65.7)); and (5) severe slightly improving (n = 24, 8.3%, median score = 69.4 (IQR = 67.5, 71.2)). The depressive symptoms trajectories can be found in Figure 3. Group-based trajectory modelling parameter coefficients are available in Appendix E, http://links.lww.com/PR9/A234 and depressive symptoms scores by trajectory groups in Appendix F, http://links.lww.com/PR9/A234.
Figure 3.

Observed (OT) and predicted (PT) trajectories of depressive symptoms. S, severe slightly improving; SM, stable moderate; SML, stable mild; SN, stable none; SS, stable very mild.
Descriptively, the stable mild pain intensity trajectory was characterized by the absence of participants working or current smokers, a low percentage of widespread pain and catastrophic thinking, and low average pain intensity before COVID-19. The severe pain trajectory was characterized by a high percentage of people reporting widespread pain and catastrophizing thinking, as well as high average pain intensity, depressive symptoms, and high levels of pain interference before COVID-19 (Table 2), and a low percentage of people reporting pain less than half the days in the past 6 months. In the multivariate logistic regression (Table 3), the stable severe and stable moderate pain intensity trajectories were associated with having pain every day or nearly every day in the past 6 months (OR = 3.3; 95% CI = 1.4, 7.7), widespread pain (OR = 2.7; 95% CI = 4.0, 5.2), and higher pain intensity before COVID-19 (OR = 1.5; 95% CI = 1.3, 1.9) compared with the other 3 trajectories. The U-shape trajectory was associated with less pain interference before COVID-19 (OR = 0.9; 95% CI = 0.8, 0.98) and having COVID-19 at any point (OR = 3.9; 95% CI = 1.3, 11.3) compared with the other 4 trajectories. The inverted U-shape was associated with lower pain intensity before COVID-19 (OR = 0.8; 95% CI = 0.7, 0.9) compared with the other 4 trajectories. The stable slight pain trajectory was associated with pain that radiates down the leg (OR = 0.1; 95% CI = 0.1, 0.7) and widespread pain (OR = 0.1; 95% CI = 0.01, 0.6) compared with the other 4 trajectories. With the exception of having COVID-19 at any point, none of the factors associated with the pandemic were associated with trajectory groups.
Table 2.
Sample characteristics by trajectories of pain intensity.
| Variable | Category | Stable mild | Inverted U-shape | U-shape | Stable moderate | Stable severe | |||||
|---|---|---|---|---|---|---|---|---|---|---|---|
| n | % (95% CI) | n | % (95% CI) | n | % (95% CI) | n | % (95% CI) | n | % (95% CI) | ||
| Pre–COVID-19 variables | |||||||||||
| Sex at birth | Female | 11 | 64.7 (38.3, 84.4) | 51 | 77.3 (64.0, 86.7) | 20 | 83.3 (61.0, 94.1) | 61 | 59.2 (47.4, 70.0) | 59 | 72.8 (60.7, 82.3) |
| Male | 6 | 35.3 (15.6, 61.7) | 15 | 22.7 (13.3, 36.0) | 4 | 16.7 (5.9, 39.0) | 39 | 37.9 (27.3, 49.7) | 22 | 27.2 (17.7, 39.3) | |
| Working (full time or part-time) | No | 17 | 100.0 (81.6, 100.0) | 58 | 87.9 (76.1, 94.3) | 20 | 83.3 (61.0, 94.1) | 90 | 87.4 (78.3, 93.0) | 72 | 88.9 (78.7, 94.5) |
| Yes | 0 | 0 | 8 | 12.1 (5.7, 23.9) | 4 | 16.7 (5.9, 39.0) | 13 | 12.6 (7.0, 21.7) | 9 | 11.1 (5.5, 21.3) | |
| Low back pain been an ongoing problem over the past 6 mo | At least half the days in the past 6 mo | 2 | 11.8 (2.6, 40.2) | 21 | 31.8 (20.0, 46.5) | 10 | 41.7 (21.6, 65.0) | 32 | 31.1 (21.4, 42.7) | 20 | 24.7 (15.2, 37.6) |
| Every day or nearly every day in the past 6 mo | 5 | 29.4 (11.1, 58.1) | 17 | 25.8 (15.2, 40.2) | 4 | 16.7 (5.5, 40.7) | 52 | 50.5 (39.0, 61.9) | 54 | 66.7 (53.4, 77.7) | |
| Less than half the days in the past 6 mo | 10 | 58.8 (31.8, 81.4) | 28 | 42.4 (29.0, 57.0) | 10 | 41.7 (21.6, 65.0) | 19 | 18.4 (11.1, 29.2) | 7 | 8.6 (3.7, 19.1) | |
| Low back pain spread down your leg(s) during the past 2 wk | No/not sure | 15 | 88.2 (61.8, 97.2) | 35 | 53.0 (39.5, 66.1) | 15 | 62.5 (40.1, 80.6) | 39 | 37.9 (28.0, 48.9) | 27 | 33.3 (22.9, 45.7) |
| Yes | 2 | 11.8 (2.8, 38.2) | 31 | 47.0 (33.9, 60.5) | 9 | 37.5 (19.4, 59.9) | 64 | 62.1 (51.1, 72.0) | 54 | 66.7 (54.3, 77.1) | |
| Widespread pain (pain in most of the body) | No | 15 | 88.2 (61.8, 97.2) | 41 | 62.1 (48.3, 74.2) | 15 | 62.5 (38.7, 81.5) | 37 | 35.9 (25.6, 47.7) | 21 | 25.9 (16.1, 38.9) |
| Yes | 2 | 11.8 (2.8, 38.2) | 25 | 37.9 (25.8, 51.7) | 8 | 33.3 (15.6, 57.5) | 63 | 61.2 (49.4, 71.8) | 57 | 70.4 (57.2, 80.8) | |
| Opioid painkillers | No/not sure | 15 | 88.2 (61.8, 97.2) | 60 | 90.9 (79.8, 96.2) | 20 | 83.3 (61.0, 94.1) | 72 | 69.9 (59.0, 78.9) | 53 | 65.4 (53.0, 76.1) |
| Yes | 2 | 11.8 (2.8, 38.2) | 6 | 9.1 (3.8, 20.2) | 4 | 16.7 (5.9, 39.0) | 31 | 30.1 (21.1, 41.0) | 28 | 34.6 (23.9, 47.0) | |
| Infiltrations/injections | No/not sure | 16 | 94.1 (69.0, 99.1) | 61 | 92.4 (81.8, 97.1) | 24 | 100.0 (86.2, 100.0) | 86 | 83.5 (73.0, 90.4) | 66 | 81.5 (69.2, 89.6) |
| Yes | 1 | 5.9 (0.9, 31.0) | 5 | 7.6 (2.9, 18.2) | 0 | 16 | 15.5 (8.8, 25.9) | 14 | 17.3 (9.5, 29.4) | ||
| It is not really safe for a person with my low back problem to be physically active | Agree | 2 | 11.8 (2.8, 38.2) | 8 | 12.1 (5.7, 23.9) | 3 | 12.5 (3.8, 34.2) | 19 | 18.4 (11.4, 28.4) | 25 | 30.9 (20.8, 43.2) |
| Disagree | 15 | 88.2 (61.8, 97.2) | 58 | 87.9 (76.1, 94.3) | 21 | 87.5 (65.8, 96.2) | 84 | 81.6 (71.6, 88.6) | 56 | 69.1 (56.8, 79.2) | |
| Feeling that my low back pain is terrible and never going to get any better | Agree | 1 | 5.9 (0.9, 31.0) | 18 | 27.3 (16.9, 40.8) | 5 | 20.8 (8.2, 43.5) | 51 | 49.5 (38.8, 60.3) | 50 | 61.7 (49.3, 72.8) |
| Disagree | 16 | 94.1 (69.0, 99.1) | 48 | 72.7 (59.2, 83.1) | 19 | 79.2 (56.5, 91.8) | 52 | 50.5 (39.7, 61.2) | 31 | 38.3 (27.2, 50.7) | |
| Excess of alcohol or drugs | No | 5 | 29.4 (11.8, 56.4) | 24 | 36.4 (24.5, 50.2) | 8 | 33.3 (15.6, 57.5) | 39 | 37.9 (28.0, 48.9) | 29 | 35.8 (25.0, 48.2) |
| Yes | 12 | 70.6 (43.6, 88.2) | 42 | 63.6 (49.8, 75.5) | 15 | 62.5 (38.7, 81.5) | 64 | 62.1 (51.1, 72.0) | 52 | 64.2 (51.8, 75.0) | |
| Current smoker | No | 17 | 100.0 (81.6, 100.0) | 58 | 87.9 (75.1, 94.6) | 22 | 91.7 (70.9, 98.0) | 82 | 79.6 (68.7, 87.4) | 55 | 67.9 (54.7, 78.8) |
| Yes | 0 | 0 | 7 | 10.6 (4.5, 23.0) | 2 | 8.3 (2.0, 29.1) | 17 | 16.5 (9.6, 27.0) | 21 | 25.9 (16.1, 38.9) | |
| Body mass index ≥30 | <30 | 14 | 82.4 (55.3, 94.6) | 41 | 62.1 (47.4, 74.9) | 12 | 50.0 (29.2, 70.8) | 61 | 59.2 (47.4, 70.0) | 39 | 48.1 (35.4, 61.1) |
| ≥30 | 3 | 17.6 (5.4, 44.7) | 24 | 36.4 (23.8, 51.1) | 12 | 50.0 (29.2, 70.8) | 38 | 36.9 (26.5, 48.7) | 40 | 49.4 (36.6, 62.3) | |
| Score range | n | Median (95% CI) | n | Median (95% CI) | n | Median (95% CI) | n | Median (95% CI) | n | Median (95% CI) | |
| Pain intensity before COVID-19 | Score from 0 = no pain to 10 = worst imaginable pain | 17 | 3.0 (3.0, 5.0) | 66 | 5.0 (4.0, 5.0) | 24 | 6.0 (5.0, 6.0) | 103 | 6.0 (6.0, 7.0) | 81 | 7.0 (7.0, 8.0) |
| Depression score before COVID-19 | T score from 41.0 to 79.4 | 17 | 51.8 (41.0, 57.3) | 65 | 55.7 (53.9, 57.3) | 24 | 52.9 (49.0, 58.9) | 101 | 58.9 (57.3, 60.5) | 80 | 62.2 (60.5, 63.9) |
| Pain interference before COVID-19 | T score from 41.6 to 75.6 | 17 | 55.6 (52.0, 63.8) | 65 | 58.5 (57.1, 61.2) | 24 | 56.4 (55.6, 59.9) | 101 | 62.5 (61.2, 63.8) | 79 | 65.2 (63.8, 66.6) |
| Physical function before COVID-19 | T score from 22.9 to 56.9 | 17 | 45.3 (41.8, 56.9) | 66 | 42.6 (41.8, 43.4) | 23 | 43.4 (40.4, 48.0) | 101 | 40.4 (39.1, 41.8) | 79 | 36.7 (35.6, 39.1) |
| Age in years | ≤50 | 12 | 70.6 (43.6, 88.2) | 45 | 68.2 (54.4, 79.3) | 15 | 62.5 (40.1, 80.6) | 56 | 54.4 (42.7, 65.6) | 44 | 54.3 (41.2, 66.8) |
| >50 | 5 | 29.4 (11.8, 56.4) | 21 | 31.8 (20.7, 45.6) | 9 | 37.5 (19.4, 59.9) | 41 | 39.8 (29.1, 51.6) | 33 | 40.7 (28.7, 54.0) | |
| Score range | n | Median (95% CI) | n | Median (95% CI) | n | Median (95% CI) | n | Median (95% CI) | n | Median (95% CI) | |
| Acute stress disorder | Score from 0 to 76 | 17 | 10.0 (5.0, 16.0) | 66 | 13.0 (9.0, 15.0) | 24 | 13.0 (8.0, 23.0) | 103 | 13.0 (12.0, 15.0) | 81 | 20.0 (16.0, 24.0) |
| Finding the COVID-19 pandemic stressful | Score from 0 (not at all) to 10 (extremely) | 17 | 7.0 (5.0, 8.0) | 66 | 7.0 (6.0, 8.0) | 24 | 7.0 (5.0, 8.0) | 103 | 7.0 (6.0, 8.0) | 80 | 8.0 (7.0, 8.0) |
| Finding lockdown measures associated with the COVID-19 pandemic stressful | Score from 0 (not at all) to 10 (extremely) | 17 | 5.0 (3.0, 7.0) | 66 | 5.0 (5.0, 6.0) | 24 | 6.0 (3.0, 7.0) | 103 | 6.0 (5.0, 7.0) | 81 | 7.0 (6.0, 8.0) |
| Cortisol variables | |||||||||||
| Cortisol before COVID-19 | pg/mg from 3.1 to 328.9 | 5 | 9.6 (8.4, 45.9) | 19 | 11.4 (8.6, 19.9) | 7 | 21.0 (6.9, 91.7) | 23 | 9.8 (6.9, 13.5) | 20 | 13.3 (9.3, 23.7) |
| Cortisol after COVID-19 | pg/mg from 2.9 to 566.2 | 5 | 11.5 (10.1, 103.4) | 23 | 14.9 (12.9, 24.4) | 8 | 18.9 (14.4, 49.8) | 29 | 13.6 (8.8, 23.1) | 24 | 19.2 (14.3, 37.1) |
| Percentage of change in cortisol | pg/mg from −60.5 to 250.0 | 5 | 22.9 (5.0, 125.3) | 19 | 36.2 (12.5, 96.4) | 7 | 25.0 (−60.5, 127.5) | 23 | 24.1 (−3.5, 50.6) | 20 | 25.6 (−3.3, 48.5) |
| Time-variant variable | |||||||||||
| COVID-19 diagnosis at any point | No | 12 | 70.6 (43.6, 88.2) | 56 | 84.8 (72.5, 92.2) | 16 | 66.7 (44.0, 83.6) | 95 | 92.2 (84.2, 96.4) | 66 | 81.5 (70.1, 89.2) |
| Yes | 5 | 29.4 (11.8, 56.4) | 10 | 15.2 (7.8, 27.5) | 8 | 33.3 (16.4, 56.0) | 8 | 7.8 (3.6, 15.8) | 15 | 18.5 (10.8, 29.9) | |
| Methodological variable | |||||||||||
| Months between pre–COVID-19 and onset-of-pandemic surveys | 0–17 mo | 17 | 2.0 (2.0, 8.0) | 66 | 6.5 (3.0, 8.0) | 24 | 3.0 (1.0, 8.0) | 102 | 6.5 (3.0, 8.0) | 80 | 3.0 (2.0, 6.0) |
Table 3.
Multivariable binary logistic regression models used to identify participants' sociodemographic and clinical characteristics associated with trajectories of pain intensity (n = 230).
| Variables | Categories | Stable severe and moderate vs other trajectories | U-shape vs other trajectories | Inverted U-shape vs other trajectories | Stable mild vs other trajectories | ||||
|---|---|---|---|---|---|---|---|---|---|
| OR (95% CI) | P | OR (95% CI) | P | OR (95% CI) | P | OR (95% CI) | P | ||
| Pre–COVID-19 variables | |||||||||
| Sex at birth | Female vs male | 0.7 (0.4, 1.6) | 0.464 | 2.5 (0.7, 8.8) | 0.351 | 1.2 (0.6, 2.6) | 0.645 | 0.4 (0.1, 1.8) | 0.251 |
| Low back pain been an ongoing problem over the past 6 mo | At least half the days in the past 6 mo vs less than half the days in the past 6 mo | 1.6 (0.7, 3.7) | 0.310 | 0.9 (0.4, 2.0) | 0.740 | 0.3 (0.6, 2.0) | 0.228 | ||
| Every day or nearly every day in the past 6 mo vs less than half the days in the past 6 mo | 3.3 (1.4, 7.7) | 0.007 | 0.5 (0.2, 1.2) | 0.131 | 1.0 (0.2, 4.7) | 0.989 | |||
| Low back pain spread down your leg(s) during the past 2 wk | Yes vs no/not sure | 0.6 (0.2, 1.8) | 0.391 | 0.1 (0.1, 0.7) | 0.022 | ||||
| Widespread pain (pain in most of the body) | Yes vs no | 2.7 (1.4, 5.2) | 0.004 | 0.6 (0.2, 1.8) | 0.369 | 0.1 (0.01, 0.6) | 0.013 | ||
| Opioid painkillers | Yes vs no | 0.4 (0.1, 1.0) | 0.057 | ||||||
| It is not really safe for a person with my low back problem to be physically active | Agree vs disagree | 0.5 (0.2, 1.4) | 0.200 | ||||||
| Feeling that my low back pain is terrible and never going to get any better | Agree vs disagree | 1.8 (0.8, 3.7) | 0.137 | ||||||
| Current smoker | Yes vs No | 0.8 (0.3, 2.3) | 0.692 | ||||||
| Body mass index ≥30 | ≥30 vs < 30 | 0.3 (0.1, 1.4) | 0.112 | ||||||
| Pain intensity before COVID-19 | Score from 0 = no pain to 10 = worst imaginable pain) | 1.5 (1.3, 1.9) | <0.001 | 0.8 (0.7, 0.9) | 0.014 | ||||
| Pain interference before COVID-19 | T score from 41.6 to 75.6 | 0.9 (0.8, 0.98) | 0.009 | ||||||
| Physical function before COVID-19 | T score from 22.9 to 56.9 | 1.1 (0.9, 1.2) | 0.278 | ||||||
| Onset outbreak variables | |||||||||
| Age in years | >50 vs ≤50 | 0.8 (0.4, 1.7) | 0.585 | 1.7 (0.6, 5.1) | 0.143 | 0.9 (0.4, 1.8) | 0.751 | 1.3 (0.3, 5.9) | 0.712 |
| Acute stress disorder | Score from 0 to 76 | 1.0 (1.0, 1.0) | 0.656 | 1.0 (1.0, 1.1) | 0.103 | 1.0 (0.9, 1.0) | 0.084 | 0.9 (0.9, 1.0) | 0.233 |
| Finding the COVID-19 pandemic stressful | Score from 0 (not at all) to 10 (extremely) | 1.0 (0.9, 1.2) | 0.697 | 0.9 (0.7, 1.1) | 0.290 | 1.1 (0.9, 1.3) | 0.539 | 1.3 (0.9, 1.9) | 0.110 |
| Finding lockdown measures associated with the COVID-19 pandemic stressful | Score from 0 (not at all) to 10 (extremely) | 1.1 (0.9, 1.3) | 0.327 | 0.9 (0.7, 1.2) | 0.561 | 1.0 (0.9, 1.1) | 0.892 | 1.0 (0.7, 1.3) | 0.814 |
| Time-variant variable | |||||||||
| Having COVID-19 at any point | Yes vs No | 0.5 (0.2, 1.2) | 0.109 | 3.9 (1.3, 11.3) | 0.013 | 0.8 (0.3, 1.9) | 0.571 | 1.0 (0.2, 4.6) | 0.965 |
| Model evaluation | |||||||||
| Hosmer and Lemeshow test | 0.184 | 0.915 | 0.103 | 0.067 | |||||
Significant associations were bolded. In the model of severe or stable moderate pain intensity trajectories, we forced age, sex, and finding the COVID-19 pandemic stressful and having COVID-19 at any point. In the model of U-shape pain intensity trajectories, we forced age, sex, acute stress disorder, finding the COVID-19 pandemic stressful, finding lockdown measures associated with the COVID-19 pandemic stressful, and having COVID-19 at any point. In the inverted U-shape pain intensity trajectory, and the slight pain intensity trajectory models, we forced age, sex, acute stress disorder, finding the COVID-19 pandemic stressful, finding lockdown measures associated with the COVID-19 pandemic stressful, and having COVID-19 at any point.
Descriptively, the trajectory of severe depressive symptoms was characterized by a high percentage of people reporting widespread pain and participants treated with opioids. Likewise, this trajectory showed a high score of depressive score before COVID-19, high levels of acute stress disorder symptoms, high levels of stress related to the pandemic and to the lockdown measures, and lower levels of physical function before COVID-19 (Table 4). In the multivariate analysis (Table 5), each additional increase of 1 point in depressive symptom score before COVID-19 (OR = 1.2; 95% CI = 1.1, 1.2), acute stress disorder (OR = 1.1; 95% CI = 1.03, 1.1), and finding lockdown measures associated with the COVID-19 pandemic stressful (OR = 1.3; 95% CI = 1.04, 1.6) were associated with an increase in the odds of having severe depressive symptoms compared with the other 3 trajectories.
Table 4.
Sample characteristics by trajectories of depressive symptoms.
| Variable | Category | Stable none | Stable very mild | Stable mild | Stable moderate | Severe slightly improving | |||||
|---|---|---|---|---|---|---|---|---|---|---|---|
| n | % (95% CI) | n | % (95% CI) | n | % (95% CI) | n | % (95% CI) | n | % (95% CI) | ||
| Pre–COVID-19 variables | |||||||||||
| Sex at birth | Female | 39 | 67.2 (52.5, 79.2) | 43 | 70.5 (55.3, 82.2) | 63 | 74.1 (61.5, 83.7) | 43 | 68.3 (53.2, 80.3) | 14 | 58.3 (36.3, 77.5) |
| Male | 19 | 32.8 (20.8, 47.5) | 17 | 27.9 (16.5, 43.0) | 21 | 24.7 (15.3, 37.3) | 19 | 30.2 (18.5, 45.2) | 10 | 41.7 (22.5, 63.7) | |
| Working (full time or part-time) | No | 56 | 96.6 (86.5, 99.2) | 55 | 90.2 (78.3, 95.9) | 71 | 83.5 (72.7, 90.6) | 53 | 84.1 (71.4, 91.9) | 22 | 91.7 (70.9, 98.0) |
| Yes | 2 | 3.4 (0.8, 13.5) | 6 | 9.8 (4.1, 21.7) | 14 | 16.5 (9.4, 27.3) | 10 | 15.9 (8.1, 28.6) | 2 | 8.3 (2.0, 29.1) | |
| Low back pain been an ongoing problem over the past 6 mo | At least half the days in the past 6 mo | 13 | 22.4 (12.1, 37.6) | 21 | 34.4 (21.8, 49.8) | 25 | 29.4 (19.2, 42.2) | 15 | 23.8 (13.5, 38.5) | 11 | 45.8 (24.7, 68.5) |
| Every day or nearly every day in the past 6 mo | 22 | 37.9 (24.4, 53.6) | 22 | 36.1 (23.1, 51.4) | 37 | 43.5 (31.5, 56.4) | 39 | 61.9 (46.9, 75.0) | 12 | 50.0 (28.0, 72.0) | |
| Less than half the days in the past 6 mo | 23 | 39.7 (25.9, 55.3) | 18 | 29.5 (17.8, 44.7) | 23 | 27.1 (17.2, 39.8) | 9 | 14.3 (6.7, 27.8) | 1 | 4.2 (0.6, 25.5) | |
| Low back pain spread down your leg(s) during the past 2 wk | No/not sure | 33 | 56.9 (42.4, 70.3) | 27 | 44.3 (31.0, 58.4) | 34 | 40.0 (29.0, 52.1) | 30 | 47.6 (34.2, 61.4) | 7 | 29.2 (13.5, 52.0) |
| Yes | 25 | 43.1 (29.7, 57.6) | 34 | 55.7 (41.6, 69.0) | 51 | 60.0 (47.9, 71.0) | 33 | 52.4 (38.6, 65.8) | 17 | 70.8 (48.0, 86.5) | |
| Widespread pain (pain in most of the body) | No | 35 | 60.3 (44.7, 74.1) | 29 | 47.5 (33.1, 62.4) | 40 | 47.1 (34.7, 59.8) | 22 | 34.9 (22.4, 50.0) | 3 | 12.5 (3.8, 34.2) |
| Yes | 21 | 36.2 (23.0, 51.9) | 30 | 49.2 (34.6, 63.9) | 44 | 51.8 (39.1, 64.2) | 39 | 61.9 (46.9, 75.0) | 21 | 87.5 (65.8, 96.2) | |
| Opioid painkillers | No/not sure | 46 | 79.3 (65.3, 88.6) | 51 | 83.6 (70.5, 91.6) | 63 | 74.1 (62.3, 83.2) | 51 | 81.0 (67.8, 89.6) | 9 | 37.5 (19.4, 59.9) |
| Yes | 12 | 20.7 (11.4, 34.7) | 10 | 16.4 (8.4, 29.5) | 22 | 25.9 (16.8, 37.7) | 12 | 19.0 (10.4, 32.2) | 15 | 62.5 (40.1, 80.6) | |
| Infiltrations/injections | No/not sure | 47 | 81.0 (67.2, 89.9) | 54 | 88.5 (76.3, 94.9) | 76 | 89.4 (78.8, 95.0) | 57 | 90.5 (79.0, 96.0) | 19 | 79.2 (54.8, 92.2) |
| Yes | 11 | 19.0 (10.1, 32.8) | 7 | 11.5 (5.1, 23.7) | 8 | 9.4 (4.2, 19.7) | 6 | 9.5 (4.0, 21.0) | 4 | 16.7 (5.5, 40.7) | |
| It is not really safe for a person with my low back problem to be physically active | Agree | 11 | 19.0 (10.1, 32.8) | 11 | 18.0 (9.6, 31.3) | 13 | 15.3 (8.5, 26.0) | 12 | 19.0 (10.4, 32.2) | 10 | 41.7 (22.5, 63.7) |
| Disagree | 47 | 81.0 (67.2, 89.9) | 50 | 82.0 (68.7, 90.4) | 72 | 84.7 (74.0, 91.5) | 51 | 81.0 (67.8, 89.6) | 14 | 58.3 (36.3, 77.5) | |
| Feeling that my low back pain is terrible and never going to get any better | Agree | 21 | 36.2 (23.7, 50.9) | 23 | 37.7 (25.2, 52.0) | 38 | 44.7 (33.3, 56.8) | 29 | 46.0 (32.8, 59.9) | 14 | 58.3 (36.3, 77.5) |
| Disagree | 37 | 63.8 (49.1, 76.3) | 38 | 62.3 (48.0, 74.8) | 47 | 55.3 (43.2, 66.7) | 34 | 54.0 (40.1, 67.2) | 10 | 41.7 (22.5, 63.7) | |
| Excess of alcohol or drugs | No | 13 | 22.4 (12.6, 36.6) | 12 | 19.7 (10.3, 34.2) | 42 | 49.4 (37.6, 61.3) | 30 | 47.6 (34.2, 61.4) | 8 | 33.3 (16.4, 56.0) |
| Yes | 45 | 77.6 (63.4, 87.4) | 48 | 78.7 (64.0, 88.5) | 43 | 50.6 (38.7, 62.4) | 33 | 52.4 (38.6, 65.8) | 16 | 66.7 (44.0, 83.6) | |
| Current smoker | No | 48 | 82.8 (68.1, 91.5) | 56 | 91.8 (79.4, 97.0) | 69 | 81.2 (69.2, 89.2) | 42 | 66.7 (51.6, 79.0) | 19 | 79.2 (56.5, 91.8) |
| Yes | 8 | 13.8 (6.2, 27.9) | 4 | 6.6 (2.1, 18.4) | 12 | 14.1 (7.3, 25.4) | 18 | 28.6 (17.2, 43.5) | 5 | 20.8 (8.2, 43.5) | |
| Body mass index ≥30 | <30 | 31 | 53.4 (38.2, 68.1) | 40 | 65.6 (50.2, 78.2) | 48 | 56.5 (43.6, 68.5) | 35 | 55.6 (40.7, 69.4) | 13 | 54.2 (32.7, 74.2) |
| ≥30 | 25 | 43.1 (28.9, 58.6) | 20 | 32.8 (20.4, 48.1) | 36 | 42.4 (30.4, 55.3) | 25 | 39.7 (26.4, 54.7) | 11 | 45.8 (25.8, 67.3) | |
| Pain intensity before COVID-19 | Score from 0 = no pain to 10 = worst imaginable pain) | 58 | 6.0 (5.0, 7.0) | 61 | 6.0 (5.0, 7.0) | 85 | 6.0 (5.0, 7.0) | 63 | 7.0 (6.0, 7.0) | 24 | 7.0 (6.0, 8.0) |
| Depression score before COVID-19 | T score from 41.0 to 79.4 | 58 | 51.8 (49.0, 53.9) | 60 | 53.9 (51.8, 57.3) | 84 | 58.9 (55.7, 60.5) | 61 | 62.2 (62.2, 63.9) | 24 | 70.3 (65.7, 73.3) |
| Pain interference before COVID-19 | T score from 41.6 to 75.6 | 57 | 61.2 (58.5, 63.8) | 61 | 61.2 (57.1, 63.8) | 81 | 61.2 (59.9, 62.5) | 63 | 62.5 (61.2, 65.2) | 24 | 66.6 (62.5, 69.7) |
| Physical function before COVID | T score from 22.9 to 56.9 | 58 | 41.8 (39.1, 43.4) | 60 | 41.8 (40.4, 45.3) | 84 | 40.4 (39.1, 41.8) | 61 | 41.8 (37.9, 41.8) | 23 | 36.7 (35.6, 37.9) |
| Onset-of-pandemic variables | |||||||||||
| Age in years | ≤50 | 27 | 46.6 (31.9, 61.8) | 34 | 55.7 (40.7, 69.8) | 56 | 65.9 (52.9, 76.8) | 36 | 57.1 (42.2, 70.8) | 19 | 79.2 (54.8, 92.2) |
| >50 | 30 | 51.7 (36.6, 66.6) | 23 | 37.7 (24.5, 53.0) | 27 | 31.8 (21.2, 44.7) | 25 | 39.7 (26.4, 54.7) | 4 | 16.7 (5.5, 40.7) | |
| Acute stress disorder | Score from 0 to 76 | 58 | 5.0 (4.0, 7.0) | 61 | 11.0 (8.0, 14.0) | 85 | 14.0 (13.0, 17.0) | 63 | 21.0 (18.0, 28.0) | 24 | 35.5 (27.0, 56.0) |
| Finding the COVID-19 pandemic stressful | Score from 0 (not at all) to 10 (extremely) | 58 | 5.0 (5.0, 6.0) | 61 | 7.0 (5.0, 8.0) | 84 | 7.0 (6.0, 8.0) | 63 | 8.0 (8.0, 9.0) | 24 | 10.0 (8.0, 10.0) |
| Finding lockdown measures associated with the COVID-19 pandemic stressful | Score from 0 (not at all) to 10 (extremely) | 58 | 4.0 (3.0, 5.0) | 61 | 5.0 (4.0, 6.0) | 85 | 6.0 (5.0, 7.0) | 63 | 7.0 (7.0, 8.0) | 24 | 9.5 (8.0, 10.0) |
| Cortisol variables | Score range | n | Median (95% CI) | n | Median (95% CI) | n | Median (95% CI) | n | Median (95% CI) | n | Median (95% CI) |
| Cortisol before COVID-19 | pg/mg from 3.1 to 328.9 | 19 | 9.6 (8.4, 45.9) | 21 | 13.4 (10.0, 23.3) | 19 | 11.4 (7.4, 45.9) | 13 | 8.8 (5.3, 13.5) | 2 | 17.2 (10.8, 23.7) |
| Cortisol after COVID-19 | pg/mg from 2.9 to 566.2 | 25 | 11.5 (10.1, 103.4) | 24 | 17.0 (14.8, 33.9) | 22 | 14.8 (12.9, 36.2) | 14 | 12.0 (8.4, 19.1) | 4 | 22.9 (8.8, 161.3) |
| Percentage of change in cortisol | pg/mg from −60.5 to 250.0 | 19 | 22.9 (5.0, 125.3) | 21 | 14.8 (−3.5, 41.0) | 19 | 19.2 (12.5, 61.0) | 13 | 45.5 (−3.6, 85.3) | 2 | −10.9 (−18.1, −3.7) |
| Time-variant variable | Category | n | % (95% CI) | n | % (95% CI) | n | % (95% CI) | n | % (95% CI) | n | % (95% CI) |
| Having COVID-19 at any point | No | 50 | 86.2 (73.2, 93.5) | 50 | 82.0 (68.7, 90.4) | 69 | 81.2 (70.0, 88.8) | 53 | 84.1 (71.4, 91.9) | 23 | 95.8 (76.4, 99.4) |
| Yes | 8 | 13.8 (6.5, 26.8) | 11 | 18.0 (9.6, 31.3) | 16 | 18.8 (11.2, 30.0) | 10 | 15.9 (8.1, 28.6) | 1 | 4.2 (0.6, 23.6) | |
| Methodological variables | Score range | n | Median (95% CI) | n | Median (95% CI) | n | Median (95% CI) | n | Median (95% CI) | n | Median (95% CI) |
| Months between pre–COVID-19 and baseline surveys | 0–17 mo | 57 | 7.0 (3.0, 8.0) | 61 | 6.0 (3.0, 7.0) | 84 | 3.0 (2.0, 7.0) | 63 | 4.0 (2.0, 7.0) | 24 | 5.0 (2.0, 8.0) |
Table 5.
Multivariable bivariate logistic regression model used to identify participants' sociodemographic and clinical characteristics associated with trajectories of depression.
| Variables | Categories | Severe lightly improving or stable moderate trajectories vs other trajectories | Stable mild vs other trajectories | Stable very mild or stable none vs other trajectories | |||
|---|---|---|---|---|---|---|---|
| OR (95% CI) | P | OR (95% CI) | P | OR (95% CI) | P | ||
| Pre–COVID-19 variables | |||||||
| Sex at birth | Female vs male | 0.6 (0.3, 1.3) | 0.204 | 1.4 (0.7, 2.8) | 0.352 | 1.2 (0.6, 2.8) | 0.585 |
| Working full time or part-time | Yes vs no | 0.5 (0.2, 1.5) | 0.195 | ||||
| Low back pain been an ongoing problem over the past 6 mo | At least half the days in the past 6 mo vs less than half the days in the past 6 mo Every day or nearly every day in the past 6 mo vs less than half the days in the past 6 mo |
0.8 (0.4, 1.9) 0.8 (0.4, 1.7) |
0.688 0.556 |
||||
| Low back pain spread down your leg(s) during the past 2 wk | Yes vs no/not sure | 2.3 (1.2, 4.4) | 0.009 | ||||
| Infiltration/injections | Yes vs no | 1.2 (0.4, 3.9) | 0.784 | 1.9 (0.6, 5.9) | 0.283 | ||
| Feeling that my low back pain is terrible and never going to get any better | Agree vs disagree | 0.6 (0.3, 1.4) | 0.218 | ||||
| Excess of alcohol or drugs | Yes vs no | 0.4 (0.2, 0.8) | 0.010 | 3.4 (1.7, 7.0) | 0.001 | ||
| Current smoker | Yes vs no | ||||||
| Body mass index ≥30 | ≥30 vs < 30 | 0.8 (0.4, 1.7) | 0.608 | ||||
| Pain intensity before COVID-19 | 0.9 (0.7, 1.1) | ||||||
| Depression before COVID-19 | 1.2 (1.1, 1.3) | <0.0001 | 0.9 (0.9, 0.9) | <0.001 | |||
| Onset outbreak variables | |||||||
| Age in years | >50 vs ≤50 | 1.1 (0.5, 2.5) | 0.832 | 0.6 (0.3, 1.3) | 0.189 | 1.6 (0.8, 3.5) | 0.199 |
| Acute stress disorder | Score from 0 to 76 | 1.1 (1.03, 1.1) | 0.001 | 1.0 (1.0, 1.0) | 0.183 | 0.9 (0.9, 09) | 0.022 |
| Finding the COVID-19 pandemic stressful | Score from 0 (not at all) to 10 (extremely) | 1.1 (0.8, 1.3) | 0.665 | 1.0 (0.9, 1.2) | 0.700 | 0.9 (0.8, 1.3) | 0.494 |
| Finding lockdown measures associated with the COVID-19 pandemic stressful | Score from 0 (not at all) to 10 (extremely) | 1.3 (1.05, 1.6) | 0.017 | 1.0 (0.9, 1.2) | 0.858 | 0.9 (0.8, 1.0) | 0.091 |
| Time-variant variable | |||||||
| Having COVID-19 at any point | Yes vs no | 0.7 (0.3, 1.9) | 0.478 | 1.1 (0.5, 2.5) | 0.761 | 1.2 (0.5, 2.8) | 0.709 |
| Methodological variable | |||||||
| Months between pre–COVID-19 and onset-of-pandemic surveys | 0–17 mo | 1.0 (0.9, 1.0) | 0.287 | 1.0 (0.9, 1.1) | 0.364 | ||
| Model evaluation | |||||||
| Hosmer and Lemeshow test | 0.593 | 0.289 | 0.448 | ||||
Significant associations were bolded. In the model of severe or stable moderate depressive symptoms trajectories, we forced sex, having COVID-19 at any point, and finding the COVID-19 pandemic stressful. In the model of mild stable moderate depressive symptoms trajectories, we forced age, sex, having COVID-19 at any point, and finding the COVID-19 pandemic stressful. In the model of stable slight or stable nondepressive symptoms trajectories, we forced sex, age, and having COVID-19 at any point.
Of the 291 participants, 105 agreed to provide a hair sample (other participants either could not be reached by phone to explain this procedure, refused, or did not have hair long enough). Among these 105 individuals, after excluding 3 outliers (with cortisol values ≥ 3 SDs), 74 provided a sufficient hair length (6 cm).
Although the confidence intervals do not indicate a significant difference between the trajectory groups of pain intensity (Fig. 4) and depressive symptoms (Fig. 5), there was an increasing trend in cortisol levels in the post–onset of the COVID-19 pandemic measurements for the stable mild and inverted U-shape pain intensity groups, as well as for the stable none and stable mild trajectories of depressive symptoms. In the binary multiple logistic regression models that include the pre–onset of the COVID-19 pandemic to post–onset of the COVID-19 pandemic percentage of change in cortisol levels and subjective stress measures, the pre–onset of the COVID-19 pandemic to post–onset of the COVID-19 pandemic percentage of change in cortisol is not significantly associated with any trajectory of pain or depressive symptoms (Table 6).
Figure 4.

Cortisol levels by trajectories of pain intensity. Median and 95% confidence interval.
Figure 5.

Cortisol levels by trajectories of depression. Median and 95% confidence interval.
Table 6.
Subgroup analysis.
| Variables | Categories/range | Pain intensity* | Depressive symptoms | ||||||||||
|---|---|---|---|---|---|---|---|---|---|---|---|---|---|
| Stable severe and moderate vs other trajectories (n = 67) | U-shape vs other trajectories | Inverted U-Shape vs other trajectories | Severe slightly improving or stable moderate trajectories vs other trajectories | Stable mild vs other trajectories | Stable very mild or none vs other trajectories | ||||||||
| OR (95% CI) | P | OR (95% CI) | P | OR (95% CI) | P | OR (95% CI) | P | OR (95% CI) | P | OR (95% CI) | P | ||
| Cortisol variable | |||||||||||||
| Percentage of change in cortisol, pg/mg | −60.5 to 250 | 1.0 (1.0, 1.0) | 0.547 | 1.0 (1.0, 1.0) | 0.630 | 1.0 (1.0, 1.0) | 0.690 | 1.0 (1.0, 1.0) | 0.722 | 1.0 (1.0, 1.0) | 0.753 | 1.0 (1.0, 1.0) | 0.413 |
| Pre–COVID-19 variables | |||||||||||||
| Pain intensity before COVID-19 | Score from 0 = No pain to 10 = worst imaginable pain) | 1.3 (0.8, 2.2) | 0.269 | 1.4 (0.7, 2.7) | 0.389 | 0.7 (0.5, 1.2) | 0.202 | 0.8 (0.3, 1.9) | 0.612 | 0.9 (0.5, 1.4) | 0.571 | 1.5 (0.8, 2.9) | 0.248 |
| Depressive symptoms before COVID-19 | T score from 41.0 to 79.4 | 1.0 (0.9, 1.1) | 0.996 | 1.0 (0.9, 1.2) | 0.553 | 1.0 (0.9, 1.1) | 0.819 | 1.3 (1.0, 1.5) | 0.036 | 1.1 (1.0, 1.2) | 0.210 | 0.9 (0.8, 1.0) | 0.035 |
| Pain interference before COVID-19 | T score from 41.6 to 75.6 | 1.0 (0.8, 1.1) | 0.597 | 0.9 (0.7, 1.1) | 0.244 | 1.0 (0.9, 1.2) | 0.841 | 1.1 (0.8, 1.6) | 0.448 | 1.0 (0.8, 1.2) | 0.788 | 0.9 (0.8, 1.2) | 0.612 |
| Physical function before COVID-19 | T score from 22.9 to 56.9 | 0.7 (0.5, 0.9) | 0.007 | 1.1 (0.9, 1.4) | 0.262 | 1.0 (0.8, 1.2) | 0.961 | 1.1 (0.8, 1.5) | 0.556 | 1.0 (0.8, 1.2) | 0.716 | 1.1 (0.9, 1.4) | 0.441 |
| Onset-of-pandemic variables | |||||||||||||
| Age in years | Years | 1.0 (0.9, 1.1) | 0.730 | 1.0 (0.9, 1.1) | 0.919 | 1.0 (1.0, 1.1) | 0.584 | 1.0 (0.9, 1.1) | 0.613 | 1.0 (0.9, 1.0) | 0.544 | 1.1 (0.9, 1.1) | 0.728 |
| Acute stress disorder | Score from 0 to 76 | 1.1 (1.0, 1.2) | 0.098 | 0.9 (0.8, 1.0) | 0.192 | 1.0 (0.9, 1.1) | 0.930 | 1.1 (1.0, 1.3) | 0.098 | 1.0 (1.0, 1.1) | 0.337 | 0.8 (0.7, 0.9) | 0.004 |
| Finding the COVID-19 pandemic stressful | Score from 0 (not at all) to 10 (extremely) | 1.2 (0.9, 1.6) | 0.262 | 1.2 (0.8, 1.9) | 0.328 | 0.7 (0.5, 1.0) | 0.038 | 1.7 (0.9, 3.3) | 0.131 | 0.8 (0.6, 1.2) | 0.313 | 1.2 (0.7, 1.9) | 0.537 |
| Finding lockdown measures associated with the COVID-19 pandemic stressful | Score from 0 (not at all) to 10 (extremely) | 1.0 (0.8, 1.4) | 0.677 | 0.9 (0.6, 1.3) | 0.513 | 1.0 (0.8, 1.4) | 0.783 | 1.2 (0.7, 2.0) | 0.529 | 1.1 (0.8, 1.5) | 0.403 | 0.8 (0.6, 1.3) | 0.393 |
| Methodological variable | |||||||||||||
| Months between pre–COVID-19 and baseline surveys | 0–17 mo | 1.0 (0.8, 1.2) | 0.753 | 1.0 (0.8, 1.2) | 0.716 | 1.1 (0.9, 1.2) | 0.434 | 0.9 (0.8, 1.1) | 0.347 | 1.1 (0.9, 1.2) | 0.428 | 1.0 (0.8, 1.2) | 0.809 |
| Model evaluation | |||||||||||||
| Hosmer and Lemeshow test | 0.954 | 0.533 | 0.789 | 0.268 | 0.032 | 0.339 | |||||||
Association between cortisol and pain intensity trajectories and depressive symptoms adjusted for several variables.
Stable mild pain (n = 5) vs other trajectories (n = 62) were not included because of small sample size.
4. Discussion
We investigated trajectories of pain intensity and depressive symptoms beyond the early stages of the COVID-19 pandemic in a cohort of participants living with chronic LBP. We found 5 distinct trajectories of pain intensity and 4 distinct trajectories of depressive symptoms, respectively. Pre–COVID-19 pain characteristics were associated with pain intensity trajectory groups, whereas acute stress reactions were associated with depressive symptom trajectory groups. Objective stress measure (cortisol) was not predictive of either group trajectory.
Overall, more than two-thirds of individuals experienced stable pain intensity over a two-year period, regardless of challenges or opportunities provided by the COVID-19 pandemic. This is consistent with other trajectory analyses of individuals living with LBP conducted in prepandemic states showing that <15% of cohort participants show fluctuations in pain states.20 It is also consistent with another study after individuals with chronic pain seeking tertiary care during the pandemic.47 Variability in pain states tends to be identified in studies with shorter time between measurements (eg, weekly).20
It is important to note, however, that subgroups of participants experienced temporary deterioration (22.7%) or improvement (8.3%) over the first months of the pandemic, which then reverted back to baseline levels. This could be associated with disruptions in daily routines and access to care. A recent study showed that for some, disruptions in accessing pharmacological (1/3 of participants) or physical/psychological interventions (2/3 of participants) in the early stages of the COVID-19 pandemic might have altered their pain states.22 For others, access to virtual care was improved.4 Contracting COVID-19 in people with pre-existing chronic pain was associated with a U-shape trajectory in our study, but did not differentiate between the other trajectories. Little available data exist on this topic; it seems, however, that COVID-19 infections are not always associated with worsened pain states; rather, biopsychosocial factors are more strongly associated with changes in pain states during the pandemic.38
More severe pain intensity trajectories were associated with pain frequency, widespread pain, and higher pain intensity before COVID-19. Our findings suggest that individuals with higher pain intensity levels before the pandemic were more likely to continue experiencing significant pain throughout the pandemic. Our results also suggest that individuals with pain extending beyond the low back region may be at a higher risk of experiencing more severe and persistent pain during the pandemic. Widespread pain is often associated with conditions such as fibromyalgia, which can contribute to increased pain sensitivity and a higher likelihood of chronic pain.26
Although between March 2020 and June 2022, there were 6 waves of COVID-19 cases,15 with their respective response strategies such as mobility restrictions, confinement, and vaccination,12,16,42 we found long-term stable depression symptoms in 4 of 5 trajectory groups during this period. This supports the idea that the local outbreak of the pandemic did not have a serious negative impact on depressive symptoms among people with LBP. It could be that our participants did not perceive the major changes of daily life during the pandemic and therefore showed stable trajectories over the course of this period. Also, it is possible that people with pre-existing mental health conditions may have had established treatment plans or support systems in place before the pandemic. This previous care could have helped them maintain stability or prevent worsening of their depression symptoms. The only previous 2-year study in people with chronic pain revealed improvements in pain intensity and depressive scores.47 Those finding supports evidence of resilience among patients receiving treatment for chronic conditions during the COVID-19 pandemic. However, that study did not evaluate trajectories of pain intensity or depressive symptoms.
In our study, the multivariate analysis revealed that higher scores of pre–COVID-19 depressive symptoms, acute stress disorder, and finding COVID-19 lockdown measures stressful were associated with stable moderate and severe slightly improving trajectories of depressive symptoms. These results are in line with a population-based study from Switzerland following people between July 2020 and December 2021, in which the highly affected trajectory of depressive symptoms had a greater proportion of individuals with higher levels of past depression,35 and acute stress disorder is a psychological state that can occur after experiencing a traumatic event, such as a life-threatening situation.7 The symptoms of acute stress disorder include intrusive thoughts or memories of the event, avoidance of reminders of the event, negative mood, heightened anxiety, and increased arousal. If left untreated, acute stress disorder can potentially lead to the development of post-traumatic stress disorder or other mental health conditions, including depression.6 The COVID-19 pandemic has brought about a range of stressors that can trigger or exacerbate mental health issues. Lockdown measures, such as social isolation, quarantine, financial uncertainties, disruptions to daily routines, and fear of contracting the virus, have had a profound impact on people's lives. These stressors can lead to feelings of helplessness, loneliness, anxiety, and depression. Experiencing acute stress disorder in response to highly stressful events associated with the pandemic, along with finding the lockdown measures stressful, can contribute to the development of severe and persistent depressive symptoms. The combination of acute stress, ongoing stressors, and social isolation can create a challenging environment for mental well-being and increase the risk of developing or worsening depressive symptoms. For this reason, engaging in self-care practices, maintaining social connections through virtual means, and seeking support from loved ones could be beneficial in coping with the challenges of the pandemic. It is essential to continue monitoring and addressing the physical and mental well-being of individuals with low back pain, as well as providing appropriate support and interventions to manage their symptoms effectively.
The finding of a nonstatistically significant, but slight increasing trend in cortisol levels post–onset of the COVID-19 pandemic compared with pre-onset of the COVID-19 pandemic levels in all groups suggests that the experience of the pandemic may have triggered a stress response within the study population. The small sample size and lack of statistical power are, however, limiting our capacity of interpretation. Still, the COVID-19 pandemic has brought about various stressors, including fears about health, economic uncertainties, social isolation, and disruptions to daily routines. These stressors can activate the body's stress response system, leading to increased cortisol production. It is important to note that a slight increasing trend in cortisol levels does not necessarily indicate pathological or clinically significant changes. It most likely reflects an adaptive physiological response to a stressful event. However, prolonged or chronically elevated cortisol levels can have negative physical and mental health consequences, including impaired immune function, increased risk of mental health disorders, and other physiological disturbances.25
4.1. Strengths and limitations
Strengths of this study include the longitudinal design with a long-term follow-up and the availability of prepandemic data. This is crucial to examine the mental health effects of the COVID-19 pandemic. However, there was a small sample size to evaluate pre–post COVID-19 differences of cortisol levels. In addition, it is important to note that our study is specific to individuals with LBP living in Quebec and may not generalize to other populations or individuals with different types of pain conditions. Nonetheless, the online recruitment allowed to recruit a diversified sample of persons living in all Quebec regions, and the QLBPS participants were found to be representative of other large random samples of adults living with chronic LBP in Canada and elsewhere in terms of proportion of women, education level, smoking, and pain intensity.2
5. Conclusions
Despite the now endemic status of the COVID-19 pandemic during which data were collected, results are important for many reasons. First, they showed that pain and depression states remained overall relatively stable for a majority of individuals, pointing to a relative resilience in this population. Results also indicate that for some, early adjustments to the pandemic negatively impacted physical and mental health status; these findings combined suggest the need to deploy targeted prevention and acute intervention strategies during major events (eg, pandemic and natural disasters) for more vulnerable individuals. Those might be individuals with higher levels of pain interference or lower levels of physical functioning.
Disclosures
M.G.P. received honoraria from Canopy Growth and research funds from Pfizer ULC Canada for work unrelated to this study. Coauthors do not have conflicts of interest to declare.
Appendix A. Supplemental digital content
Supplemental digital content associated with this article can be found online at http://links.lww.com/PR9/A234.
Acknowledgements
This study was funded by the Canadian MSK Rehab Research Network (pilot grant, $10 000), the Research Center of the Institut Universitaire de gériatrie de Montréal (CRIUGM; $2000), and the Quebec Pain Research Network ($15000).
M.G.P. is a Junior 2 research scholar from the Fonds de recherche du Québec en santé.
Data availability: Data can be made available upon reasonable request and conditional to obtaining research ethics board approval.
Present and past members of the Quebec Back Pain Consortium are Jean-Sébastien Roy, PT, PhD, Hugo-Massé Alarie, PT, PhD, Carolina B. Meloto, DDS, PhD (codirectors), Adriana Angarita-Fonseca, PhD, Anaïs Lacasse, PhD, Erika Lauren Gentile, BA, Erwan Leclair, PhD, Francesca Montagna, NA, M. Gabrielle Pagé, PhD, Guillaume Léonard, PT, PhD, Iulia Tufa, BSc, Julien Goulet, MD, Laura S. Stone, PhD, Laurent Dupuis, NA, Luda Diatchenko, MD, PhD, Manon Choinière, PhD, Rubens da Silva, PT, PhD, Martin Descarreaux, PhD, Maryse Fortin, PhD,CAT(C), Pierre Langevin, PT, PhD, Mathieu Roy, PhD, Mark Ware, MD, MSc, Pascal Tétreault, PhD, Pierre Rainville, PhD, Richard Hovey, PhD, Simon Deslauriers, PT, PhD, Stephanie Grégoire, PhD, and Timothy Wideman, PT, PhD.
Footnotes
Sponsorships or competing interests that may be relevant to content are disclosed at the end of this article.
Present and past members of the Quebec Back Pain Consortium are present in the Acknowledgements section.
Contributor Information
Adriana Angarita-Fonseca, Email: adriana.angaritafonseca@uqat.ca.
Mathieu Roy, Email: mathieu.roy3@mcgill.ca.
Anaïs Lacasse, Email: anais.lacasse@uqat.ca.
Guillaume Léonard, Email: guillaume.leonard2@usherbrooke.ca.
Pierre Rainville, Email: pierre.rainville@umontreal.ca.
Marie-France Marin, Email: marin.marie-france@uqam.ca.
Iulia Tufa, Email: iulia.tufa@mail.mcgill.ca.
Erika L. Gentile, Email: erika.gentile@mail.mcgill.ca.
M. Gabrielle Pagé, Email: gabrielle.page@umontreal.ca.
Collaborators: Jean-Sébastien Roy, Hugo-Massé Alarie, Carolina B. Meloto, Adriana Angarita-Fonseca, Anaïs Lacasse, Erika Lauren Gentile, Erwan Leclair, Francesca Montagna, M. Gabrielle Pagé, Guillaume Léonard, Iulia Tufa, Julien Goulet, Laura S. Stone, Laurent Dupuis, Luda Diatchenko, Manon Choinière, Rubens da Silva, Martin Descarreaux, Maryse Fortin, Pierre Langevin, Mathieu Roy, Mark Ware, Pascal Tétreault, Pierre Rainville, Richard Hovey, Simon Deslauriers, Stephanie Grégoire, and Timothy Wideman
References
- [1].Amelot A, Jacquot A, Terrier LM, Aggad M, Planty-Bonjour A, Fouquet B, Cook AR, Zemmoura I, Velut S, Destrieux C, Francois P, Borius PY, Mathon B. Chronic low back pain during COVID-19 lockdown: is there a paradox effect?. Eur Spine J 2022;31:167–75. [DOI] [PMC free article] [PubMed] [Google Scholar]
- [2].Angarita-Fonseca A, Page MG, Meloto CB, Gentile EL, Leonard G, Masse-Alarie H, Tufa I, Roy JS, Stone LS, Choiniere M, Fortin M, Roy M, Sean M, Tetreault P, Rainville P, Deslauriers S, Lacasse A, Quebec Back Pain Consortium. The Canadian version of the National Institutes of Health minimum dataset for chronic low back pain research: reference values from the Quebec Low Back Pain Study. PAIN 2023;164:325–35. [DOI] [PMC free article] [PubMed] [Google Scholar]
- [3].Bailly F, Genevay S, Foltz V, Bohm-Sigrand A, Zagala A, Nizard J, Petit A. Effects of COVID-19 lockdown on low back pain intensity in chronic low back pain patients: results of the multicenter CONFI-LOMB study. Eur Spine J 2022;31:159–66. [DOI] [PMC free article] [PubMed] [Google Scholar]
- [4].Borg Debono V, Neumark S, Buckley N, Zacharias R, Hapidou E, Anthonypillai J, Faria S, Meyer CL, Carter T, Parker N, Lau B, Abreu E, Duggan S, Bisson E, Pierre J, Visca R, Poulin P. Transition to virtual care services during COVID-19 at Canadian pain clinics: survey and future recommendations. Pain Res Manag 2023;2023:6603625. [DOI] [PMC free article] [PubMed] [Google Scholar]
- [5].Bruyere O, Demoulin M, Brereton C, Humblet F, Flynn D, Hill JC, Maquet D, Van Beveren J, Reginster JY, Crielaard JM, Demoulin C. Translation validation of a new back pain screening questionnaire (the STarT Back Screening Tool) in French. Arch Public Health 2012;70:12. [DOI] [PMC free article] [PubMed] [Google Scholar]
- [6].Bryant RA. Acute stress disorder as a predictor of posttraumatic stress disorder: a systematic review. J Clin Psychiatry 2011;72:233–9. [DOI] [PubMed] [Google Scholar]
- [7].Bryant RA. Post-traumatic stress disorder: a state-of-the-art review of evidence and challenges. World Psychiatry 2019;18:259–69. [DOI] [PMC free article] [PubMed] [Google Scholar]
- [8].Bryant RA, Moulds ML, Guthrie R. Acute stress disorder scale: a self-report measure of acute stress disorder. Psychol Assess 2000;12:61–8. [PubMed] [Google Scholar]
- [9].Butler RK, Finn DP. Stress-induced analgesia. Prog Neurobiol 2009;88:184–202. [DOI] [PubMed] [Google Scholar]
- [10].Caputo EL, Ferreira PH, Feter N, Doring IR, Leite JS, Alt R, Cassuriaga J, Reichert FF, Rombaldi AJ, da Silva MC. Short-term impact of COVID-19 pandemic on low back pain: data from the PAMPA Cohort, Brazil. BMC Public Health 2023;23:44. [DOI] [PMC free article] [PubMed] [Google Scholar]
- [11].Chatkoff DK, Leonard MT, Najdi RR, Cruga B, Forsythe A, Bourgeau C, Easton H. A brief survey of the COVID-19 pandemic's impact on the chronic pain experience. Pain Manag Nurs 2022;23:3–8. [DOI] [PMC free article] [PubMed] [Google Scholar]
- [12].Detsky AS, Bogoch II. COVID-19 in Canada: experience and response to waves 2 and 3. JAMA 2021;326:1145–6. [DOI] [PubMed] [Google Scholar]
- [13].Deyo RA, Dworkin SF, Amtmann D, Andersson G, Borenstein D, Carragee E, Carrino J, Chou R, Cook K, DeLitto A, Goertz C, Khalsa P, Loeser J, Mackey S, Panagis J, Rainville J, Tosteson T, Turk D, Von Korff M, Weiner DK. Report of the NIH Task Force on research standards for chronic low back pain. J Pain 2014;15:569–85. [DOI] [PMC free article] [PubMed] [Google Scholar]
- [14].Feine JS, Lavigne GJ, Dao TTT, Morin C, Lund JP. Memories of chronic pain and perceptions of relief. PAIN 1998;77:137–41. [DOI] [PubMed] [Google Scholar]
- [15].Government of Canada. COVID-19 epidemiology update: current situation, Government of Canada: 2023. Available at: https://health-infobase.canada.ca/covid-19/current-situation.html [Google Scholar]
- [16].Government of Canada. COVID-19 vaccine: Canadian immunization guide, Government of Canada: 2023. Available at: https://www.canada.ca/en/public-health/services/publications/healthy-living/canadian-immunization-guide-part-4-active-vaccines/page-26-covid-19-vaccine.html [Google Scholar]
- [17].Greff MJE, Levine JM, Abuzgaia AM, Elzagallaai AA, Rieder MJ, van Uum SHM. Hair cortisol analysis: an update on methodological considerations and clinical applications. Clin Biochem 2019;63:1–9. [DOI] [PubMed] [Google Scholar]
- [18].Hannibal KE, Bishop MD. Chronic stress, cortisol dysfunction, and pain: a psychoneuroendocrine rationale for stress management in pain rehabilitation. Phys Ther 2014;94:1816–25. [DOI] [PMC free article] [PubMed] [Google Scholar]
- [19].Hays RD, Spritzer KL, Schalet BD, Cella D. PROMIS®-29 v2.0 profile physical and mental health summary scores. Qual Life Res 2018;27:1885–91. [DOI] [PMC free article] [PubMed] [Google Scholar]
- [20].Kongsted A, Kent P, Axen I, Downie AS, Dunn KM. What have we learned from ten years of trajectory research in low back pain? BMC Musculoskelet Disord 2016;17:220. [DOI] [PMC free article] [PubMed] [Google Scholar]
- [21].Kroenke K, Yu Z, Wu J, Kean J, Monahan PO. Operating characteristics of PROMIS four-item depression and anxiety scales in primary care patients with chronic pain. Pain Med 2014;15:1892–901. [DOI] [PMC free article] [PubMed] [Google Scholar]
- [22].Lacasse A, Page MG, Dassieu L, Sourial N, Janelle-Montcalm A, Dorais M, Nguena Nguefack HL, Godbout-Parent M, Hudspith M, Moor G, Sutton K, Thompson JM, Choiniere M. Impact of the COVID-19 pandemic on the pharmacological, physical, and psychological treatments of pain: findings from the Chronic Pain & COVID-19 Pan-Canadian Study. Pain Rep 2021;6:e891. [DOI] [PMC free article] [PubMed] [Google Scholar]
- [23].Lacasse A, Roy JS, Parent AJ, Noushi N, Odenigbo C, Page G, Beaudet N, Choiniere M, Stone LS, Ware MA, Quebec Pain Research Network's Steering Committee of the Low Back Pain Strategic Initiative. The Canadian minimum dataset for chronic low back pain research: a cross-cultural adaptation of the National Institutes of Health Task Force Research Standards. CMAJ Open 2017;5:E237–48. [DOI] [PMC free article] [PubMed] [Google Scholar]
- [24].Manenschijn L, Koper JW, Lamberts SW, van Rossum EF. Evaluation of a method to measure long term cortisol levels. Steroids 2011;76:1032–6. [DOI] [PubMed] [Google Scholar]
- [25].McEwen BS. Central effects of stress hormones in health and disease: understanding the protective and damaging effects of stress and stress mediators. Eur J Pharmacol 2008;583:174–85. [DOI] [PMC free article] [PubMed] [Google Scholar]
- [26].Mills SEE, Nicolson KP, Smith BH. Chronic pain: a review of its epidemiology and associated factors in population-based studies. Br J Anaesth 2019;123:e273–83. [DOI] [PMC free article] [PubMed] [Google Scholar]
- [27].Mun CJ, Campbell CM, McGill LS, Wegener ST, Aaron RV. Trajectories and individual differences in pain, emotional distress, and prescription opioid misuse during the COVID-19 pandemic: a one-year longitudinal study. J Pain 2022;23:1234–44. [DOI] [PMC free article] [PubMed] [Google Scholar]
- [28].Nagin DS. Group-based trajectory modeling: an overview. Ann Nutr Metab 2014;65:205–10. [DOI] [PubMed] [Google Scholar]
- [29].Nandam LS, Brazel M, Zhou M, Jhaveri DJ. Cortisol and major depressive disorder - translating findings from humans to animal models and back. Front Psychiatry 2019;10:974. [DOI] [PMC free article] [PubMed] [Google Scholar]
- [30].Nguena Nguefack HL, Page MG, Katz J, Choiniere M, Vanasse A, Dorais M, Samb OM, Lacasse A. Trajectory modelling techniques useful to epidemiological research: a comparative narrative review of approaches. Clin Epidemiol 2020;12:1205–22. [DOI] [PMC free article] [PubMed] [Google Scholar]
- [31].Olango WM, Finn DP. Neurobiology of stress-induced hyperalgesia. Curr Top Behav Neurosci 2014;20:251–80. [DOI] [PubMed] [Google Scholar]
- [32].Pagé MG, Lacasse A, Beaudet N, Choinière M, Deslauriers S, Diatchenko L, Dupuis L, Grégoire S, Hovey R, Leclair E, Leonard G, Meloto CB, Montagna F, Parent A, Rainville P, Roy JS, Roy M, Ware M, Wideman TH, Stone K, the Quebec Back Pain Consortium. The Quebec low back pain study: a protocol for an innovative 2-tier provincial cohort. Pain Rep 2020;5:e799. [DOI] [PMC free article] [PubMed] [Google Scholar]
- [33].Page MG, Lacasse A, Dassieu L, Hudspith M, Moor G, Sutton K, Thompson JM, Dorais M, Janelle Montcalm A, Sourial N, Choiniere M. A cross-sectional study of pain status and psychological distress among individuals living with chronic pain: the Chronic Pain & COVID-19 Pan-Canadian Study. Health Promot Chronic Dis Prev Can 2021;41:141–52. [DOI] [PubMed] [Google Scholar]
- [34].Papalia GF, Petrucci G, Russo F, Ambrosio L, Vadala G, Iavicoli S, Papalia R, Denaro V. COVID-19 pandemic increases the impact of low back pain: a systematic review and metanalysis. Int J Environ Res Public Health 2022;19:4599. [DOI] [PMC free article] [PubMed] [Google Scholar]
- [35].Probst-Hensch N, Jeong A, Keidel D, Imboden M, Lovison G. Depression trajectories during the COVID-19 pandemic in the high-quality health care setting of Switzerland: the COVCO-basel cohort. Public Health 2023;217:65–73. [DOI] [PMC free article] [PubMed] [Google Scholar]
- [36].PROMIS® Scoring Manuals. Patient-reported outcomes measurement information system. Washington, DC: US Department of Health and Human Services, 2016. [Google Scholar]
- [37].Schafer KM, Lieberman A, Sever AC, Joiner T. Prevalence rates of anxiety, depressive, and eating pathology symptoms between the pre- and peri-COVID-19 eras: a meta-analysis. J Affect Disord 2022;298:364–72. [DOI] [PMC free article] [PubMed] [Google Scholar]
- [38].Shanthanna H, Nelson AM, Kissoon N, Narouze S. The COVID-19 pandemic and its consequences for chronic pain: a narrative review. Anaesthesia 2022;77:1039–50. [DOI] [PMC free article] [PubMed] [Google Scholar]
- [39].Stone AA, Broderick JE, Shiffman SS, Schwartz JE. Understanding recall of weekly pain from a momentary assessment perspective: absolute agreement, between- and within-person consistency, and judged change in weekly pain. PAIN 2004;107:61–9. [DOI] [PubMed] [Google Scholar]
- [40].Stone AA, Schwartz JE, Broderick JE, Shiffman SS. Variability of momentary pain predicts recall of weekly pain: a consequence of the peak (or salience) memory heuristic. Personal Soc Psychol Bull 2005;31:1340–6. [DOI] [PubMed] [Google Scholar]
- [41].Tibshirani R. Regression shrinkage and selection via the lasso. J R Stat Soc Ser B (Methodological) 1996;58:267–88. [Google Scholar]
- [42].Urrutia D, Manetti E, Williamson M, Lequy E. Overview of Canada's answer to the COVID-19 pandemic's first wave (January-April 2020). Int J Environ Res Public Health 2021;18:7131. [DOI] [PMC free article] [PubMed] [Google Scholar]
- [43].Vachon-Presseau E, Roy M, Martel MO, Caron E, Marin MF, Chen J, Albouy G, Plante I, Sullivan MJ, Lupien SJ, Rainville P. The stress model of chronic pain: evidence from basal cortisol and hippocampal structure and function in humans. Brain 2013;136:815–27. [DOI] [PubMed] [Google Scholar]
- [44].Vatcheva KP, Lee M, McCormick JB, Rahbar MH. Multicollinearity in regression analyses conducted in epidemiologic studies. Epidemiology (Sunnyvale) 2016;6:227. [DOI] [PMC free article] [PubMed] [Google Scholar]
- [45].Witteveen AB, Young SY, Cuijpers P, Ayuso-Mateos JL, Barbui C, Bertolini F, Cabello M, Cadorin C, Downes N, Franzoi D, Gasior M, Gray B, Melchior M, van Ommeren M, Palantza C, Purgato M, van der Waerden J, Wang S, Sijbrandij M. COVID-19 and common mental health symptoms in the early phase of the pandemic: an umbrella review of the evidence. Plos Med 2023;20:e1004206. [DOI] [PMC free article] [PubMed] [Google Scholar]
- [46].Zefferino R, Di Gioia S, Conese M. Molecular links between endocrine, nervous and immune system during chronic stress. Brain Behav 2021;11:e01960. [DOI] [PMC free article] [PubMed] [Google Scholar]
- [47].Ziadni MS, Jaros S, Anderson SR, You DS, Darnall BD, Mackey SC. A longitudinal investigation of the impact of COVID-19 on patients with chronic pain. J Pain 2023;24:1830–42. [DOI] [PMC free article] [PubMed] [Google Scholar]
Associated Data
This section collects any data citations, data availability statements, or supplementary materials included in this article.
Supplementary Materials
Supplemental digital content associated with this article can be found online at http://links.lww.com/PR9/A234.