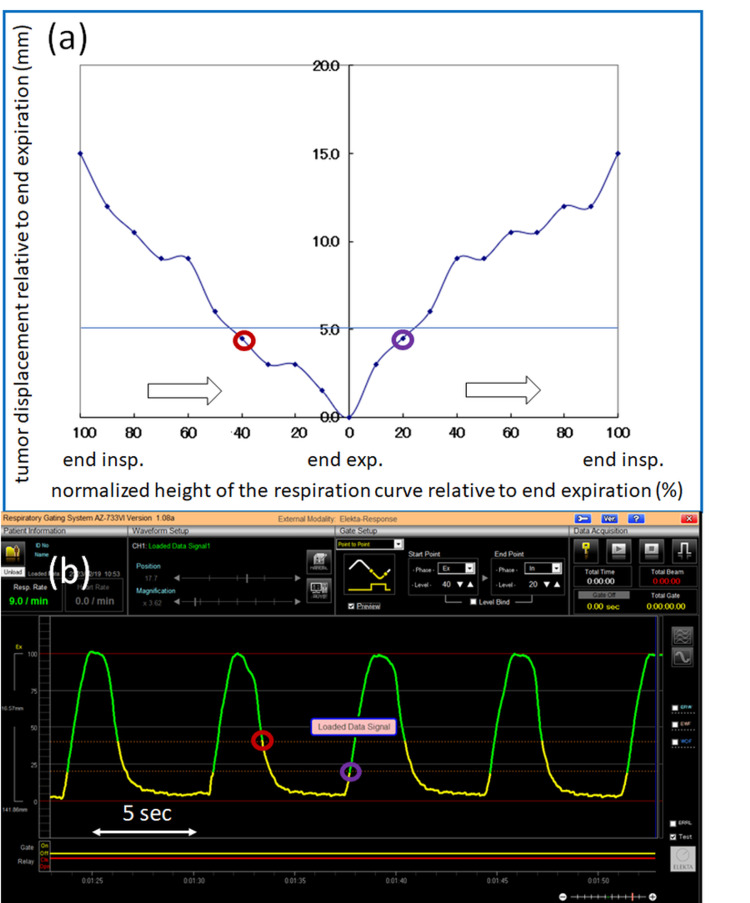
Figure 3. The tumor displacement in the superior-inferior direction and the corresponding respiration curve as a function of time.
(a) A plot of the tumor displacement in the superior-inferior direction relative to end-expiration measured on 4D CT images as a function of the normalized height of the respiratory curve relative to end-expiration measured by the laser sensor, where the right half of the horizontal axis shows the respiratory amplitude moving from end-expiration (0%) to end-inspiration (100%) in every 10% step, while the left half shows the respiratory amplitude moving from end-inspiration (100%) to end-expiration (0%) in every 10% step. In this plot, 20-phase CT images were generated and utilized. The white arrows indicate the time course. (b) A corresponding respiration curve as a function of time, measured by the laser displacement sensor. The beam-on and beam-off thresholds were individually configured on the respiration curve by correlating the tumor displacement with the respiration curve. In other words, the thresholds were defined with respect to the tumor displacement plot in (a) and the respiratory amplitude plot in (b), where the tumor displacement was obtained relative to end-expiration. In these figures, the two thresholds were defined on the respiratory curve where the tumor displacement was 5 mm. The red and purple circles in (a) and (b) are the thresholds giving the tumor displacement of 5 mm relative to end-expiration and the gate-on periods are shown in yellow in (b).
CT: computed tomography

