Abstract
To assess the concentration characteristics and ecological risks of potential toxic elements (PTEs) in water and sediment, 17 water samples and 17 sediment samples were collected in the Xiyu River to analyze the content of Cr, Ni, As, Cu, Zn, Pb, Cd and Hg, and the environmental risks of PTEs was evaluated by single-factor pollution index, Nemerow comprehensive pollution index, potential ecological risk, and human health risk assessment. The results indicated that Hg in water and Pb, Cu, Cd in sediments exceeded the corresponding environmental quality standards. In the gold mining factories distribution river section (X8-X10), there was a significant increase in PTEs in water and sediments, indicating that the arbitrary discharge of tailings during gold mining flotation is the main cause of PTEs pollution. The increase in PTEs concentration at the end of the Xiyu River may be related to the increased sedimentation rate, caused by the slowing of the riverbed, and the active chemical reactions at the estuary. The single-factor pollution index and Nemerow pollution index indicated that the river water was severely polluted by Hg. Potential ecological risk index indicated that the risk of Hg in sediments was extremely high, the risk of Cd was high, and the risk of Pb and Cu was moderate. The human health risk assessment indicated that As in water at point X10 and Hg in water at point X9 may pose non-carcinogenic risk to children through ingestion, and As at X8–X10 and Cd at X14 may pose carcinogenic risk to adults through ingestion. The average HQingestion value of Pb in sediments was 1.96, indicating that the ingestion of the sediments may poses a non-carcinogenic risk to children, As in the sediments at X8–X10 and X15–X17 may pose non-carcinogenic risk to children through ingestion.
Keywords: Potential toxic elements, Water, Sediments, Environmental risk
Subject terms: Environmental monitoring, Pollution remediation
Introduction
Potentially toxic elements (PTEs) contamination is considered one of the most prominent issues affecting water quality1. Most rivers in the world have been affected by varying degrees of PTEs pollution, and the pollution is increasing year by year2,3. PTEs entering rivers are easily stored in sediments. When the environmental conditions change, PTEs in sediments will be released into the water. Due to its high toxicity, resistance to decomposition, and bioaccumulation, it poses significant environmental risks to river ecosystems4–7. Moreover, PTEs pollution can enter the human body through drinking water or the food chain, posing a threat to human health8,9. Research has shown that a small amount of PTEs can lead to various cardiovascular diseases, respiratory diseases, and even cancer10–12.
The sources of PTEs in rivers include surface runoff, emissions from industrial and mining activities, and atmospheric deposition13. Rivers flowing through mining areas are more susceptible to the threat of tailings and mining waste discharge14,15. Tailings exposed to the air for a long time are prone to releasing PTEs into rivers through weathering, posing a threat to the ecological health of rivers. The PTEs contamination incidents caused by mining activities have frequently occurred, such as the indiscriminate discharge of tailings in the Dabaoshan Mining area has caused serious PTEs pollution in the Henghe River16, and the mining of Dexing copper mine has led to severe pollution of Jishui River, and the PTEs has spread to farmland soil through river irrigation17.
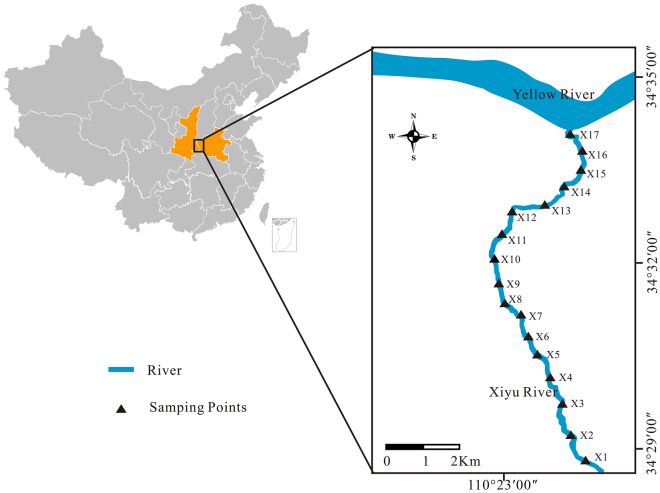
The gold mining in the research area can be traced back to 1104 of the Northern Song Dynasty, and large-scale mining began in 1975. The X8–X10 reaches of the Xiyu River is the main flotation area for gold mines (Fig. 1). In the last century, there was a period of disorderly mining, with many small artisanal Au mining flotation factories distributed on both sides of the river. These factories discharge the tailings, without any treatment, into the river channel18. It was not until the government issued a ban in 1996 that these small artisanal Au mining plants were significantly reduced, and the arbitrary discharge of tailings was curbed. However, the pollution caused by long-term disorderly mining to the environment of the mining area often persisted for a long time19,20. The present study collected the water samples and the sediment samples from the Xiyu River and measured the concentration of Cr, Ni, As, Cu, Zn, Pb, Cd, and Hg in the water and sediment. A comprehensive evaluation of PTEs pollution in the river was evaluated by single-factor pollution index, Nemerow comprehensive pollution index, potential ecological risk, and human health risk assessment. The objective of this study is to investigate the content and distribution characteristics of PTEs in the water and sediment of the Xiyu River, and to evaluate the ecological risk of PTEs pollution in the river. The results of the study will provide guidance for the protection of water systems in the Xiaoqinling mining area.
Figure 1.
Location of the study area and the distribution of sampling points.
Materials and methods
Study area
The Xiaoqinling gold mine is the second largest gold production area in China, mainly developing quartz vein type gold ores, accompanied by pyrite, galena, sphalerite, chalcopyrite, magnetite, etc.21. The research area is in northwest China (110°20′00′′ E–110°27′00′′ E, 34°25′00′′ N–34°34′00′′ N). It has a typical temperate zone terrestrial monsoon arid climate. The annual average temperature is 13.15 ℃, and the annual average precipitation is 623.8 mm.
The Xiyu River originates from the ridge of Qinling Mountains, flows through the Xiaoqinling Mining Area, and flows into the Yellow River in the northwest of Lingbao City. The river is about 15 km long and has a river basin area of 28 square kilometers. The sediment thickness of the river is generally 10–30 cm, with a greenish gray color and relatively fine particles. Except for the X8–X10 reaches, which is the main flotation area for gold mining, the other areas are mainly engaged in agricultural production activities (Fig. 1). Because Xiyu River is the boundary river between Shaanxi and Henan provinces, there are gold mining plants distributed on both sides of the river, making it one of the most severely polluted rivers in Xiaoqinling gold-mining region.
Sample collection and analysis
Seventeen sampling points were arranged with a spacing of approximately 1000 m from the upstream to downstream of the river (Fig. 1), collecting the surface water samples and the sediment samples at each point. The water sample were filtered through 0.45 μm glass fiber filter membranes immediately after collection to remove large suspended solids. Next, HNO3 was added to ensure the pH was less than 2, and then the samples were kept sealed at 4 °C22. Three adjacent locations were selected near each sampling point, and approximately 10 cm thick sediment was collected at each location. Then these three sediment samples were mixed into one as the final sample for each sampling point, and quickly stored the samples in a 4 ℃ refrigerator. The sediment samples used for PTEs determination were dried in the dark and ground to 100 mesh using an agate mortar. The concentrations of Cr, Ni, As, Cu, Zn, Pb, Cd in samples were determined by inductively coupled plasma mass spectrometer system (ICP-MAS, PE300D)23, and Hg was determined by atomic fluorescence spectrometer (AFS-9760)24. The recovery rates of PTEs contents in standard reference materials were between 90 and 110%.
Environmental risk assessment
Pollution index
Single-factor pollution index and Nemerow pollution index are often used to evaluate the pollution status of PTEs in water25,26. The single-factor pollution index was used to evaluate the pollution level of single PTE in water, and was calculated as shown in following equation:
| 1 |
where, Pi represents the single-factor pollution index of element i, Ci represents the actual concentration of i (mg L−1), and Bi represents the evaluation standard of i. In present study the surface water environmental quality standard of the National Environmental Protection Agency of China (GB 3838-2002) was used as the evaluation standard27.
Nemerow pollution index not only reflects the pollution degree of single PTE, but also describes the comprehensive pollution of multiple PTEs. Additionally, it highlights the impact and effect of the pollutant with the largest pollution index on environmental quality. It is a comprehensive method widely used for evaluating water environmental quality at present. The Nemerow pollution index was calculated as shown in Eq. (2)28.
| 2 |
where, Pi represents the single-factor pollution index of i; max (Pi) represents the maximum value of Pi, and ave (Pi) represents the average value of Pi. The classifications of Pi and Pn are shown in Table 129,30.
Table 1.
Classification of pollution levels of pi and Pn.
| Pi | Pollution level | Pn | Pollution degree |
|---|---|---|---|
| Pi < 1 | Unpolluted | Pn ≤ 0.7 | Safe |
| 1 ≤ Pi < 2 | Slightly polluted | 0.7 < Pn ≤ 1 | Precaution |
| 2 ≤ Pi < 3 | Moderately polluted | 1 < Pn ≤ 2 | Slight pollution |
| 3 ≤ Pi < 5 | Highly polluted | 2 < Pn ≤ 3 | Moderate pollution |
| Pi ≥ 5 | Very highly polluted | Pn > 3 | Heavy pollution |
potential ecological risks
The potential ecological risk index was proposed by Hakanson in 198031. This method evaluates PTEs pollution in soils or sediments from the perspective of sedimentology according to the nature of PTEs and environmental behavior characteristics. While considering the content of PTEs in the soil, this method links the ecological and environmental effects with toxicology and can more accurately represent the impact of PTEs on the ecological environment. The expressions are shown in the following equations:
| 3 |
| 4 |
| 5 |
where, is the pollution coefficient of element i, is the measured concentration value of i in sediment, mg kg−1; is the background value of i, derived from the element concentration in the nearby river sediments that are almost unaffected by human activities32; is the potential ecological risk index of i; is the toxicity response parameter of i. Specifically, the toxic response coefficient of PTEs is Hg = 40, Cr = 2, Cd = 30, As = 10, Pb = 5, Cu = 5, Zn = 1, Ni = 533; RI is the potential ecological risk index for multiple PTEs. The classification of potential ecological risk index is shown in Table 2.
Table 2.
Classification of potential ecological risk index.
| Ecological risk level | Low | Moderate | Considerable | High | Significantly high |
|---|---|---|---|---|---|
| < 40 | 40–80 | 80–160 | 160–320 | > 320 | |
| RI | < 150 | 150–300 | 300–600 | ≥ 600 | / |
Human health risk assessment
PETs can enter the human body through ingestion, skin absorption and respiration. For humans, ingestion and skin absorption are the two main exposure pathways of PTEs in water and sediments34,35. The daily dose of PTEs entering the human body through ingestion and skin absorption, and the carcinogenic risk and non-carcinogenic risk of PTEs to the human body were determined according to relevant documents from the US Environmental Protection Agency36, using the following equations37,38:
| 6 |
| 7 |
| 8 |
| 9 |
| 10 |
| 11 |
where ADDingestion and ADDdermal are the daily dose of ingestion and skin absorption respectively, Cs is PTE content in sediment, Cw is PTE content in water, Is is the daily intake of sediment, Iw is the average daily drinking water intake, EF is the exposure frequency, ED is the exposure time; BW is the average body weight, AT is the average exposure time; SA is the exposed area of skin; SL is skin adhesion factor; ABF is a skin adsorption factor. HQ is the hazard quotient and HI is the hazard index. The specific exposure parameters are shown in Table 3, and the RfD, CSF and Kp values of PTEs are shown in Table 439,40. HQ and HI are used to describe the non-carcinogenic risks of PTEs. When HQ or HI < 1, it indicates no non-carcinogenic health risks; On the contrary, it indicates the existence of potential non-carcinogenic health risks, and the higher the value, the higher the risk. CR and TCR are used to describe the carcinogenic risk of PTEs, when CR is less than 10–6, it indicates no carcinogenic risk. When CR is between 10–6 and 10–4, it indicates an acceptable risk range, and when CR is greater than 10–4, it indicates that PTEs in water or sediment are highly likely to pose a carcinogenic risk to humans36.
Table 3.
Exposure parameters for the health risk assessment models.
| Parameters | Unit | Value | |
|---|---|---|---|
| Child | Adult | ||
| Is | mg d−1 | 200 | 100 |
| Iw | L d−1 | 0.64 | 2 |
| EF | d year−1 | 350 | 350 |
| ED | years | 6 | 30 |
| BW | kg | 15 | 70 |
| AT | d | 2190 (For non-carcinogens) | 10,950 (For non-carcinogens) |
| 25,550 (For carcinogens) | 25,550 (For carcinogens) | ||
| SA | cm2 | 6600 | 18,000 |
| SL | mg cm−2 | 0.2 | 0.07 |
| ABF | / | 0.001 (For non-carcinogens) | 0.001 (For non-carcinogens) |
| 0.01 (For carcinogens) | 0.01 (For carcinogens) | ||
| ET | h | 1 | 0.58 |
Table 4.
RfD, SF and Kp of different exposure pathways of PTEs.
| Element | RfDingestion | RfDdermal | SFingestion | SFdermal | Kp (cm h−1) |
|---|---|---|---|---|---|
| (mg kg−1 day−1) | |||||
| Cr | 3.00E−03 | 6.00E−05 | – | – | 0.002 |
| Ni | 2.00E−02 | 5.40E−03 | – | – | 0.0002 |
| Cu | 4.00E−02 | 1.20E−02 | – | – | 0.001 |
| Zn | 3.00E−01 | 6.00E−02 | – | – | 0.0006 |
| As | 3.00E−04 | 1.23E−04 | 1.50E+00 | 3.66E+00 | 0.001 |
| Cd | 1.00E−03 | 1.00E−05 | 6.10E+00 | 6.10E+00 | 0.001 |
| Pb | 3.50E−03 | 5.25E−04 | 8.50E−03 | – | 0.0001 |
| Hg | 3.00E−04 | 2.10E−05 | – | – | 0.001 |
Results and discussion
PTEs in sediment and water
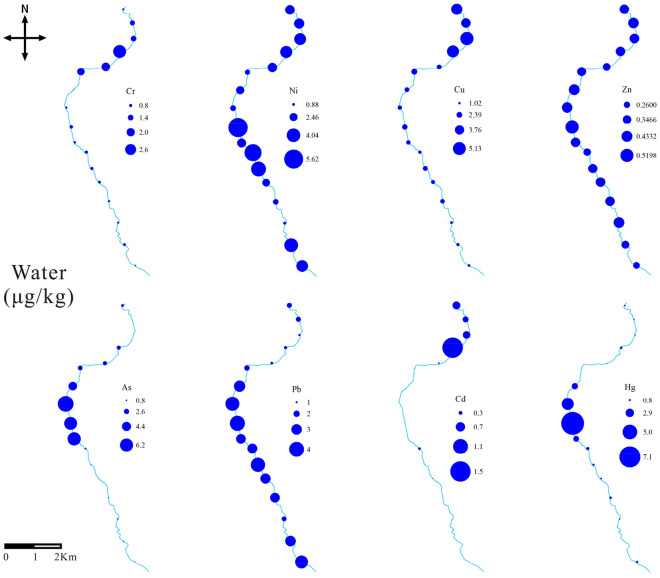
Table 5 presents the statistical results of PTEs concentrations in sediments and water of the Xiyu River. The concentrations of PTEs in the water, from high to low, was Ni > Cu > As > Pb > Hg > Cr > Zn > Cd. Except for Hg, the concentrations of other elements in water were within the limits of the corresponding national standards (GB 3838-2002)27. The average concentration of Hg in water was 1.34, which exceeded the standard by 13.4 times. In X8–X10 reaches of the river, the concentration of Hg was abnormally high (Fig. 2), which exceeded the standard by 45.2 times. The high Hg concentration in this reaches may be related to the distribution of mining plants, which used the amalgamation technique for gold flotation, and a large amount of tailings with Hg were discharged into the river, causing Hg pollution41. In the downstream of the river, there was a significant decrease in Hg, which may be due to the self-purification of the river, where lots of Hg in water deposited into the sediment42. In the reaches with gold mining plants distribution (X8–X10), the concentrations of Hg, As, Ni, and Cd in the water were the highest, indicating that these elements in the river may be related to the discharge of tailings. The concentration of PTEs in the water of the estuary reaches (X15–X17) showed an increasing trend, which may be related to the active chemical reactions in the estuary43. Compared with the river water worldwide (Table 6), the concentration of Hg was lower than that of the Tano River in Ghana and higher than that of other rivers. Cu, Zn, Pb, Cd were smaller than most rivers such as Tarapaya, Ganga, Khoshk, etc. This is due to the government's strong control over disorder gold mining activities.
Table 5.
PTEs contents in sediments and water of the Xiyu River.
| Items | Water (μg kg−1) | Sediment (mg kg−1) | ||||
|---|---|---|---|---|---|---|
| Range | Mean | GB 3838-2002 | Range | Mean | GB 15618-2018 | |
| Cr | 0.22–3.01 | 0.95 ± 0.71 | 50 | 66.98–125.39 | 90.95 ± 14.86 | 250 |
| Ni | 0.9–5.61 | 3 ± 1.21 | 20 | 32.75–113.33 | 58.6 ± 20.32 | 190 |
| Cu | 1.03–5.13 | 2.31 ± 1.26 | 1000 | 35.24–429.78 | 270.35 ± 140.47 | 100 |
| Zn | 0.26–0.52 | 0.37 ± 0.06 | 1000 | 68.61–337.78 | 162.53 ± 72.54 | 300 |
| As | 0.08–7.34 | 2.04 ± 2.29 | 50 | 5.47–37.72 | 17.75 ± 11.11 | 25 |
| Cd | 0.01–1.5 | 0.22 ± 0.37 | 5 | 0.16–12.1 | 1.81 ± 3.02 | 0.6 |
| Pb | 0.54–3.53 | 2.02 ± 0.97 | 50 | 28.3–1567.82 | 537.27 ± 395.54 | 170 |
| Hg | 0.07–7.59 | 1.34 ± 1.82 | 0.10 | 0.27–9.16 | 2.69 ± 2.17 | 3.4 |
Figure 2.
The distribution of PTEs in the water along Xiyu River.
Table 6.
Comparison of PTEs in the water and sediment of the Xiyu River with world’s rivers.
| River | Cr | Ni | Cu | Zn | As | Cd | Pb | Hg | |
|---|---|---|---|---|---|---|---|---|---|
| Present study | Water | 0.95 | 3 | 2.31 | 0.37 | 2.04 | 0.22 | 2.02 | 1.34 |
| Sediments | 90.95 | 58.6 | 270.35 | 162.53 | 17.75 | 1.81 | 537.27 | 2.69 | |
| Yangtze River44 | Water | 30 | / | 6950 | 22,720 | 190 | 260 | n.d. | 0.18 |
| Sediments | 0.25 | / | 315.76 | 334.53 | 61.55 | 3.51 | 46.46 | 0.0239 | |
| Taipu River45 | Water | 3 | 0.2 | 6 | 7 | 0.5 | 0.9 | 2 | / |
| Sediments | 80.58 | 36.93 | 48.81 | 144.22 | 13.15 | 0.32 | 38.24 | / | |
| Yellow River46 | Water | 0.08 | 1.89 | 1.78 | 1.79 | 2.37 | < 0.01 | 0.01 | ND |
| Sediments | 76.59 | 27.99 | 19.66 | 75.19 | 9.38 | 0.18 | 20.26 | 0.02 | |
| Muchawka47 | Water | / | 800 | 700 | 17,600 | / | 50 | 9300 | / |
| Sediments | / | 4.8 | 2.6 | 19.1 | / | 0.6 | 11.7 | / | |
| Khoshk48 | 190 | 80 | 30 | 1700 | / | 30 | 70 | / | |
| Sediments | 187.87 | 107.6 | 42.25 | 64.81 | / | 1.23 | 121.01 | / | |
| Ganga49 | Water | 725 | / | 125 | / | 153 | 59 | 163 | / |
| Sediments | 57.3125 | / | 19.122 | / | 0.14175 | 2.989 | 11.9675 | / | |
| Tano50 | Water | 266 | / | ND | 149 | 12 | 50 | 381 | 45 |
| Sediments | 25.4 | / | 3.42 | 21.1 | 1.78 | 1.3 | 4.67 | 1.24 | |
| Tarapaya14 | Water | / | / | 13 | 601 | / | 5 | 56 | / |
| Sediments | / | / | 296 | 9058 | / | 107 | 902 | / | |
| Old Brahmaputra51 | Water | 10 | 440 | 120 | 10 | / | 1 | 110 | 1 |
| Sediments | 6.6 | 12.8 | 6.2 | 52.7 | / | 0.48 | 7.6 | 0.001 | |
Where ND not detected, the units of water are all μg L−1, the units of sediment are mg kg−1.
The concentrations of PTEs in the sediments, from high to low, was Pb > Cu > Zn > Cr > Ni > As > Hg > Cd. The average concentrations of Pb, Cu, and Cd exceeded the corresponding national environmental quality standards (GB 15,618-2018) by 3.16, 2.70, and 3.01 times, respectively52. This result can be attributed to the relatively high content of Pb, Cu, and Cd in the tailings of the Xiaoqinling mining area. The tailings are randomly discharged into the river, leading to the release of PTEs into the river53,54.
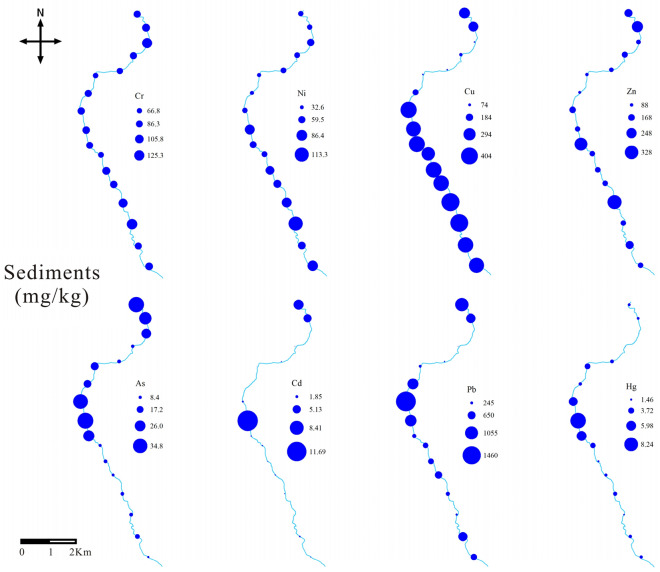
Figure 3 shows the distribution characteristics of PTEs in the sediment of Xiyu River. Pb, Cu, Zn, Ni, As, Hg, and Cd showed a significant increasing trend in the X8–X10 reaches, indicating that these elements are related to the emissions from gold flotation plants. There was no significant change in Cr, which indicates that Cr may come from a background source related to rock weathering. At the estuary, there was a significant increase in the concentration of PTEs, which may be due to that the estuary area is in the Yellow River alluvial plain area, where the riverbed slows down and the rate of PTEs deposition increases55.
Figure 3.
The distribution of PTEs in the sediments along Xiyu River.
Compared with rivers around the world, the Hg in the sediment of the Xiyu River was higher than that of other rivers in Table 6. This result is like that of water in the Xiyu River, attributed to the discharge of tailings from gold flotation plants. Cu, Cr, and Cd in sediments were smaller than those in the Tarapaya River in the United States, which was polluted by tailings, but larger than most of the rivers in Table 6.
Risk assessment of PTEs in water
Single-factor pollution index and Nemerow pollution index
Figure 4 shows the single-factor pollution index and Nemerow pollution index of PTEs in water of the Xiyu River. Except for Hg, the Pi of other elements was less than 1, indicating an unpolluted state. The average Pi of Hg was 13.42, which represented extremely severe pollution, indicating that Hg is the main pollutant in the water. The average value of Pn in the Xiyu River was 9.5, indicating heavy pollution in PTEs. Pn, as well as Pi of Hg, increased first and then decreased. In the X8-X10 reaches, the values of Pn and Pi of Hg were the highest, indicating that the main contribution of Pn comes from Hg.
Figure 4.
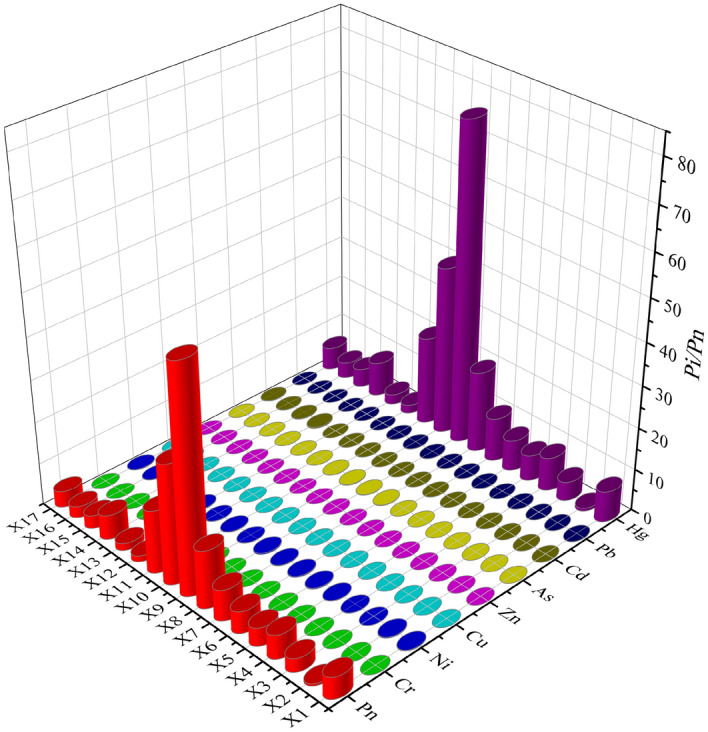
Pi and Pn of PTEs in the water of Xiyu River.
Health risk assessment of PTEs in water
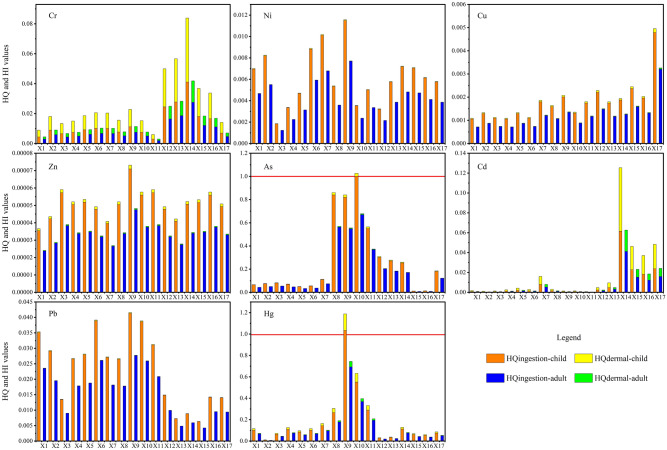
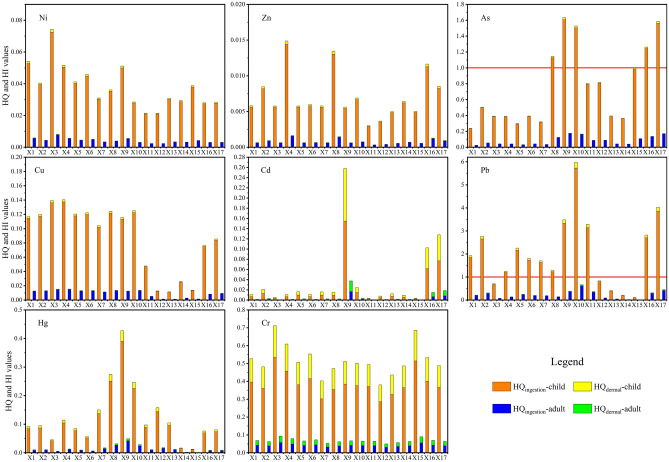
Figure 5 shows the non-carcinogenic coefficients HQ and HI for children and adults caused by ingestion and skin contact of the Xiyu River water. The average HQingestion, HQdermal, and HI of children and adults were all less than 1, while the HQingestion of As for children was 1.001 at X10, the HQingestion of Hg for children was 1.035 at X9, indicating that the intake of river water from these two reaches may pose a non-carcinogenic risk of As or Hg to children. HQ and HI for children were significantly higher than those for adults, indicating that PTEs in water are more toxic to children, and children should be kept away from polluted river to avoid poisoning caused by contact or ingestion of polluted river water.
Figure 5.
HQ and HI in the Xiyu River water.
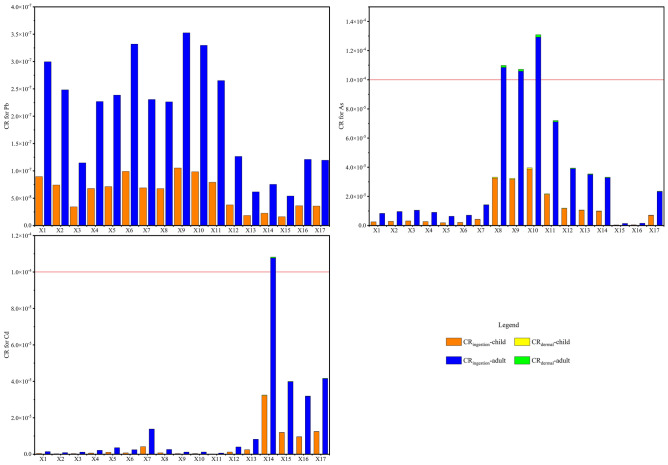
Figure 6 shows the carcinogenic risk index CR. The average CR of As, Cd, and Pb for children and adults were within 10–4, the acceptable carcinogenic risk stated by the US Environmental Protection Agency. However, at the X8-X10 of the river, the CR of As for adults was 1.16 × 10⁻⁴, and at the X14 point, the CR of Cd for adults was 1.08 × 10⁻⁴, which are greater than 10–4 and may pose a certain As or Cd carcinogenic risk to adults. The CR of children is significantly lower than that of adults, which may be attributed to the larger skin area and more water intake of adults.
Figure 6.
CR of the Xiyu River water.
Risk assessment of PTEs in sediments
Potential ecological risk assessment
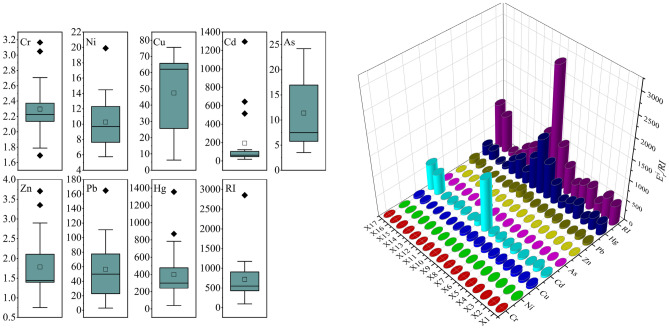
Figure 7 shows the potential ecological risk index of PTEs in the sediment of the Xiyu River. The Eri of Cr, Ni, As, and Zn were all less than 40, indicating a relatively low potential ecological risk. The average Eri of Cu and Pb were 47.5 and 56.5, respectively, indicating moderate risk. The average Eri of Cd was 193.7, indicating high risk, and the average Eri of Hg was 398.4, indicating significantly high risk. The potential ecological risk index RI of the PTEs ranges from 97.44 to 2852.45, with significant changes. The average RI was 721.8, indicating high potential ecological risk. The RI value was the highest in the area (X8–X10) where the gold mining flotation factories were located, indicating that the potential ecological risk in the sediments of Xiyu River is mainly caused by gold mining activities.
Figure 7.
Potential ecological risk index of the Xiyu River Sediments.
Health risk assessment of PTEs in sediments
Figure 8 shows the non-carcinogenic risk indices HQ and HI in the Xiyu River sediments. The results showed that HQingestion, HQdermal, and HI of Cr, Ni, Cu, Zn, Cd, and Hg for children and adults were all less than 1, indicating that these PTEs may not pose non-carcinogenic risk to children and adults through ingestion and skin contact. The average HQingestion of Pb was 1.96, indicating that the intake of sediments may poses a non-carcinogenic risk of Pb to children. The HQingestion values of As were 1.41 and 1.26 in the factories distribution river section (X8–X10) and the estuary river section (X15–X17), respectively, which were higher than 1, indicating that the intake of sediments in these river sections may poses a non-carcinogenic risk to children. The non-carcinogenic risk of the PETs in water and sediments to children is higher than that to adults, which may be related to the daily behavior and physiological activities of children56.
Figure 8.
HQ and HI of the Xiyu River sediments.
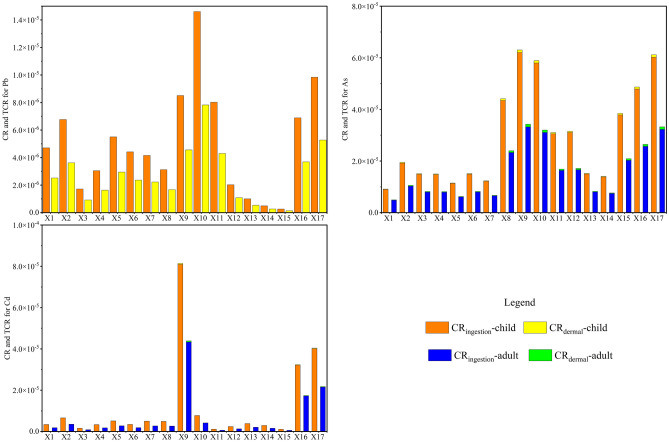
Figure 9 shows the carcinogenic risk index CR and TCR of PTEs in sediments of the Xiyu River. The result showed that the CRingestion, CRdermal, and TCR of As, Cd, and Pb for children and adults were all less than 10–4, indicating that the carcinogenic risk is within an acceptable range. The CRingestion of children and adults was much higher than CRdermal, indicating that ingestion of sediments in the Xiyu River is the main pathway leading to cancer in children and adults.
Figure 9.
CR and TCR of the sediments in Xiyu River.
Conclusion
Monitoring and evaluating the river environment is of great significance for protecting the ecological environment of river basins. The present study system collected 17 sediment samples and 17 water samples from the Xiyu River and comprehensively evaluated the ecological risks of the river. The results indicated that the concentrations of PTEs in the water, from high to low, was Ni > Cu > As > Pb > Hg > Cr > Zn > Cd, and the concentrations of PTEs in the sediments, from high to low, was Pb > Cu > Zn > Cr > Ni > As > Hg > Cd. Due to long-term disordered gold mining activities, the Hg in the water exceeded the corresponding environmental quality standards, and the Pb, Cu, and Cd in the sediment exceeded the corresponding environmental quality standards. In the factories distribution river section (X8–X10), there was a significant increase in PTEs in water and sediments, indicating that the arbitrary discharge of tailings during gold mining flotation is the main cause of PTEs pollution in the Xiyu River. The increase in PTEs content at the end of the Xiyu River may be related to the increased sedimentation rate, caused by the slowing of the riverbed, and the active chemical reactions at the estuary.
The single-factor pollution index and Nemerow pollution index indicated that the river water was severely polluted by Hg. Potential ecological risk index indicated that the risk of Hg in sediments was extremely high, the risk of Cd was high, and the risk of Pb and Cu was moderate. The human health risk assessment indicated that As in water at point X10 and Hg in water at point X9 may pose a non-carcinogenic risk to children through ingestion, and As at X8–X10 and Cd at X14 may pose a carcinogenic risk to adults through ingestion. The average HQingestion value of Pb in sediments was 1.96, indicating that the ingestion of the sediments may poses a non-carcinogenic risk to children, As in the sediments at X8–X10 and X15–X17 may pose a non-carcinogenic risk to children through ingestion. The non-carcinogenic risk of the PETs in the water and sediments to children was higher than that to adults, while the carcinogenic risk of the PETs in the water and sediments to children was lower than that to adults.
It is recommended to strengthen the control of disordered gold mining plants, avoid the arbitrary discharge of tailings during gold flotation, and take necessary treatment measures for river reaches with severe PTEs pollution.
Acknowledgements
The Project Supported by the Research Project of Shaanxi Provincial Land Engineering Construction Group in China (DJNY-YB-2023-24, DJNY-YB-2023-29), the Natural Science Basic Research Program of Shaanxi (2023-JC-QN-0343), the Scientific Research Item of Shaanxi Provincial Land Engineering Construction Group (DJTD-2024-01), Fundamental Research Funds for the Central Universities (Chang’an University), CHD (300102352504), and the Technology Innovation Center for Land Engineering and Human Settlements, Shaanxi Land Engineering Construction Group Co., Ltd. and Xi’an Jiaotong University (2024WHZ0235, 2024WHZ0232).
Author contributions
Sample collection and data analysis, Yuhu Luo and Na Wang; methodology, Yuhu Luo and Na Wang; Software, Zhe Liu; writing—original draft preparation, Yuhu Luo and Zhe Liu; writing—review and editing, Yingying Sun and Nan Lu; All authors have read and agreed to the published version of the manuscript.
Data availability
All data generated and analysed during this study are included in this published article.
Competing interests
The authors declare no competing interests.
Footnotes
Publisher's note
Springer Nature remains neutral with regard to jurisdictional claims in published maps and institutional affiliations.
References
- 1.Ahmad MK, Islam S, Rahman S, Haque MR, Islam MM. Heavy metals in water, sediment and some fishes of Buriganga River, Bangladesh. Int. J. Environ. Res. 2010;4:321–332. [Google Scholar]
- 2.Akcay H, Oguz A, Karapire C. Study of heavy metal pollution and speciation in Buyak Menderes and Gediz river sediments. Water Res. 2003;37:813–822. doi: 10.1016/S0043-1354(02)00392-5. [DOI] [PubMed] [Google Scholar]
- 3.Olivares-Rieumont S, et al. Assessment of heavy metal levels in Almendares River sediments—Havana City, Cuba. Water Res. 2005;39:3945–3953. doi: 10.1016/j.watres.2005.07.011. [DOI] [PubMed] [Google Scholar]
- 4.Zeng X, et al. Spatial distribution, health risk assessment and statistical source identification of the trace elements in surface water from the Xiangjiang River, China. Environ. Sci. Pollut. Res. Int. 2015;22:9400–9412. doi: 10.1007/s11356-014-4064-4. [DOI] [PubMed] [Google Scholar]
- 5.Eggleton J, Thomas KV. A review of factors affecting the release and bioavailability of contaminants during sediment disturbance events. Environ. Int. 2004;30:973–980. doi: 10.1016/j.envint.2004.03.001. [DOI] [PubMed] [Google Scholar]
- 6.Vaezi A, Lak R. Contamination and environmental risk assessment of potentially toxic elements in the surface sediments of Northwest Persian Gulf. Regional Stud. Mar. Sci. 2023;67:103235. doi: 10.1016/j.rsma.2023.103235. [DOI] [Google Scholar]
- 7.Vaezi A, Lak R. Sediment texture, geochemical variation, and ecological risk assessment of major elements and trace metals in the sediments of the Northeast Persian Gulf. Minerals. 2023;13:850. doi: 10.3390/min13070850. [DOI] [Google Scholar]
- 8.Nobi EP, Dilipan E, Thangaradjou T, Sivakumar K, Kannan L. Geochemical and geo-statistical assessment of heavy metal concentration in the sediments of different coastal ecosystems of Andaman Islands, India. Estuarine Coast. Shelf Sci. 2010;87:253–264. doi: 10.1016/j.ecss.2009.12.019. [DOI] [Google Scholar]
- 9.Uddin MM, Zakeel MCM, Zavahir JS, Marikar F, Jahan I. Heavy metal accumulation in rice and aquatic plants used as human food: A general review. Toxics. 2021;9:12. doi: 10.3390/toxics9120360. [DOI] [PMC free article] [PubMed] [Google Scholar]
- 10.Akpor OB, Muchie M. Remediation of heavy metals in drinking water and wastewater treatment systems: Processes and applications. Int. J. Phys. Sci. 2010;5:1807–1817. [Google Scholar]
- 11.Han ZX, Guo XY, Zhang BM, Liao JG, Nie LS. Blood lead levels of children in urban and suburban areas in China (1997–2015): Temporal and spatial variations and influencing factors. Sci. Total Env. 2018;625:1659–1666. doi: 10.1016/j.scitotenv.2017.12.315. [DOI] [PubMed] [Google Scholar]
- 12.Chakraborty AK, Saha KC. Arsenical dermatosis from tubewell water in West-Bengal. Indian J. Med. Res. 1987;85:326–334. [PubMed] [Google Scholar]
- 13.Streets DG, et al. Anthropogenic mercury emissions in China. Atmos. Env. 2005;39:7789–7806. doi: 10.1016/j.atmosenv.2005.08.029. [DOI] [Google Scholar]
- 14.Smolders AJP, Lock RAC, Van der Velde G, Hoyos RIM, Roelofs JGM. Effects of mining activities on heavy metal concentrations in water, sediment, and macroinvertebrates in different reaches of the Pilcomayo River, South America. Arch. Environ. Contam. Toxicol. 2003;44:314–323. doi: 10.1007/s00244-002-2042-1. [DOI] [PubMed] [Google Scholar]
- 15.Grimalt JO, Ferrer M, Macpherson E. The mine tailing accident in Aznalcollar. Sci. Total Env. 1999;242:3–11. doi: 10.1016/S0048-9697(99)00372-1. [DOI] [PubMed] [Google Scholar]
- 16.Fu S-M, et al. Environmental response to manganese contamination of Dabaoshan mine in environmental system of lower reaches. Acta Scienti. Natural. Univ. Sunyatseni. 2007;46:92–96. [Google Scholar]
- 17.Liu G, et al. Heavy metal speciation and pollution of agricultural soils along Jishui River in non-ferrous metal mine area in Jiangxi Province, China. J. Geochem. Explor. 2013;132:156–163. doi: 10.1016/j.gexplo.2013.06.017. [DOI] [Google Scholar]
- 18.Qiao, G., Xu, Y. N. & He, F. In Advances in Environmental Science and Engineering, PTS 1–6, vol. 518–523 5059–5062 (2012).
- 19.Salomons W. Environmental-impact of metals derived from mining activities—processes, predictions, prevention. J. Geochem. Explor. 1995;52:5–23. doi: 10.1016/0375-6742(94)00039-E. [DOI] [Google Scholar]
- 20.Jordan G, Project JP. Sustainable mineral resources management: From regional mineral resources exploration to spatial contamination risk assessment of mining. Environ. Geol. 2009;58:153–169. doi: 10.1007/s00254-008-1502-y. [DOI] [Google Scholar]
- 21.Fan HR, Xie YH, Zhai MG, Jin CW. A three stage fluid flow model for Xiaoqinling lode gold metallogenesis in the He' nan and Shaanxi provinces, central China. Acta Petrol. Sin. 2003;19:260–266. [Google Scholar]
- 22.Ministry of Ecology and Environment of the People's Republic of China. Water qualityTechnical regulation of the preservation andhandling of samples. HJ 493-2009 (2009).
- 23.Lin C, He M, Zhou Y, Guo W, Yang Z. Distribution and contamination assessment of heavy metals in sediment of the Second Songhua River. China. Environ. Monit. Assess. 2008;137:329–342. doi: 10.1007/s10661-007-9768-1. [DOI] [PubMed] [Google Scholar]
- 24.Lu S, Wang Y, Teng Y, Yu X. Heavy metal pollution and ecological risk assessment of the paddy soils near a zinc-lead mining area in Hunan. Environ. Monit. Assess. 2015;187:10. doi: 10.1007/s10661-015-4835-5. [DOI] [PubMed] [Google Scholar]
- 25.Mishra S, Kumar A, Shukla P. Estimation of heavy metal contamination in the Hindon River, India: An environmetric approach. Appl. Water Sci. 2021;11:1. doi: 10.1007/s13201-020-01331-y. [DOI] [Google Scholar]
- 26.Wu J, et al. Pollution, sources, and risks of heavy metals in coastal waters of China. Hum. Ecol. Risk Assess. 2020;26:2011–2026. doi: 10.1080/10807039.2019.1634466. [DOI] [Google Scholar]
- 27.Ministry of Ecology and Environment of the People’s Republic of China. Environmental Quality Standards for Surface Water. GB 3838-2002 (2002).
- 28.Chen H, Teng Y, Lu S, Wang Y, Wang J. Contamination features and health risk of soil heavy metals in China. Sci. Total Environ. 2015;512:143–153. doi: 10.1016/j.scitotenv.2015.01.025. [DOI] [PubMed] [Google Scholar]
- 29.Zhang C, Qiao Q, Piper JDA, Huang B. Assessment of heavy metal pollution from a Fe-smelting plant in urban river sediments using environmental magnetic and geochemical methods. Environ. Pollut. 2011;159:3057–3070. doi: 10.1016/j.envpol.2011.04.006. [DOI] [PubMed] [Google Scholar]
- 30.Cheng H, et al. Overview of trace metals in the urban soil of 31 metropolises in China. J. Geochem. Explor. 2014;139:31–52. doi: 10.1016/j.gexplo.2013.08.012. [DOI] [Google Scholar]
- 31.Hakanson L. AN ecological risk index for aquatic pollution-control—a sedimentological approach. Water Res. 1980;14:975–1001. doi: 10.1016/0043-1354(80)90143-8. [DOI] [Google Scholar]
- 32.Zhang JH, Zhao AN, Chen HQ, Xu YN, He F. Evaluation of potential ecological r isk of heavy- metal pollution in bottom mud of the Xiyu River in the Xiaoqinling gold mining area, China. Geol. Bull. China. 2008;27:89. [Google Scholar]
- 33.Guo, W. H., Liu, X. B., Liu, Z. G. & Li, G. F. In International Conference on Ecological Informatics and Ecosystem Conservation (ISEIS 2010), vol. 2 729–736 (2010).
- 34.Gao B, et al. Simultaneous evaluations of occurrence and probabilistic human health risk associated with trace elements in typical drinking water sources from major river basins in China. Sci. Total Environ. 2019;666:139–146. doi: 10.1016/j.scitotenv.2019.02.148. [DOI] [PubMed] [Google Scholar]
- 35.Xiao J, Wang L, Deng L, Jin Z. Characteristics, sources, water quality and health risk assessment of trace elements in river water and well water in the Chinese Loess Plateau. Sci. Total Environ. 2019;650:2004–2012. doi: 10.1016/j.scitotenv.2018.09.322. [DOI] [PubMed] [Google Scholar]
- 36.USEPA. Risk Assessment Guidance for Superfund Volume I: Human Health Evaluation Manual (Part E, Supplemental Guidance for Dermal Risk Assessment). (Office of Superfund Remediation and Technology Innovation U.S. Environmental Protection Agency, Washington DC, USA, 2004).
- 37.Cui YB, Bai L, Li CH, He ZJ, Liu XR. Assessment of heavy metal contamination levels and health risks in environmental media in the northeast region. Sustain. Cities Soc. 2022;80:103796. doi: 10.1016/j.scs.2022.103796. [DOI] [Google Scholar]
- 38.Wang Z, et al. Overview assessment of risk evaluation and treatment technologies for heavy metal pollution of water and soil. J. Clean. Prod. 2022;379:134043. doi: 10.1016/j.jclepro.2022.134043. [DOI] [Google Scholar]
- 39.Tong SM, Li HR, Tudi M, Yuan X, Yang LS. Comparison of characteristics, water quality and health risk assessment of trace elements in surface water and groundwater in China. Ecotoxicol. Environ. Saf. 2021;219:112283. doi: 10.1016/j.ecoenv.2021.112283. [DOI] [PubMed] [Google Scholar]
- 40.Gulan L, et al. Spa environments in central Serbia: Geothermal potential, radioactivity, heavy metals and PAHs. Chemosphere. 2020;242:125171. doi: 10.1016/j.chemosphere.2019.125171. [DOI] [PubMed] [Google Scholar]
- 41.Dai Q, Feng X, Qiu G, Jiang H. Mercury contaminations from gold mining using amalgamation technique in Xiaoqinling Region, Shanxi Province, PR China. J. Phys. IV. 2003;107:345–348. doi: 10.1051/jp4:20030312. [DOI] [Google Scholar]
- 42.Cukrov N, Cmuk P, Mlakar M, Omanovic D. Spatial distribution of trace metals in the Krka River, Croatia: An example of the self-purification. Chemosphere. 2008;72:1559–1566. doi: 10.1016/j.chemosphere.2008.04.038. [DOI] [PubMed] [Google Scholar]
- 43.Zhang JJ, et al. Heavy metal movement footprint in estuary area. J. Yangtze River Sci. Res. Inst. 2020;37:34–42. [Google Scholar]
- 44.Zhang LH, et al. Source apportionment, distribution, and risk assessment of heavy metals in water and sediment near a mining area in the middle reaches of the Yangtze River basin. J. Agro-Env. Sci. 2023;42:2059–2068. [Google Scholar]
- 45.Luo PC, et al. Seasonal variation characteristics and pollution assessment of heavy metals in water and sediment of Taipu River. Environ. Sci. 2023;44:3184–3197. doi: 10.13227/j.hjkx.202207057. [DOI] [PubMed] [Google Scholar]
- 46.Xie FY, et al. Spatial distribution, pollution assessment, and source identification of heavy metals in the Yellow River. J. Hazard. Mater. 2022;436:123909. doi: 10.1016/j.jhazmat.2022.129309. [DOI] [PubMed] [Google Scholar]
- 47.Kluska M, Jablonska J. Variability and heavy metal pollution levels in water and bottom sediments of the Liwiec and Muchawka Rivers (Poland) Water. 2023;15:233. doi: 10.3390/w15152833. [DOI] [Google Scholar]
- 48.Salati S, Moore F. Assessment of heavy metal concentration in the Khoshk River water and sediment, Shiraz, Southwest Iran. Environ. Monitor. Assess. 2010;164:677–689. doi: 10.1007/s10661-009-0920-y. [DOI] [PubMed] [Google Scholar]
- 49.Gupta V, et al. Heavy metal contamination in river water, sediment, groundwater and human blood, from Kanpur, Uttar Pradesh, India. Environ. Geochem. Health. 2023;45:1807–1818. doi: 10.1007/s10653-022-01290-0. [DOI] [PubMed] [Google Scholar]
- 50.Nyantakyi AJ, Akoto O, Fei-Baffoe B. Seasonal variations in heavy metals in water and sediment samples from River Tano in the Bono, Bono East, and Ahafo Regions, Ghana. Environ. Monitor. Assess. 2019;191:9. doi: 10.1007/s10661-019-7744-1. [DOI] [PubMed] [Google Scholar]
- 51.Bhuyan MS, et al. Monitoring and assessment of heavy metal contamination in surface water and sediment of the Old Brahmaputra River, Bangladesh. Appl. Water Sci. 2019;9:5. doi: 10.1007/s13201-019-1004-y. [DOI] [Google Scholar]
- 52.Ministry of Ecology and Environment of the People’s Republic of China. Soil environmental quality Risk control standard for soil contamination of agricultural land. GB 15618–2018 (2018).
- 53.Mao JW, et al. Gold deposits in the Xiaoqinling-Xiong'ershan region, Qinling Mountains, central China. Mineral. Deposit. 2002;37:306–325. doi: 10.1007/s00126-001-0248-1. [DOI] [Google Scholar]
- 54.Lu C, Wu YG, Hu SH, Raza MA, Fu YL. Mobilization and transport of metal-rich colloidal particles from mine tailings into soil under transient chemical and physical conditions. Environ. Sci. Pollut. Res. 2016;23:8021–8034. doi: 10.1007/s11356-016-6042-5. [DOI] [PubMed] [Google Scholar]
- 55.Zhang JH, Xu YN, Wu YG, Hu SH, Zhang YJ. Dynamic characteristics of heavy metal accumulation in the farmland soil over Xiaoqinling gold-mining region, Shaanxi China. Environ. Earth Sci. 2019;78:1. doi: 10.1007/s12665-018-8013-2. [DOI] [Google Scholar]
- 56.Jiang Y, et al. Source apportionment and health risk assessment of heavy metals in soil for a township in Jiangsu Province, China. Chemosphere. 2017;168:1658–1668. doi: 10.1016/j.chemosphere.2016.11.088. [DOI] [PubMed] [Google Scholar]
Associated Data
This section collects any data citations, data availability statements, or supplementary materials included in this article.
Data Availability Statement
All data generated and analysed during this study are included in this published article.


