

Summary
Key gene mutations are essential for colorectal cancer (CRC) development; however, how the mutated tumor cells impact the surrounding normal cells to promote tumor progression has not been well defined. Here, we report that PIK3CA mutant tumor cells transmit oncogenic signals and result in malignant transformation of intestinal epithelial cells (IECs) via paracrine exosomal arachidonic acid (AA)-induced H3K4 trimethylation. Mechanistically, PIK3CA mutations sustain SGK3-FBW7-mediated stability of the cPLA2 protein, leading to the synthetic increase in AA, which is transported through exosome and accumulated in IECs. Transferred AA directly binds Menin and strengthens the interactions of Menin and MLL1/2 methyltransferase. Finally, the combination of VTP50469, an inhibitor of the Menin-MLL interaction, and alpelisib synergistically represses PDX tumors harboring PIK3CA mutations. Together, these findings unveil the metabolic link between PIK3CA mutant tumor cells and the IECs, highlighting AA as the potential target for the treatment of patients with CRC harboring PIK3CA mutations.
Keywords: PIK3CA mutations, arachidonic acid, intestinal epithelial cells, malignant transformation, exosome, cPLA2, Menin, H3K4 trimethylation, VTP50469
Graphical abstract
Highlights
-
•
PIK3CA mutant tumor cells transform IECs into tumor cells and promote CRC progression
-
•
PIK3CA mutations enhance SGK3-FBW7-mediated cPLA2 stability and AA biosynthesis
-
•
AA directly binds with Menin and enhances H3K4 trimethylation in IECs
-
•
Combination of alpelisib and VTP50469 is an effective treatment for PIK3CA mutant CRC
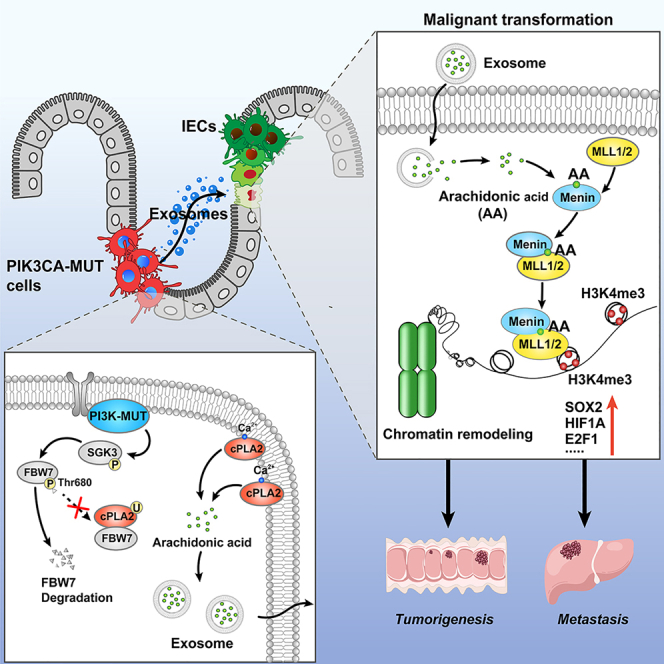
How the tumor cells harboring key gene mutations affect the malignant transformation of intestinal epithelial cells (IECs) and its role in colorectal cancer progression have not been defined. We report that PIK3CA mutant tumor cells transmit oncogenic signals and trigger malignant transformation of recipient IECs via paracrine exosomal arachidonic acid (AA)-induced histone methylation modification. Mechanistically, AA directly binds Menin and modulates the integrity of Menin-MLL1/2 interactions, thus transactivating a wide range of cancer-related transcription factors.
Introduction
Colorectal cancer (CRC) develops through accumulation of multiple acquired genetic and epigenetic alterations, including DNA methylation, histone acetylation, and histone methylation, that induce malignant transformation of normal colonic epithelium to adenocarcinoma.1,2,3 In the past decades, extensive efforts have been made to understand how tumor cells harboring key gene mutations affect their malignant cell behaviors.4,5,6 However, it is still not clear whether there exists a possibility that mutated tumor cells can trigger surrounding normal cells to malignant transformation.
Tumor initiation and progression requires the metabolic reprogramming of cancer cells.7,8 Unraveling the interplay between gene mutations and metabolic phenotype definitely plays a major role in understanding cancer pathogenesis and identifying novel therapeutic targets.9,10 Key gene mutations always cause abnormalities in the synthesis of metabolites, including asparagine,11 α-ketoglutarate,12 and glutamine.13 Evidence has suggested that metabolites modulated the redox balance, immune microenvironment, intestinal microecology, and pre-metastatic niche formation to support tumor growth.7 However, the contributions of mutated tumor-cell-derived metabolites to the malignant transformation of normal cells is not yet understood.
Among all human cancers, PIK3CA is one of the most frequently mutated oncogenes, making it a prime target for cancer therapy.14 Alpelisib, a selective PIK3CA inhibitor, has been approved for treating patients with breast cancer carrying PIK3CA mutations.15 Our previous work demonstrated that alpelisib has shown a better tumor inhibitory effect in PIK3CA mutant xenograft tumor compared to the isogenic wild-type (WT) tumor.16 However, early clinical trials have shown unsatisfactory responsiveness of alpelisib in the treatment of colon cancer containing PIK3CA mutations.17 In light of the fact that alpelisib selectively targets PIK3CA mutant tumor cells, this implies that targeting mutated tumor cells alone may be insufficient for the treatment of colon cancer.
In the current study, we revealed that PIK3CA mutant tumor cells transmit exosomal AA to IECs and trigger H3K4 trimethylation, resulting in malignant transformation of IECs. This process plays an important role in the evolution of IECs toward tumor cells. Thus, our findings define a biological property of mutant tumor cells and the causal link between mutant tumor cells and malignant transformation of IECs, highlighting the inspiring prospect of blocking the transmission pathway of malignant signaling from PIK3CA mutant cells toward interacting IECs, thus breaking new ground for the targeted therapy of patients with tumors.
Results
PIK3CA mutant tumor cells malignantly transform IECs into tumor cells and promote CRC progression
It is not clear how the PIK3CA mutated tumor cells impact the surrounding normal cells. To this end, we devised the direct education model as illustrated in Figure 1A. The results presented in Figures S1A–S1F demonstrate that xenograft tumors derived from a cell mixture of PIK3CA E545K tumor cells and NCM460 cells exhibited a higher incidence and more robust tumor growth rate compared to xenografts formed by a cell mixture of PIK3CA WT tumor cells and NCM460 cells, as well as the pure PIK3CA E545K or WT tumor cell groups. Notably, pure NCM460 cells failed to induce subcutaneous tumor formation. Furthermore, there was a significant presence of surviving NCM460 cells (red) in tumors derived from the cell mixture of PIK3CA mutant tumor cells and NCM460 cells, whereas only sporadic NCM460 cells (red) were detected in tumors derived from the cell mixture of WT tumor cells and NCM460 cells (Figure S1G). The findings suggest that PIK3CA mutant tumor cells may support the survival of NCM460 cells within xenograft tumors.
Figure 1.

Animal models demonstrate that PIK3CA mutant cells trigger malignant transformation of colon epithelial cells
(A) Workflow of the direct education model.
(B) Tumor incidence (left) and tumor volume (right) of subcutaneous xenografts established by NCM460 F2 cells (mean ± SEM, n = 10).
(C) Metastatic incidence (left) and survival (right) of mice bearing colon orthotopic tumors established by NCM460 F2 cells (mean ± SEM, n = 12).
(D) Metastatic incidence (left) and survival (right) of mice from the tail vein metastasis model established by NCM460 F2 cells (n = 8).
(E) Workflow of the far-end education model.
(F) Tumor incidence of NCM460 F1 xenografts (n = 10). The plotted lines of DLD1WT-107 NCM group, 107 NCM group, and 2 × 10⁷ NCM group overlapped.
(G) Tumor volume of NCM460 F2 tumors established using the indicated F1 xenografts (mean ± SEM, n = 10).
(H–K) Workflow (H) and representative macroscopic colon images (I), tumor counts (J), and survival (K) of mice (mean ± SEM, n = 8).
Statistical analyses, n.s., not significant; ∗p < 0.05; ∗∗p < 0.01.
Next, we evaluated biological functions of educated NCM460 F2 cells in vivo and in vitro. We observed that PIK3CA E545K tumor-cell-educated NCM460 cells exhibited comparable tumor-formative capacity (Figure 1B) and metastatic potentiality (Figures 1C, 1D, S2, and S3) with cells isolated from xenografts of pure PIK3CA WT tumor cells (GFP+ DLD1WT cells). Interestingly, PIK3CA WT tumor-cell-educated NCM460 cells failed to display neoplasm-forming capacity and metastatic phenotype (Figures 1B–1D, S2, and S3).
The results presented in Figure S4A demonstrate that PIK3CA E545K tumor-cell-educated NCM460 F2 cells exhibited significantly higher vitality, approaching the vitality levels of PIK3CA WT tumor cells. Malignant characteristics in epithelial cells are often associated with epithelial-mesenchymal transition (EMT) and gene copy-number variation (CNV). Clearly, the expression levels of EMT characteristic markers in PIK3CA E545K tumor-cell-educated NCM460 F2 cells were similar to those in PIK3CA WT tumor cells (Figure S4B). Furthermore, PIK3CA E545K tumor-cell-educated NCM460 F2 cells exhibited a high frequency of CNV throughout the genome, indicating genomic instability in these cells (Figure S4C). To investigate whether NCM460 cells can reciprocally influence the malignancy of tumor cells, we isolated tumor cells from xenograft tumors formed by mixed cells. Remarkably, NCM460-educated PIK3CA mutant or WT cells displayed cell viability similar to that of PIK3CA mutant or WT tumor cells derived from pure xenograft tumors (Figures S4D and S4E), indicating minimal impact of NCM460 cells on tumor cells. Consistent results were obtained with the direct education model involving PIK3CA H1047R tumor cells and NCM460 cells (Figure S5). Moreover, we further validated the malignant transformation of human primary colonic epithelial (PCE) cells initiated by PIK3CA mutant tumor cells (Figures S6 and S7). Collectively, the results provide compelling evidence that PIK3CA mutant tumor cells possess the capacity to initiate the malignant transformation of normal colonic epithelial cells.
We next set out to determine whether the transformation of PIK3CA mutant tumor cells in IECs depends on direct physical contact. As presented in Figure 1E, we employed the far-end education model, which consisted of three groups. Our observations revealed that PIK3CA mutant tumor cells can remotely induce non-tumorigenic NCM460 cells to form visible neoplasms, while PIK3CA WT cells lack this capability (Figures 1F and S8A–S8D). Importantly, no PIK3CA mutant tumor cells were detectable in the neoplasms formed by NCM460 cells (Figure S8E). We also observed that heterozygous PIK3CA mutant tumor cells possess instigating capacity (Figures S8F and S8G). Furthermore, the NCM460 cells educated remotely by PIK3CA mutant tumor cells exhibited comparable tumorigenicity to PIK3CA WT tumor cells, as evidenced by the nearly identical tumor incidences and tumor growth curves (Figures 1G, S8H, and S8I).
The successful instigation of PIK3CA mutant tumor cells led us to speculate that these cells may transmit malignant signals to surrounding cells through paracrine mechanisms. As anticipated, NCM460 cells and PIK3CA WT tumor cells treated with conditioned medium derived from PIK3CA mutant cancer donor cells exhibited enhanced in vitro functions (Figure S9). This observation was further supported by the azoxymethane/dextran sodium sulfate (AOM/DSS)-induced colorectal tumorigenesis model (Figure 1H). Treatment with conditioned medium from PIK3CA E545K tumor cells significantly promoted AOM/DSS-induced colorectal tumorigenesis, as evidenced by colon histology, tumor numbers, and mouse survival (Figures 1I–1K and S10). Collectively, the findings indicate that PIK3CA mutant tumor cells transmit malignant signals and initiate the malignant transformation of IECs through paracrine mechanisms.
Exosome components serve as key mediators undertaking the transmission of oncogenic mutation signals
The paracrine composition in the cell-culture supernatant primarily consists of soluble cytokines and extracellular vesicles (EVs), with exosomes being the predominant type of EVs.18 Initially, we isolated and validated exosomes derived from PIK3CA mutant tumor cells and WT tumor cells (Figures S11A–S11C). Interestingly, exosome components and conditioned medium derived from PIK3CA mutant tumor cells exhibited a comparable efficiency in enhancing cell viability of NCM460 recipient cells; when we depleted exosomes, the instigative ability of conditioned medium was completely abolished (Figures S12A and S12B), supporting the possibility that exosome components are responsible for the transfer of malignant signals from PIK3CA mutant tumor cells.
To further confirm this notion, we conducted in vivo experiments (Figure 2A). Consistently, both conditioned medium and exosome components derived from PIK3CA mutant tumor cells induced a tumorigenic phenotype in NCM460 recipient cells, as evidenced by the formation of visible neoplasms (Figures 2B and 2C). Treatment with conditioned medium or exosome components from PIK3CA mutant tumor cells significantly exacerbated AOM/DSS-induced colorectal tumorigenesis (Figures 2D–2H). The findings strongly validate the crucial role of exosome components as mediators in the transmission of oncogenic signals associated with PIK3CA mutations.
Figure 2.

Exosome components serve as key mediators transmitting gene mutation signals
(A–C) Workflow (A), tumor incidence (B), and tumor volume (C, mean ± SEM) of NCM460 xenografts pre-treated with the indicated medium or exosomes (n = 8). The plotted lines of exosome-free medium group and DLD1WT medium group overlapped.
(D–H) Workflow (D) and representative macroscopic colon images (E), H&E staining (F), tumor counts (G, mean ± SEM), and survival (H) of mice (n = 8). Scale bars in (F), 1,000 μm.
Statistical analyses, n.s., not significant; ∗p < 0.05; ∗∗p < 0.01; ∗∗∗p < 0.001.
Exosome-mediated AA serves as a key mediator in transmitting PIK3CA mutant signals
In our initial observations, we did not find any significant differences in the average size distribution and density of exosomes released by PIK3CA mutant and WT tumor cells (Figure S13A). This led us to hypothesize that the altered composition of exosomes might play a role in the intercellular transfer of malignant signals. Exosomes are known to contain a diverse range of contents, including growth factors, proteins, lipids, nucleic acids, non-coding RNAs, and metabolites.19 To identify the specific content responsible for transmitting oncogenic signals, we treated NCM460 cells with exosomes that had undergone enzymatic digestion using DNase I, RNAase, or protease K and then evaluated cell viability. Surprisingly, the removal of DNA, RNA, or protein from the exosomes did not affect the transmission of malignant signals (Figures S13B–S13D). The findings suggest that the targeted exosomal contents may not be responsible for transmitting the oncogenic signals released from PIK3CA mutant tumor cells.
Metabolic signatures play a crucial role in determining cell-fate transitions and can significantly affect cell behaviors.20,21 Given the striking oncogenic phenotype and tumorigenicity observed in educated IECs, we propose that the metabolites hidden in exosomes may control the transmission of malignant signals. To explore this hypothesis, we conducted an untargeted metabolomics analysis to examine the differences in metabolite composition. Notably, AA emerged as the most significantly upregulated metabolite among the differential metabolites in PIK3CA mutant donor cells, exosome components, and NCM460 recipient cells compared to their respective controls (Figures 3A and 3B). Interestingly, there was minimal disparity in AA levels between exosome-depleted medium from PIK3CA mutant cells and PIK3CA WT cells (Figures 3A, 3B, S14A, and S14B; Table S1). The findings led us to speculate that PIK3CA mutant cells are likely to transport AA to IECs via exosomes, thereby facilitating the transmission of malignant signals. To further substantiate our hypothesis, we quantify AA in five groups: (1) AA levels were significantly elevated in tumor tissues with PIK3CA mutations compared to PIK3CA WT tumors (Figure 3C); (2) sera from patients with CRC exhibited markedly higher levels of AA compared to healthy controls (Figure 3D); (3) sera from mice bearing PIK3CA mutant xenograft tumors displayed increased levels of AA (Figure 3E); (4) serum exosome components exhibited observable increases in AA levels compared to the exosome-depleted counterpart in the direct education model (Figure 3F); and (5) elevated levels of AA were observed in the serum of mice harboring the Pik3caH1047R/+ mutation (Figure 3G). Consequently, the measurement and comparison of AA in the aforementioned experimental models consistently support the notion that AA may serve as a key mediator in the transmission of malignant signals.
Figure 3.

Exosome-mediated AA undertaking transmission of the oncogenic mutation signals
(A) Heatmaps displaying top 20 differential metabolites (10 upregulated and 10 downregulated) in the indicated groups (n = 3).
(B) Quantitative abundance of AA in the indicated groups (mean ± SEM, n = 3).
(C) Quantitative abundance of AA in CRC tissues harboring WT or E545K mutant PIK3CA (mean ± SEM, n = 3).
(D) Quantitative abundance of serological AA in patient with CRC and healthy control subjects (mean ± SEM, n = 3).
(E) Quantitative abundance of serological AA in mice bearing indicated xenografts (mean ± SEM, n = 3).
(F) Quantitative abundance of AA in the indicated groups (mean ± SEM, n = 3).
(G) Quantitative abundance of serological AA in Pik3caH1047R/+ and Pik3ca+/+ mice (mean ± SEM, n = 3).
(H–K) Workflow (H) and representative macroscopic colon images (I), tumor counts (J, mean ± SEM), and survival (K) of mice (n = 8).
(L and M) Workflow (L) and tumor incidence of NCM460 F1 xenografts from the far-end education model (M, n = 10). The plotted lines of the DLD1E545K cPLA2 KO-NCM group and the DLD1WT-NCM group overlapped.
(N–Q) Workflow (N) and representative macroscopic colon images (O), tumor counts (P, mean ± SEM), and survival (Q) of mice (n = 8).
Statistical analyses, n.s., not significant; ∗p < 0.05; ∗∗p < 0.01; ∗∗∗p < 0.001.
We next presented five lines of evidence to validate the pivotal role of AA in transmitting malignant signals of PIK3CA mutant tumor cells toward IECs: (1) AA significantly enhanced AOM/DSS-induced colorectal tumorigenesis (Figures 3H–3K and S14C); (2) PIK3CA mutant tumor cells with cytosolic phospholipases knockout (cPLA2 KO) failed to remotely induce the tumorigenic phenotype in NCM460 cells (Figures 3L, 3M, S14D, and S14E); (3) exosome components from PIK3CA mutant tumor cells with cPLA2 KO attenuated tumorigenicity (Figures 3N–3Q and S14F); (4) AA conferred a similar capacity to the conditioned medium from PIK3CA WT tumor cells, comparable to its PIK3CA mutant counterpart, in enhancing NCM460 cell viability (Figures S15A–S15F); and (5) knockdown or KO of cPLA2, the synthetic enzyme for AA, significantly reduced AA levels in PIK3CA mutant tumor cells and disrupted their induction of malignant biological behaviors in NCM460 cells (Figures S15G–S15L). Overall, the data strongly support the notion that exosome-mediated AA serves as the key mediator responsible for transmitting PIK3CA mutant signals.
The PI3K-PDK1-SGK3 axis regulates cPLA2 protein stability by promoting FBW7 T680 phosphorylation, thereby enhancing AA biosynthesis
We next aimed to shed light on the mechanism by which PIK3CA mutant cells harbor elevated AA. We observed that cPLA2, the primary supplier of AA, exhibited significantly increased phosphorylation and total protein levels in the presence of the PIK3CA mutation, while the expression of PLA2G4A, the gene encoding cPLA2, remained unchanged (Figures 4A and S16A). Interestingly, we noticed a discrepancy in the alteration of cPLA2’s phosphorylation and total protein levels. Specifically, there was a 7- to 8-fold increase in total protein, whereas only a 3- to 4-fold increase in phosphorylation levels of cPLA2 was associated with the PIK3CA mutation (Figure 4A). We thus speculate that PIK3CA mutation may mainly be involved in the regulation of cPLA2 protein stability. Consistent with this hypothesis, we observed significant increases in protein stability and attenuated K48-linked ubiquitination of cPLA2 in the presence of the PIK3CA mutation (Figures 4B, 4C, and S16B). Treatment of cells with the proteasome inhibitor MG132 increased cPLA2 stabilization, supporting the ubiquitin-proteasome degradation pattern of cPLA2 (Figure S16C). Additionally, the PIK3CA mutation had minimal impact on K27-linked or K63-linked ubiquitination of cPLA2 (Figures S16D and S16E).
Figure 4.

Elucidating the molecular mechanisms of PIK3CA mutation modulating cPLA2 stability and AA biosynthesis
(A) Phosphorylated and total protein levels of cPLA2 in PIK3CA mutant and isogenic WT cells. Band intensity was quantified using ImageJ (mean ± SEM, n = 3).
(B) cPLA2 protein abundance was measured in indicated cells treated with 50 μM cycloheximide (CHX) for the indicated times.
(C) K48-linked ubiquitination of cPLA2 was measured in indicated cells.
(D) K48-linked ubiquitination of cPLA2 was measured in indicated cells.
(E) Quantitative abundance of AA in the indicated groups (mean ± SEM, n = 3).
(F) In vitro cPLA2 ubiquitination.
(G) Statistical analysis of FBW7 and cPLA2 expression levels in PIK3CA WT CRC tissues (n = 67) and PIK3CA mutant CRC tissues (n = 13). Data are presented as mean ± SEM.
(H) Evaluation of correlations between FBW7 and cPLA2 expression in PIK3CA WT CRC tissues (n = 67, left) and PIK3CA mutant CRC tissues (n = 13, right).
(I) Total serine (Ser)-linked phosphorylation and threonine (Thr)-linked phosphorylation of FBW7 were evaluated in the indicated cells.
(J) FLAG-tagged FBW7 WT or indicated mutant constructs were transfected into FBW7 KO cells. Cell lysates were immunoprecipitated with anti-FLAG agarose and blotted with the indicated antibodies.
(K) FLAG-tagged FBW7 WT or indicated mutant constructs were transfected into FBW7 KO cells, followed by treatment with DMSO or 20 μM 740 Y-P. Cell lysates were immunoprecipitated with anti-FLAG agarose beads and blotted with the indicated antibodies.
(L) FLAG-tagged FBW7 WT or T680A mutant constructs were transfected into FBW7 KO cells. FBW7 protein abundance was measured.
(M–P) Scrambled siRNA (NC) or siRNAs against SGK3 or PDK1 were transfected into DLD1 parental cells for 72 h. Cell lysates were immunoprecipitated with FBW7 antibody and blotted with the indicated antibodies (M and O). Quantitative abundance of AA in those cells were measured (N and P, mean ± SEM, n = 3).
(Q) Diagram summarizing the proposed model for the PI3K-PDK1-SGK3 signaling phosphorylating FBW7 at Thr680, leading to the increased stability of cPLA2 protein and enhanced biosynthesis of AA.
Statistical analyses, ∗∗p < 0.01; ∗∗∗p < 0.001.
We then proceeded to elucidate the molecular mechanisms by which the PIK3CA mutation modulates cPLA2 ubiquitination and stability. We employed an unbiased approach to identify intracellular cPLA2-binding factors in PIK3CA mutant and WT tumor cells. Interestingly, among the potential cPLA2-binding proteins, only E3 ligase, F box, and WD repeat domain-containing 7 (FBW7) exhibited weaker interaction with cPLA2 in PIK3CA mutant tumor cells (Figure S16F and Table S2). Consistently, FBW7 physically interacted with less cPLA2 in PIK3CA mutant cells (Figure S16G). KO of FBW7 indeed resulted in reduced cPLA2 ubiquitination and a concomitant increase in cPLA2 total protein and AA levels (Figures 4D and 4E). To further prove that FBW7 is an E3 ubiquitin ligase of cPLA2, we performed in vitro ubiquitination assays and observed that FBW7 can directly ubiquitinate cPLA2 (Figure 4F).
In addition, FBW7 knockdown enhanced the instigative ability of PIK3CA WT cells upon NCM460 cells (Figures S16H and S16I). Moreover, the expression patterns and prognostic indications of FBW7 and cPLA2 exhibited opposite trends in PIK3CA mutant and WT tumor tissues (Figures 4G and S16J). As a tumor suppressor, low levels of FBW7 predicted a worse prognosis, whereas increased levels of the oncoprotein cPLA2 indicated an unfavorable prognosis (Figures S16K and S16L). Furthermore, we observed significant negative correlations between FBW7 and cPLA2 protein levels in both PIK3CA mutant and WT tumor tissues, with a stronger correlation in the PIK3CA mutant group (Figure 4H).
Notably, the FBW7 mRNA level was barely affected (Figure S17A), despite the significant downregulation of protein abundance observed with PIK3CA mutations (Figure 4C). Previous reports indicated that FBW7 undergoes degradation dependent on phosphorylation.22 Thus, we formulated the hypothesis that PIK3CA mutation might trigger phosphorylation-mediated self-degradation of FBW7. To investigate this, we consulted the PhosphoSitePlus knowledge base to identify potential phosphorylation modification sites of FBW7 (Figure S17B). We then examined the levels of total serine (Ser)-linked phosphorylation and threonine (Thr)-linked phosphorylation of FBW7 in the presence of PIK3CA mutation. Interestingly, PIK3CA mutations with two hotspots consistently increased the total Thr-linked phosphorylation levels of FBW7 without affecting Ser-linked phosphorylation (Figure 4I). To determine the specific threonine residue(s) of FBW7 phosphorylated by phosphatidylinositol 3-kinase (PI3K) activity, we introduced mutations at different Thr-phosphorylation sites in FBW7. The FBW7 T680A mutant almost completely abolished Thr-linked phosphorylation of FBW7 (Figure 4J). In contrast, the Thr-linked phosphorylation of other FBW7 mutant proteins, including T205A, T692A, and T695A, resembled that of the FBW7 WT protein (Figure 4J). Moreover, while the activation of PI3K activity failed to enhance Thr-linked phosphorylation of the FBW7 T680A mutant, it clearly increased Thr-linked phosphorylation of the other three FBW7 mutant proteins, along with an increase in PI3K downstream substrate activity (Figure 4K). Furthermore, the FBW7 T680A mutant exhibited higher stability compared to the WT protein, suggesting reduced degradation of the phospho-deficient FBW7 T680A mutant (Figure 4L). The data indicate that oncogenic PIK3CA signaling specifically destabilizes FBW7 by triggering phosphorylation of FBW7 at Thr680.
To dissect the signaling cascade that links the active PI3K and FBW7 phosphorylation, we searched for kinases differentially interacting with FBW7 among PIK3CA mutant and WT tumor cells. Among the potential FBW7-binding proteins, six kinases—serum/glucocorticoid regulated kinase family member 3 (SGK3), phosphoglycerate kinase 1 (PGK1), serine/threonine kinase 39 (STK39), cyclin-dependent kinase 1 (CDK1), and aurora kinase B (AURKB)—were selected for further validation (Figure S17C and Table S3). We first showed that silencing of PGK1, STK39, CDK1, or AURKB had negligible impact on threonine-linked phosphorylation and total protein level of FBW7 and cPLA2 protein abundance (Figure S17D). Notably, silencing of SGK3 evidently attenuated the Thr-linked phosphorylation of FBW7, with a concomitant increase in FBW7 protein level and decrease in cPLA2 protein level and AA abundance in PIK3CA mutant tumor cells (Figures 4M, 4N, S17E, and S17F). To further evaluate FBW7 as a candidate substrate for SGK3 signaling, we developed a custom antibody that specifically recognized the FBW7 T680 phosphorylation site (Figure S17G). Consistent with our observations, the reduction in FBW7 T680 phosphorylation occurred upon SGK3 silencing but not when silencing the other five kinases (Figures 4M and S17H). Moreover, immunoprecipitation revealed a greater interaction between SGK3 and FBW7 in PIK3CA mutant cells (Figure S17I). The results suggest that SGK3 is the key downstream signaling molecule of active PI3Kα responsible for phosphorylating FBW7 at Thr680.
Previously, it was reported that peptidyl-prolyl cis-trans isomerase NIMA-interacting 1 (Pin1) is involved in the phosphorylation-dependent degradation of FBW7.23 Thus, we hypothesized that active PI3Kα kinase promotes the degradation of FBW7 in a Pin1-dependent manner. Supporting this hypothesis, we observed a stronger interaction between FBW7 and Pin1 in PIK3CA mutant cells (Figure S18A). In addition, silencing Pin1 resulted in increased stability of the FBW7 protein and reduced levels of AA (Figures S18B and S18C).
The PDK1/SGK3 signaling pathway has been proposed as a downstream effector of AKT-independent PI3Kα oncogenic signaling.24 Hence, we investigated whether FBW7 T680 phosphorylation triggered by active PI3Kα is independent of AKT. First, in line with our findings, treatment with the PI3Kα selective inhibitor BYL719 (alpelisib) significantly impaired the viability of NCM460 cells, accompanied by decreased AA abundance (Figures S19A and S19B). Subsequently, knockdown of PDK1 resulted in reduced FBW7 phosphorylation, increased FBW7 protein levels, and the reduction of cPLA2 protein and AA abundance, reminiscent of the similar observation when SGK3 was silenced (Figures 4O and 4P). PTEN loss leads to the activation of the PI3K/PDK1/SGK3 signaling pathway.25 We observed that PTEN knockdown activated PDK1/SGK3 signaling and enhanced FBW7 T680 phosphorylation, with concomitant decrease in FBW7 protein level, increase in cPLA2 protein level, and AA abundance in PIK3CA WT cells (Figures S19C and S19D). Moreover, NCM460 cells treated with conditioned medium derived from DLD1WT PTEN knockdown cells exhibited enhanced cell-proliferative ability (Figures S19E and S19F). Interestingly, neither genetic knockdown nor pharmacological inhibition (GDC0068) of AKT had any impact on the instigation of NCM460 cells, phosphorylation of FBW7, protein levels of FBW7 and cPLA2, or AA abundance triggered by PIK3CA mutation (Figures S19G–S19K). The PI3K/PKCζ/cPLA2 axis was previously proposed to regulate AA levels in the context of PIK3CA mutation. We observed that PKCζ knockdown barely impacts FBW7 T680 phosphorylation and total protein levels of FBW7 and cPLA2 (Figure S19L). In summary, our model establishes the biological connections between previously unrelated components, linking PI3K signaling and cPLA2 homeostasis, thereby enhancing AA metabolism (Figure 4Q).
Arachidonic acid impacts chromatin remodeling via H3K4me3
In AA downstream metabolic cascade, cyclooxygenase 1 (COX1), COX2, or prostaglandin (PG) endoperoxide H synthases catalyze AA into PGs (PGD2 and PGE2).26 We thus sought to investigate whether these downstream metabolites of AA mediate oncogenic signals from PIK3CA mutant tumor cells to NCM460 cells. Surprisingly, we observed that the levels of PGD2 or PGE2 in the sera or tumor tissues of PIK3CA mutant patients with CRC were almost equivalent to those in the PIK3CA WT group, which did not coincide with the alteration of AA (Figures S20A and S20B). Importantly, silencing COX1 or COX2 failed to attenuate the enhancement of NCM460 cell viability induced by AA (Figures S20C and S20D). Consequently, we conclude that the downstream metabolic cascade of AA is not significantly activated in the presence of PIK3CA mutation.
Previous studies revealed that AA can modulate the expression of numerous genes in colon cancer cells27; however, the underlying mechanisms have remained largely unclear. Our RNA-sequencing (RNA-seq) data demonstrated that the expression levels of 1,312 genes were upregulated while 741 genes were downregulated in AA-treated NCM460 cells compared to the control (Figures 5A and 5B). Extensive changes in gene expression are often closely linked to chromatin remodeling. Therefore, we investigated the chromatin accessibility status in AA-treated NCM460 cells using the assay for transposase-accessible chromatin with sequencing (ATAC-seq). We observed that 1,812 genes exhibited increased accessibility, while 567 genes showed decreased accessibility, in AA-treated NCM460 cells compared to the control (Figures 5C and 5D).
Figure 5.

AA impacts chromatin remodeling via H3K4me3
(A) Heatmap of RNA-seq analyses of NCM460 cells treated with DMSO or AA (10 μM).
(B) Pie chart displaying the upregulated genes and downregulated genes in AA-treated NCM460 cells compared to the control group (upper panel). Overview of gene ontology (GO) enrichment analysis of the differential gene profiles (lower panel).
(C) Heatmap showing clustering of ATAC-seq data of NCM460 cells treated with DMSO or AA (10 μM).
(D) Pie chart illustrating the open genes and closed peaks in AA-treated NCM460 cells compared to the control group (upper panel). Overview of GO enrichment analysis of the differential genes (lower panel).
(E) Venn diagram summarizing the intersected genes involved in ATAC-seq and RNA-seq (left). Gene tracks of the eight TF loci with corresponding ATAC-seq coverage files (right).
(F) Histone trimethylation markers were detected in NCM460 cells treated with DMSO or AA (10 μM).
(G) ChIP-seq analysis of H3K4me3 in NCM460 cells treated with DMSO or AA (10 μM).
(H) Gene tracks of the eight TF loci with corresponding ChIP-seq coverage files.
(I) Heatmap showing clustering of ATAC-seq data of NCM460 cells treated with DMSO, 10 μM AA, or 10 μM AA plus 50 μM MM-102.
(J) Gene tracks of the eight TF loci with corresponding ATAC-seq coverage files.
Transcription factors (TFs) play a crucial role in regulating tumor development and malignant progression by regulating gene expression. Thus, we conducted an intersection analysis of the upregulated gene set from RNA-seq data and the open gene set from ATAC-seq (Table S4. Differential transcripts of RNA-seq data using NCM460 cells treated with DMSO or AA, related to Figure 5A, Table S5. Differential peaks of ATAC-seq data using NCM460 cells treated with DMSO or AA, related to Figure 5C, Table S6. Intersected genes of RNA-seq data and ATAC-seq data, related to Figure 5E). Among the 88 genes that overlapped, we identified eight cancer-related TFs—SOX2, HIF1A, E2F1, ELF3, IRF6, MYB, ASCL2, and EHF—that exhibited upregulated expression and were in an open state in related chromatin regions after AA stimulation (Figure 5E). The gene tracks of these eight TFs showed significantly increased accessibility in AA-treated NCM460 cells compared to control NCM460 cells (Figure 5E). Consistently, we observed a significant enhancement in the accessibility of the eight TFs in PIK3CA mutant cell-educated NCM460 cells compared to PIK3CA WT cell-educated NCM460 cells or the NCM460 cell line (Figures S21A–S21D). More importantly, expression of eight TFs was significantly reduced in NCM460 cells treated with DLD1E545K cPLA2 KO cells; while exogenous AA assisted DLD1E545K cPLA2 KO cells in restoring the gene expression (Figure S21E). The findings suggest that AA may induce the expression of a wide range of cancer-related TFs by regulating chromatin remodeling in IECs.
The primary mechanisms that can impact chromatin remodeling in cells include DNA methylation, histone acetylation, and histone methylation.28 First, AA treatment barely impacted DNA methylation (Figure S22A). Furthermore, we observed that AA stimulation did not significantly alter several histone acetylation markers (Figure S22B). Moreover, the enrichments of those histone acetylation markers on promoter region of SOX2 gene do not show significant changes after AA treatment (Figure S22C). The data indicate that transcriptional regulation of downstream oncogenic genes by AA may not rely on DNA methylation or histone methylation.
In addition, conditioned medium or exosome components from tumor donor cells had no impact on the phosphorylation and total protein level of cPLA2 in NCM460 cells (Figure S22D). Moreover, reduced levels of AA were observed in NCM460 cells treated with conditioned medium from PIK3CA mutant tumor cells with cPLA2 KO, lowering them to levels equivalent to those in NCM460 cells treated with PIK3CA WT medium (Figure S22E). The findings suggest that conditioned medium from PIK3CA mutant tumor cells directly transport AA to NCM460 cells rather than activating the biosynthesis of AA within NCM460 cells.
We then investigated the impact of AA on histone methylation. Interestingly, AA treatment led to a significant increase in the levels of histone H3K4 trimethylation (H3K4me3) in NCM460 cells, while histone trimethylation at other sites, including H3K4, H3K9, H3K36, and H3K76, remained unaffected (Figure 5F). The observation was further substantiated in educated NCM460 F2 cells and PCE F2 cells from the direct education model (Figures S23A and S23B). Next, we performed chromatin immunoprecipitation sequencing (ChIP-seq) to examine H3K4me3 modification in the promoter chromatin state of AA-treated NCM460 cells. As illustrated in Figure 5G and Table S7, specific analysis of the promoter regions showed that in promoter-associated H3K4me3 2,589 genes were increased and 1,275 genes were reduced in AA-treated NCM cells compared to control. The gene tracks of these eight TFs revealed increased levels of promoter-associated H3K4me3 in AA-treated NCM460 cells (Figure 5H and Table S8). Moreover, we observed that MM-102, an H3K4me3 inhibitor, effectively disrupted the domestication of NCM460 cells triggered by exogenous AA supplementation (Figures S23C–S23E) as well as the enhanced accessibility of the locus containing the eight TFs, as observed in the ATAC-seq gene track coverage files (Figures 5I and 5J). Collectively, the findings coherently validate that AA activates cancer-related TF transcription by modulating H3K4me3.
AA specifically binds to Menin protein and enhances the Menin-MLL1/2 interaction
Next, we examined the expression of subunits of the Set1/Compass methyltransferase complex that is essential for the methylation of H3K4.29 Interestingly, AA treatment had no impact on the expression of four catalytic subunits and six regulatory subunits (Figure S24A). Evidence showed that molecules with carboxyl groups have the potential to acylate and regulate the activity of their substrate proteins.30 We demonstrated that AA had no significant reinforcement effect on the acetylation levels of Compass subunits (Figure S24B and Table S9).
Metabolite-protein interactions modulate a variety of cellular processes, thereby playing a major role in maintaining cellular homeostasis.31 However, as a lipid molecule with biological activity, the potential AA-interacting proteins remain obscure. Here, we developed an approach by hybridizing immunoprecipitation and liquid chromatography-tandem mass spectrometry (LC-MS/MS) to quantify the trace-level binding of AA to subunit proteins. Interestingly, we observed a significant increase in the abundance of AA in Menin-immunoprecipitated metabolites, with approximately a 31.2-fold enrichment of AA in the anti-Menin immunoprecipitates compared to the immunoglobulin G (IgG) control (Figure 6A). However, the enrichment of AA in immunoprecipitates of the other nine subunits was equivalent to corresponding IgG controls (Figure 6A). Further, we observed approximately 16.2-fold, 28.6-fold, 27.7-fold, 28.1-fold, and 26.1-fold enrichment of AA in anti-Menin immunoprecipitates compared to anti-RbBP5, anti-WDR82, anti-CFP1, anti-WDR5, and anti-Ash2L counterparts, respectively (Figure 6B). The data suggest that AA specifically binds to the Menin regulatory subunit of the Compass complex.
Figure 6.

AA specifically binds to Menin protein and enhances the Menin-MLL1/2 interaction
(A) Quantitative abundance of AA binding with Compass subunits was measured using an LC-MS-based trace-level metabolite detection method (mean ± SEM, n = 3).
(B) Expression constructs of six regulatory subunits of the Compass complex (pCMV FLAG-RbBP5, -WDR82, -WDR5, -CFP1, -Menin, -Ash2L) were transfected into 293T cells. Quantification of AA binding with Compass subunits was measured using an LC-MS-based trace-level metabolite detection method (mean ± SEM, n = 3).
(C) Molecular docking analysis of AA and Menin protein.
(D) Analysis of the binding of AA to purified Menin WT or Y323A mutant proteins using a microscale thermophoresis (MST) binding assay.
(E) In vitro binding of AA and Menin was measured using an LC-MS-based trace-level metabolite detection method (mean ± SEM, n = 3).
(F) Analysis of the binding of AA to purified Menin WT proteins using surface plasmon resonance assay.
(G–I) Workflow (G), tumor incidence (H), and tumor volume (I, mean ± SEM) of NCM460 F1 xenografts from the far-end education model of 6G (n = 10).
(J) CoIP analysis of the interactions between Menin and MLL1/2 in NCM460 cells treated with various amounts of AA.
(K) CoIP analysis of the interactions between Menin and MLL1/2 in the indicated cells.
(L) CoIP analysis of the interactions between Menin and MLL1/2 in the indicated cells.
(M) In vitro binding of purified Menin (100 ng) and N-terminal truncation construct of MLL1 (100 ng) were evaluated using coIP assay.
(N) Docking model analysis of Menin and MLL1 with AA participation.
(O) Schematic diagram illustrating the “mortise and tenon architecture” of the consortium composed of Menin, AA, and MLL1/2.
Statistical analyses, n.s., not significant; ∗∗p < 0.01; ∗∗∗p < 0.001.
Corroborating these observations, molecular docking analysis showed that AA preferentially docked in the central cavity, at an interface formed by Menin’s thumb domain and palm domain (Figure 6C, left), mainly depending on hydrogen (H) bonds with Tyr323 (Figure 6C, right). Biochemically, in vitro binding assays demonstrated a direct interaction between purified Menin WT protein and AA and, in contrast, Menin Y323A mutant abrogated the capacity of binding with AA (Figures 6D–6F). We next evaluated the interaction of Menin and arachidonyl alcohol (ADA) or anandamide (ANA), which replaced the carboxyl group of AA (Figure S24C). In vitro binding assays showed that levels of either ADA or ANA binding with Menin were similar to that with the IgG control group, suggesting the crucial role of intact carboxyl groups in mediating AA-Menin interaction (Figures S24D and S24E). More importantly, we observed that PIK3CA mutant tumor cells were competent in remotely inducing visible solid neoplasms of NCM460 cells, whereas Menin Y323A mutation disrupted this process (Figures 6G–6I). Furthermore, we observed that compared to the control NCM460 cells, the binding of Menin was increased in the chromatin regions in AA-treated NCM460 cells (Figures S24F and S24G). Cumulatively, the data suggest that AA can directly bind with Menin at Tyr323, and the process is critical for malignant transformation of NCM460 cells.
Next, we unraveled how AA-Menin interaction impacts H3K4 trimethylation. First, the docking region of AA and Menin was located in the central cavity, where the main interacting domain of Menin and mixed lineage leukemia (MLL) proteins was situated (Figure 6C). Second, small interfering RNAs (siRNAs) targeting MLL1, MLL2, or Menin significantly disrupted the increase of NCM460 cell viability evoked by AA (Figure S25A). Menin-MLL1/2 interactions play a crucial role in activating MLL1/2 methyltransferase activity. We thus speculated that AA may function as a latch to strengthen the interaction of Menin and MLL and trigger H3K4 methylation. Indeed, exogenous supplementation of AA evidently contributed to the interaction of Menin and MLL1/2 and a concomitant increase in H3K4me3 levels (Figures 6J and S25B). cPLA2 KO then reduced the binding of Menin and MLL1/2, and affinity was restored after AA supplementation (Figure 6K). Consistently, exogenous supplementation of AA failed to restore the interaction of Menin and MLL1/2 in Menin Y323A KI NCM460 cells (Figure 6L). In vitro co-immunoprecipitation (coIP) assay consistently showed that AA indeed clearly reinforced the interaction between recombinant Menin and the truncated MLL1 protein (Figure 6M). Finally, computational structural analysis demonstrated that participation of AA strengthened the interaction of Menin and MLL1, with a lower docking score (Figures 6N and S25C). These results suggest that AA may bind to Menin via the Tyr323 site, mediating the interaction of Menin and MLL. The consortium of Menin-AA-MLL can be vividly likened to “mortise and tenon architecture,” in which AA serves as a latch and plays an important role in maintaining the stability and integrity of the Menin-MLL complex (Figure 6O).
Combination of a Menin-MLL1 interaction inhibitor VTP50469 and p110α selective inhibitor alpelisib results in tumor repression
We showed that AA-Menin interaction is required for PIK3CA oncogenicity, suggesting that a small-molecule inhibitor targeting this interaction would be an effective therapeutic approach. To this end, we employed a potent and selective inhibitor of the Menin-MLL1 interaction, VTP50469, which has shown remarkable pre-clinical efficacy.32 Pharmacologically, VTP50469 displaced Menin from the Menin-MLL1 complex and inhibited chromatin occupancy of MLL at select genes and transcriptional activation.32 Coincidentally, Tyr323, where AA binds to Menin, is one of the key sites for VTP50469 interacting with Menin. We thus postulated that VTP50469 may be the small-molecule inhibitor targeting AA-Menin interaction. Indeed, in vitro binding assays unequivocally demonstrated that VTP50469 completely abrogated the AA-Menin interaction (Figure S26A). Moreover, VTP50469 reversed the interaction of Menin and MLL1/2 triggered by AA (Figure S26B). The findings imply that VTP50469, with its broader coverage, advantageously binds to Menin, thereby blocking the interaction between AA and Menin (Figure S26C).
The potential anti-solid neoplastic properties of VTP50469 remain obscure. To address this, we implemented a therapeutic strategy guided by VTP50469 using an AOM/DSS-induced colorectal tumorigenesis model (Figure 7A). Although no significant difference in treatment effectiveness was observed in the PIK3CA WT cell medium group, there was a marked reduction in the number of tumor numbers and improved mouse survival time in the PIK3CA mutant cell medium group upon VTP50469 treatment (Figures 7B–7D and S27A). It is worth noting that VTP50469 selectively inhibited the interaction of Menin-MLL1 in tumors from the PIK3CA mutant medium group (Figure S27B). The consistent findings demonstrate that VTP50469 harbors the property of preferentially suppressing solid tumor carrying PIK3CA mutations. Next, we employed patient-derived xenograft (PDX) models to evaluate the therapeutic effect of VTP50469 alone or in combination with alpelisib (Figure 7E). In the PIK3CA WT PDX models, the drug combination only resulted in a deceleration of tumor growth (Figures 7F and S27C). However, in the PIK3CA mutant PDX models, the combination of VTP50469 and alpelisib led to tumor regression (Figures 7G and S27C). Indeed, the drug combination synergistically inhibited tumor growth in CRCs with PIK3CA mutations while exhibiting only an additive effect in CRCs with WT PIK3CA (Figure S27D). Collectively, the results demonstrate that the combination of VTP50469 and alpelisib could be an effective treatment for cancers harboring PIK3CA mutations.
Figure 7.

Combination of the Menin-MLL1 interaction inhibitor VTP50469 and the selective p110α inhibitor alpelisib leads to tumor repression
(A–D) Workflow (A) and representative macroscopic colon images (B), tumor counts (C, mean ± SEM), and survival (D) of mice in the AOM/DSS-induced colon tumorigenesis model (n = 8).
(E) Schematic representation of the in vivo experimental design for drug treatment of CRC PDX tumors.
(F and G) Subcutaneous xenograft tumors established from two CRC PDX with WT PIK3CA (F), a CRC PDX with PIK3CA H1047R mutation (MUT-1), and a CRC PDX with PIK3CA E545K mutation (MUT-2) (G) were treated with alpelisib, VTP50469, or the combination of both drugs. Data are presented as means ± SD; n = 8 or 7.
Statistical analyses, n.s., not significant; ∗p < 0.05; ∗∗p < 0.01; ∗∗∗p < 0.001.
Discussion
In the present study, we revisited the tumor somatic mutation theory and demonstrate that the tumor cells harboring PIK3CA gene mutations transmit oncogenic signals to IECs, initiating their malignant transformations, thereby promoting CRC development and progression. We demonstrate that PIK3CA mutant cells transmit exosomal AA to IECs and trigger chromatin remodeling, leading to malignant transformation.
The current study yielded an intriguing finding: immortalized NCM460 cells have the ability to undergo transformation into malignant cells that can form neoplasms and metastasize. However, PCE cells only acquire a more energetic cell phenotype following induction. Interestingly, we observed a significant enhancement of AOM/DSS-induced colorectal tumorigenesis when the cells were treated with medium from PIK3CA mutant cells. The findings lead us to the conclusion that the malignant signals from mutated cells alone are insufficient. Additional factors, such as immortalization and inflammatory stimulation in IECs, may be necessary for the induction of malignant cells. Recent evidence suggests that tumorigenesis involves a two-step mechanism: immortalization and genomic instability.33 Notably, the examination of educated NCM460 and PCE F2 cells revealed the emergence of gene gains and amplifications. The results suggest that the education process in our model may contribute to an important extent in the full stages of tumorigenesis. Besides, it is important to note that NCM460 cells, although designated as normal cells, are derived from colon tissue of a patient suffering from gastric cancer and are spontaneously immortalized.34 We thus inferred that NCM460 are most likely already systemically inflamed from the primary cancer tissue of the patient. Hence, it can be easier to malignantly transform NCM460 than PCE cells, which have not been exposed in such alterations.
Protein-metabolite interactions (PMIs) are specific interactions that play a crucial role in various cellular processes and modulate signal transduction by affecting the conformation, stability, and function of target proteins through allosteric modulation.35,36,37 However, PMIs often exhibit low affinity and are challenging to systematically identify. In the present study, we developed an immunoprecipitation integrated with an LC-MS/MS approach to quantify trace-level ligand-based metabolites and characterize PMIs by enriching proteins with metabolites. The primary downstream target of AA in IECs is Menin, a subunit of MLL1/2-containing histone methyltransferase complexes responsible for trimethylating histone H3 at lysine 4 (H3K4me3). Menin is a nuclear epigenetic regulator that has divergent roles in cancers that occur in a highly tumor-specific manner.38,39,40 Menin has been reported to be increased in CRC and as an oncogenic factor by providing resistance to gefitinib.41 As an important regulatory subunit of the Compass complex, Menin acts as an essential oncogenic cofactor for MLL1-mediated epigenetic dysregulation through its direct interaction with MLL1.42 Our computational structural analysis and biochemical results revealed that AA directly binds to Menin and acts as a stabilizing factor, maintaining the integrity and stability of Menin-MLL1/2 interactions. The structural insights into the interaction between AA and Menin will guide us in developing more specific allosteric inhibitors that can effectively target the AA-Menin interaction and disrupt the malignant signaling cascade in IECs.
In 2019, the US Food and Drug Administration approved alpelisib in combination with the endocrine therapy drug fulvestrant for the treatment of patients with advanced or metastatic breast cancer carrying PIK3CA mutations.15 While alpelisib has demonstrated partial tumor remission in advanced breast cancer, its effectiveness in colon cancer treatment proved unsatisfactory in early clinical trials,17 often accompanied by severe side effects such as cutaneous anaphylaxis and hyperglycemia.43 Our current data reveal an oncogenic signaling pathway external of PIK3CA mutant tumor cells, suggesting that targeting mutant tumor cells alone may be insufficient. Considering the significance of the AA-Menin interaction in PIK3CA mutation-mediated oncogenicity, targeting this metabolite-protein interaction represents a promising therapeutic strategy. VTP50469, a small-molecule inhibitor of the Menin-MLL protein-protein interaction, has demonstrated remarkable pre-clinical efficacy in in vivo models of acute leukemia. VTP50469 binds to the MLL binding pocket on Menin, and its key binding features include anchoring H bonds mediated by Tyr276 and Trp341 as well as a distinct π-cation interaction mediated by Tyr319 and Tyr323.42 Interestingly, AA directly binds to Menin through a Tyr323-based H bond, indicating competitive binding between AA and VTP50469 with Menin. Biochemical experiments and computational structural analysis coherently reveals stronger binding affinity between VTP50469 and Menin compared to the AA-Menin interaction. The evidence strongly suggests that VTP50469 is an ideal inhibitor of the AA-Menin interaction. In terms of drug development, we demonstrate that the combination of alpelisib and VTP50469 synergistically inhibits tumor growth and induces tumor regression in CRC PDX models carrying PIK3CA mutations. The findings raise the possibility of pursuing a phase 1 clinical trial to evaluate the combination of alpelisib and VTP50469 in CRC patients with tumors harboring PIK3CA mutations.
Limitations of the study
We demonstrate that PIK3CA mutant tumor cells synthesize more AA than PIK3CA WT tumor cells. However, whether AA impacts the chromatin remodeling of tumor cells and subsequently affects their malignant behaviors remains to be revealed. Thus, additional studies are necessary to comprehensively elucidate the function of AA as a histone methylation regulator in tumor cells. In addition, we have tested the therapeutic effects of VTP50469 and alpelisib in CRC PDX models. The anti-tumor efficacy of this combination needs to be clinically evaluated.
STAR★Methods
Key resources table
| REAGENT or RESOURCE | SOURCE | IDENTIFIER |
|---|---|---|
| Antibodies | ||
| Rabbit monoclonal antibody anti-N-cadherin | Cell Signaling Technology | Cat# 13116; RRID: AB_2687616 |
| Mouse monoclonal antibody anti-E-cadherin | Cell Signaling Technology | Cat# 14472; RRID: AB_2728770 |
| Rabbit monoclonal antibody anti-Vimentin | Cell Signaling Technology | Cat# 5741; RRID: AB_10695459 |
| Rabbit monoclonal antibody anti-CD9 | Cell Signaling Technology | Cat# 13174; RRID: AB_2798139 |
| Rabbit monoclonal antibody anti-CD63 | Cell Signaling Technology | Cat# 52090; RRID: AB_2924771 |
| Rabbit monoclonal antibody anti-CD81 | Cell Signaling Technology | Cat# 10037; RRID: AB_2714207 |
| Rabbit monoclonal antibody anti-cPLA2 pS505 | Cell Signaling Technology | Cat# 53044; RRID: AB_2799425 |
| Rabbit monoclonal antibody anti-cPLA2 | Cell Signaling Technology | Cat# 5479; RRID: AB_10621243 |
| Mouse monoclonal antibody anti-Ubiquitin | Cell Signaling Technology | Cat# 3936; RRID: AB_331292 |
| Rabbit monoclonal antibody anti-FBW7 | Proteintech | Cat# 28424-1-AP; RRID: AB_2881138 |
| Rabbit monoclonal antibody anti-PDK1 pS241 | Cell Signaling Technology | Cat# 3061; RRID: AB_2161919 |
| Rabbit monoclonal antibody anti-PDK1 | Cell Signaling Technology | Cat# 5662; RRID: AB_10839264 |
| Rabbit monoclonal antibody anti-AKT pT308 | Cell Signaling Technology | Cat# 4056, RRID: AB_331163 |
| Rabbit monoclonal antibody anti-AKT | Cell Signaling Technology | Cat# 9272; RRID: AB_329827 |
| Rabbit monoclonal antibody anti-SGK3 | Cell Signaling Technology | Cat# 8156; RRID: AB_10949507 |
| Rabbit monoclonal antibody anti-Pin1 | Cell Signaling Technology | Cat# 3722; RRID: AB_10692654 |
| Rabbit Polyclonal antibody anti-PTEN | Cell Signaling Technology | Cat# 9559; RRID: AB_390810 |
| Rabbit monoclonal antibody anti-PCNA | Cell Signaling Technology | Cat# 13110; RRID: AB_2636979 |
| Rabbit monoclonal antibody anti-Cyclin D1 | Cell Signaling Technology | Cat# 55506; RRID: AB_1661033 |
| Rabbit monoclonal antibody anti-PKCζ pT410 | Affinity | Cat# AF3404; RRID: AB_2834787 |
| Rabbit monoclonal antibody anti-PKCζ | Proteintech | Cat# 26899-1-AP; RRID:AB_2880675 |
| Rabbit monoclonal antibody anti-H3K4me3 | Cell Signaling Technology | Cat# 9783; Tri-Methyl Histone H3 Antibody Sampler Kit |
| Rabbit monoclonal antibody anti-H3K9me3 | Cell Signaling Technology | Cat# 9783; Tri-Methyl Histone H3 Antibody Sampler Kit |
| Rabbit monoclonal antibody anti-H3K27me3 | Cell Signaling Technology | Cat# 9783; Tri-Methyl Histone H3 Antibody Sampler Kit |
| Rabbit monoclonal antibody anti-H3K36me3 | Cell Signaling Technology | Cat# 9783; Tri-Methyl Histone H3 Antibody Sampler Kit |
| Rabbit monoclonal antibody anti-H3K79me3 | Cell Signaling Technology | Cat# 9783; Tri-Methyl Histone H3 Antibody Sampler Kit |
| Rabbit monoclonal antibody anti-H3K9ac | Cell Signaling Technology | Cat# 9927; Acetyl-Histone H3 Antibody Sampler Kit |
| Rabbit monoclonal antibody anti-H3K14ac | Cell Signaling Technology | Cat# 9927; Acetyl-Histone H3 Antibody Sampler Kit |
| Rabbit monoclonal antibody anti-H3K18ac | Cell Signaling Technology | Cat# 9927; Acetyl-Histone H3 Antibody Sampler Kit |
| Rabbit monoclonal antibody anti-H3K27ac | Cell Signaling Technology | Cat# 9927; Acetyl-Histone H3 Antibody Sampler Kit |
| Rabbit monoclonal antibody anti-H3K56ac | Cell Signaling Technology | Cat# 9927; Acetyl-Histone H3 Antibody Sampler Kit |
| Rabbit monoclonal antibody anti-Histone H3 | Cell Signaling Technology | Cat# 9927; Acetyl-Histone H3 Antibody Sampler Kit |
| Rabbit monoclonal antibody anti-GAPDH | Abcam | Cat# 2251-1; RRID:AB_1267174 |
| Rabbit monoclonal anti-Ubiquitin (linkage-specific K27) | Abcam | Cat# ab181537; RRID: AB_2713902 |
| Rabbit monoclonal anti-Ubiquitin (linkage-specific K48) | Abcam | Cat# ab140601; RRID: AB_2783797 |
| Rabbit monoclonal antibody anti-Pan-PhosphoThreonine | Novus Biologicals | Cat# NBP1-77696; RRID: AB_11041099 |
| Rabbit monoclonal antibody anti-MLL1 (Amino-terminal) | Cell Signaling Technology | Cat# 14689; RRID: AB_2688009 |
| Rabbit polyclonal antibody anti-MLL2 (Amino-terminal) | Cell Signaling Technology | Cat# 47097 |
| Rabbit monoclonal antibody anti-WDR5 | Cell Signaling Technology | Cat# 25501; SET1/COMPASS Antibody Sampler Kit |
| Rabbit monoclonal antibody anti-Ash2L | Cell Signaling Technology | Cat# 5019; RRID: AB_1950350 |
| Rabbit monoclonal antibody anti-RbBP5 | Cell Signaling Technology | Cat# 13171; RRID: AB_2714169 |
| Rabbit monoclonal antibody anti-CFP1 | Cell Signaling Technology | Cat# 40672; RRID:AB_2799181 |
| Rabbit monoclonal antibody anti-WDR82 | Cell Signaling Technology | Cat# 25501; SET1/COMPASS Antibody Sampler Kit |
| Rabbit monoclonal antibody anti-Menin | Abcam | Cat# ab92443; RRID: AB_10564144 |
| Rabbit monoclonal antibody anti-Set1a | Cell Signaling Technology | Cat# 25501; SET1/COMPASS Antibody Sampler Kit |
| Rabbit monoclonal antibody anti-Set1b | Cell Signaling Technology | Cat# 25501; SET1/COMPASS Antibody Sampler Kit |
| Rabbit monoclonal antibody anti-FLAG | Cell Signaling Technology | Cat# 14793; RRID: AB_2572291 |
| Rabbit polyclonal antibody anti-GFP | Abcam | Cat# ab290; RRID: AB_303395 |
| Rabbit monoclonal antibody anti-mCherry | Cell Signaling Technology | Cat# 43590 |
| Rabbit ponoclonal antibody anti-pan-PhosphoSerine | ABclonal | Cat# AP0932; RRID: AB_2863844 |
| Rabbit polyclonal antibody anti-IgG | Cell Signaling Technology | Cat# 2729; RRID: AB_1031062 |
| Biological samples | ||
| Human primary CRC tissue microarray | Affiliated Hospital of Jining Medical University | N/A |
| Chemicals, peptides, and recombinant proteins | ||
| Anti-Flag Affinity Gel | Bimake | Cat# B23101 |
| Azoxymethane (AOM) | MP Biomedicals | Cat# 25843-45-2 |
| Dextran Sodium Sulfate (DSS) | MP Biomedicals | Cat# 9011-18-1 |
| DNase I | GLPBIO | Cat# GC19804 |
| RNase | Biomed | Cat# SH459-1g |
| Proteinase K | Biomed | Cat# SH458-01 |
| VTP50469 | Selleck | Cat# S8934 |
| Alpelisib/BYL719 | Selleck | Cat# S2814 |
| MM-102 | Selleck | Cat# S7265 |
| 740 Y-P | Selleck | Cat# S7865 |
| GDC0068 | Selleck | Cat# S2808 |
| Cycloheximide (CHX) | Selleck | Cat# S7418 |
| Cisplatin | GLPBIO | Cat# GC11908 |
| 5-Fluorouracil | Selleck | Cat# S1209 |
| MG132 | GLPBIO | Cat# GC10383 |
| IPTG | Biomed | Cat# SH401-01 |
| Arachidonic acid (AA) | GLPBIO | Cat# GC31725 |
| Arachidonyl alcohol (ADA) | GLPBIO | Cat# GC39340 |
| Anandamide (ANA) | GLPBIO | Cat# GC35339 |
| DAPI | Sigma-Aldrich | Cat# D9542 |
| Corn oil | Sigma-Aldrich | Cat# C8267 |
| Critical commercial assays | ||
| USER cloning system | NEB | Cat# M5505L |
| Site-Directed Mutagenesis Kit | Agilent | Cat# 200523 |
| Immunohistochemistry Application Solutions Kit | Cell Signaling Technology | Cat# 13079 |
| His-tag Protein Purification Kit | QUALITYARD | Cat# QYP1062 |
| PrimeScript RT Reagent Kit | TAKARA | Cat# RR037A |
| ChIP assay kit | Beyotime | Cat# P2078 |
| ATAC-seq Kit | Novoprotein scientific Inc. | Cat#N248 |
| Mycoplasma Detection Kit | Yeasen | Cat# 40601ES20 |
| in vitro Ubiquitinylation kit | ENZO | Cat# BML-UW9920-0001 |
| Experimental models: Cell lines | ||
| Human: 293T | ATCC | Cat# CRL-3216 |
| Human: DLD1 | ATCC | Cat# CRL-1932 |
| Human: HCT116 | ATCC | Cat# HTB-46 |
| DLD1E545K | Horizon Discovery | Cat# HD-105-012 |
| DLD1WT | Horizon Discovery | Cat# HD-105-001 |
| HCT116H1047R | Horizon Discovery | Cat# HD-104-012 |
| HCT116WT | Horizon Discovery | Cat# HD-104-007 |
| Human: PCE | iCell Bioscience | Cat# HUM-iCell-d010 |
| Human: NCM460 | iCell Bioscience | Cat# iCell-h373 |
| Experimental models: Organisms/strains | ||
| Mouse: C57BL/6J | Experimental Animal Research Center of Jining Medical University | N/A |
| Mouse: NVSG | Experimental Animal Research Center of Jining Medical University | N/A |
| Mouse: BALB/c-nu | Experimental Animal Research Center of Jining Medical University | N/A |
| R26-Pik3caH1047R mice | The Jackson Laboratory | Cat# 016977, RRID: IMSR_JAX:016977 |
| Oligonucleotides used in this paper, seeTable S10 | ||
| Recombinant DNA | ||
| pCMV GFP | This paper | N/A |
| pCMV mCherry | This paper | N/A |
| pCMV 3×FLAG-FBW7 WT | This paper | N/A |
| pCMV 3×FLAG-FBW7 T205A | This paper | N/A |
| pCMV 3×FLAG-FBW7 T680A | This paper | N/A |
| pCMV 3×FLAG-FBW7 T692A | This paper | N/A |
| pCMV 3×FLAG-FBW7 T695A | This paper | N/A |
| pCMV 3×FLAG-RbBP5 WT | This paper | N/A |
| pCMV 3×FLAG-WDR82 WT | This paper | N/A |
| pCMV 3×FLAG-CFP1 WT | This paper | N/A |
| pCMV 3×FLAG-Menin WT | This paper | N/A |
| pCMV 3×FLAG-WDR5 WT | This paper | N/A |
| pCMV 3×FLAG-Ash2L WT | This paper | N/A |
| pET-28a-Menin WT | This paper | N/A |
| pET-28a-Menin Y323A | This paper | N/A |
| pFastBac1-Flag-cPLA2 | This paper | N/A |
| pFastBac1-His-FBW7 | This paper | N/A |
| pET-28a-FLAG-MLL1 N-Terminal | This paper | N/A |
| Deposited data | ||
| RNA-Sequencing data | [GSA]: HRA004872 | N/A |
| ATAC-sequencing data | [GSA]: HRA005039 | N/A |
| The low depth whole genome sequencing date for copy-number analysis | [GSA]: HRA005040 | N/A |
| The Infinium Methylation EPIC Kit Beadchip (850K) data | [GSA]: OMIX003990 | N/A |
| ChIP-sequencing data | [GSA]: HRA004948 | N/A |
Resource availability
Lead contact
Further information and requests for resources and reagents should be directed to and will be fulfilled by the lead contact, Bin Zhang (zhangbin@mail.jnmc.edu.cn).
Materials availability
Further information and requests for resources and reagents should be directed to and will be fulfilled by the lead contact, Bin Zhang (zhangbin@mail.jnmc.edu.cn) with a completed Materials Transfer Agreement.
Data and code availability
Original/source data of RNA-sequencing (accession number: HRA004872), ATAC-sequencing (accession number: HRA005039), the low depth whole genome sequencing date for copy-number analysis (accession number: HRA005040), the Infinium Methylation EPIC Kit Beadchip (850K) (accession number: OMIX003990) and ChIP-sequencing (accession number: HRA004948) are deposited in the Genome Sequence Archive (GSA, https://ngdc.cncb.ac.cn/gsa/).
This study did not report new original code. Any additional information required to reanalyze the data reported in this paper is available from the lead contact upon request.
Experimental model and subject participant details
Human subjects
Human primary CRC specimens for the PDX model (n = 4) and tissue microarray (n = 80) were obtained with informed consent from the Affiliated Hospital of Jining Medical University. None of the patients had received preoperative radiation or chemotherapy. The study was approved by the Research Ethics Committee of the Affiliated Hospital of Jining Medical University and conducted in accordance with the Declaration of Helsinki (No. 2022B012). Prior to inclusion in the study, participants provided written informed consent. The clinical characteristics and pathological information of the subjects from the primary CRC specimens are listed in Table S11.
Mice
All animal experiments were conducted in compliance with the protocols approved by the Animal Ethics Committee of the Affiliated Hospital of Jining Medical University (No. 2022B012).
The Direct Education Model
For the Direct Education Model, GFP-expression vectors (Green) and mCherry-expression vectors (Red) were stably transfected into tumor cells (PIK3CA mutant or isogenic WT cells) and colon epithelial cells (NCM460 or PCE cells), respectively. Subsequently, a mixture of GFP-labeled tumor cells (PIK3CA mutant or isogenic WT tumor cells) and mCherry-labeled colon epithelial cells (NCM460 or PCE cells) at the indicated ratio was subcutaneously injected into athymic BALB/c nude mice. As a control group, pure GFP-labeled PIK3CA mutant tumor cells, pure GFP-labeled PIK3CA WT cancer cells, or pure mCherry-labeled colon epithelial cells were inoculated into the mice. Tumor incidence was evaluated, and tumor volume was measured at designated time points using the formula length×width2/2. Approximately 30 days later, xenograft tumors were excised, trypsinized, and isolated using the Flow Cytometry Cell Sorting Procedure. The isolated GFP-labeled tumor cells and mCherry-labeled colon epithelial cells were cultured and subjected to in vitro and in vivo functional assays as outlined in Figure 1A.
The Far-end Education Model
In the Far-end Education Model, PIK3CA mutant or isogenic WT tumor cells were randomly inoculated subcutaneously on one side of athymic BALB/c nude mice, while NCM460 cells were simultaneously injected on the opposite side of the mice. In the control group, NCM460 cells were inoculated on both sides of the mice. Tumor incidence and volume were evaluated. Approximately 30 days later, xenograft tumors were collected, cut into 5 mm3 fragments, and implanted as intact tumor tissue subcutaneously into new nude mice to establish the F2 xenofraft derived xenograft (XDX) model, as indicated in Figure 1E. Tumor incidence and volume were assessed.
The colon orthotopic cancer model
In the orthotopic mouse colon cancer model, isolated DLD1WT cells, DLD1E545K educated-NCM460 cells, and DLD1WT educated-NCM460 cells were stably transfected with the Firefly D-Luciferin expression vector. NVSG severe immunodeficiency mice were anesthetized with chloral hydrate. A midline incision was made in the abdominal cavity of the mice. Using a sterilized micro syringe, a 30-μL cell suspension containing 500 thousand indicated cells (pre-mixed with matrix) was gently injected into the distal colon. The incisions were closed with 6-0 nylon sutures. After two weeks, tumor imaging was conducted using the FluorVivo imaging system (INDEC Biosystems, Santa Clara, CA, USA). Survival analysis was performed based on the mice’s survival status and time. Finally, the mice were dissected, and the number of metastatic nodules in the rectum, liver, and spleen was examined and analyzed through H&E staining.
The tail vein injection metastasis model
In the tail vein injection mouse model, one million indicated cells were injected into the tail vein of athymic BALB/c nude mice (n = 8 per group). Three groups were established: DLD1WT group, DLD1E545K-educated NCM460 group, and DLD1WT-educated NCM460 group. Tumors were visualized using the FluorVivo imaging system, and the survival of the mice was assessed. Finally, the mice were dissected, and metastatic nodules in the lungs were examined and analyzed through H&E staining.
The AOM/DSS-induced colorectal tumorigenesis model
The AOM/DSS-induced colorectal tumorigenesis model was established according to the following protocol. Mice were intraperitoneally injected with AOM (10 mg/kg body weight; MP Biomedicals) on the first day. Subsequently, the mice were maintained on a regular water and diet regimen for one week. Following this, the mice were given 2.5% DSS (MP Biomedicals) in their drinking water for one week, followed by a week of normal water. This cycle was repeated three times. The mice’s body weight was measured weekly throughout the experiment. At the end of 100 days, the mice were sacrificed, and their colons were removed for further analysis. Each colon was longitudinally cut open, and tumor numbers were examined.
Generation of transgenic R26-Pik3caH1047R mice
A construct consisting of a splice acceptor site, a floxed transcriptional stop cassette and a mutant mouse Pik3ca cDNA, encoding for a histidine 1047 arginine substitution, was inserted into intron 1 via homologous recombination. The H1047R Pik3ca mutant allele was targeted to intron 1 of the Gt(ROSA)26Sor gene behind a floxed PGK-Neo stop cassette. This mutation was created in 129S6/SvEvTac-derived W4 embryonic stem (ES) cells. G418-resistant clones were isolated, expanded, and screened by Southern blot. Resultant mice were backcrossed to FVB for 12 generations. Taqman qPCR protocols are run on a real-time PCR instrument. The transgene genotype is determined by comparing ΔCt values of each unknown sample against known homozygous and hemizygous controls, using appropriate endogenous references. Genotyping primers and probs were listed in Supplemental Table S10.
CRC PDX tumors
Mouse PDX experiments were conducted following approved protocols and ethical guidelines set by the Institutional Animal Care and Use Committee (IACUC). Four primary human colorectal cancer tumor fragments (2–3 mm in diameter) harboring WT (2 cases) or mutant (E545K and H1047R) PIK3CA were inoculated subcutaneously into the 6-week-old female immunodeficient BALB/c nude mice. Patients with CRC had not received any previous treatments or procedures. For animal drug treatment, alpelisib was dissolved in a solvent solution containing 5% DMSO, 50% PEG-300, 5% Tween-80, and 40% ddH2O. VTP50469 was dissolved in corn oil with 5% DMSO. Once the PDX tumors reached sizes of 100–150 mm3, the mice were randomly divided into four groups (8 mice per group): vehicle group, alpelisib group (12.5 mg/kg, oral gavage, once daily), VTP50469 group (50 mg/kg, oral gavage, once daily), and alpelisib plus VTP50469 group.
Cell culture and transfection
The human CRC cell line DLD1 carries a heterozygous E545K mutation (DLD1WT/E545K), while HCT116 possesses a heterozygous H1047R mutation (HCT116WT/H1047R). Isogenic derivatives of these cell lines were utilized, in which either the WT or mutant allele of PIK3CA was knocked out. Clones in which the mutant allele was disrupted (with the WT allele intact) were designated as DLD1WT or HCT116WT, while clones in which only the WT allele was disrupted (with the mutant allele intact) were designated as DLD1E545K or HCT116H1047R.
Human CRC cell line including DLD1, DLD1WT, DLD1E545K, HCT116, HCT116WT and HCT116H1047R and Human normal colon epithelial cell line NCM460 was cultured in McCoy’s 5A medium (Gibco) supplemented with 10% fetal bovine serum (Gibco). Human primary colonic epithelial (PCE) cells were cultured in DMEM/F12 (1:1) medium containing 10% FBS, 10 ng/mL cholera toxin, 0.005 mg/mL insulin, 0.005 mg/mL transferrin, 100 ng/mL hydrocortisone, and 20 ng/mL human recombinant EGF. Human embryonic kidney HEK 293T cells were cultured in DMEM medium (Sigma) supplemented with 10% FBS. All culture media were supplemented with 1% penicillin/streptomycin. Cells were incubated at 37°C in a humidified atmosphere with 5% CO2. Regular testing for Mycoplasma contamination was performed (Yeasen). The cell lines were authenticated by Genetica DNA Laboratories using STR profiling. Transfection was carried out using Lipofectamine 3000 reagent (Life Technologies) following the manufacturer’s instructions.
Method details
Immunohistochemistry and immunofluorescence analyses
Immunohistochemistry (IHC) and immunofluorescence (IF) were conducted following standard protocols. Briefly, paraffin-embedded mouse and human tissues were deparaffinized in xylene and subjected to antigen retrieval by boiling the samples for 30 min in a standard 10 mM citric acid pH 6 buffer. The samples were then incubated with the designated primary antibodies overnight at 4°C. The primary antibodies used were rabbit anti-cPLA2 (1:200 for IHC, Cell Signaling Technology), rabbit anti-FBW7 (1:200 for IHC, Novus), rabbit anti-GFP (1:200 for IF, Abcam), and rabbit anti-mCherry (1:200 for IF, Cell Signaling Technology). The peroxidase-conjugated secondary antibodies used for HRP IHC were mouse or rabbit EnVision+ (DAKO), while anti-rabbit or anti-mouse Alexa 488, 568, or 647 IgG (1:500, Invitrogen) were used for immunofluorescence. IHC sections were dehydrated, cleared, and mounted with DPX (Sigma), while immunofluorescence sections were mounted in Hydromount (National Diagnostics) with DAPI for nuclear staining. In the case of IHC, the tissue slides were independently examined by two investigators. Protein expression was quantified using a visual grading system based on the extent of staining (percentage of positive tumor cells on a scale of 0–4: 0, none; 1, 1–25%; 2, 26–50%; 3, 51–75%; 4, >75%) and the intensity of staining (graded on a scale of 0–3: 0, no staining; 1, weak staining; 2, moderate staining; 3, strong staining). The product of the extent and intensity grades was used to determine the protein expression level. Immunostainings and imaging were conducted on a minimum of three biological replicates, and representative images from the replicates are included in the manuscript.
DNA constructs and mutagenesis
The plasmids used in this study and the primers for vector construction are listed in Table S10. Briefly, pCMV backbones (pCMV FLAG-RbBP5, FLAG-WDR82, FLAG-WDR5, FLAG-CFP1, FLAG-Menin, FLAG-Ash2L and FLAG-FBW7) were utilized for gene expression in mammalian cells using the USER cloning system or molecular cloning technology. The LentiCRISPR V2 backbone (Addgene) was employed for cPLA2 and FBW7 knock-out (KO) in cells. Point mutations (FBW7 T205A, T680A, T692A, and T695A) in the constructs were introduced using a QuikChange Site-Directed Mutagenesis Kit. The pAAV-loxP-Neo vector was used for homologous recombination of endogenous Menin (Y323A) knock-in (KI) mutations. The pET-28a vector was utilized to obtain pure bioactive Menin WT and Y323A, Flag-MLL1 N-terminal proteins.
CRISPR/CAS9 genome editing
Three different guide RNA pairs for cPLA2 or FBW7 knock-out were designed using the IDT design tool (https://sg.idtdna.com/pages) and individually cloned into the lentiCRISPRv2 vector. DLD1 cells were transfected with these vectors. After 48 h, the cells were trypsinized and stable clones were selected using 1.5 μg/mL puromycin (Invitrogen) for 2 weeks. Knock-out of cPLA2 or FBW7 was screened using genomic PCR and validated by western blot.
For CRISPR/CAS9-mediated Menin Y323A point mutation on the endogenous Menin locus, three different guide RNA pairs surrounding the Y323 sites of the Menin locus were designed and cloned. The homologous arms of the Y323 target sites were mutated and cloned into the pAAV-loxP-Neo vector. Targeting vectors were co-transfected with individual gRNA vectors into NCM460 cells. Menin Y323A knock-in mutated cell clones were screened by genomic PCR and verified by genomic DNA sequencing.
Isolation and purification of exosomes and treatment
Exosomes were purified by differential centrifugation processes using the following methods. For cell culture supernatant derived exosomes, the cell lines were cultured until 80% confluence, washed twice with PBS, and serum-free media was added to the cells. For exosome isolation, serum-free media consisted of DMEM (Gibco) supplemented with 1% nonessential amino acids (Corning), 1% L-glutamine (Corning), and 1% penicillin-streptomycin. Supernatant was collected from cells that were cultured in the conditioned medium for 48 h, and was subsequently subjected to sequential centrifugation steps at 800g for 5min, and 2,000g for 10min. The supernatant was then filtered using 0.2 μm filters (Corning). Exosomes were pelleted by ultracentrifugation (Beckman) at 100,000g in an SW32 Ti rotor for 3 h. The supernatant was aspirated and the pellet was resuspended in PBS. The size and concentration of exosomes was verified using NTA (Malvern NanoSight LM10) and manufacturer’s software.
For treatment of exosomes with DNase, purified exosomes were incubated (37°C for 30 min) with 5 mg/ml of DNase I (GLPBIO), followed by heat inactivation (65°C for 30 min). For RNase treatment, purified exosomes were incubated (37°C for 30 min) with 2 mg/mL of protease-free RNase A (Biomed) followed by addition of 10× concentrated RNase inhibitor (GLPBIO). For proteinase treatment, purified exosomes were incubated (37°C for 30 min) with 5 mg/ml of proteinase K (Biomed, dissolved in RNase-free water) followed by heat inactivation (60°C for 30 min).
RNA extraction and quantitative real-time PCR analysis
Total RNA was extracted and purified using TRIzol (Invitrogen) following the manufacturer’s instructions. Reverse transcription of 1 μg of total RNA was performed using the PrimeScript RT Reagent Kit (TaKaRa, Japan). The gene expression levels were quantified using a quantitative real-time PCR system (Qiagen, Germany). GAPDH was used as the reference gene to normalize all gene expression results. All reactions were performed in triplicate and repeated in three independent experiments. The average of three independent analyses for each gene was calculated. Fold changes were determined through relative quantification (2ΔΔCt). The qRT-PCR primer sequences are provided in Table S10.
Cell viability assay and colony formation
To assess cell viability, 2 × 10³ cells were seeded in 200 μL of medium in 96-well plates. Subsequently, 20-μL of CCK-8 reagent (Dojindo, Japan) was added to each well. Following an incubation period of 2–4 h at 37°C, the absorbance at 450 nm was measured for each sample well using a plate reader. Cell viability was measured over a period of 5 consecutive days, and the absorbance at OD450 was utilized to generate cell growth curves. For the colony formation assay, 1000 cells in 2mL medium were seeded into six-well plates and cultured for 7–12 days. Cell colonies were then successively fixed, stained, and counted.
Spheroid formation assay
Differentially treated NCM460 cells were seeded into 6-well plates at indicated densities and were grown in a serum-free medium consisting of H-DMEM basal media, 20 ng/mL EGF, 10 ng/mL bFGF, and 2% B27 (Gibco). In addition to culturing cells in serum-free media, spheroid cells were obtained using low adhesion tissue culture plates (Corning). The number of spheroids per well was counted under a light microscope at 40× magnification. The experiments were performed at least three times.
Invasion assay
in vitro invasion assay was performed using transwell chambers using the following methods. First, cells at logarithmic phase were trypsinized and resuspended in serum-free medium. A 100-μL cell suspension was added to the upper chamber (8.0 mM pore size, Corning), and medium supplemented with 20% FCS was added to the bottom chamber. Then, cells on the upper surface of filters were removed after 48 h, and those on the undersurface were stained with 5% crystal violet. Images were captured from each membrane, and the number of invasive cells was counted under a microscope.
Co-immunoprecipitation
Co-immunoprecipitation (coIP) was conducted using standard protocols. Cells were collected and lysed with IP lysis buffer (containing 50 mM Tris-HCl at pH 7.5, 1 mM EDTA at pH 8.0, 150 mM NaCl, 1% NP-40, cOmplete Protease Inhibitor, PhosSTOP, and PMSF). Protein lysates (1 mg) were incubated overnight at 4°C on a rotator with the specified primary antibodies (5 mg). Subsequently, 40 μL of Protein A/G agarose beads were added, and the mixture was incubated for an additional 4 h on a rotator at 4°C. The beads and immunocomplexes were then washed with IP buffer, boiled with sample-loading buffer, and analyzed by western blotting.
In-vitro cPLA2 ubiquitination assay
in vitro cPLA2 ubiquitination assays were performed using in vitro ubiquitination kit (Enzo Life Sciences, BMLUW9920-0001) following the manufacturer’s instructions. In brief, the assay was performed in 50 μL reaction volume with the following components: 2 μg of recombinant ubiquitin, 100 nM E1, 2.5 μM E2 (a mixture of E2 enzymes: UbcH1, UbcH2, UbcH3, UbcH5a, UbcH5b, UbcH5c, UbcH6, UbcH7, UbcH8, UbcH10, UbcH13), 100 ng of purified Flag-cPLA2, and 1 μg His-FBW7. Following the reaction, the samples were analyzed by anti-Flag agarose beads immunoprecipitation and subsequent western blot.
In-vitro binding assay
The vectors expressing 6× His-Menin WT and 6× His-FLAG-MLL1 N-terminal truncated proteins were constructed and expressed in E. coli cells. These recombinant proteins were subsequently purified using Ni-NTA agarose beads, following established procedures. For the in vitro binding experiment, 100 ng of purified 6× His-Menin WT proteins were incubated with purified 6× His-Flag-MLL1 N-terminal truncated proteins in 1 mL of IP buffer at 4°C for 4 h. The coIP assay was conducted using standard protocols, and the protein-bound beads were washed three times for subsequent western blot analysis.
Western blot
Western blot analysis was conducted using standard techniques. Proteins were separated by 10% SDS-PAGE gel electrophoresis and subsequently transferred to PVDF membranes (Millipore). The membranes were blocked with 5% BSA for 1 h and then sequentially incubated with the appropriate primary antibodies and horseradish peroxidase-conjugated secondary antibodies. The signals were detected using an ECL Substrate Kit (Thermo Scientific). GAPDH antibody was utilized as a loading control for whole cell lysate.
Untargeted metabolomics analysis
Metabolite extraction
For cultured cells, approximately 107 cells were harvested and 800 μL of cold methanol/acetonitrile (1:1, v/v) was added to remove proteins and extract metabolites. For human or mice tissue samples, approximately 1.0 g of tissue was crushed, and 800 μL of cold methanol/acetonitrile (1:1, v/v) was used for metabolite extraction. The mixture was transferred to a new centrifuge tube and centrifuged at 14,000 g for 5 min at 4°C to collect the supernatant. For liquid samples, including medium, exosomes, exosome-free medium, and serum, 400 μL of cold extraction solvent methanol/acetonitrile/water (2:2:1, v/v/v) was added to 500 μL of the sample and thoroughly vortexed. After vortexing, the samples were incubated on ice for 20 min, followed by centrifugation at 14,000 g for 20 min at 4°C. The supernatant was collected, and the remaining solution was dried using a vacuum centrifuge at 4°C. For LC-MS analysis, the dried samples were re-dissolved in 100 μL of acetonitrile/water (1:1, v/v) solvent and transferred to LC vials.
LC-MS analysis
For the analysis of polar metabolites in untargeted metabolomics, extracts were subjected to analysis using a Sciex TripleTOF 6600 quadrupole time-of-flight mass spectrometer. The mass spectrometer was coupled to hydrophilic interaction chromatography via electrospray ionization. LC separation was performed on an ACQUIY UPLC BEH Amide column (2.1 mm × 100 mm, 1.7 μm particle size, Waters, Ireland) using a gradient of solvent A (25 mM ammonium acetate and 25 mM ammonium hydroxide in water) and solvent B (acetonitrile). The gradient started at 85% B for 1 min and was linearly decreased to 65% B over 11 min. Subsequently, it was reduced to 40% B in 0.1 min and maintained for 4 min, followed by an increase to 85% B in 0.1 min. A 5 min re-equilibration period was employed. The flow rate was set at 0.4 mL/min, the column temperature was maintained at 25°C, the autosampler temperature was 5°C, and the injection volume was 2 μL. The mass spectrometer was operated in both negative ion and positive ionization modes. The following source conditions were set for electrospray ionization: Ion Source Gas1 (Gas1) at 60, Ion Source Gas2 (Gas2) at 60, curtain gas (CUR) at 30, source temperature at 600°C, and IonSpray Voltage Floating (ISVF) at ±5500 V. During the mass spectrometry acquisition, the instrument was configured to acquire data in the m/z range of 60–1000 Da, and the accumulation time for TOF MS scan was set at 0.20 s per spectra. For auto MS/MS acquisition, the instrument was set to acquire data in the m/z range of 25–1000 Da, and the accumulation time for product ion scan was set at 0.05 s per spectra. The product ion scan was obtained using information-dependent acquisition (IDA) with high sensitivity mode selected. The following parameters were used: a fixed collision energy (CE) of 35 V with ±15 eV, a declustering potential (DP) of 60 V (+) and −60 V (−), exclusion of isotopes within 4 Da, and monitoring of 10 candidate ions per cycle.
Data analysis
The raw MS data (wiff.scan files) were first converted to MzXML files using Proteo Wizard MS Convert before being imported into the freely available XCMS software. For peak picking, the following parameters were used: centWave m/z = 25 ppm, peakwidth = c (10, 60), and prefilter = c (10, 100). Peak grouping was performed with bw = 5, mzwid = 0.025, and minfrac = 0.5. In the extracted ion features, only variables with more than 50% nonzero measurement values in at least one group were retained. Compound identification of metabolites was performed using MS/MS spectra with an in-house database established with available authentic standards. After normalizing to total peak intensity, the processed data were uploaded into SIMCA-P (version 14.1, Umetrics, Umea, Sweden) for multivariate data analysis, including Pareto-scaled principal component analysis (PCA) and orthogonal partial least squares discriminant analysis (OPLS-DA). The model’s robustness was evaluated using 7-fold cross-validation and response permutation testing. The variable importance in the projection (VIP) value of each variable in the OPLS-DA model was calculated to indicate its contribution to the classification. Significance was determined using an unpaired Student’s t-test. A VIP value > 1 and p < 0.05 were considered statistically significant.
Quantitative measurement of AA, PGD2 and PGE2 abundance
The homogenate was sonicated on ice for 30 min, and the mixture was then centrifuged for 10 min at 14,000 g and 4°C. 500 μL of the supernatant was used to extract metabolites using an HLB elution system. The system was preactivated with 200 μL of methanol and equilibrated with 200 μL of water. The loaded system was washed successively with 200 μL of water and 200 μL of 10% methanol aqueous solution, and then eluted with 50 μL of acetonitrile. Analyses were performed using an UHPLC system (I-Class LC, Waters) coupled to a QTRAP mass spectrometer (AB Sciex 5500). The mobile phase consisted of solvent A (0.1% formic acid in water) and solvent B (0.1% formic acid in acetonitrile). The samples were kept in the automatic sampler at 4°C, and the column temperature was maintained at 45°C. The gradient was run at a flow rate of 400 μL/min, and a 4 μL aliquot of each sample was injected. The gradient started at 30% B from 0 to 1 min, then linearly increased to 80% B from 1 to 7 min, further increased to 90% B from 7 to 9 min, and held at 90% B from 9 to 11 min. Quality control (QC) samples were used to test and evaluate the stability and repeatability of the system. In the ESI negative mode, the following conditions were set: source temperature at 450°C, Ion Source Gas1 (Gas1) at 55, Ion Source Gas2 (Gas2) at 60, Curtain gas (CUR) at 30, and IonSpray Voltage Floating (ISVF) at 4500 V. The multiple reaction monitoring (MRM) mode was employed to detect the ion pairs. The Multiquant software was used to extract the chromatographic peak area and retention time. The relative quantitative analysis of each metabolite was based on the peak area.
Liquid chromatography-mass spectrometry (LC-MS) analysis for protein identification
The proteins immunoprecipitated with cPLA2 or FBW7 were separated by SDS-PAGE, stained with Coomassie Brilliant Blue, and differentially expressed bands between PIK3CA mutant cells (DLD1E545K and HCT116H1047R) and isogenic WT cells (DLD1WT and HCT116WT) and were excised for in-gel trypsin digestion and peptide extraction. The gel slices were subjected to in-gel reduction, alkylation, and overnight trypsinization at 37°C. The peptide samples were then re-dissolved in mobile phase A (2% ACN, 0.1% FA), centrifuged at 20,000 g for 10 min, and the supernatant was collected for further testing. Sample separation was performed using a Thermo UltiMate 3000 UHPLC system. The samples were first enriched and desalted in a trap column, and then separated on a C18 column (75 μm inner diameter, 3 μm particle size, 25 cm column length) at a flow rate of 300 NL/min. The following gradient was employed: 0–5 min, 5% mobile phase B (98% ACN, 0.1% FA); 5–45 min, linear increase of mobile phase B from 5% to 25%; 45–50 min, increase of mobile phase B from 25% to 35%; 50–52 min, increase of mobile phase B from 35% to 80%; 52–54 min, 80% mobile phase B; 54–60 min, 5% mobile phase B. The nano liquid phase separation endpoint was directly connected to the mass spectrometer.
The liquid phase-separated peptide segments were ionized by a nanoESI source and then entered the Q-Exactive HF X mass spectrometer (Thermo Fisher Scientific, San Jose, CA) for Data Dependent Acquisition (DDA) analysis. The main parameters were set as follows: ion source voltage 1.9 kV, primary mass spectrometry scanning range 350-1,500 m/z, resolution 60,000. The secondary mass spectrum started at a fixed m/z of 100 with a resolution of 15,000. The parent ion screening conditions for secondary fragmentation were as follows: charge 2+ to 6+, peak intensity greater than 10,000, and selection of the top 30 parent ions. Fragmentation was performed using HCD mode, and the fragment ions were detected in the Orbitrap. Dynamic exclusion time was set to 30 s. AGC Settings: Level 1 - 3E6, Level 2 - 1E5. To obtain the iBAQ value for each protein, peptide XIC (extracted ion chromatogram) was used to calculate the peak area using a software developed by BGI Genomics (Shenzhen, China). The iBAQ algorithm was then applied, dividing the total peak area of each proteome by the number of observable peptides in theory to obtain the final iBAQ value. Potential proteins binding with cPLA2 (or FBW7) between PIK3CA mutant and isogenic WT cells were listed in the Tables S2 and S3.
RNA-seq
RNA was isolated from NCM460 cells treated with DMSO or AA using TRIzol (Invitrogen, USA). Each sample was further purified using an RNeasy Mini Column (Qiagen, Limburg, Netherlands), treated with DNase, and assessed for quality using an Agilent 2100 Bioanalyzer. The samples were then subjected to paired-end sequencing (2 × 100-bp) on an Illumina HiSeq 2000 platform. Read mapping to the human genome (hg19) was performed using TopHat v2.0.11 (http://tophat.cbcb.umd.edu) with default options and a TopHat transcript index generated from Ensembl_GRCh37. To identify differentially expressed genes (DEGs) between the two samples, the expression level of each transcript was calculated using the fragments per kilobase of exon per million mapped reads (FPKM) method. Fold change ≥2.5 or ≤ −2.5 and adjusted p value <0.01 were the criterion to obtain DEGs. The RNA sequence data have been deposited in the Genome Sequence Archive (GSA, https://ngdc.cncb.ac.cn/gsa/) and can be accessed via the GSA Series accession number HRA004872.
ATAC-seq
ATAC-seq was performed on cell lines following the Omni-ATAC-seq protocol. In brief, fifty thousand viable cells were lysed in a solution containing 10 mM tris-HCl (pH 7.4), 10 mM NaCl, 3 mM MgCl2, and 0.1% Tween 20. The nuclear pellet was then subjected to a transposition reaction using the Nextera DNA Sample Preparation kit (Illumina, no. FC-121-1030) with the addition of 0.01% digitonin and 0.1% Tween 20, incubated at 37°C for 30 min, and subsequently cleaned up using the DNA Clean and Concentrator-5 Kit (Zymo, no. D4014). For quantitative PCR (qPCR), three to six additional cycles of PCR amplification were performed using the NEBNext High-Fidelity 2X PCR Master Mix (NEB, no. M0541L) and Nextera Index Kit (Illumina, no. 15055289). The cleaned-up libraries were quantified and pooled for sequencing by Novogene. The union of peaks was obtained using bedtools merge from ATAC summits. Regions showing log2 fold changes versus the control of either <1 or >+1 were considered specific, while those between 1 and +1 were considered shared. ATAC matrices were generated using deepTools computeMatrix with a window of ±3 Kbp around the summits. Heatmaps were generated using deeptools plotHeatmap. The raw data have been deposited in Genome Sequence Archive (GSA, https://ngdc.cncb.ac.cn/gsa/) and can be accessed under the accession number HRA005039.
Copy number variation (CNV) analysis
Copy number variation analysis was performed on whole-genome sequencing (WGS) data, which consisted of approximately 10 million sequencing reads. The data processing followed a previously established methodology. Briefly, the sequencing reads were aligned to the human reference genome hg19, and the uniquely mapped reads were sorted and indexed. These uniquely mapped reads were then counted in genomic bins, dividing the genome into 20,000 bins using a known algorithm called Varbin. To normalize the read bin counts across the genome, a circular binary segmentation method was applied. The segmented data were further processed for absolute copy-number quantification using a least-squares fitting algorithm. The parameters of this algorithm were constrained by ploidy values obtained from a previously published algorithm called CELLULOID. The raw data from the copy-number analysis have been deposited in Genome Sequence Archive (GSA, https://ngdc.cncb.ac.cn/gsa/) and can be accessed under the accession number HRA005040.
DNA methylation analysis
Genomic DNA was first restored using the Infinium FFPE DNA Restoration Kit from Illumina. Subsequently, bisulfite conversion was performed using the EZ-96 DNA Methylation Kit from Zymo Research, based in Orange, CA. The methylation analysis was conducted on an Illumina iScan platform using Infinium MethylationEPIC BeadChips, which contained approximately 850,000 methylation markers. Standard protocols were followed during the analysis. For statistical analysis, adjusted p values less than 0.05 were considered indicative of gradual methylation changes. Linear models were employed to quantify the differences in methylation between groups. Functional annotations for the methylation markers were obtained using the Illumina annotation manifest, which included information about Infinium MethylationEPIC BeadChip elements and genes. The raw data from the methylation analysis have been deposited in Genome Sequence Archive (GSA, https://ngdc.cncb.ac.cn/gsa/) and can be accessed under the accession number OMIX003990.
ChIP-seq
NCM460 cells treated with DMSO or AA were fixed, and the ChIP assay kit was used for immunoprecipitation following the manufacturer’s instructions. The chromatin was sonicated, and the immunoprecipitation was performed using an anti-H3K4me3 antibody. The immunoprecipitated complex underwent washing, and DNA was extracted and purified using the Universal DNA Purification Kit from Tiangen. For ChIP-seq library preparation, the original Ultra II DNA Library Kits from NEB were used, following the manufacturer’s instructions. In the ChIP-seq process, the extracted DNA was ligated to specific adaptors and then subjected to deep sequencing on the Illumina Novaseq 6000 platform using 150 bp paired-end sequencing. Data analysis was conducted as follows: the raw data in fastq format were initially processed using in-house Perl scripts. This step involved obtaining clean data (clean reads) by removing reads containing adapters, reads containing poly-N, and low-quality reads from the raw data. Additionally, metrics such as Q20, Q30, and GC content were calculated based on the clean data. All subsequent analyses were performed using the high-quality clean data. The clean reads were aligned to the reference genome using Bowtie2 software. Reads originating from organelles, those with mapping quality below 30, and PCR duplicates were removed. The remaining high-quality mapped reads were then subjected to peak calling using Macs2 with a q-value threshold of <0.05. Motif analysis was conducted using the HOMER tool "findMotifsGenome.pl," with the peak file and genome fasta file as input. The tool extracted DNA sequences based on the peak file and compared them with the Motif database to identify motifs. Differential accessible peaks were analyzed in three steps. First, the peak files from each sample were merged using bedtools software. Second, the read counts over the merged peaks were determined for each sample using bedtools multicov. Finally, differential accessible peaks were identified using DESeq2. Regions were considered differentially accessible if the absolute value of the log2 fold change was greater than 1 and the p value was below 0.05. The ChIP sequence data have been deposited in the Genome Sequence Archive (GSA, https://ngdc.cncb.ac.cn/gsa/) and are accessible through the GSA Series accession number HRA004948.
Trace-level quantitation of ligand-based AA binding with Compass complex subunits
The protein immunocomplex preparation
We employed a trace-level AA detection method to assess ligand-based AA binding with Compass complex subunits. To detect AA binding with endogenous subunits (Set1a, Set1b, MLL1, MLL2, RbBP1, WDR82, CFP1, Menin, WDR82, and Ash2L), cells were washed twice with PBS and then scraped into adjusted IP lysis buffer (1% NP-40, 150 mM NaCl, 10 mM Tris at pH 5.9, 1 mM EGTA, 1 mM EDTA, 1.5 mM MgCl2, 10 mM KCl, 0.5 mM DTT, 0.5 mM sodium orthovanadate). The total cell lysates were pre-cleared by incubating with protein G agarose beads (Roche) for 2 h at 4°C. Following pre-clearing, the lysates were incubated with primary antibodies overnight at 4°C, followed by incubation with protein G agarose beads for 2 h at 4°C. The beads were washed with IP buffer three times, and the protein immunocomplex was extracted from the agarose using methanol.
To detect AA binding with exogenous-expressing subunits, exogenous expressing vectors for six regulatory subunits of the Compass complex (pCMV Flag-RbBP5, Flag-WDR82, Flag-WDR5, Flag-CFP1, Flag-Menin, Flag-Ash2L) were transfected into 293T cells. After 48 h, the cells were harvested and lysed using adjusted IP lysis buffer, and anti-FLAG agarose beads were used for immune coprecipitation. Due to variations in the work efficiency of each exogenous expressing vector in cells, we adjusted the plasmid transfection amount by normalizing the WB band grayscale value. This allowed us to maintain an equivalent abundance of subunit proteins precipitated in the IP experiment. Thus, we were able to compare the differences in AA levels bound to an equal amount of subunit proteins.
To test the direct binding of AA (or ANA, or ADA) with Menin protein, we expressed recombinant Menin WT or Y323A mutant construct in E. coli cells and purified both proteins to homogeneity. For in vitro AA-Menin binding detection, 1.0 μg of purified 6 × His-Menin WT or Y323A mutant proteins were incubated with AA in 1 mL of adjusted IP lysis buffer at 37°C for 6 h. The IP assay was performed using standard protocols, and the protein-bound beads were washed three times. Methanol was used to extract the metabolites.
Trace-level quantitation of metabolites
The immunocomplexes were directly sorted into 100 μL of 100% acetonitrile (ACN), resulting in a final concentration of approximately 80% ACN due to flow-PBS contamination. The samples were then vacuum-concentrated using an EZ2 elite system (Genevac) and stored at −80°C until further processing. Targeted quantification of these metabolites by LC-MS was conducted using an Agilent 1290 Infinity II UHPLC coupled with a ProLab Zirconium Ultra microLC pump, in conjunction with an Agilent 6495 QQQ-MS operating in MRM mode. The ESI coupling was achieved using a prototype microLC ESI source (ProLab). MRM settings were optimized individually for AA, ADA, and ANA using pure standards, and the optimized settings were applied for detecting their respective isomers. LC separation was performed on a 100 × 0.3 mm column with 1.8 μm Zorbax Eclipse Plus C18 (Agilent). The solvent gradient ranged from 100% buffer A (10 mM ammonium formate in 90:10 water:methanol) to 100% buffer B (10 mM ammonium formate in 90:10 propanol:acetonitrile). The flow rate was set at 5 μL/min. The autosampler temperature was maintained at 5°C, and the injection volume was 5 μL. Data processing was carried out using Agilent MassHunter Software. For each experiment, at least two negative controls were measured to assess metabolite background levels. Metabolites were included only if they were detected above background levels and exhibited a retention time similar to the standard qualifier peak. To evaluate metabolic differences, the area under the curve (AUC) was determined.
Molecular docking analysis
For AA and Menin molecular docking, high-resolution crystal structures of Menin (PDB ID: 3U84) were retrieved from the Protein DataBank. The 3D structure of AA was downloaded from PubChem (PubChem CID: 444899). Subsequently, the Menin structure and AA structure were uploaded to Webina, an AutoDock-based webserver (https://durrantlab.pitt.edu/webina/). Among the top 9 docking complex models generated, AA was observed to bind within the central cavity formed at the interface of the thumb domain and the palm domain of Menin. The model displaying the highest binding affinity was chosen for further detailed analysis.
Next, we established the docking model of Menin and MLL1 with AA participation.
Docking model illustrating the participation of AA in the interaction of Menin and MLL1 (PDB ID: 3LQH). Molecular docking was performed, and AA was successfully positioned within the cavity, forming a reasonable binding mode. The Menin (PDB ID: 3U84) and MLL1 (PDB ID: 3LQH) complex was first established, followed by the participation of AA in the docking process with the Menin-MLL1 complex. The energy score was then used to evaluate the impact of AA on the interaction between Menin and MLL1.
MST binding assay
MST measurements were conducted using the Monolith NT.115 system (Nano Temper). Full-length Menin WT or Y323A mutant proteins were expressed and purified in E. coli cells following the established protocol. The purified Menin WT or Y323A mutant proteins were labeled with Atto 488 fluorescent dye according to the manufacturer’s instructions. The labeling efficiency was determined to be 1:2 (protein:dye) by measuring the absorbance at 280 nm and 488 nm. A solution of AA or AA-Acetate in 0.01 M HEPES (pH 7.4), 0.15 M NaCl, and 0.005% v/v Surfactant P20 was serially diluted, typically ranging from 100 μM to 30 nM, in the presence of 200 nM labeled Menin. After incubating at room temperature for 15 min, the samples were loaded into silica capillaries (Polymicro Technologies). Measurements were conducted at 22°C with 20% LED power and 40% IR-laser power. Additional measurements were performed with 20% and 60% IR-laser power for comparison purposes. Data analysis was carried out using the Nano Temper Analysis software, utilizing the Kd curve fitting function. The raw data were exported, and fitting curves were generated using GraphPad Prism 8 (RRID:SCR_002798) for presentation.
Surface plasmon resonance (SPR) binding assay
SPR experiments were performed using a Biacore 8K (GE Healthcare). Recombinant Menin WT and Y323A mutant proteins were immobilized onto a Series S Sensor Chip CM5 (GE Healthcare) with Amine Coupling Kit (GE Healthcare) at pH 5.5. The binding of the test compound AA was measured with a continuous flow of PBS, pH 7.4, 0.05% tween 20 including 5% DMSO at 25°C (30 μL/min, association 120 s, dissociation 120 s). 2-fold serial dilutions of the ARA were flowed through with a concentration ranging from 100 to 0.195 M. DMSO solvent correction curves were generated by injecting the running buffers with serial concentrations of DMSO ranging from 4.5 to 5.8%. All the binding data were double referenced by blank cycle and reference flow cell subtraction. The resulting data were fit to a 1:1 Langmuir binding model using Biacore Insight Evaluation Software 4.0 (GE Healthcare).
Quantification and statistical analysis
Statistical analysis was conducted using SPSS 19.0 software, GraphPad Prism 5, and ImageJ software. Two-tailed and unpaired Student’s t-tests were utilized for comparisons between two groups. The data, obtained from at least three independent experiments performed in triplicates, are presented as means ± standard error (SE). Spearman’s correlation test was performed to analyze the correlation between two genes. For comparisons among three or more groups with comparable variations, the Two-Way ANOVA test was initially employed. If the results showed a significant difference, the Student Newman-Keuls analysis was utilized to determine the difference between the two groups. Survival curves were estimated using the Kaplan-Meier method and compared using the log rank test. All statistical tests and p values were two-sided. p < 0.05 was considered statistically significant. n.s., not significant; ∗p < 0.05; ∗∗p < 0.01; ∗∗∗p < 0.001.
Acknowledgments
This study was supported by grants from the National Natural Science Foundation of China (82173371, 82273447, 82273069, 82372679), with project funding from the China Postdoctoral Science Foundation (2022M711320, 2022M711322), the Tai Shan Young Scholar Foundation of Shandong Province (tsqn201909192, tsqn202312383), the Shandong Provincial Natural Science Foundation (ZR2021QH021, ZR202112020099), and the Shandong Postdoctoral Innovation Project (SDCX-ZG-202201002).
Author contributions
H.X. and Bin Zhang designed the study, directed the project, and supervised data analysis. B.H. and Q.B. performed and analyzed most experiments. R.Z., Y.Y., and G.D. performed the CRISPR knockout generation, the site-directed mutagenesis constructs, and assisted with immunohistochemistry and immunofluorescence staining. Baogui Zhang provided primary CRC specimens, followed up the survival status and prognosis, and assisted with the construction of CRC PDX models. S.W. and D.T. assisted with xenograft studies and drug treatment. W.X. and Y.H. assisted with data analysis and manuscript editing and provided essential technical support for CRISPR knockin cell establishment. Y.Z. and M.Z. helped with establishment and breeding of transgenic mice and provided technical support for primary cell culture. B.H., Q.B., H.X., and Bin Zhang wrote the manuscript. All authors edited the manuscript.
Declaration of interests
The authors declare no competing interests.
Published: April 12, 2024
Footnotes
Supplemental information can be found online at https://doi.org/10.1016/j.xcrm.2024.101510.
Contributor Information
Huabao Xiong, Email: xionghbl@163.com.
Bin Zhang, Email: zhangbin@mail.jnmc.edu.cn.
Supplemental information
References
- 1.Nanki K., Fujii M., Shimokawa M., Matano M., Nishikori S., Date S., Takano A., Toshimitsu K., Ohta Y., Takahashi S., et al. Somatic inflammatory gene mutations in human ulcerative colitis epithelium. Nature. 2020;577:254–259. doi: 10.1038/s41586-019-1844-5. [DOI] [PubMed] [Google Scholar]
- 2.Becker W.R., Nevins S.A., Chen D.C., Chiu R., Horning A.M., Guha T.K., Laquindanum R., Mills M., Chaib H., Ladabaum U., et al. Single-cell analyses define a continuum of cell state and composition changes in the malignant transformation of polyps to colorectal cancer. Nat. Genet. 2022;54:985–995. doi: 10.1038/s41588-022-01088-x. [DOI] [PMC free article] [PubMed] [Google Scholar]
- 3.Lee-Six H., Olafsson S., Ellis P., Osborne R.J., Sanders M.A., Moore L., Georgakopoulos N., Torrente F., Noorani A., Goddard M., et al. The landscape of somatic mutation in normal colorectal epithelial cells. Nature. 2019;574:532–537. doi: 10.1038/s41586-019-1672-7. [DOI] [PubMed] [Google Scholar]
- 4.Liao W., Overman M.J., Boutin A.T., Shang X., Zhao D., Dey P., Li J., Wang G., Lan Z., Li J., et al. KRAS-IRF2 Axis Drives Immune Suppression and Immune Therapy Resistance in Colorectal Cancer. Cancer Cell. 2019;35:559–572.e7. doi: 10.1016/j.ccell.2019.02.008. [DOI] [PMC free article] [PubMed] [Google Scholar]
- 5.Vasan N., Razavi P., Johnson J.L., Shao H., Shah H., Antoine A., Ladewig E., Gorelick A., Lin T.Y., Toska E., et al. Double PIK3CA mutations in cis increase oncogenicity and sensitivity to PI3Kα inhibitors. Science. 2019;366:714–723. doi: 10.1126/science.aaw9032. [DOI] [PMC free article] [PubMed] [Google Scholar]
- 6.Su Z., Kon N., Yi J., Zhao H., Zhang W., Tang Q., Li H., Kobayashi H., Li Z., Duan S., et al. Specific regulation of BACH1 by the hotspot mutant p53(R175H) reveals a distinct gain-of-function mechanism. Nat. Can. (Ott.) 2023;4:564–581. doi: 10.1038/s43018-023-00532-z. [DOI] [PMC free article] [PubMed] [Google Scholar]
- 7.Martínez-Reyes I., Chandel N.S. Cancer metabolism: looking forward. Nat. Rev. Cancer. 2021;21:669–680. doi: 10.1038/s41568-021-00378-6. [DOI] [PubMed] [Google Scholar]
- 8.Kang H.B., Fan J., Lin R., Elf S., Ji Q., Zhao L., Jin L., Seo J.H., Shan C., Arbiser J.L., et al. Metabolic Rewiring by Oncogenic BRAF V600E Links Ketogenesis Pathway to BRAF-MEK1 Signaling. Mol. Cell. 2015;59:345–358. doi: 10.1016/j.molcel.2015.05.037. [DOI] [PMC free article] [PubMed] [Google Scholar]
- 9.Sulkowski P.L., Oeck S., Dow J., Economos N.G., Mirfakhraie L., Liu Y., Noronha K., Bao X., Li J., Shuch B.M., et al. Oncometabolites suppress DNA repair by disrupting local chromatin signalling. Nature. 2020;582:586–591. doi: 10.1038/s41586-020-2363-0. [DOI] [PMC free article] [PubMed] [Google Scholar]
- 10.Dmitrieva-Posocco O., Wong A.C., Lundgren P., Golos A.M., Descamps H.C., Dohnalová L., Cramer Z., Tian Y., Yueh B., Eskiocak O., et al. β-Hydroxybutyrate suppresses colorectal cancer. Nature. 2022;605:160–165. doi: 10.1038/s41586-022-04649-6. [DOI] [PMC free article] [PubMed] [Google Scholar]
- 11.Gwinn D.M., Lee A.G., Briones-Martin-Del-Campo M., Conn C.S., Simpson D.R., Scott A.I., Le A., Cowan T.M., Ruggero D., Sweet-Cordero E.A. Oncogenic KRAS Regulates Amino Acid Homeostasis and Asparagine Biosynthesis via ATF4 and Alters Sensitivity to L-Asparaginase. Cancer Cell. 2018;33:91–107.e6. doi: 10.1016/j.ccell.2017.12.003. [DOI] [PMC free article] [PubMed] [Google Scholar]
- 12.Morris J.P., 4th, Yashinskie J.J., Koche R., Chandwani R., Tian S., Chen C.C., Baslan T., Marinkovic Z.S., Sánchez-Rivera F.J., Leach S.D., et al. α-Ketoglutarate links p53 to cell fate during tumour suppression. Nature. 2019;573:595–599. doi: 10.1038/s41586-019-1577-5. [DOI] [PMC free article] [PubMed] [Google Scholar]
- 13.Hao Y., Samuels Y., Li Q., Krokowski D., Guan B.J., Wang C., Jin Z., Dong B., Cao B., Feng X., et al. Oncogenic PIK3CA mutations reprogram glutamine metabolism in colorectal cancer. Nat. Commun. 2016;7 doi: 10.1038/ncomms11971. [DOI] [PMC free article] [PubMed] [Google Scholar]
- 14.Hao Y., Wang C., Cao B., Hirsch B.M., Song J., Markowitz S.D., Ewing R.M., Sedwick D., Liu L., Zheng W., Wang Z. Gain of interaction with IRS1 by p110α-helical domain mutants is crucial for their oncogenic functions. Cancer Cell. 2013;23:583–593. doi: 10.1016/j.ccr.2013.03.021. [DOI] [PMC free article] [PubMed] [Google Scholar]
- 15.André F., Ciruelos E., Rubovszky G., Campone M., Loibl S., Rugo H.S., Iwata H., Conte P., Mayer I.A., Kaufman B., et al. Alpelisib for PIK3CA-Mutated, Hormone Receptor-Positive Advanced Breast Cancer. N. Engl. J. Med. 2019;380:1929–1940. doi: 10.1056/NEJMoa1813904. [DOI] [PubMed] [Google Scholar]
- 16.Hao Y., He B., Wu L., Li Y., Wang C., Wang T., Sun L., Zhang Y., Zhan Y., Zhao Y., et al. Nuclear translocation of p85β promotes tumorigenesis of PIK3CA helical domain mutant cancer. Nat. Commun. 2022;13:1974. doi: 10.1038/s41467-022-29585-x. [DOI] [PMC free article] [PubMed] [Google Scholar]
- 17.Juric D., Rodon J., Tabernero J., Janku F., Burris H.A., Schellens J.H.M., Middleton M.R., Berlin J., Schuler M., Gil-Martin M., et al. Phosphatidylinositol 3-Kinase α-Selective Inhibition With Alpelisib (BYL719) in PIK3CA-Altered Solid Tumors: Results From the First-in-Human Study. J. Clin. Oncol. 2018;36:1291–1299. doi: 10.1200/JCO.2017.72.7107. [DOI] [PMC free article] [PubMed] [Google Scholar]
- 18.Hoshino A., Kim H.S., Bojmar L., Gyan K.E., Cioffi M., Hernandez J., Zambirinis C.P., Rodrigues G., Molina H., Heissel S., et al. Extracellular Vesicle and Particle Biomarkers Define Multiple Human Cancers. Cell. 2020;182:1044–1061.e18. doi: 10.1016/j.cell.2020.07.009. [DOI] [PMC free article] [PubMed] [Google Scholar]
- 19.Kalluri R., LeBleu V.S. The biology, function, and biomedical applications of exosomes. Science. 2020;367 doi: 10.1126/science.aau6977. [DOI] [PMC free article] [PubMed] [Google Scholar]
- 20.Ly C.H., Lynch G.S., Ryall J.G. A Metabolic Roadmap for Somatic Stem Cell Fate. Cell Metabol. 2020;31:1052–1067. doi: 10.1016/j.cmet.2020.04.022. [DOI] [PubMed] [Google Scholar]
- 21.Sperber H., Mathieu J., Wang Y., Ferreccio A., Hesson J., Xu Z., Fischer K.A., Devi A., Detraux D., Gu H., et al. The metabolome regulates the epigenetic landscape during naive-to-primed human embryonic stem cell transition. Nat. Cell Biol. 2015;17:1523–1535. doi: 10.1038/ncb3264. [DOI] [PMC free article] [PubMed] [Google Scholar]
- 22.Ji S., Qin Y., Shi S., Liu X., Hu H., Zhou H., Gao J., Zhang B., Xu W., Liu J., et al. ERK kinase phosphorylates and destabilizes the tumor suppressor FBW7 in pancreatic cancer. Cell Res. 2015;25:561–573. doi: 10.1038/cr.2015.30. [DOI] [PMC free article] [PubMed] [Google Scholar]
- 23.Min S.H., Lau A.W., Lee T.H., Inuzuka H., Wei S., Huang P., Shaik S., Lee D.Y., Finn G., Balastik M., et al. Negative regulation of the stability and tumor suppressor function of Fbw7 by the Pin1 prolyl isomerase. Mol. Cell. 2012;46:771–783. doi: 10.1016/j.molcel.2012.04.012. [DOI] [PMC free article] [PubMed] [Google Scholar]
- 24.Vasudevan K.M., Barbie D.A., Davies M.A., Rabinovsky R., McNear C.J., Kim J.J., Hennessy B.T., Tseng H., Pochanard P., Kim S.Y., et al. AKT-independent signaling downstream of oncogenic PIK3CA mutations in human cancer. Cancer Cell. 2009;16:21–32. doi: 10.1016/j.ccr.2009.04.012. [DOI] [PMC free article] [PubMed] [Google Scholar]
- 25.Scortegagna M., Lau E., Zhang T., Feng Y., Sereduk C., Yin H., De S.K., Meeth K., Platt J.T., Langdon C.G., et al. PDK1 and SGK3 Contribute to the Growth of BRAF-Mutant Melanomas and Are Potential Therapeutic Targets. Cancer Res. 2015;75:1399–1412. doi: 10.1158/0008-5472.CAN-14-2785. [DOI] [PMC free article] [PubMed] [Google Scholar]
- 26.Yarla N.S., Bishayee A., Sethi G., Reddanna P., Kalle A.M., Dhananjaya B.L., Dowluru K.S.V.G.K., Chintala R., Duddukuri G.R. Targeting arachidonic acid pathway by natural products for cancer prevention and therapy. Semin. Cancer Biol. 2016;40–41:48–81. doi: 10.1016/j.semcancer.2016.02.001. [DOI] [PubMed] [Google Scholar]
- 27.Monjazeb A.M., High K.P., Connoy A., Hart L.S., Koumenis C., Chilton F.H. Arachidonic acid-induced gene expression in colon cancer cells. Carcinogenesis. 2006;27:1950–1960. doi: 10.1093/carcin/bgl023. [DOI] [PubMed] [Google Scholar]
- 28.Allis C.D., Jenuwein T. The molecular hallmarks of epigenetic control. Nat. Rev. Genet. 2016;17:487–500. doi: 10.1038/nrg.2016.59. [DOI] [PubMed] [Google Scholar]
- 29.Thornton J.L., Westfield G.H., Takahashi Y.H., Cook M., Gao X., Woodfin A.R., Lee J.S., Morgan M.A., Jackson J., Smith E.R., et al. Context dependency of Set1/COMPASS-mediated histone H3 Lys4 trimethylation. Genes Dev. 2014;28:115–120. doi: 10.1101/gad.232215.113. [DOI] [PMC free article] [PubMed] [Google Scholar]
- 30.Sun L., Zhang H., Gao P. Metabolic reprogramming and epigenetic modifications on the path to cancer. Protein Cell. 2022;13:877–919. doi: 10.1007/s13238-021-00846-7. [DOI] [PMC free article] [PubMed] [Google Scholar]
- 31.Hicks K.G., Cluntun A.A., Schubert H.L., Hackett S.R., Berg J.A., Leonard P.G., Ajalla Aleixo M.A., Zhou Y., Bott A.J., Salvatore S.R., et al. Protein-metabolite interactomics of carbohydrate metabolism reveal regulation of lactate dehydrogenase. Science. 2023;379:996–1003. doi: 10.1126/science.abm3452. [DOI] [PMC free article] [PubMed] [Google Scholar]
- 32.Kurmasheva R.T., Bandyopadhyay A., Favours E., Pozo V.D., Ghilu S., Phelps D.A., McGeehan G.M., Erickson S.W., Smith M.A., Houghton P.J. Evaluation of VTP-50469, a menin-MLL1 inhibitor, against Ewing sarcoma xenograft models by the pediatric preclinical testing consortium. Pediatr. Blood Cancer. 2020;67 doi: 10.1002/pbc.28284. [DOI] [PMC free article] [PubMed] [Google Scholar]
- 33.Baslan T., Morris J.P., 4th, Zhao Z., Reyes J., Ho Y.J., Tsanov K.M., Bermeo J., Tian S., Zhang S., Askan G., et al. Ordered and deterministic cancer genome evolution after p53 loss. Nature. 2022;608:795–802. doi: 10.1038/s41586-022-05082-5. [DOI] [PMC free article] [PubMed] [Google Scholar]
- 34.Sahi J., Nataraja S.G., Layden T.J., Goldstein J.L., Moyer M.P., Rao M.C. Cl- transport in an immortalized human epithelial cell line (NCM460) derived from the normal transverse colon. Am. J. Physiol. 1998;275:C1048–C1057. doi: 10.1152/ajpcell.1998.275.4.C1048. [DOI] [PubMed] [Google Scholar]
- 35.Liu W., Wang Y., Bozi L.H.M., Fischer P.D., Jedrychowski M.P., Xiao H., Wu T., Darabedian N., He X., Mills E.L., et al. Lactate regulates cell cycle by remodelling the anaphase promoting complex. Nature. 2023;616:790–797. doi: 10.1038/s41586-023-05939-3. [DOI] [PubMed] [Google Scholar]
- 36.Yuan X., Duan Y., Xiao Y., Sun K., Qi Y., Zhang Y., Ahmed Z., Moiani D., Yao J., Li H., et al. Vitamin E Enhances Cancer Immunotherapy by Reinvigorating Dendritic Cells via Targeting Checkpoint SHP1. Cancer Discov. 2022;12:1742–1759. doi: 10.1158/2159-8290.CD-21-0900. [DOI] [PMC free article] [PubMed] [Google Scholar]
- 37.Dixit A., Kalia J. Protein-Metabolite Interactions: Discovery and Significance. Chembiochem. 2023;24 doi: 10.1002/cbic.202200755. [DOI] [PubMed] [Google Scholar]
- 38.Nyul T.E., Beyries K., Hojnacki T., Glynn R., Paulosky K.E., Gedela A., Majer A., Altman L., Buckley K.H., Feng Z., et al. Menin Maintains Cholesterol Content in Colorectal Cancer via Repression of LXR-Mediated Transcription. Cancers. 2023;15 doi: 10.3390/cancers15164126. [DOI] [PMC free article] [PubMed] [Google Scholar]
- 39.Katona B.W., Glynn R.A., Hojnacki T.A., Hua X. Menin: Expanding and dichotomous roles in cancer. Oncoscience. 2019;6:368–370. doi: 10.18632/oncoscience.485. [DOI] [PMC free article] [PubMed] [Google Scholar]
- 40.Katona B.W., Hojnacki T., Glynn R.A., Paulosky K.E., Szigety K.M., Cao Y., Zhang X., Feng Z., He X., Ma J., Hua X. Menin-mediated Repression of Glycolysis in Combination with Autophagy Protects Colon Cancer Against Small-molecule EGFR Inhibitors. Mol. Cancer Therapeut. 2020;19:2319–2329. doi: 10.1158/1535-7163.MCT-20-0101. [DOI] [PMC free article] [PubMed] [Google Scholar]
- 41.Katona B.W., Glynn R.A., Paulosky K.E., Feng Z., Davis C.I., Ma J., Berry C.T., Szigety K.M., Matkar S., Liu Y., et al. Combined Menin and EGFR Inhibitors Synergize to Suppress Colorectal Cancer via EGFR-Independent and Calcium-Mediated Repression of SKP2 Transcription. Cancer Res. 2019;79:2195–2207. doi: 10.1158/0008-5472.CAN-18-2133. [DOI] [PMC free article] [PubMed] [Google Scholar]
- 42.Krivtsov A.V., Evans K., Gadrey J.Y., Eschle B.K., Hatton C., Uckelmann H.J., Ross K.N., Perner F., Olsen S.N., Pritchard T., et al. A Menin-MLL Inhibitor Induces Specific Chromatin Changes and Eradicates Disease in Models of MLL-Rearranged Leukemia. Cancer Cell. 2019;36:660–673.e11. doi: 10.1016/j.ccell.2019.11.001. [DOI] [PMC free article] [PubMed] [Google Scholar]
- 43.Konstantinopoulos P.A., Barry W.T., Birrer M., Westin S.N., Cadoo K.A., Shapiro G.I., Mayer E.L., O'Cearbhaill R.E., Coleman R.L., Kochupurakkal B., et al. Olaparib and α-specific PI3K inhibitor alpelisib for patients with epithelial ovarian cancer: a dose-escalation and dose-expansion phase 1b trial. Lancet Oncol. 2019;20:570–580. doi: 10.1016/S1470-2045(18)30905-7. [DOI] [PMC free article] [PubMed] [Google Scholar]
Associated Data
This section collects any data citations, data availability statements, or supplementary materials included in this article.
Supplementary Materials
Data Availability Statement
Original/source data of RNA-sequencing (accession number: HRA004872), ATAC-sequencing (accession number: HRA005039), the low depth whole genome sequencing date for copy-number analysis (accession number: HRA005040), the Infinium Methylation EPIC Kit Beadchip (850K) (accession number: OMIX003990) and ChIP-sequencing (accession number: HRA004948) are deposited in the Genome Sequence Archive (GSA, https://ngdc.cncb.ac.cn/gsa/).
This study did not report new original code. Any additional information required to reanalyze the data reported in this paper is available from the lead contact upon request.