

Summary
Osteosarcoma (OS) is the most common malignant bone tumor with a poor prognosis. Here, we show that the nuclear receptor RORγ may serve as a potential therapeutic target in OS. OS exhibits a hyperactivated oxidative phosphorylation (OXPHOS) program, which fuels the carbon source to promote tumor progression. We found that RORγ is overexpressed in OS tumors and is linked to hyperactivated OXPHOS. RORγ induces the expression of PGC-1β and physically interacts with it to activate the OXPHOS program by upregulating the expression of respiratory chain component genes. Inhibition of RORγ strongly inhibits OXPHOS activation, downregulates mitochondrial functions, and increases ROS production, which results in OS cell apoptosis and ferroptosis. RORγ inverse agonists strongly suppressed OS tumor growth and progression and sensitized OS tumors to chemotherapy. Taken together, our results indicate that RORγ is a critical regulator of the OXPHOS program in OS and provides an effective therapeutic strategy for this deadly disease.
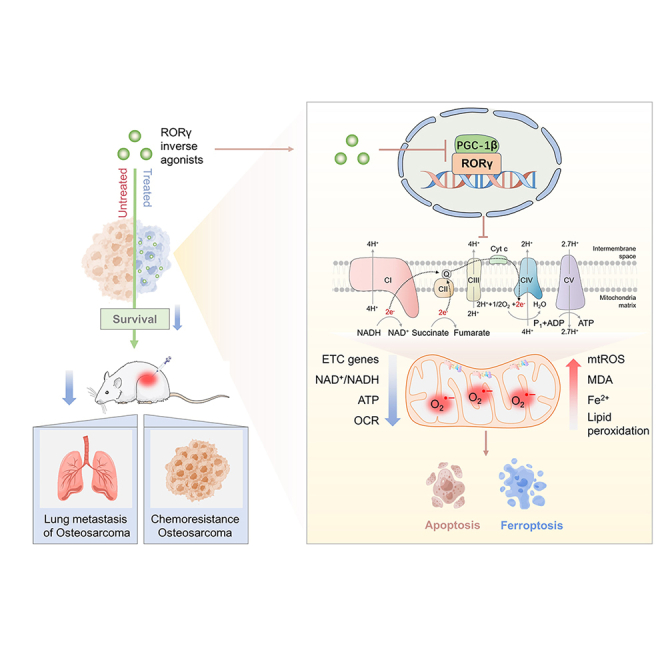
Graphical abstract
Highlights
-
•
RORγ is overexpressed in OS tumor cells and is linked to hyperactivated OXPHOS
-
•
RORγ physically interacts with PGC-1β to control OXPHOS and mitochondrial function
-
•
RORγ inhibition induces apoptosis and ferroptosis by inhibiting OXPHOS activation
-
•
RORγ inverse agonists suppress OS tumor growth and sensitize it to chemotherapy
Osteosarcoma (OS) exhibits hyperactivated OXPHOS program, which fuels the carbon source to promote tumor progression. Zheng et al. uncover that RORγ formed a positive regulatory loop with PGC-1β to directly activate ETC components to enhance OXPHOS in OS. Targeting RORγ blocks OS tumor progression via suppressing OXPHOS program.
Introduction
Osteosarcoma (OS) is the most common primary bone malignancy, in both children and adolescents.1 Current standard treatments, including surgery and chemotherapy, have increased the 5-year survival rate of patients with local OS to approximately 60%.2 However, due to the lack of effective treatment for metastatic and chemoresistant OS, the mortality for patients with relapsed and/or metastatic OS remains high, with the 5-year survival rate remaining at approximately 20% over the past 40 years.3,4 Therefore, the identification of potential therapeutic targets and the development of more effective treatment strategies for advanced OS are urgently needed.
Metabolic reprogramming is a key hallmark of human tumors.5,6 Although most tumor cells were initially thought to promote cell proliferation by upregulating aerobic glycolysis (a phenomenon termed the Warburg effect),7,8,9 emerging evidence has demonstrated that some tumor cells may utilize mitochondrial respiration as a primary source of energy.10,11,12 Oxidative phosphorylation (OXPHOS) is the process by which mitochondria convert the energy derived from nutrients into ATP. OXPHOS plays a central role in cellular energy metabolism. The OXPHOS machinery consists of five macromolecular complexes comprising 90 proteins in total, which are encoded by both the nuclear and mitochondrial genomes. The OXPHOS electron transport chain (ETC) is composed of four complexes (I to IV) that transfer electrons along the ETC from donors generated by the tricarboxylic acid (TCA) cycle and fatty acid oxidation. OXPHOS is elevated and promotes tumor growth in certain cancers, including breast cancer,13 leukemias,14,15 and pancreatic ductal adenocarcinoma (PDAC).11 Human breast cancer was reported to undergo metabolic reprogramming resulting in enhanced OXPHOS upon osteogenic differentiation, exacerbating the progression of epithelial-mesenchymal transition.13 Classical Hodgkin lymphoma (cHL) exhibits globally activated OXPHOS signaling. OXPHOS-dependent ATP synthesis is essential for cHL cell survival and growth.16 Cancer cells exhibit metabolic heterogeneity and can be divided into high- and low-OXPHOS subsets.17 Interestingly, stem cells from PDAC strongly rely on high OXPHOS, which confers high resistance to chemotherapy.11 Treatment with mitochondrial ETC inhibitors could effectively inhibit the growth18,19 and metastasis of high-OXPHOS tumors and sensitize them to chemotherapy.20,21 Therefore, targeting OXPHOS could be an effective strategy for treating cancer subtypes with upregulated OXPHOS. In this report, we reveal the OXPHOS status in OS and investigate the molecular mechanisms underlying the OS metabolic program, with the aim of finding a potential therapeutic target for OS treatment.
Nuclear receptors (NRs) are a large family of transcription factors involved in regulating key physiological functions, such as cell differentiation, embryonic development, and organ physiology.22 Retinoid-related orphan receptor γ (RORγ, encoded by RORC) is a member of the NR superfamily and, together with RAR-related orphan receptor A (RORα) and RAR-related orphan receptor B (RORβ),23 participates in diverse physiological processes, including cell proliferation, apoptosis, metabolism, and immune regulation.24,25 RORγ exists in two isoforms, RORγt and RORγ.26 RORγt is a T cell-specific isoform and is under the regulation of T cell-specific promoters in the thymus.27,28 Due to the crucial role of RORγt in inflammation-associated T helper type 17 (Th17) cell development and autoimmune diseases, it is well established that targeting RORγt is a promising therapeutic strategy for autoimmune diseases.25,29,30,31 However, the functions of RORγ in other human diseases remain largely unknown. Recently, works from our group and others established that RORγ is a potential therapeutic target in cancer. RORγ inhibition strongly suppresses tumor growth and plays critical roles in therapeutic resistance in prostate, breast, and pancreatic cancer.32,33,34 However, the role of RORγ in OS remains largely unknown and requires further investigation.
Here, we revealed that the NR RORγ is a key driver of the OXPHOS program in OS. RORγ inverse agonists strongly inhibit OXPHOS activation, dysregulate mitochondrial function, induce apoptosis and ferroptosis, and block OS tumor growth and progression in multiple in vitro and in vivo models. These findings identify RORγ as an effective therapeutic target in advanced OS.
Results
RORγ is overexpressed in OS and is required for the survival of OS cells
Given that NRs are attractive therapeutic targets in various diseases, including cancers, with many clinical-grade antagonists or agonists currently available, we reasoned that the identification of NRs that play a crucial role in OS progression could lead to the development of therapeutics for OS. We thus used the NR-targeted siRNA library to screen genes that control OS cell survival. The results showed that knockdown of several NRs (ERRs, RORs) strongly suppressed OS cell growth (Figures 1A, S1A, and S1B). Among NRs with no known roles in OS, RORγ (encoded by RORC) knockdown showed the strongest growth inhibition. Next, we performed immunohistochemistry (IHC) analysis using an RORγ antibody on OS tumors and found that RORγ could be detected in the nuclei of tumor cells in more than 50% of the tumors (70 in 118) but not in the normal tissue samples (Figure 1B). In addition, the RORγ protein was readily detected by immunoblotting in OS cell lines (for example, 143B and MG63) (Figure 1C).
Figure 1.

RORγ is overexpressed in OS and is required for the OS tumor growth
(A) Heatmap displaying the fold change in viability in cells transfected with specific NR siRNA compared with those transfected with control siRNA. Cells were transfected with siRNA against specific NR or control siRNA and, after 5 days, viable cells were counted. The data have been changed from 175% (red) to 0% (blue). n = 3 biological replicates.
(B) Representative immunohistochemical staining images of RORγ for a cohort of OS specimens in TMA OS802c and OS804c, n = 117 (Biomax). TMA LN020Bn01, n = 10 (ZhongKe GuangHua, China). Scale bars, 50 μm.
(C) Western blotting analysis of the RORγ protein in human mesenchymal stem cells (hMSCs) and OS cell lines. Representative blots are shown. n = 3 biological replicates.
(D) MG63 and 143B cells were transfected with siRNA against RORC (siRORC-1 and siRORC-2) or control siRNA (siCont). Cell numbers were counted 3 and 5 days after transfection. n = 3 biological replicates.
(E) Caspase-3/7 (cas3/7) activities in MG63 and 143B cells were transfected with siRNA against RORC for 3 days n = 3 biological replicates.
(F) MG63 and 143B cell viability was measured with Cell-Titer GLO (Promega) with cells treated with the indicated concentrations of RORγ inverse agonists GSK805, XY018, and SR2211 for 4 days n = 3 biological replicates.
(G) MG63 and 143B cells were treated with vehicle or the indicated RORγ inverse agonist for 2 days before being collected for apoptosis analysis by measuring caspase-3/7 (cas3/7) activity. n = 3 biological replicates.
(H) Western blotting analysis of the indicated proteins in MG63 and 143B cells treated with vehicle or the indicated RORγ inverse agonists for 2 days. Representative blots are shown. n = 3 biological replicates.
(I and J) Organoids derived from PDX (I) and 143B cell xenografts (J) were treated with vehicle, GSK805 (5 μM) or XY018 (5 μM) for 4 days. Representative bright-field (left row) and fluorescence microscopy (right three rows) images are shown, and cell viability in organoids was measured using the CellTiter-Glo Luminescent Cell Viability Assay. Scale bars, 50 μm. n = 5 biological replicates. All data shown above are the mean ± SD. ∗p < 0.05, ∗∗p < 0.01, ∗∗∗p < 0.001.
We then studied the function of RORγ in OS cells. Knockdown of RORγ by RORC siRNAs or shRNA markedly inhibited the growth of OS cells, including 143B, MG63, and MNNG/HOS cells (Figures 1D and S2A–S2C). RORγ knockdown also resulted in the induction of apoptosis, as demonstrated by the activation of caspase-3 and caspase-7 (Figures 1E, S2D, and S2E). Importantly, all the RORγ inverse agonists that we tested potently inhibited OS cell line growth at low micromolar concentrations (Figures 1F and S2F–S2H). Recent studies identified several RORγ inverse agonists (for example, GSK805 and XY018). Consistent with the induction of apoptosis by RORC knockdown, treatment with GSK805 or XY018 significantly increased apoptosis in MG63 and 143B cells (Figures 1G and 1H). Notably, RORγ inhibition did not show a significant effect on the survival of mesenchymal stem cells (Figure S2I). Given that 3D organoids may closely mimic clinical tumors in response to therapeutics, we established four OS-derived organoids, including two patient-derived organoids and two OS cell line-derived organoids. We treated organoids with RORγ inverse agonists and found that RORγ inverse agonists significantly reduced the survival of OS-derived organoids (Figures 1I, 1J, S2J, and S2K). Together, these data indicate that RORγ plays a critical role in OS cell survival and that its inverse agonists could be useful in treating OS with RORγ overexpression.
RORγ inhibition inhibits OS cells survival by suppressing OXPHOS
To understand the underlying mechanism by which RORγ inhibition affects OS cell survival, we carried out transcriptomic profiling by RNA sequencing (RNA-seq) of 143B cells treated with the RORγ inverse agonist XY018. Pathway analysis of genes with altered expression revealed that genes involved in mitochondrial metabolism were significantly downregulated (Figure 2A). Further examination by gene set enrichment analysis using the OXPHOS activity signature revealed a robust disruption of OXPHOS by RORγ inverse agonists (Figures 2B and 2C). qRT-PCR verified that both RORγ inverse agonists GSK805 and XY018 decreased the expression of key mediators of OXPHOS, including SDHB, COX5B, and NDUFB8 in MG63 and 143B cells (Figure 2D). Immunoblot analysis showed that GSK805 and XY018 strongly reduced complex II and complex IV of the OXPHOS ETC (Figures 2E and S3A). In addition, RORγ inhibition also significantly decreased the expression of fatty acid oxidation regulators (Figure S3B). We next examined the functional effect of RORγ inverse agonists on OXPHOS by measuring the oxygen consumption rate (OCR), extracellular acidification rate (ECAR), and lactate production. We observed a strong reduction in OCR (Figures 2F and S3C) but an increase in ECAR level and lactate production, which indicates that RORγ plays critical roles in reprogramming mitochondrial metabolism in OS cells (Figures S3D and S3E). As expected, RORγ inverse agonists also caused a decrease in ATP production and the ratio of NAD+/NADH (Figures 2G, 2H, S3F, and S3G). AMP-activated protein kinase (AMPK), a rheostat for ATP availability, is activated in response to OXPHOS inhibition, showing a rapid and robust increase in phospho-AMPK and its substrate, phospho-ACC-7932, as well as decrease in phospho-mTOR (Figure 2I). These data collectively suggest that RORγ inhibition strongly suppressed OXPHOS and impaired mitochondrial function.
Figure 2.

RORγ inhibition inhibits OS cells survival by suppressing OXPHOS
(A) KEGG pathway analysis of related genes with downregulated expression, which was detected by RNA-seq of 143B cells treated with XY018 (5 μM) for 2 days, compared with vehicle (DMSO).
(B) Gene set enrichment analysis of the OXPHOS activity signature gene expression changes, as detected by RNA-seq in 143B cells treated with XY018 (5 μM) for 2 days, compared with vehicle (DMSO).
(C) Downregulated genes detected by RNA-seq in 143B cells treated with XY018 (5 μM) for 2 days compared with vehicle (DMSO).
(D) qRT-PCR analysis of the indicated genes in MG63 and 143B cells treated with vehicle or with RORγ inverse agonists (5 μM) for 2 days. n = 3 biological replicates.
(E) Western blotting analysis of the indicated proteins in MG63 and 143B cells treated with vehicle or the indicated RORγ inverse agonists (5 μM) for 2 days. Representative blots are shown. n = 3 biological replicates.
(F) OCR measured by a Seahorse analyzer with MG63 and 143B cells treated with RORγ inverse agonists (5 μM) for 2 days. n = 3 biological replicates.
(G) ATP production assessed by Cell-Titer GLO (Promega) in MG63 and 143B cells treated with RORγ inverse agonists (5 μM) for 2 days. The ATP level was normalized to the cell number. n = 3 biological replicates.
(H) The ratio of NAD+/NADH in MG63 and 143B cells treated with RORγ inverse agonists (5 μM) for 2 days was assessed by an NAD+/NADH Assay Kit. n = 3 biological replicates.
(I) Immunoblotting analysis of the indicated proteins in MG63 and 143B cells treated with vehicle or the indicated RORγ inverse agonists (5 μM) for 2 days. Representative blots are shown. n = 3 biological replicates.
(J) Heatmap of activity scores of gene expression of indicated pathways with data normalized from 1.5 (red) to −1.5 (blue) in 18 tumoral bone samples and 18 nontumoral paired samples. The datasets for gene expression were obtained from the GEO database (GEO: GSE99671).
(K) Violin plots showing the relative OXPHOS pathway activity in 18 tumoral bone samples and 18 nontumoral paired samples from the GEO database (GEO: GSE99671).
(L) MG63 and 143B cells treated with vehicle, RORγ inverse agonists (5 μM) and OXPHOS inhibitors (50 nM) for 2 days. Total viable cells were counted with a Coulter cell counter. n = 3 biological replicates. All data shown above are the mean ± SD. ∗p < 0.05, ∗∗p < 0.01, ∗∗∗p < 0.001.
Studies have increasingly demonstrated that certain cancers rely heavily on OXPHOS for bioenergetic and biosynthetic processes, and OXPHOS inhibition holds therapeutic promise for cancer treatment.35,36 However, the alteration and function of OXPHOS in OS remain largely unknown. We first interrogated the GEO database (18 OS tumors and 18 adjacent normal tissues) to examine mitochondrial metabolism alterations in OS tumors compared with those in adjacent normal tissues. The analysis showed that the vast majority of OS tumors displayed a highly elevated OXPHOS program, fatty acid metabolism and TCA cycle, and downregulated glycolysis (Figure 2J), which suggested a potential shift in energy production from glycolysis to OXPHOS in OS tumor cells. The OXPHOS level was significantly higher in OS tumors than in normal tissues (Figures 2J and 2K). Importantly, OXPHOS inhibitors strongly inhibited OS cell survival (Figures S3H and S3I), suggesting high OXPHOS as a potential therapeutic target for OS therapy. To provide further evidence that RORγ inverse agonists reduced cell viability by inhibiting OXPHOS activity, we used the OXPHOS inhibitors rotenone and antimycin A and demonstrated that cell death induced by RORγ inverse agonists was significantly attenuated in rotenone- and/or antimycin A-treated cells compared with that in control cells (Figures 2L and S3J). Moreover, analysis of the GEO dataset revealed that the expression of RORγ had a significant positive association with OXPHOS in human OS (Figure S3K). These data collectively suggest that one major mechanism underlying the inhibitory effects of RORγ on OS cell survival is by suppressing OXPHOS.
RORγ inhibition induces apoptosis and ferroptosis by promoting oxidative stress in OS cells
It has been well established that dysregulated OXPHOS affects cell survival through oxidative stress-mediated apoptosis and ferroptosis.17 Mitochondria are both sources and targets of ROS. ROS are primarily generated in mitochondria, and ROS can damage mitochondrial function. Consistent with the inhibition of OXPHOS, RORγ inverse agonists and OXPHOS inhibitors significantly induced mitochondrial ROS generation and caused the leakage of cytc and BCL-2 from mitochondria into the cytoplasm, activating caspase-9 and caspase-3, initiating the apoptosis cascade, and eventually culminating in cell death (Figures 3A–3C and S4A–S4C). The pancaspase inhibitor zVAD-fmk efficiently inhibited caspase-3/7 activities and cell apoptosis induced by RORγ inverse agonists (Figure 3D).
Figure 3.

RORγ inhibition induces apoptosis and ferroptosis by promoting oxidative stress in OS cells
(A) ROS generation in MG63 and 143B cells treated with RORγ inverse agonists (5 μM) and OXPHOS inhibitors (50 nM) for 2 days was evaluated by flow cytometry using DCFH-DA. n = 3 biological replicates.
(B) Mitochondrial ROS generation in MG63 and 143B cells treated with RORγ inverse agonists (5 μM) and OXPHOS inhibitors (50 nM) for 2 days was evaluated by flow cytometry using MitoSOX. n = 3 biological replicates.
(C) Immunoblotting analysis of the indicated proteins in MG63 and 143B cells treated with vehicle or the indicated RORγ inverse agonists (5 μM) for 2 days. Representative blots are shown. n = 3 biological replicates.
(D) Cell viability and caspase-3/7 (cas3/7) activities of MG63 and 143B cells treated with RORγ inverse agonists (5 μM) and Pan caspase inhibitor (10 μM zVAD-fmk) for 2 days. Pan caspase inhibitor was pretreated for 3 h. n = 3 biological replicates.
(E) Lipid ROS generation in MG63 and 143B cells treated with RORγ inverse agonists (5 μM) and the ferroptosis inducer erastin (5 μM) for 2 days was assessed by immunofluorescence using C11-BODIPY. Scale bar, 100 μm. n = 3 biological replicates.
(F) The accumulation of Fe2+ in MG63 and 143B cells treated with RORγ inverse agonists (5 μM) and the ferroptosis inducer erastin (5 μM) for 2 days was assessed by immunofluorescence using FerroOrange. Scale bar, 100 μm. n = 3 biological replicates.
(G) Cellular malondialdehyde (MDA) production in MG63 and 143B cells treated with RORγ inverse agonists (5 μM) and the ferroptosis inducer erastin (5 μM) for 2 days was assessed by using a Lipid Peroxidation MDA Assay Kit. Cells were pretreated with the ferroptosis inhibitor Fer-1 (10 μM) for 3 h. n = 3 biological replicates.
(H) Morphological analysis by transmission electron microscopy in MG63 and 143B cells treated with vehicle or the indicated RORγ inverse agonist (5 μM) and ferroptosis inducer erastin (5 μM) for 2 days. The morphological features of ferroptosis are indicated (black arrows). Scale bars, 1 μm (left column) and 0.5 μm (right column). n = 5 technical replicates.
(I) MG63 and 143B cells were treated with RORγ inverse agonists (5 μM) and the ferroptosis inhibitor Fer-1 (10 μM) for 2 days, and total viable cells were counted with a Coulter cell counter. Fer-1 cells were pretreated for 3 h. n = 3 biological replicates.
(J) MG63 and 143B cells were treated with vehicle or the indicated RORγ inverse agonists (5 μM) for 2 days, and Hoechst staining was used to observe chromatin condensation. n = 3 biological replicates.
(K) ROS generation in MG63 and 143B cells treated with RORγ inverse agonists (5 μM) and the ROS inhibitor N-acetylcysteine (NAC) (6 mM) for 2 days was assessed by flow cytometry using DCFH-DA. The cells were pretreated with NAC for 3 h. n = 3 biological replicates. All data shown above were the mean ± SD. ∗p < 0.05, ∗∗p < 0.01, ∗∗∗p < 0.001.
We then examined whether RORγ inhibition could promote ferroptosis by oxidative stress-induced lipid peroxidation in OS cells. Staining with C11-BODIPY showed that both inverse agonists and genetic knockdown of RORγ significantly induced lipid peroxidation in OS cells (Figures 3E and S4D). qRT-PCR and immunoblot analysis showed that RORγ inverse agonists significantly reduced the expression of DHODH, GPX4, and SLC7A11 (Figures S4E and S4F). Consistently, RORγ inhibition increased the level of malondialdehyde (MDA) and the accumulation of Fe2+, a marker of ferroptosis (Figures 3F and 3G). Morphological analysis by transmission electron microscopy also showed that RORγ inverse agonists induced shrinkage of the cytosolic area and increased mitochondrial membrane density (Figure 3H). Notably, the ferroptosis inhibitor Fer-1 reversed RORγ inverse agonist-induced ferroptosis and partially rescued cell viability (Figure 3I). Moreover, the ROS scavenger N-acetylcysteine effectively blocked cell death induced by RORγ inverse agonists (Figures 3J and 3K). Together, these data suggest that RORγ inhibition induces cell apoptosis and ferroptosis by promoting oxidative stress in OS cells.
RORγ physically interacts with PGC-1β to control OXPHOS and mitochondrial function
The prominent impact on OXPHOS upon RORγ inhibition prompted us to investigate whether RORγ, as a transcription factor, directly controls the transcription of key genes involved in OXPHOS. Analysis of our RNA-seq and chromatin immunoprecipitation sequencing (ChIP-seq) data (GEO: GSE126380) revealed that the RORγ protein occupied the promoter and/or enhancer regions of 80% of ETC genes, such as ATP5B, COX5B, SDHB, and UQCR11, which were indeed downregulated by RORγ inverse agonists. Our ChIP-qPCR analysis also verified that inverse agonists strongly reduced RORγ occupancy and transcriptional activation-linked histone marks H3K27ac on the gene promoter and/or enhancer sites in OS cells (Figures 4A, 4B, and S5A), indicating that RORγ directly regulates the expression of these genes. Notably, we observed high RORγ occupancy on the promoter of PGC-1β, a master regulator of mitochondrial function. As expected, RORγ inverse agonists strongly reduced RORγ and H3K27ac occupancy on the promoter of PGC-1β and decreased the expression of PGC-1β at both the mRNA and protein levels (Figure 4C). Conversely, RORγ overexpression significantly increased PGC-1β expression in OS cells (Figure S5B). Moreover, we found that the reporter gene under the control of the PGC-1β promoter was highly responsive to RORγ-mediated transactivation and that RORγ inverse agonists effectively suppressed this activation (Figure 4D). Overall, these data suggest that RORγ directly stimulates PGC-1β gene expression.
Figure 4.

PGC-1β coordinates with RORγ to control OXPHOS, OS survival, and mitochondrial function
(A) Genome browser display of RORγ-binding events at the promoter and gene body of PGC-1β and ETC genes (UQCR11, COX5B, and ATP5F1D). ChIP primer-pair locations are indicated by horizontal short lines. The red P represents the binding peak. Data from our previous ChIP-seq data (GEO: GSE126380).
(B) ChIP-qPCR analysis of the relative enrichment of RORγ and H3K27 acetylation at ETC gene promoters (UQCR11, COX5B, and ATP5F1D) in 143B cells treated with vehicle or RORγ inverse agonists (5 μM) for 2 days. Fold changes were calculated with IgG enrichment in cells treated with vehicle control set as 1. n = 3 biological replicates.
(C) qRT-PCR (left) and immunoblotting (right) analysis of PGC-1β gene and protein in MG63 and 143B cells treated with vehicle or with RORγ inverse agonists (5 μM) for 2 days n = 3 biological replicates.
(D) PGC-1β promoter-driven reporter assay in 293T cells transfected with the indicated plasmid constructs. n = 3 biological replicates.
(E) ATP production assessed by Cell-Titer GLO (Promega) in MG63 and 143B cells treated with RORγ inverse agonists (5 μM) for 2 days n = 3 biological replicates.
(F) OCR measured by a Seahorse analyzer in MG63 and 143B cells transfected with siRNA against PGC-1β for 2 days n = 3 biological replicates.
(G) The ratio of NAD+/NADH in MG63 and 143B cells transfected with siRNA against PGC-1β for 2 days was assessed using an NAD+/NADH Assay Kit. n = 3 biological replicates.
(H) PGC-1β stimulated RORγ activation, and the effects of RORγ inverse agonists were measured by reporter gene assay. n = 3 biological replicates.
(I) The interactions of RORγ with PGC-1β were detected in HEK293T cells overexpressing RORγ and PGC-1β by coIP assay. n = 3 biological replicates.
(J) ChIP-qPCR analysis of the relative enrichment of PGC-1β at the promoters of ETC genes (UQCR11, COX5B, and ATP5F1D) in 143B cells treated with vehicle or RORγ inverse agonists (5 μM) for 2 days. n = 3 biological replicates.
(K) Immunoblotting analysis of the indicated proteins in MG63 cells overexpressing PGC-1β. n = 3 biological replicates.
(L) ROS generation in MG63 cells with or without overexpression of PGC-1β and treated with RORγ inverse agonists (5 μM) for 2 days was evaluated by flow cytometry using DCFH-DA. n = 3 biological replicates.
(M) MG63 cells with or without overexpression of PGC-1β were treated with vehicle or the indicated concentrations of RORγ inverse agonists for 2 days. Cells were harvested to determine cell growth by counting viable cells. n = 3 biological replicates. All data shown above are the mean ± SD. ∗p < 0.05, ∗∗p < 0.01, ∗∗∗p < 0.001.
Since PGC-1β is a master regulator of mitochondrial function, we then asked whether PGC-1β was involved in RORγ-mediated OXPHOS activation and cell survival in OS. We thus examined the roles of PGC-1β in OS. The results showed that PGC-1β is overexpressed in OS cells and that its expression is positively correlated with the expression of RORγ (Figures S5C and S5D). We further analyzed single-cell sequencing data and found a positive correlation between RORγ and PGC-1β expression in clinical OS tumors (Figures S6A–S6F). Furthermore, a high level of RORγ and PGC-1β in OS was markedly associated with poor survival (Figure S6G). PGC-1β knockdown significantly inhibited OS cell survival by promoting apoptosis and ferroptosis, while PGC-1α knockdown had no such effects (Figures S5E–S5I). As expected, PGC-1β knockdown inhibited the expression of RORγ-mediated ETC genes, reduced oxidative phosphorylation (OCR), and increased ROS production (Figures 4F and S5J–S5L). Furthermore, PGC-1β knockdown also caused a decrease in ATP production and the ratio of NAD+/NADH (Figures 4E, 4G, and S5M). Since PGC-1β is known to regulate gene expression by acting as a coactivator of NRs, we tested whether PGC-1β physically interacts with RORγ. In a gene reporter assay, PGC-1β strongly stimulated RORγ activation. RORγ inverse agonists significantly suppressed the coactivator function of PGC-1β on RORγ while having no effects on other NRs (Figures 4H and S5N). Coimmunoprecipitation revealed that RORγ could physically interact with PGC-1β in OS cells (Figure 4I). Moreover, our ChIP-qPCR results verified that PGC-1β occupied the RORγ binding site at the ETC genes (Figure 4J). We then examined the effect of RORγ inhibition on OS cells via PGC-1β-mediated mitochondrial function. The results showed that PGC-1β overexpression effectively prevented RORγ inverse agonist-induced OS cell growth inhibition and ROS production (Figures 4K–4M). These data collectively suggest that RORγ physically interacts with PGC-1β to control OXPHOS and mitochondrial function.
RORγ inverse agonists potently inhibit OS tumor growth and metastasis in vivo
We next assessed the effects of RORγ inverse agonists on OS tumor growth in vivo. RORγ inverse agonists (5 mg/kg, five times per week) or vehicle was intraperitoneally injected into mice bearing 143B xenograft tumors. Tumor volume and body weight were monitored twice a week. The results showed that RORγ inverse agonists strongly suppressed tumor growth compared with that in the vehicle group (Figure 5A). Meanwhile, inverse agonists did not cause any significant change in mouse body weight or in the histology of major organs, such as the liver and kidney, which indicated that the treatment is well tolerated by mice (Figures S7A and S7B). Moreover, we examined the effect of RORγ inverse agonists on a patient-derived xenograft (PDX) model derived from both methotrexate (MTX)- and cisplatin-resistant OS patients and found that both RORγ inverse agonists significantly suppressed OS tumor growth resistance (Figures 5B and S7C). Immunoblot analysis of the xenograft tumors demonstrated that RORγ inverse agonists significantly decreased the expression of PGC-1β, Myc, key ETC proteins, GPX4, and SLC7A11 and increased the levels of the ferroptosis markers 4-HNE and MDA and the apoptosis markers cleaved caspase-3/7 and cleaved PARP1 (Figures 5C and S7D). We next constructed OS metastasis models, by tail vein injection of 143B cells into mice, to evaluate the impact of RORγ inverse agonists on metastasis development. As shown in Figures 5D and 5E, GSK805 and XY018 effectively inhibited tumor metastasis and significantly reduced lung metastasis tumor nodules. Together, these results demonstrate that RORγ inverse agonists can potently inhibit OS tumor growth and metastasis in vivo.
Figure 5.

RORγ inverse agonists potently inhibit OS tumor growth
(A) Nude mice bearing 143B xenografts received RORγ inverse agonists (intraperitoneally [i.p.], 5 mg/kg, n = 6) or vehicle (n = 6) five times per week. Mean tumor volume ± SEM, mean tumor weight ± SEM, and representative tumor image are shown.
(B) NOD/SCID mice bearing OS patient-derived xenografts (PDXs) received RORγ inverse agonists (i.p., 5 mg/kg, n = 6) or vehicle (n = 6) five times per week. Mean tumor volume ± SEM and mean tumor weight ± SEM.
(C) Immunoblotting analysis of the indicated proteins in 143B xenograft tumors after 27 days of treatment with vehicle or RORγ inverse agonists as in (A).
(D and E) Effects of RORγ inverse agonists on OS metastasis. 143B-Luci cells were intravenously injected into the tail vein of 5-week-old male NOD/SCID mice. Mice (n = 6) were then treated as in (A). (D) Tumor growth was monitored by bioluminescent imaging, and representative images of tumor sites in the lung are shown. (E) Lung sections were stained with H&E, and the tumor nodules were counted and analyzed. Scale bars, 2000 μm. Data shown are the mean ± SEM. ∗p < 0.05, ∗∗p < 0.01, ∗∗∗p < 0.001.
RORγ inverse agonists overcome resistance to chemotherapy in OS
High OXPHOS promotes chemotherapeutic resistance in several cancers.37,38 Elevated ROS drive the cellular response to DNA damage caused by chemotherapeutic agents.39,40 We next assessed whether RORγ inhibition could sensitize OS to chemotherapy. First, we sought to examine the therapeutic potential of combining RORγ inverse agonists with chemotherapeutic agents in vivo. We established the chemotherapeutic agent-resistant subline cell line U2OS-MTX-R by treating U2OS cells with increasing concentrations of MTX over 6 months (Figures 6A, S8A, and S8B). We then examined the expression of RORγ and ETC proteins in parental and resistant OS cells. Interestingly, the expression of these proteins was strongly increased in U2OS-MTX-R cells, suggesting that the resistant cells have higher OXPHOS status (Figure 6B). We next assessed whether inhibiting RORγ could resensitize resistant cells to chemotherapeutic agents. The results showed that RORγ inverse agonists synergize with chemotherapeutic agents to kill both parental and drug-resistant OS cells (Figures 6C, 6D, S8C, and S8D). As expected, combination treatment with relatively low concentrations of RORγ inverse agonists and chemotherapeutic agents dramatically reduced colony formation (Figures S8E and S8F). Next, we transplanted chemoresistant U2OS-MTX-R cells into nude mice and treated the mice with the RORγ inverse agonists GSK805 and MTX at 5 mg/kg. GSK805 alone inhibited tumor growth, while MTX alone did not display any significant effect. Interestingly, GSK805 significantly sensitized resistant tumors to MTX therapy (Figures 6E, 6F, S8G, and S8H). We then examined the underlying mechanism of RORγ inverse agonist effects on chemoresistant OS. We showed that RORγ inverse agonists decreased the expression of a panel of genes linked to chemotherapy resistance, including ATP-binding cassette (ABC) family members (ABCB1 and ABCC1)41,42,43 (Figure S8I). To provide data that are more predictive of OS patients’ therapeutic outcomes, we measured the efficacy of RORγ inverse agonists in an MTX- and cisplatin-resistant OS PDX model and found that RORγ inverse agonists alone significantly inhibited tumor growth. In addition, paclitaxel (PAC), a potent chemotherapeutic drug that has been advanced into clinical trials for OS (NCT02945800), also strongly suppressed the growth of resistant PDX tumors. Remarkably, the combination treatment of RORγ inverse agonists and paclitaxel displayed synergistic tumor growth inhibition (Figures 6G, 6H, S8K, and S8L).
Figure 6.

RORγ inverse agonists overcome resistance to chemotherapy in OS
(A) The viability of parental U2OS and methotrexate-resistant U2OS cells treated with the indicated concentrations of methotrexate (MTX) for 4 days was measured by Cell-Titer GLO. n = 3 biological replicates.
(B) Immunoblotting analysis of the indicated proteins in U2OS and methotrexate-resistant U2OS cells. n = 3 biological replicates.
(C) Methotrexate-resistant U2OS cells were treated with the indicated RORγ inverse agonists for 2 days. Cells were harvested to determine cell growth by counting viable cells. n = 3 biological replicates.
(D) Methotrexate-resistant U2OS cells were treated with the indicated RORγ inverse agonists and methotrexate for 2 days. Cells were harvested to determine cell growth by counting viable cells. n = 3 biological replicates.
(E and F) Nude mice bearing methotrexate-resistant U2OS cell xenografts received RORγ inverse agonists (i.p., 5 mg/kg, n = 6) or vehicle (n = 6) five times per week and methotrexate (i.p., 5 mg/kg, n = 6) twice a week. (E) Mean tumor volume ± SEM. (F) Mean tumor weight ± SEM.
(G and H) NOD/SCID mice (n = 6) bearing OS PDXs received RORγ inverse agonists (i.p., 4 mg/kg, n = 6) or vehicle (n = 6) five times per week and paclitaxel (i.p., 5 mg/kg, n = 6) twice a week. (G) Mean tumor volume ± SEM. (H) Mean tumor weight ± SEM.
(I) Schematics illustrating chemo-resistant xenograft tumor establishment and treatment.
(J and K) NOD/SCID mice bearing paclitaxel-resistant xenografts (143B-PAC-R) received RORγ inverse agonists XY018 (i.p., 5 mg/kg, n = 6) or vehicle (n = 6) five times per week and paclitaxel (i.p., 5 mg/kg, n = 6) once a week. (J) Mean tumor volume ± SEM. (K) Mean tumor weight ± SEM.
(L) Anti-Ki67, cleaved caspase-3, and 4-HNE immunohistochemistry images and H&E staining of tumor sections are shown. Scale bar, 200 μm. Statistical analysis of IHC data is shown in the right panel. n = 3 biological replicates. All data from in vitro experiments shown above are the mean ± SD. ∗p < 0.05, ∗∗p < 0.01, ∗∗∗p < 0.001.
Next, we established a chemotherapeutic agent-resistant subcutaneous xenograft model by transplanting 143B cells into nude mice and treating the mice with the chemotherapy drug PAC at 5 mg/kg weekly. After two passages, chemo-resistant tumors were treated with RORγ inverse agonists XY018 and PAC at 5 mg/kg. XY018 alone inhibited tumor growth, while PAC alone did not, XY018 significantly sensitized resistant tumors to PAC therapy (Figures 6I–6K and S8J). Importantly, neither the single nor the combination treatments affected animal body weight or organs over the course of the study, suggesting that the RORγ inverse agonists or the combination treatment strategy is tolerable (Figures S8K and S8L). Moreover, IHC analysis of Ki67, cleaved caspase-3 and 4-HNE in the tumor sections showed that RORγ inverse agonists significantly inhibited cancer cell proliferation (Figure 6L). Together, the results strongly suggest that RORγ inverse agonists alone or in combination with chemotherapy can be a strategy for the effective treatment of OS.
Discussion
Targeted therapy has made significant breakthroughs over the past three decades for multiple cancer types; however, chemotherapy remains the backbone of OS treatment due to the lack of an effective therapeutic target. The survival rate in patients is low and remains stagnant. Here, we provide evidence to support RORγ as a potential therapeutic target for OS therapy. RORγ was overexpressed in the tumors of OS patients. Genetic and pharmacological inhibition of RORγ strongly suppressed chemotherapy resistance OS tumor growth and sensitized resistant tumors to chemotherapy by inhibiting the OXPHOS program both in vitro and in vivo.
Based on the crucial role of RORγt in inflammation-associated Th17 cell development and autoimmune diseases, intensive studies are focused on therapeutic development for targeting RORγ in autoimmune diseases.25,29,30,31 Dozens of inverse agonists against RORγ activity have been developed by pharmaceutical companies (e.g., GSK, Merck, Genentech) and academic laboratories, some of which are entering clinical trials and present great promise for the treatment of autoimmune and metabolic diseases.25,30,44 Meanwhile, these reagents also provide opportunities for curing other diseases, such as cancers. However, the role of RORγ in cancers needs to be elucidated first. In this study, employing an siRNA library of NRs, we discovered that RORγ siRNA caused the strongest growth inhibition in OS cells. Furthermore, the RORγ inverse agonists, developed by us and others, potently inhibited OS tumor growth in both cell line-based and chemotherapy resistance PDX models. Since resistance to chemotherapy is the main cause of treatment failure in OS, we went on to show that the expression of RORγ was strongly increased in resistant OS cells and that its overexpression is needed for resistance. RORγ inverse agonists and chemotherapy drugs displayed strong synergism against OS in vivo. Therefore, our data suggest that targeting RORγ can be broadly used for OS therapy.
Employing RNA-seq for gene expression profiling, we found that targeting RORγ with its selective inverse agonists effectively inhibited the expression of genes of the OXPHOS activity signature. Recent studies have revealed that the metabolic switch toward OXPHOS promotes tumor progression in certain cancers, especially in resistant and cancer stem cells. Here, our meta-analysis of datasets containing 18 normal samples and 18 OS tumors indicated that OS exhibited hyperactivated OXPHOS, accompanied by upregulation upstream of the TCA cycle and fatty acid oxidation. OS tumor cells are highly sensitive to OXPHOS inhibitors. PGC-1s (PGC-1β and PGC-1α) are key regulators of mitochondrial functions in physiology and cancer metabolism. Interestingly, RORγ formed a positive regulatory loop with PGC-1β, not PGC-1α, to directly activate the expression of ETC components to enhance OXPHOS in OS tumor cells. RORγ inverse agonists disrupted the RORγ-PGC-1β axis to decrease the OCR rate, ATP production, and mitochondrial membrane potential, increase ROS production, and induce cell apoptosis and ferroptosis. ROS scavengers effectively blocked OS cell death induced by RORγ inverse agonists. These data together suggested that targeting RORγ prevented OS tumor progression by suppressing the OXPHOS program. Because potent and selective RORγ inverse agonists are readily available, our findings here may have immediate implications in developing therapeutic strategies for OS.
However, the overall impact of RORγ inverse agonists on OS tumors is unlikely to be limited to OXPHOS. Our gene profiling data also indicate that RORγ inverse agonists suppress the expression of genes associated with cholesterol and fatty acid metabolism, both of which play crucial roles in cancer cell survival and progression. Moreover, although our current study focused on the function of RORγ in OS tumor cells, we could not rule out the possible roles of RORγ in the tumor microenvironment (TME). RORγt, a thymus-specific isoform of RORγ, plays a critical role in driving the differentiation and expansion of type 17 T cells, including Th17 and Tc17 cells, and activates them to secrete effector cytokines such as IL-17A. Through their recruitment or interactions with other immune cells, such as neutrophils, MDSCs, M2 macrophages, and Treg cells, tumor-infiltrating IL-17-producing T and Th17 cells exhibit potent protumoral functions in a variety of preclinical models.45,46,47,48 A recent study showed that serum IL-17A was elevated in OS patients and promoted the metastasis of OS.49 Therefore, further investigation is required to determine how RORγ expression on immune cells modulates OS tumor progression.
Limitations of the study
The limitations of our study include focusing exclusively on the function of RORγ in OS tumor cells without considering its potential involvement in the TME. RORγt, the thymus-specific isoform of RORγ, is known to play a critical role in driving Th17 cell differentiation and expansion, as well as IL-17 production in innate and adaptive immune cells, suggesting its potential role in the TME. Therefore, further studies are needed to elucidate the function of RORγ expressed in immune cells in OS. An investigation of the roles of RORγ in both tumor development and the TME in a model system with a functional immune system will provide a more comprehensive understanding of the overall impact of RORγ. Utilization of multiple methodologies, including single-cell sequencing, may help to achieve this goal.
STAR★Methods
Key resources table
| REAGENT or RESOURCE | SOURCE | IDENTIFIER |
|---|---|---|
| Antibodies | ||
| Rat monoclonal anti-RORγ | Thermo Fisher Scientific | Cat#14-6988-82; RRID:AB_1834475 |
| Rabbit monoclonal anti-GAPDH | Cell Signaling Technology | Ca#2118; RRID:AB_561053 |
| Rabbit polyclonal anti-PARP | Cell Signaling Technology | Cat#9542; RRID:AB_2160739 |
| Rabbit polyclonal anti-cleaved-Caspase-3 | Cell Signaling Technology | Cat#9661; RRID:AB_2341188 |
| Rabbit monoclonal anti-AMPKα | Cell Signaling Technology | Cat#5832; RRID:AB_10624867 |
| Rabbit monoclonal anti-p-AMPKα1 (Ser485) | Cell Signaling Technology | Cat#2537; RRID:AB_659805 |
| Rabbit monoclonal anti-mTOR | Cell Signaling Technology | Cat#2983; RRID:AB_2105622 |
| Rabbit monoclonal anti-p-mTOR(Ser2448) | Cell Signaling Technology | Cat#5536; RRID:AB_10691552 |
| Rabbit monoclonal anti-Cystatin C | Cell Signaling Technology | Cat#24840; RRID:AB_2798885 |
| Rabbit monoclonal anti-PGC-1β | Abcam | Cat#ab176328; RRID:AB_2893194 |
| Mouse monoclonal anti-OXPHOS | Abcam | Cat#ab110411; RRID:AB_2756818 |
| Goat polyclonal anti-GPX4 | Abcam | Cat#ab116703; RRID:AB_10898676 |
| Rabbit polyclonal anti-4-HNE | Abcam | Cat#ab46545; RRID:AB_722490 |
| Rabbit polyclonal anti-VDAC1 | Abcam | Cat#ab15895; RRID:AB_2214787 |
| Rabbit monoclonal anti-ACC1 | Beyotime Biotechnology | Cat#AF1867; RRID:AB_3096398 |
| Rabbit polyclonal anti-p-ACC(Ser79) | Beyotime Biotechnology | Cat#AA110; RRID:AB_3096395 |
| Mouse monoclonal anti-Bcl-xL | Santa Cruz | Cat#sc-136207; RRID:AB_2064727 |
| Rabbit polyclonal anti-SLC7A11 | ABclonal | Cat#A13685; RRID:AB_2760546 |
| Anti-mouse IgG, HRP-linked Antibody | Cell Signaling Technology | Cat#7076; RRID:AB_330924 |
| Anti-rat IgG, HRP-linked Antibody | Cell Signaling Technology | Cat#7077; RRID:AB_10694715 |
| Anti-rabbit IgG, HRP-linked Antibody | Cell Signaling Technology | Cat#7074; RRID:AB_2099233 |
| Bacterial and virus strains | ||
| DH5α | TSINGKE | Cat#TSC-C14 |
| Biological samples | ||
| Osteosarcoma patient-derived xenografts (PDX) | the First Affiliated Hospital, Sun Yat-sen University | N/A |
| Chemicals, peptides, and recombinant proteins | ||
| Z-VAD-FMK | TargetMol | Cat#T7020 |
| XY018 | WuXi App Tec | N/A |
| GSK805 | WuXi App Tec | N/A |
| Paclitaxel | Selleck | Cat#S1150 |
| Antimycin A | TargetMol | Cat# T37497 |
| Rotenone | Selleck | Cat#S2348 |
| N-acetyl-L-cysteine | Beyotime Biotechnology | Cat#S0077 |
| Methotrexate | Acmec Biochemical | Cat#M64330 |
| IACS-010759 | TargetMol | Cat#T5337 |
| Erastin, | TargetMol | Cat#T1765 |
| Ferrostatin-1 | TargetMol | Cat#T6500 |
| Critical commercial assays | ||
| NAD+/NADH ratio Assay Kit | Beyotime Biotechnology | Cat#S0175 |
| Lipid oxidation (MDA) Assay Kit | Beyotime Biotechnology | Cat#S0131S |
| Cell-Titer GLO | Promega | Cat#G9241 |
| Caspase GLO 3/7 | Promega | Cat#G8090 |
| Luciferase reporter gene Assay Kit | Beyotime Biotechnology | Cat#RG028 |
| Reactive oxygen species Assay Kit | Beyotime Biotechnology | Cat#S0033S |
| FerroOrange Assay Kit | DOJINDO LABORATORIES | Cat#F374 |
| BODIPY™ 581/591 C11 (Lipid Peroxidation Sensor) | Thermo Fisher Scientific | Cat#D3861 |
| Cell Mito Stress Test Kit | Agilent Technologies | Cat#103015-100 |
| Glycolysis Stress Test Kit | Agilent Technologies | Cat#103020-100 |
| Deposited data | ||
| Raw and analyzed data | Gene Expression Omnibus | GEO: GSE99671, GSE39055, GSE126380, GSE28974, GSE33382 |
| scRNA-seq data | Gene Expression Omnibus | GEO: GSE152048 and GSE162454 |
| RNA-seq data | This paper | GSE261067 |
| Western blot original images in this paper | Mendeley Dataset | https://doi.org/10.17632/yzygjpm6k5.1 |
| Experimental models: Cell lines | ||
| U2OS cell line | ATCC | HTB-96 |
| MG63 cell line | ATCC | CRL-1427 |
| 143B cell line | ATCC | CRL-8303 |
| SJSA-1 cell line | ATCC | CRL-2098 |
| MNNG/HOS cell line | ATCC | CRL-1547 |
| HEK293T cell line | ATCC | CRL-11268 |
| 143B-Luci cell line | This paper | N/A |
| U2OS-MTX-R cell line | This paper | N/A |
| hMSCs cell line | Cyagen Biosciences | HUXMA-01001 |
| Experimental models: Organisms/strains | ||
| Nude mice | Nanjing Biomedical Research Institute of Nanjing University | N/A |
| NOD/SCID mice | Nanjing Biomedical Research Institute of Nanjing University | N/A |
| Oligonucleotides | ||
| siRNA targeting sequence | This paper | See Table S1 |
| qRT-PCR Primer sequence | This paper | See Table S2 |
| shRORγ targeting sequence | This paper | GCCCTCATATTCCAACAACTT |
| ChIP-PCR Primer sequence | This paper | See Table S3 |
| Recombinant DNA | ||
| Plasmids pBD-RORγ-LBD | This paper | N/A |
| Plasmids PBD-ERRa-LBD | This paper | N/A |
| Plasmids PCMV-PPARγ-LBD | This paper | N/A |
| Plasmids pFR-luci | This paper | N/A |
| Plasmids pcDNA-PGC-1β | This paper | N/A |
| Plasmids PLX-304- RORγ | This paper | N/A |
| Software and algorithms | ||
| ImageJ | ImageJ | https://imagej.nih.gov/ij/ |
| GraphPad Prism7 | GraphPad | https://www.graphpad.com |
| Flow Jo 7.6 | Flow Jo | https://www.flowjo.com |
| R version 4.2.0 | R Core Team 2017 | https://www.r-project.org |
| RStudio (−2023.12.1–402) | Posit.co | https://posit.co/download/rstudio-desktop/ |
| ggplot2 (v3.5.5) | N/A | https://ggplot2-book.org/ |
| GSVA package v1.40.1 | N/A | http://www.sagebase.org |
| Gene set enrichment analysis (GSEA) | Broad Institute | http://www.broad.mit.edu/gsea/ |
Resource availability
Lead contact
Further information and requests for resources and reagents should be directed to and will be fulfilled by the lead contact, Junjian Wang (wangjj87@mail.sysu.edu.cn).
Materials availability
This study did not generate new materials.
Data and code availability
-
•
This paper does not report the original code.
-
•
The RNA-seq data have been deposited in Gene Expression Omnibus with GEO accession GSE261067.
-
•
Raw data of Western blot imagines from Figures in this paper were deposited in Mendeley at https://doi.org/10.17632/yzygjpm6k5.1
-
•
Any additional information required to reanalyze the data presented in this paper is available upon request by the lead contact.
Experimental model and study participant details
Cell lines and cell culture
U2OS, MG63, 143B, SJSA-1, MNNG/HOS,143B-Luci,U2OS-MTX-R and HEK293T cells were cultured in Dulbecco’s modified Eagle’s medium (DMEM); Human Mesenchymal Stem Cells (hMSCs) were cultured in α-MEM (Gibco). All culture media were supplemented with 10% fetal bovine serum and 1% penicillin/streptomycin (Gibco). Cells were cultured at 37°C in 5% CO2 incubators.
Organoid culture and viability assay
Organoids were cultured from patient- or cell-derived xenografts when the tumor size reached 500 mm3. Briefly, the digestion mix of Ad-DMEM/F-12 medium (Gibco, USA) and 1 mg/mL collagenase IV (Sigma, USA) was added to the thoroughly sliced, dissected tumors were transferred, and the mixture was incubated for 40 min at 37°C. Ninety-six-well plates (Costar, USA) were seeded with a mixture of isolated organoids and 5 μL of Matrigel (Costar, USA). The culture medium contained Ad-DMEM/F-12 with B27 supplement (1×), nicotinamide (10 mM), N-acetyl-L-cysteine (1.25 mM), EGF (5 ng/mL), A83-01 (500 nM), SB202190 (10 μM), Y-27632 (10 μM), Noggin (100 ng/mL), R-Spondin 1 (250 ng/mL), FGF2 (5 ng/mL), FGF 10 (10 ng/mL), penicillin/streptomycin (1×) and glutamine (1×). After 4 days, 100 μL of serially diluted compounds was administered to the cells. Cell-Titer Glo reagents (Promega, USA) were added after 4 days of incubation, and luminescence was then calculated. The medium was carefully aspirated after 4 days of incubation, 100 μL of live/dead reagents (US EVERBRIGHT) were added, and 30 min of incubation at room temperature followed. Images of live cells were captured with calcein AM (494/517 nm), and dead cells were identified using PI (535/617 nm) on a fluorescence microscope. The above assays were run in triplicate.
Animals and in vivo studies
Four-week-old male nude mice (body weight approximately 16 g) and NOD/SCID mice (body weight approximately 18 g) were purchased from Nanjing Biomedical Research Institute of Nanjing University (Nanjing, China). Then, 1×10⁷ 143B or U2OS-MTX-R cells were suspended in a total of 100 μL PBS and Matrigel (1:1) and implanted subcutaneously into the dorsal thigh of the mice. When the tumor volume reached approximately 50 mm3, the mice were grouped randomly. Then, the mice were randomly divided into four groups (n > 6) and treated intraperitoneally (i.p.) with 100 μL of either vehicle or RORγ inverse agonists XY018 (5 mg/kg), GSK805 (5 mg/kg), paclitaxel (5 mg/kg) or methotrexate (5 mg/kg) five times per week. Tumor volume and body weight were measured two times per week. The volume was calculated with the Equation V = π/6 (length × width2). The mice were sacrificed at the end of the studies. Tumors were harvested, weighed and analyzed by immunohistochemistry and immunoblotting assays.
For the patient-derived xenograft (PDX) tumor model, osteosarcoma with methotrexate (MTX) and cisplatin resistance was obtained from the First Affiliated Hospital, Sun Yat-sen University in accordance with institution-approved protocols. Informed consent was obtained from the patient in accordance with the Declaration of Helsinki. PDX tumors were propagated in the dorsal thigh on both sides of the mice as previously described.50 The effect of RORγ inverse agonists on PDX tumor growth was evaluated as described above.
For the tail-vein osteosarcoma metastasis model, 143B-Luci cells were used at 1×10⁶ per mouse, and cells were intravenously injected into the tail vein of 5-week-old male NOD/SCID mice (six mice per group). The mice were monitored for lung metastases using the IVIS Lumina Imaging System (PerKinElmer, USA). After two months, the mice were euthanized, and the lungs were collected and subjected to subsequent assays. The number of metastatic nodules was determined microscopically in the lung sections.
All animal care and experiments were approved by the Institutional Animal Care and Use Committee of Sun Yat-sen University (Guangzhou, China). NO: SYSU-IACUC-2022-000680/SYSU-IACUC-2023-001224/SYSU-IACUC-2023-001224.
Method details
Cell viability
Cells were seeded in 96-well plates at 500–1000 cells per well (optimum density for growth) in a total volume of 100 μL of media. Fifty microliters of serially diluted compounds in 250 μL of media were added to the cells per well 24 h later. After 4 days of incubation, Cell-Titer GLO reagents (Promega) were added, and luminescence was measured on a GLOMAX microplate luminometer (Promega) according to the manufacturer’s instructions. The results are presented as percentages, and vehicle-treated cells were set at 100. Dose groups are presented as percentages of treatment cell number/vehicle-treated cell number.
RORγ shRNA and overexpression lentivirus production and siRNA transfection
Lentiviral plasmids encoding shRNA targeting RORγ/RORC (TRCN0000033658) were purchased from Sigma-Aldrich. For RORγ overexpression, a lentiviral plasmid was constructed by placing human RORγ cDNA into the pLX304 vector as previously described. Lentiviral particles were produced in 293T cells after cotransfecting the above lentiviral vectors, packaging plasmids (psPAX2) and envelope plasmids (pMD2.G). The negative control siRNA (siScramble) sequence and the target sequences were chemically synthesized by Synbio Technologies (Suzhou, China). The detailed sequences are shown in Table S1. For siRNA transfection, MG63 or 143B cells were seeded into 6-well plates at 1 × 10⁵ cells/well, incubated overnight to reach 60–70% confluence, and transfected with synthetic siRNAs using Dharmafectin (Dharmacon) at a 20 nM concentration. Cells were then harvested at the indicated times for the different assays.
Immunohistochemistry
For immunohistochemistry (IHC) analysis, tumor sections were blocked with 5% normal goat serum with 0.1% Triton X-100 and 3% H2O2 in PBS for 60 min at room temperature and then incubated with appropriate primary antibodies at 4°C overnight. IHC staining was performed with horseradish peroxidase (HRP) conjugates using DAB detection. Nuclei were counterstained with Hoechst. Images were taken with EVOS FL Auto (USA).
Caspase-3/7 activity and cell growth
Briefly, caspase-3/7 activity was measured by using a luminescent caspase-Glo 3/7 assay kit (Promega Corp.) following the manufacturer’s instructions. The cell protein concentration was quantified to standardize the results. For cell growth, cells were seeded in 6-well plates at 1×10⁵ per well and treated as indicated. Total viable cell numbers were counted by a cell counter.
Colony formation
Five hundred cells were seeded in a well of 6-well plates and cultured for 14 days, with the medium changed as well as the compound added every 3 days. Then, the cells were fixed in 4% paraformaldehyde for 15 min, the plates were washed with PBS three times, and the cell colonies were stained with crystal violet for 15 min. The numbers of cell colonies were counted after being washed three times with PBS.
Analysis of ROS production
Cells were treated with RORγ inverse agonists for 48 h (cellular ROS level) and washed with PBS. Then, the cells were incubated with 10 μM DCFH-DA (Beyotime Biotechnology, Shanghai, China) or 5 μM MitoSOX Red (Thermo Scientific, M36008, United States) in serum-free medium at 37°C for 1 h and then washed with PBS. ROS levels were analyzed on a flow cytometer (Guava easyCyte, Merck KGaA, Darmstadt, German) using a 519 nm filter for DCFH-DA fluorescein detection. Data were collected from at least 10,000 cells for each sample. For lipid ROS level, cells were seeded into 15 mm glass-bottom dishes for detection by confocal microscopy and treated with RORγ inverse agonists for 48 h. Then, cells were incubated with 5 μM C11-BODIPY 581/591 (Invitrogen, Carlsbad, CA, USA) in serum-free medium at 37°C for 1 h in the dark. The plates were washed thrice with PBS. Then, the cells were subsequently stained with DAPI (40728ES50, Yeasen) for 15 min and washed thrice with PBS. Then, images were captured by a Laser Scanning Confocal Microscope FV3000 (Olympus, Japan). Five representative fields were captured for each condition under identical exposure times.
MDA assay and FerroOrange assay
The MDA assay was performed by using the Lipid Peroxidation MDA Assay Kit (S0131, Beyotime Biotechnology, Shanghai, China) according to the manufacturer’s instructions. The samples and standards were prepared, and the OD value was measured at 532 nm. MDA concentrations (nmol/mL) were calculated as μmol/mg protein. For the FerroOrange assay, cells were seeded into 15 mm glass-bottom dishes for detection by confocal microscopy. After washing three times with HBSS buffer, cells were stained in 1 μmol/L Ferroorange (F374, DOJINGO, Japan) in HBSS for 30 min at 37°C in an incubator with 5% CO2 and imaged immediately. Treatments were staggered to ensure precise staining duration. Then, images were captured by a Laser Scanning Confocal Microscope FV3000 (Olympus, Japan). Five representative fields were captured for each condition under identical exposure times. Fluorescence intensity was quantified by ImageJ software.
Quantitative real-time PCR
Total RNA was extracted from cells in 6-well plates, and cDNA was prepared according to the manufacturer’s protocol. qRT-PCR was amplified and measured on the Bio-Rad CFX96 (Bio-Rad, USA) in the presence of SYBR Green. Then, the fluorescence values were collected, and a melting-curve analysis was performed. Primers are listed in Table S2.
Chromatin immunoprecipitation (ChIP)-qPCR
First, formaldehyde was added to the media, followed by quenching with glycine. The cells were lysed using Farnham lysis buffer and centrifuged to remove the supernatant. Subsequently, the cell pellet was rapidly frozen in liquid nitrogen and resuspended using Farnham lysis buffer, followed by centrifugation. The supernatant was then discarded, and RIPA buffer was added to the pellet. Sonication was performed using the Covaris E220 following the manufacturer’s instructions. Third, the cell lysate was mixed with magnetic beads and placed on a magnetic rack to remove the supernatants. The beads were incubated with antibody and gently rotated overnight. The DNA fragments were purified using a GeneJET PCR Purification kit (Thermo Scientific, K0702, United States). The purified DNA and specific primers for the PGC-1β promoter region were used to amplify target DNA. Anti-RORγ rat serum was generated by Covance using purified GST-human RORγ fragment (amino acids 79–301) expressed in Escherichia coli. The PCR primers used in the ChIP assays were listed in Table S3. ChIPs were performed with each experimental point in triplicate, and each experiment was repeated three times.
Western blotting analysis
Cells were seeded in 6-well plates and lysed in RIPA lysis buffer containing 150 mM Tris-HCl, 150 mM NaCl, 1% NP-40, 0.1% SDS, and protease inhibitors. Cell lysates were quantified by BCA Protein Assay (Beyotime, P0009). Equal amounts of soluble proteins were separated by SDS‒PAGE. Proteins were transferred to PVDF membranes (EMD Millipore, ISEQ00010) and blocked with 5% skim milk. The membranes were incubated overnight at 4°C with antibodies diluted at 1:1,000. HRP secondary antibodies (Cell Signaling Technology) were used to incubate the membranes after washing with TBST buffer. Western blotting analysis was performed with antibodies specifically against RORγ, PGC-1β, and the other related proteins. All antibodies used in this study are described in key resources table.
Transient transfection and luciferase assays
Transient transfections were performed by using Lipofectamine 2000 (Invitrogen, Carlsbad, CA, USA). For luciferase reporter gene assays, 293T cells were seeded at 104 cells per well in 96-well plates in phenol red-free DMEM (HyClone, Logan, UT, USA) supplemented with 10% (v/v) charcoal-stripped fetal bovine serum and cotransfected with pBD-RORγ-LBD or PBD-ERRa-LBD or PCMV-PPARγ-LBD (25 ng per well) and pFR-luci (25 ng per well) with pcDNA-PGC-1β (10 ng per well) plasmids. Renilla luciferase plasmid (40 ng per well) was used as an internal control. Twenty-four hours after transfection, transfected cells were treated with RORγ inverse agonists for another 48 h before cells were harvested for luciferase assays. Luciferase activity was performed following the Dual-Luciferase Reporter Assay System introduction (Promega Corp.).
Mitochondrial stress assay
Mitochondrial function was determined by measuring the oxygen consumption rate (OCR) of cells using the XF Cell Mito Stress Test Kit (Agilent Technologies) and Seahorse Bioscience instrument (XF96, Agilent). The assay medium was prepared by adding 1 mM pyruvate, 2 mM glutamine and 10 mM glucose according to the manufacturer’s protocol. Cells were seeded in 6-well plates and treated with RORγ inverse agonists for 48 h. Then, the cells were collected and seeded into an XF96 cell culture microplate. After 4 h of incubation, the cells were washed with assay medium twice and equilibrated for 1 h in a 37°C incubator lacking CO2. Following three baseline OCR measurements, the oxygen consumption rate (OCR) of cells was measured after sequential addition of oligomycin (1 μM), carbonyl cyanide-4 (trifluoromethoxy) phenylhydrazone (FCCP) (1 μM), and rotenone/antimycin A (0.5 μM). Six wells were utilized per condition to calculate the OCR. The cell number was quantified to normalize the results, and the assay results were analyzed using Wave program 2.4.0 (Seahorse Bioscience).
RNA sequencing analysis
Total RNA was extracted from OS cells, which were treated with vehicle or RORγ inverse agonist for 48 h. RNA-seq libraries from 2 μg total RNA were prepared by using Illumina Tru-Seq RNA Sample, according to the manufacturer’s instructions. RNA sequencing (RNAseq) analysis was performed by BGI (Beijing Genomics Institute, Shenzhen, China). Briefly, mRNA with a polyA tail was enriched by magnetic beads with OligodT. cDNA was synthesized in a high-temperature system and purified by the kit, then using the BGISEQ platform for RNA-seq. To generate clean reads, raw reads were filtered by using SOAPnuke software. Then, we used HISAT (Hierarchical Indexing for Spliced Alignment of Transcripts) and Bowtie2 to compare clean reads and the reference genome sequence. RSEM was used to calculate the gene expression level of each sample. Transcripts were assembled, differentially expressed genes were generated, and heatmaps were drawn.
Bioinformatics analysis
The gene expression profile datasets GSE99671, GSE39055 and GSE126380 were downloaded from the Gene Expression Omnibus (GEO) database. Data were analyzed by the R program (Version 3.4, http://www.bioconductor.org) with the edgeR package using the GSVA method. Java desktop software (http://software.broadinstitute.org/gsea/index.jsp) was used for GSEA. Genes were ranked according to the shrunken limma log2-fold changes, and the GSEA tool was used in ‘preranked’ mode with all default parameters. Bubble chart analysis was performed by using the OmicShare tools (http://www.omicshare.com/tools).
Quantification and statistical analysis
All analyses were conducted with GraphPad Prism 8 (GraphPad Software, USA). In vitro experiment, the results are presented as the mean ± SD from at least three independent experiments. As for in vivo studies, the tumor volume and tumor weight data are presented as the mean ± SEM. A two-tailed unpaired Student’s t test was used for comparisons between two groups and, one-way ANOVA test was used for comparisons between three or more groups. p < 0.05 was considered to be significant. p values were calculated for ∗p < 0.05, ∗∗p < 0.01, ∗∗∗p < 0.001.
Acknowledgments
We thank Tiebang Kang for providing 143B-Luci cells and Wei Zhao for providing patient-derived xenograft models. This research was supported by the National Natural Science Foundation of China (81872891, 82273956, and 82272968), the Guangdong Basic and Applied Basic Research Foundation (2019B151502016 and 2022B1515130008), the Key Research and Development Plan of Guangzhou City (202206080007), and the Science and Technology Planning Project of Guangdong Province (2023A0505010013).
Author contributions
J.W., P.L., and H.-W.C. conceived this project and designed the study. J.Z., Q.W., J.C., G.C., Z.Z., H.Z., J.X.Z., and Q.L. performed the experiments and analyzed the data. S.L. and H.L. performed organoids assay. S.J., G.S., and L.L. provided methodological support and conceptual advice. J.W. and Y.Y. wrote the manuscript. All authors discussed the results and commented on the manuscript.
Declaration of interests
The authors declare no competing interests.
Published: April 30, 2024
Footnotes
Supplemental information can be found online at https://doi.org/10.1016/j.xcrm.2024.101519.
Contributor Information
Yanqiu Yuan, Email: yuanyq8@mail.sysu.edu.cn.
Peiqing Liu, Email: liupq@mail.sysu.edu.cn.
Junjian Wang, Email: wangjj87@mail.sysu.edu.cn.
Supplemental information
References
- 1.Jiang Z.Y., Liu J.B., Wang X.F., Ma Y.S., Fu D. Current Status and Prospects of Clinical Treatment of Osteosarcoma. Technol. Cancer Res. Treat. 2022;21 doi: 10.1177/15330338221124696. [DOI] [PMC free article] [PubMed] [Google Scholar]
- 2.Fan T.M., Roberts R.D., Lizardo M.M. Understanding and Modeling Metastasis Biology to Improve Therapeutic Strategies for Combating Osteosarcoma Progression. Front. Oncol. 2020;10:13. doi: 10.3389/fonc.2020.00013. [DOI] [PMC free article] [PubMed] [Google Scholar]
- 3.Yang J., Zhang A., Luo H., Ma C. Construction and validation of a novel gene signature for predicting the prognosis of osteosarcoma. Sci. Rep. 2022;12:1279. doi: 10.1038/s41598-022-05341-5. [DOI] [PMC free article] [PubMed] [Google Scholar]
- 4.Liu Y., Huang N., Liao S., Rothzerg E., Yao F., Li Y., Wood D., Xu J. Current research progress in targeted anti-angiogenesis therapy for osteosarcoma. Cell Prolif. 2021;54 doi: 10.1111/cpr.13102. [DOI] [PMC free article] [PubMed] [Google Scholar]
- 5.Gu L., Larson Casey J.L., Andrabi S.A., Lee J.H., Meza-Perez S., Randall T.D., Carter A.B. Mitochondrial calcium uniporter regulates PGC-1 alpha expression to mediate metabolic reprogramming in pulmonary fibrosis. Redox Biol. 2019;26 doi: 10.1016/j.redox.2019.101307. [DOI] [PMC free article] [PubMed] [Google Scholar]
- 6.Galai G., Ben-David H., Levin L., Orth M.F., Grünewald T.G.P., Pilosof S., Berstein S., Rotblat B. Pan-Cancer Analysis of Mitochondria Chaperone-Client Co-Expression Reveals Chaperone Functional Partitioning. Cancers. 2020;12 doi: 10.3390/cancers12040825. [DOI] [PMC free article] [PubMed] [Google Scholar]
- 7.Shangguan X., He J., Ma Z., Zhang W., Ji Y., Shen K., Yue Z., Li W., Xin Z., Zheng Q., et al. SUMOylation controls the binding of hexokinase 2 to mitochondria and protects against prostate cancer tumorigenesis. Nat. Commun. 2021;12 doi: 10.1038/s41467-021-22163-7. [DOI] [PMC free article] [PubMed] [Google Scholar]
- 8.Ashton T.M., McKenna W.G., Kunz-Schughart L.A., Higgins G.S. Oxidative Phosphorylation as an Emerging Target in Cancer Therapy. Clin. Cancer Res. 2018;24:2482–2490. doi: 10.1158/1078-0432.CCR-17-3070. [DOI] [PubMed] [Google Scholar]
- 9.Pamarthy S., Kulshrestha A., Katara G.K., Beaman K.D. The curious case of vacuolar ATPase: regulation of signaling pathways. Mol. Cancer. 2018;17:41. doi: 10.1186/s12943-018-0811-3. [DOI] [PMC free article] [PubMed] [Google Scholar]
- 10.Caro P., Kishan A.U., Norberg E., Stanley I.A., Chapuy B., Ficarro S.B., Polak K., Tondera D., Gounarides J., Yin H., et al. Metabolic signatures uncover distinct targets in molecular subsets of diffuse large B cell lymphoma. Cancer Cell. 2012;22:547–560. doi: 10.1016/j.ccr.2012.08.014. [DOI] [PMC free article] [PubMed] [Google Scholar]
- 11.Viale A., Pettazzoni P., Lyssiotis C.A., Ying H., Sánchez N., Marchesini M., Carugo A., Green T., Seth S., Giuliani V., et al. Oncogene ablation-resistant pancreatic cancer cells depend on mitochondrial function. Nature. 2014;514:628–632. doi: 10.1038/nature13611. [DOI] [PMC free article] [PubMed] [Google Scholar]
- 12.Cole A., Wang Z., Coyaud E., Voisin V., Gronda M., Jitkova Y., Mattson R., Hurren R., Babovic S., Maclean N., et al. Inhibition of the Mitochondrial Protease ClpP as a Therapeutic Strategy for Human Acute Myeloid Leukemia. Cancer Cell. 2015;27:864–876. doi: 10.1016/j.ccell.2015.05.004. [DOI] [PMC free article] [PubMed] [Google Scholar]
- 13.Hu Y., Xu W., Zeng H., He Z., Lu X., Zuo D., Qin G., Chen W. OXPHOS-dependent metabolic reprogramming prompts metastatic potential of breast cancer cells under osteogenic differentiation. Br. J. Cancer. 2020;123:1644–1655. doi: 10.1038/s41416-020-01040-y. [DOI] [PMC free article] [PubMed] [Google Scholar]
- 14.Kuntz E.M., Baquero P., Michie A.M., Dunn K., Tardito S., Holyoake T.L., Helgason G.V., Gottlieb E. Targeting mitochondrial oxidative phosphorylation eradicates therapy-resistant chronic myeloid leukemia stem cells. Nat. Med. 2017;23:1234–1240. doi: 10.1038/nm.4399. [DOI] [PMC free article] [PubMed] [Google Scholar]
- 15.Stuani L., Sabatier M., Saland E., Cognet G., Poupin N., Bosc C., Castelli F.A., Gales L., Turtoi E., Montersino C., et al. Mitochondrial metabolism supports resistance to IDH mutant inhibitors in acute myeloid leukemia. J. Exp. Med. 2021;218 doi: 10.1084/jem.20200924. [DOI] [PMC free article] [PubMed] [Google Scholar]
- 16.Birkenmeier K., Dröse S., Wittig I., Winkelmann R., Käfer V., Döring C., Hartmann S., Wenz T., Reichert A.S., Brandt U., Hansmann M.L. Hodgkin and Reed-Sternberg cells of classical Hodgkin lymphoma are highly dependent on oxidative phosphorylation. Int. J. Cancer. 2016;138:2231–2246. doi: 10.1002/ijc.29934. [DOI] [PubMed] [Google Scholar]
- 17.Gentric G., Kieffer Y., Mieulet V., Goundiam O., Bonneau C., Nemati F., Hurbain I., Raposo G., Popova T., Stern M.H., et al. PML-Regulated Mitochondrial Metabolism Enhances Chemosensitivity in Human Ovarian Cancers. Cell Metabol. 2019;29:156–173.e10. doi: 10.1016/j.cmet.2018.09.002. [DOI] [PMC free article] [PubMed] [Google Scholar]
- 18.Yap T.A., Daver N., Mahendra M., Zhang J., Kamiya-Matsuoka C., Meric-Bernstam F., Kantarjian H.M., Ravandi F., Collins M.E., Francesco M.E.D., et al. Complex I inhibitor of oxidative phosphorylation in advanced solid tumors and acute myeloid leukemia: phase I trials. Nat. Med. 2023;29:115–126. doi: 10.1038/s41591-022-02103-8. [DOI] [PubMed] [Google Scholar]
- 19.Don A.S., Kisker O., Dilda P., Donoghue N., Zhao X., Decollogne S., Creighton B., Flynn E., Folkman J., Hogg P.J. A peptide trivalent arsenical inhibits tumor angiogenesis by perturbing mitochondrial function in angiogenic endothelial cells. Cancer Cell. 2003;3:497–509. doi: 10.1016/s1535-6108(03)00109-0. [DOI] [PubMed] [Google Scholar]
- 20.Coutelle O., Hornig-Do H.T., Witt A., Andree M., Schiffmann L.M., Piekarek M., Brinkmann K., Seeger J.M., Liwschitz M., Miwa S., et al. Embelin inhibits endothelial mitochondrial respiration and impairs neoangiogenesis during tumor growth and wound healing. EMBO Mol. Med. 2014;6:624–639. doi: 10.1002/emmm.201303016. [DOI] [PMC free article] [PubMed] [Google Scholar]
- 21.Pernicova I., Korbonits M. Metformin-mode of action and clinical implications for diabetes and cancer. Nat. Rev. Endocrinol. 2014;10:143–156. doi: 10.1038/nrendo.2013.256. [DOI] [PubMed] [Google Scholar]
- 22.Robinson-Rechavi M., Escriva Garcia H., Laudet V. The nuclear receptor superfamily. J. Cell Sci. 2003;116:585–586. doi: 10.1242/jcs.00247. [DOI] [PubMed] [Google Scholar]
- 23.Solt L.A., Burris T.P. Action of RORs and their ligands in (patho)physiology. Trends Endocrinol. Metab. 2012;23:619–627. doi: 10.1016/j.tem.2012.05.012. [DOI] [PMC free article] [PubMed] [Google Scholar]
- 24.Zhao X., Cho H., Yu R.T., Atkins A.R., Downes M., Evans R.M. Nuclear receptors rock around the clock. EMBO Rep. 2014;15:518–528. doi: 10.1002/embr.201338271. [DOI] [PMC free article] [PubMed] [Google Scholar]
- 25.Kojetin D.J., Burris T.P. REV-ERB and ROR nuclear receptors as drug targets. Nat. Rev. Drug Discov. 2014;13:197–216. doi: 10.1038/nrd4100. [DOI] [PMC free article] [PubMed] [Google Scholar]
- 26.Lu J., Van der Steen T., Tindall D.J. Are androgen receptor variants a substitute for the full-length receptor? Nat. Rev. Urol. 2015;12:137–144. doi: 10.1038/nrurol.2015.13. [DOI] [PubMed] [Google Scholar]
- 27.Sun N., Guo H., Wang Y. Retinoic acid receptor-related orphan receptor gamma-t (ROR gamma t) inhibitors in clinical development for the treatment of autoimmune diseases: a patent review (2016-present) Expert Opin. Ther. Pat. 2019;29:663–674. doi: 10.1080/13543776.2019.1655541. [DOI] [PubMed] [Google Scholar]
- 28.Ivanov I.I., McKenzie B.S., Zhou L., Tadokoro C.E., Lepelley A., Lafaille J.J., Cua D.J., Littman D.R. The orphan nuclear receptor ROR gamma t directs the differentiation program of proinflammatory IL-17(+) T helper cells. Cell. 2006;126:1121–1133. doi: 10.1016/j.cell.2006.07.035. [DOI] [PubMed] [Google Scholar]
- 29.Ciofani M., Madar A., Galan C., Sellars M., Mace K., Pauli F., Agarwal A., Huang W., Parkhurst C.N., Muratet M., et al. A validated regulatory network for Th17 cell specification. Cell. 2012;151:289–303. doi: 10.1016/j.cell.2012.09.016. [DOI] [PMC free article] [PubMed] [Google Scholar]
- 30.Xiao S., Yosef N., Yang J., Wang Y., Zhou L., Zhu C., Wu C., Baloglu E., Schmidt D., Ramesh R., et al. Small-molecule RORgammat antagonists inhibit T helper 17 cell transcriptional network by divergent mechanisms. Immunity. 2014;40:477–489. doi: 10.1016/j.immuni.2014.04.004. [DOI] [PMC free article] [PubMed] [Google Scholar]
- 31.René O., Fauber B.P., Boenig G.d.L., Burton B., Eidenschenk C., Everett C., Gobbi A., Hymowitz S.G., Johnson A.R., Kiefer J.R., et al. Minor Structural Change to Tertiary Sulfonamide RORc Ligands Led to Opposite Mechanisms of Action. ACS Med. Chem. Lett. 2015;6:276–281. doi: 10.1021/ml500420y. [DOI] [PMC free article] [PubMed] [Google Scholar]
- 32.Wang J., Zou J.X., Xue X., Cai D., Zhang Y., Duan Z., Xiang Q., Yang J.C., Louie M.C., Borowsky A.D., et al. ROR-gamma drives androgen receptor expression and represents a therapeutic target in castration-resistant prostate cancer (vol 22, pg 488, 2016) Nat. Med. 2016;22:692. doi: 10.1038/nm.4070. [DOI] [PMC free article] [PubMed] [Google Scholar]
- 33.Lytle N.K., Ferguson L.P., Rajbhandari N., Gilroy K., Fox R.G., Deshpande A., Schürch C.M., Hamilton M., Robertson N., Lin W., et al. A Multiscale Map of the Stem Cell State in Pancreatic Adenocarcinoma. Cell. 2019;177:572–586.e22. doi: 10.1016/j.cell.2019.03.010. [DOI] [PMC free article] [PubMed] [Google Scholar]
- 34.Cai D., Wang J., Gao B., Li J., Wu F., Zou J.X., Xu J., Jiang Y., Zou H., Huang Z., et al. ROR gamma is a targetable master regulator of cholesterol biosynthesis in a cancer subtype. Nat. Commun. 2019;10 doi: 10.1038/s41467-019-12529-3. [DOI] [PMC free article] [PubMed] [Google Scholar]
- 35.Farge T., Saland E., de Toni F., Aroua N., Hosseini M., Perry R., Bosc C., Sugita M., Stuani L., Fraisse M., et al. Chemotherapy-Resistant Human Acute Myeloid Leukemia Cells Are Not Enriched for Leukemic Stem Cells but Require Oxidative Metabolism. Cancer Discov. 2017;7:716–735. doi: 10.1158/2159-8290.CD-16-0441. [DOI] [PMC free article] [PubMed] [Google Scholar]
- 36.Anderson N.M., Qin X., Finan J.M., Lam A., Athoe J., Missiaen R., Skuli N., Kennedy A., Saini A.S., Tao T., et al. Metabolic Enzyme DLST Promotes Tumor Aggression and Reveals a Vulnerability to OXPHOS Inhibition in High-Risk Neuroblastoma. Cancer Res. 2021;81:4417–4430. doi: 10.1158/0008-5472.CAN-20-2153. [DOI] [PMC free article] [PubMed] [Google Scholar]
- 37.Evans K.W., Yuca E., Scott S.S., Zhao M., Paez Arango N., Cruz Pico C.X., Saridogan T., Shariati M., Class C.A., Bristow C.A., et al. Oxidative Phosphorylation Is a Metabolic Vulnerability in Chemotherapy-Resistant Triple-Negative Breast Cancer. Cancer Res. 2021;81:5572–5581. doi: 10.1158/0008-5472.CAN-20-3242. [DOI] [PMC free article] [PubMed] [Google Scholar]
- 38.Masoud R., Reyes-Castellanos G., Lac S., Garcia J., Dou S., Shintu L., Abdel Hadi N., Gicquel T., El Kaoutari A., Diémé B., et al. Targeting Mitochondrial Complex I Overcomes Chemoresistance in High OXPHOS Pancreatic Cancer. Cell Rep. Med. 2020;1 doi: 10.1016/j.xcrm.2020.100143. [DOI] [PMC free article] [PubMed] [Google Scholar]
- 39.Hao X., Bu W., Lv G., Xu L., Hou D., Wang J., Liu X., Yang T., Zhang X., Liu Q., et al. Disrupted mitochondrial homeostasis coupled with mitotic arrest generates antineoplastic oxidative stress. Oncogene. 2022;41:427–443. doi: 10.1038/s41388-021-02105-9. [DOI] [PMC free article] [PubMed] [Google Scholar]
- 40.Zhang Y., Ding C., Zhu W., Li X., Chen T., Liu Q., Zhou S., Zhang T.C., Ma W. Chemotherapeutic drugs induce oxidative stress associated with DNA repair and metabolism modulation. Life Sci. 2022;289 doi: 10.1016/j.lfs.2021.120242. [DOI] [PubMed] [Google Scholar]
- 41.Robey R.W., Pluchino K.M., Hall M.D., Fojo A.T., Bates S.E., Gottesman M.M. Revisiting the role of ABC transporters in multidrug-resistant cancer. Nat. Rev. Cancer. 2018;18:452–464. doi: 10.1038/s41568-018-0005-8. [DOI] [PMC free article] [PubMed] [Google Scholar]
- 42.Lombard A.P., Liu C., Armstrong C.M., Cucchiara V., Gu X., Lou W., Evans C.P., Gao A.C. ABCB1 Mediates Cabazitaxel-Docetaxel Cross-Resistance in Advanced Prostate Cancer. Mol. Cancer Therapeut. 2017;16:2257–2266. doi: 10.1158/1535-7163.MCT-17-0179. [DOI] [PMC free article] [PubMed] [Google Scholar]
- 43.Kroon J., Kooijman S., Cho N.J., Storm G., van der Pluijm G. Improving Taxane-Based Chemotherapy in Castration-Resistant Prostate Cancer. Trends Pharmacol. Sci. 2016;37:451–462. doi: 10.1016/j.tips.2016.03.003. [DOI] [PubMed] [Google Scholar]
- 44.Fauber B.P., René O., Deng Y., DeVoss J., Eidenschenk C., Everett C., Ganguli A., Gobbi A., Hawkins J., Johnson A.R., et al. Discovery of 1-{4-[3-Fluoro-4-((3S,6R)-3-methyl-1,1-dioxo-6-phenyl-[1,2]thiazinan-2-ylmethyl)-phenyl]-piperazin-1-yl}-ethanone (GNE-3500): a Potent, Selective, and Orally Bioavailable Retinoic Acid Receptor-Related Orphan Receptor C (RORc or ROR gamma) Inverse Agonist. J. Med. Chem. 2015;58:5308–5322. doi: 10.1021/acs.jmedchem.5b00597. [DOI] [PubMed] [Google Scholar]
- 45.Coffelt S.B., Kersten K., Doornebal C.W., Weiden J., Vrijland K., Hau C.S., Verstegen N.J.M., Ciampricotti M., Hawinkels L.J.A.C., Jonkers J., de Visser K.E. IL-17-producing γδ T cells and neutrophils conspire to promote breast cancer metastasis. Nature. 2015;522:345–348. doi: 10.1038/nature14282. [DOI] [PMC free article] [PubMed] [Google Scholar]
- 46.Benevides L., da Fonseca D.M., Donate P.B., Tiezzi D.G., De Carvalho D.D., de Andrade J.M., Martins G.A., Silva J.S. IL17 Promotes Mammary Tumor Progression by Changing the Behavior of Tumor Cells and Eliciting Tumorigenic Neutrophils Recruitment. Cancer Res. 2015;75:3788–3799. doi: 10.1158/0008-5472.CAN-15-0054. [DOI] [PMC free article] [PubMed] [Google Scholar]
- 47.Wang X., Chen H., Jiang R., Hong X., Peng J., Chen W., Jiang J., Li J., Huang D., Dai H., et al. Interleukin-17 activates and synergizes with the notch signaling pathway in the progression of pancreatic ductal adenocarcinoma. Cancer Lett. 2021;508:1–12. doi: 10.1016/j.canlet.2021.03.003. [DOI] [PubMed] [Google Scholar]
- 48.Ma H.Y., Yamamoto G., Xu J., Liu X., Karin D., Kim J.Y., Alexandrov L.B., Koyama Y., Nishio T., Benner C., et al. IL-17 signaling in steatotic hepatocytes and macrophages promotes hepatocellular carcinoma in alcohol-related liver disease. J. Hepatol. 2020;72:946–959. doi: 10.1016/j.jhep.2019.12.016. [DOI] [PMC free article] [PubMed] [Google Scholar]
- 49.Wang M., Wang L., Ren T., Xu L., Wen Z. IL-17A/IL-17RA interaction promoted metastasis of osteosarcoma cells. Cancer Biol. Ther. 2013;14:155–163. doi: 10.4161/cbt.22955. [DOI] [PMC free article] [PubMed] [Google Scholar]
- 50.Lu B., Zou C., Yang M., He Y., He J., Zhang C., Chen S., Yu J., Liu K.Y., Cao Q., Zhao W. Pharmacological Inhibition of Core Regulatory Circuitry Liquid-liquid Phase Separation Suppresses Metastasis and Chemoresistance in Osteosarcoma. Adv. Sci. 2021;8 doi: 10.1002/advs.202101895. [DOI] [PMC free article] [PubMed] [Google Scholar]
Associated Data
This section collects any data citations, data availability statements, or supplementary materials included in this article.
Supplementary Materials
Data Availability Statement
-
•
This paper does not report the original code.
-
•
The RNA-seq data have been deposited in Gene Expression Omnibus with GEO accession GSE261067.
-
•
Raw data of Western blot imagines from Figures in this paper were deposited in Mendeley at https://doi.org/10.17632/yzygjpm6k5.1
-
•
Any additional information required to reanalyze the data presented in this paper is available upon request by the lead contact.