Abstract
We investigated county-level variation in mRNA COVID-19 vaccine use among Medicare beneficiaries throughout the United States. There was greater use of Pfizer-BioNTech vaccines than Moderna vaccines in urban areas for first and booster doses.
Vaccines have been highly effective at reducing SARs-CoV-2 infection, COVID-19 severity, and viral transmission.1–3 The messenger RNA (mRNA) vaccines produced by Pfizer-BioNTech (BNT162b2) and Moderna Inc. (mRNA-1273) are the most used,2,3 aligning with public health recommendations and evidence of their superior safety and efficacy.3,4 As of August 2023, 81 percent of the US population had received at least one COVID-19 vaccine, with greater coverage (95 percent) among those ages sixty-five and older.1
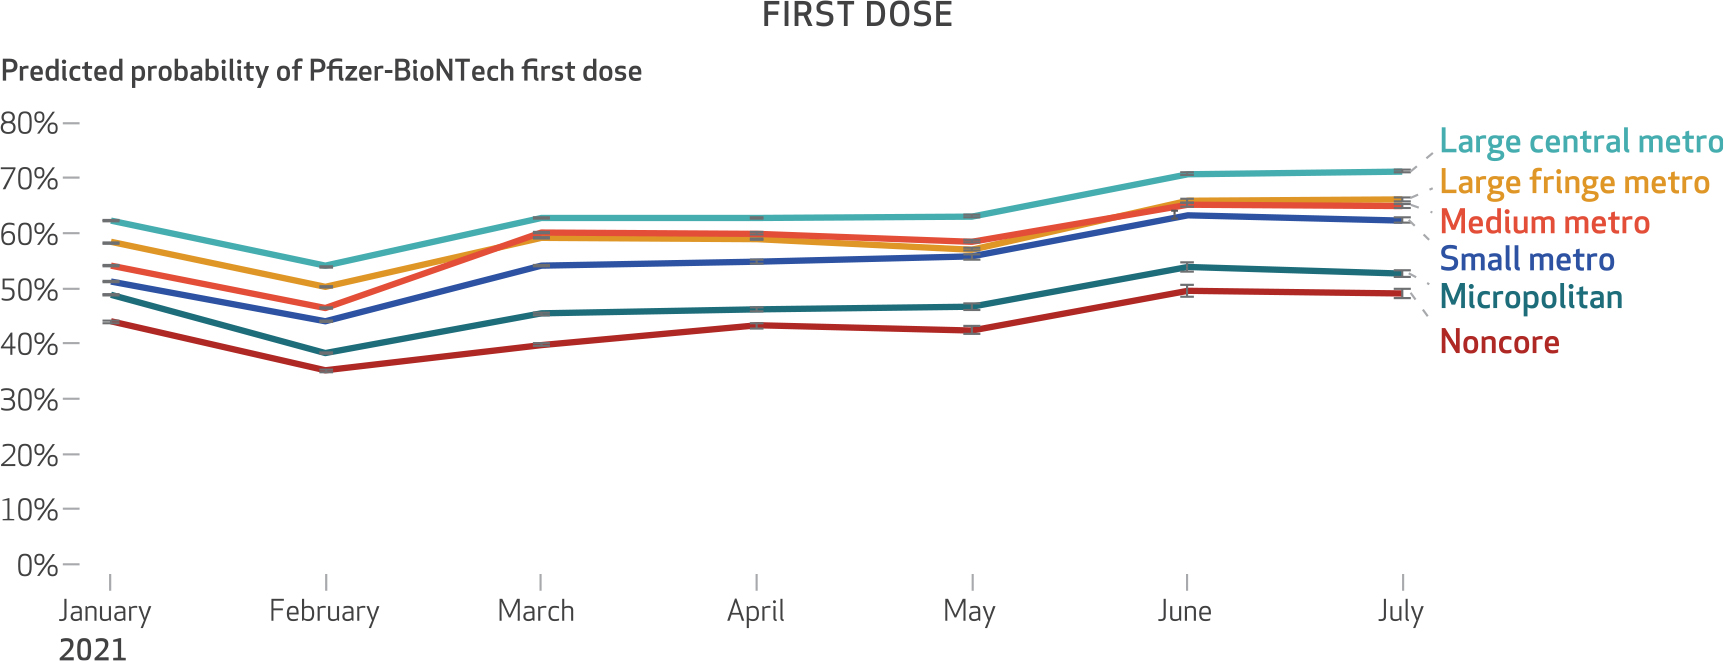
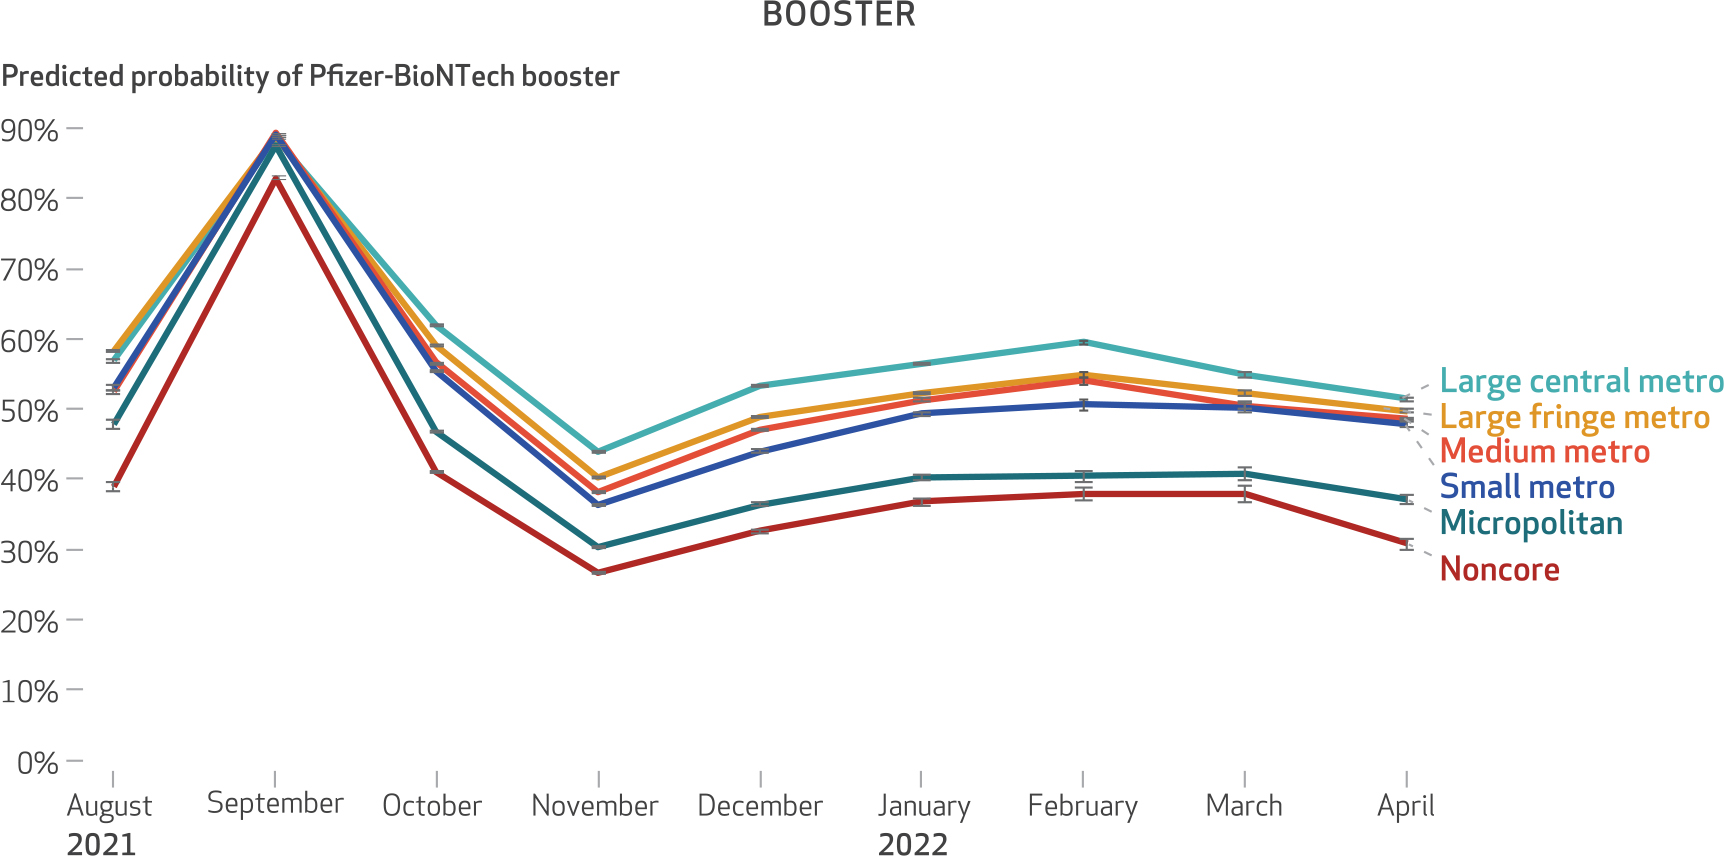
Region-, state-, and county-level variation in COVID-19 vaccine uptake is well documented.1,5 However, to our knowledge, no studies have examined geographic variation in the use of specific mRNA vaccine products. To explore geographic variation within and across US states in the use of Pfizer-BioNTech and Moderna mRNA vaccines, we used a novel data set of CVS Health and Walgreens customers linked to Medicare claims. We found substantial county-level variation in mRNA vaccine products (exhibits 1 and 2), with urban counties showing greater use of Pfizer-BioNTech and rural counties less use of Pfizer-BioNTech for both first doses and booster doses.
Exhibit 1. Predicted probability of Pfizer-BioNTech for first doses of mRNA vaccine among Medicare beneficiaries, January 1–July 31, 2021.

SOURCE Authors’ analysis of customer data from CVS Health and Walgreens linked to the 100 percent Medicare Enrollment File. NOTES Statistical interaction product terms between month of vaccination and level of urbanicity were specified in the regression model to visualize changes in the predicted probability of receiving the Pfizer-BioNTech vaccine over time within levels of urbanicity. The figure shows 95% confidence intervals, but the large sample size limits the value of conventional hypothesis testing. The rural-urban classification categories are classifications of the National Center for Health Statistics. Large central metro is the most urban, followed by large fringe metro, medium metro, small metro, micropolitan, and noncore, with noncore counties being the most rural.
Exhibit 2. Predicted probability of Pfizer-BioNTech for booster doses of mRNA vaccine among Medicare beneficiaries, August 1, 2021–April 30, 2022.

SOURCE Authors’ analysis of customer data from CVS Health and Walgreens linked to the 100 percent Medicare Enrollment File. NOTES Statistical interaction product terms between month of vaccination and level of urbanicity were specified in the regression model to visualize changes in the predicted probability of receiving the Pfizer-BioNTech vaccine over time within levels of urbanicity. The figure shows 95% confidence intervals, but the large sample size limits the value of conventional hypothesis testing. The rural-urban classification categories are classifications of the National Center for Health Statistics. Large central metro is the most urban, followed by large fringe metro, medium metro, small metro, micropolitan, and noncore, with noncore counties being the most rural. The increase in the predicted probability of Pfizer-BioNTech booster doses in September 2021 likely corresponds to when the Food and Drug Administration authorized the booster dose of Pfizer-BioNTech vaccine.
Although both vaccines are more than 90 percent effective, they differ in their effectiveness and risk for adverse events.6 For example, US veterans who received the Pfizer-BioNTech vaccine had a higher risk for documented SARS-CoV-2 infection, symptomatic COVID-19, and COVID-19 hospitalization relative to those receiving Moderna vaccines.6 Furthermore, among Medicare beneficiaries, Moderna was associated with lower risk for pulmonary embolism and other adverse events, possibly due to its greater effectiveness against SARS-CoV-2 compared with Pfizer-BioNTech.7
Although the Centers for Disease Control and Prevention (CDC) reported weekly allocations of Pfizer-BioNTech and Moderna vaccines at the state level, they did not disaggregate allocated vaccines at the county level or report doses administered by vaccine product. Some rural hospitals expressed preferences for Moderna vaccines8,9 because of differences in shipment batch sizes and cold storage requirements. Given differences in mRNA vaccines’ effectiveness,4,6 geographic variation in the use of vaccine products may have important public health implications (for example, community-level differences in breakthrough infections).
Study Data And Methods
CVS Health and Walgreens customers with a prescription or vaccine administration paid by Medicare were linked to the 100 percent Medicare Enrollment File.10 CVS Health and Walgreens pharmacy records also captured vaccines administered at these pharmacies and not billed through Medicare.
The study population included Medicare beneficiaries with a billing record for the first dose of an mRNA vaccine between January 1 and July 31, 2021, and beneficiaries with a billing record for a booster dose between August 1, 2021, and April 30,2022,whowerealive,wereenrolledinMedicare, and had a valid address as of their vaccine dose. People may have received different vaccine products for their first dose and their booster dose (see online appendix exhibit A-1).11 Among those who received an mRNA vaccine in each US county, we calculated the percentage who received the Pfizer-BioNTech or Moderna vaccine for each dose.
We used logistic regression models to estimate the association between urbanicity and the likelihood of receiving the Pfizer-BioNTech vaccine for the first and booster doses. The main dependent variable was a binary variable indicating whether a person received the Pfizer-BioNTech or Moderna vaccine. The main independent variable indicated the level of urbanicity of their county. Because of temporal differences in the approval and delivery of mRNA vaccines, we also assessed whether the rural-urban variation in the likelihood of receiving the Pfizer-BioNTech vaccine differed over time. A GitHub repository contains code and county-level public use data sets (see the appendix discussion of data).11
Limitations included our inability to capture all COVID-19 vaccinations among Medicare beneficiaries. Missing from the data were vaccines administered for free or not recorded in administrative data sources (for example, those administered at mass vaccination clinics). Appendix exhibits A-4 and A-5 present results exploring the potential impact of missing vaccine data on our results.11 In addition, our findings were limited to older Medicare beneficiaries; the mRNA vaccine distribution in other populations may have differed.
Study Results
We identified14,448,485 Medicare beneficiaries who received an mRNA vaccine for their first dose between January 1 and July 31, 2021. Exhibit 3 shows that overall, 54.54 percent of beneficiaries (n = 7,880,845) received Pfizer-BioNTech and 45.46 percent (n = 6,567,640) received Moderna for their first dose. The proportions of beneficiaries receiving Pfizer-BioNTech and Moderna booster doses between August 1, 2021, and April 30, 2022, were similar; we identified 10,501,525 Pfizer-BioNTech booster doses (54.84 percent) and 8,649,607 Moderna booster doses (45.16 percent).We observed similar proportions of beneficiaries who received a first dose and a booster dose of either mRNA vaccine when we stratified by age, sex, and race and ethnicity.
EXHIBIT 3.
Sociodemographic characteristics of Medicare beneficiaries who received an mRNA vaccine first dose (January 1-July 31, 2021) or booster dose (August 1, 2021-April 30, 2022)
| First dose (N = 14,448,485) |
Booster dose (N = 19,151,132) |
|||
|---|---|---|---|---|
| Characteristics | Numbera | Percent | Numbera | Percent |
| Vaccine type | ||||
| Pfizer-BioNTech | 7,880,845 | 54.54 | 10,501,525 | 54.84 |
| Moderna | 6,567,640 | 45.46 | 8,649,607 | 45.16 |
| Age, mean years (SD) | 74.43 (9.07) | —b | 74.56 (7.98) | —b |
| Age, years | ||||
| Younger than 66 | 1,531,155 | 10.60 | 1,483,778 | 7.75 |
| 66–69 | 3,198,336 | 22.14 | 4,450,974 | 23.24 |
| 70–74 | 3,644,772 | 25.23 | 5,236,980 | 27.35 |
| 75–79 | 2,524,401 | 17.47 | 3,633,251 | 18.97 |
| 80–84 | 1,694,982 | 11.73 | 2,268,789 | 11.85 |
| 85–89 | 1,073,564 | 7.43 | 1,278,120 | 6.67 |
| 90 or older | 781,275 | 5.41 | 799,240 | 4.17 |
| Female | 8,538,720 | 59.10 | 10,916,913 | 57.00 |
| Race and ethnicity | ||||
| White | 11,197,335 | 77.50 | 14,884,996 | 77.72 |
| Black | 1,286,454 | 8.90 | 1,552,814 | 8.11 |
| Other | 142,618 | 0.99 | 219,445 | 1.15 |
| Asian | 580,517 | 3.99 | 804,158 | 4.26 |
| Hispanic | 883,963 | 6.12 | 1,130,728 | 5.90 |
| Native American | 27,804 | 0.19 | 26,278 | 0.14 |
| Unknown or missing | 326,152 | 2.26 | 509,249 | 2.66 |
| US geographic region | ||||
| Northeast | 3,075,797 | 21.29 | 4,167,652 | 21.76 |
| Midwest | 3,620,658 | 25.06 | 4,178,690 | 21.82 |
| South | 4,938,507 | 34.18 | 7,105,985 | 37.10 |
| West | 2,813,523 | 19.47 | 3,698,805 | 19.31 |
| Rural-urban classificationc | ||||
| Large central metro | 3,985,808 | 27.59 | 5,438,184 | 28.40 |
| Large fringe metro | 4,113,249 | 28.47 | 5,718,217 | 29.86 |
| Medium metro | 3,318,682 | 22.97 | 4,340,309 | 22.66 |
| Small metro | 1,335,084 | 9.24 | 1,669,248 | 8.72 |
| Micropolitan | 1,067,479 | 7.39 | 1,288,937 | 6.73 |
| Noncore | 628,183 | 4.35 | 696,237 | 3.64 |
| Medicare enrollment | ||||
| Part A only | 311,814 | 2.16 | 832,046 | 4.34 |
| Fee-for-service | 7,686,016 | 53.20 | 10,154,465 | 53.02 |
| Medicare Advantage | 6,379,591 | 44.15 | 8,094,032 | 42.26 |
| Other | 71,064 | 0.49 | 70,589 | 0.37 |
| Full duald | 1,705,030 | 11.80 | 1,446,884 | 7.56 |
SOURCE Authors’ analysis of customer data from CVS Health and Walgreens linked to the 100 percent Medicare Enrollment File.
All data reported are number and percent except for “Age, mean years (SD).”
Not applicable.
Classifications of the National Center for Health Statistics.
Enrolled in both Medicare and Medicaid.
There were regional and temporal differences in the percentage of Medicare beneficiaries who received a Pfizer-BioNTech vaccine. The percentages of beneficiaries receiving Pfizer-BioNTech for their first dose were 53.56 percent, 49.46 percent, 45.45 percent, and 51.73 percent for beneficiaries in the Northeast, Midwest, South, and West, respectively (exhibit 4 and appendix exhibit A-1).11 For the booster dose, the percentages of beneficiaries receiving Pfizer-BioNTech decreased to 52.45 percent, 44.19 percent, 39.16 percent, and 39.99 percent for the Northeast, Midwest, South, and West, respectively (exhibit 4).
EXHIBIT 4.
County-level geographic distribution of mRNA vaccine first doses (January 1-July 31, 2021) and booster doses (August 1, 2021-April 30, 2022) among Medicare beneficiaries, overall and by US region
| Overall | Northeast | Midwest | South | West | |
|---|---|---|---|---|---|
| First dose | |||||
| No. of counties | 3,139 | 217 | 1,055 | 1,420 | 447 |
| No. of beneficiaries vaccinated across counties | |||||
| Total | 14,448,485 | 3,075,797 | 3,620,658 | 4,938,507 | 2,813,523 |
| Median | 800 | 5,161 | 576 | 876 | 346 |
| % Pfizer, median | 48.38 | 53.56 | 49.46 | 45.45 | 51.73 |
| Booster dose | |||||
| No. of counties | 3,140 | 217 | 1,055 | 1,422 | 446 |
| No. of beneficiaries vaccinated across counties | |||||
| Total | 19,151,132 | 4,167,652 | 4,178,690 | 7,105,985 | 3,698,805 |
| Median | 978 | 6,505 | 636 | 1,044 | 405 |
| % Pfizer, median | 42.61 | 52.45 | 44.19 | 39.16 | 39.99 |
SOURCE Authors’ analysis of customer data from CVS Health and Walgreens linked to the 100 percent Medicare Enrollment File.
NOTES The number vaccinated across counties represents the total number of Medicare beneficiaries in our study sample who received a first dose or booster dose of COVID-19 mRNA vaccine. The full table that includes interquartile ranges is in appendix exhibit A-1 (see note 11 in text).
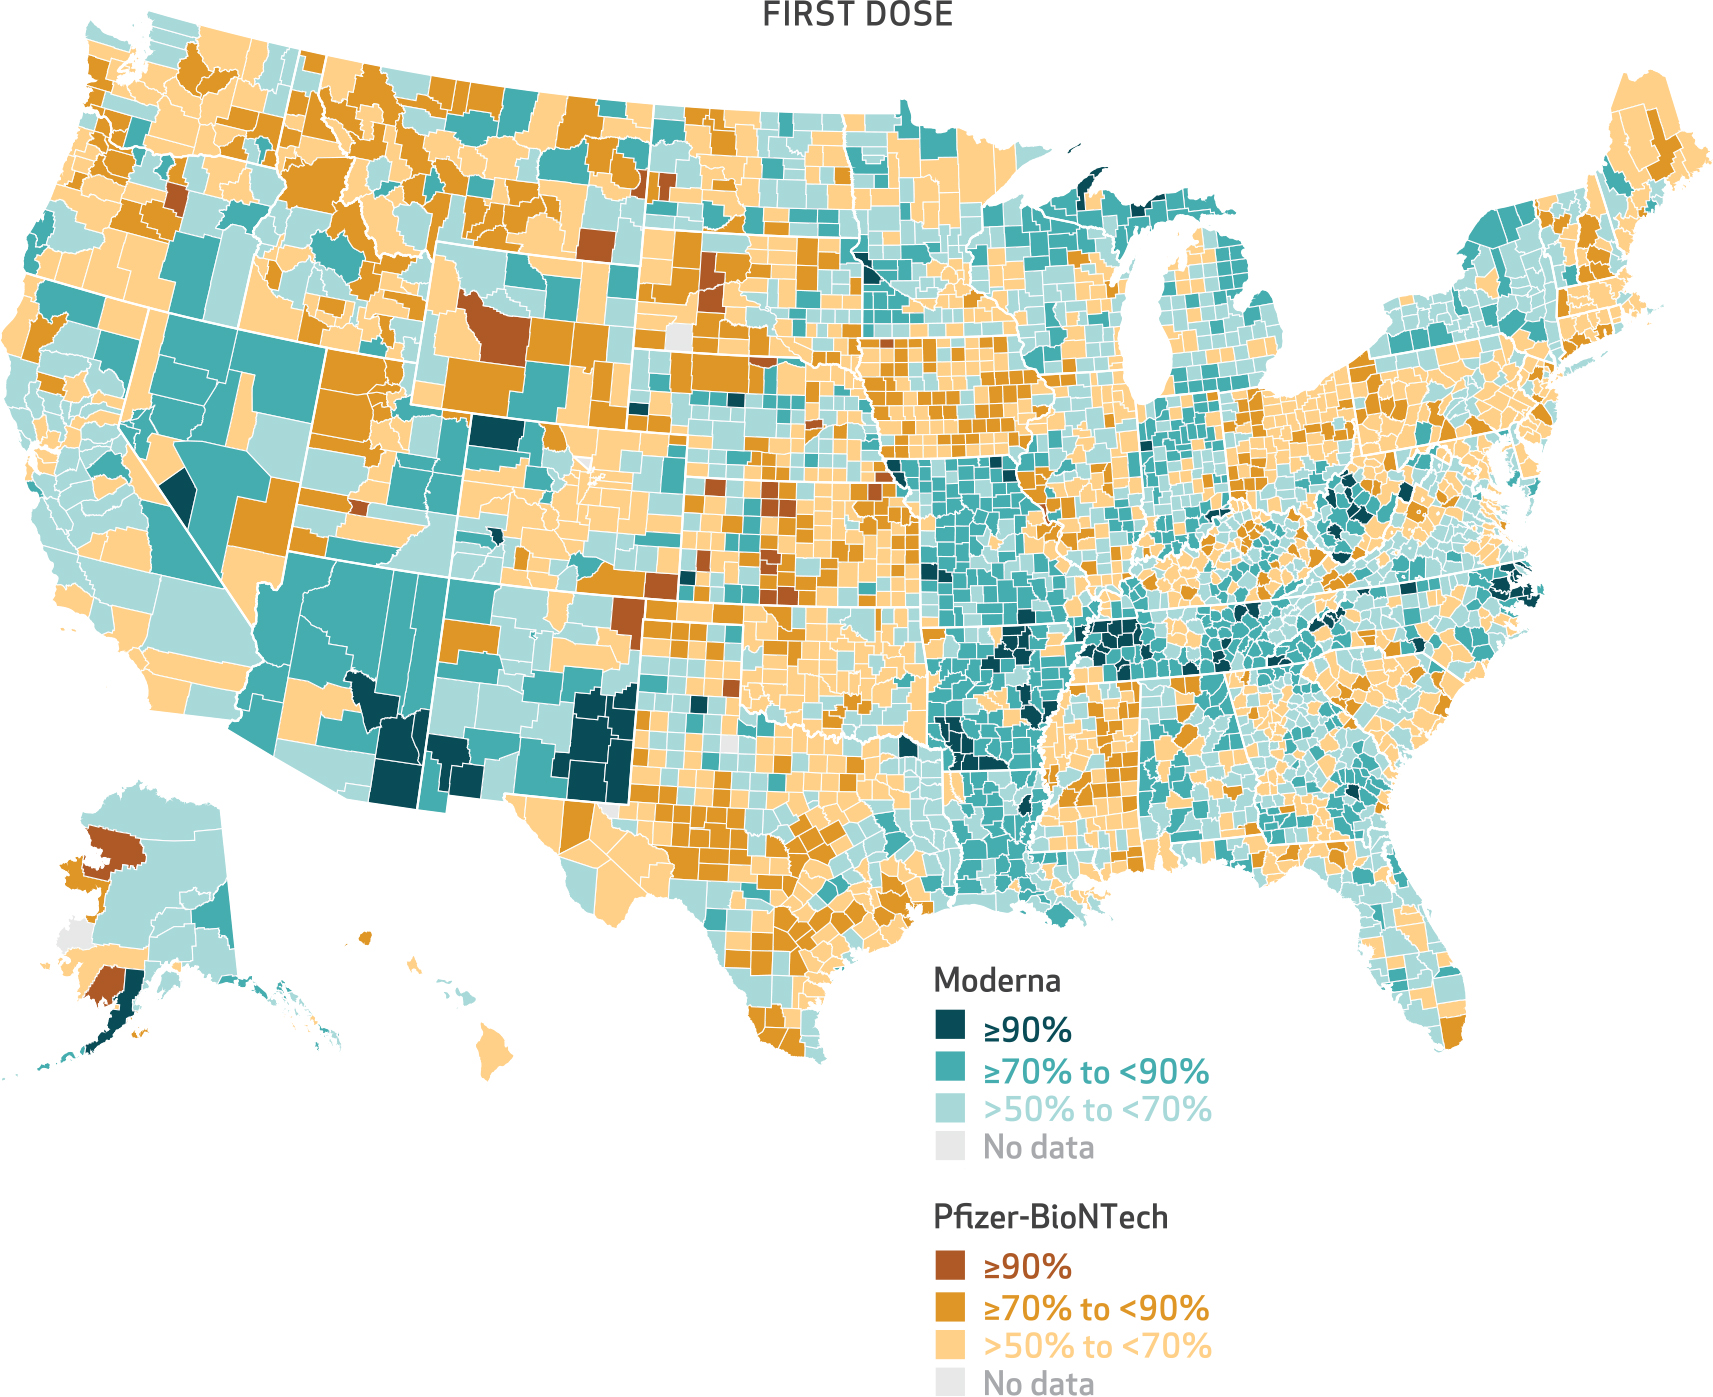
We observed urban-rural variation in the distribution of Pfizer-BioNTech and Moderna vaccines. More than 50 percent of beneficiaries received a Pfizer-BioNTech vaccine for their first dose in 1,481 counties (exhibit 5). Urban areas showed greater use of the Pfizer-BioNTech vaccine, whereas more rural counties showed greater use of the Moderna vaccine (exhibit 5). Medicare beneficiaries living in large central metro counties had the greatest predicted probability of receiving Pfizer-BioNTech as their first dose (64 percent), whereas those in noncore (rural) counties had the lowest predicted probability of receiving Pfizer-BioNTech as their first dose (43 percent) (exhibit 1 and appendix exhibit A-2).11 Furthermore, we observed a monotonic decrease in the likelihood of Medicare beneficiaries receiving a Pfizer-BioNTech vaccine as counties became more rural (all comparisons were relative to large central metro counties): large fringe metro, odds ratio: 0.843; medium metro, OR: 0.767; small metro, OR: 0.669; micropolitan, OR: 0.540; and noncore, OR: 0.455 (appendix exhibit A-3).11
Exhibit 5. County-level percent of Medicare beneficiaries receiving Moderna and Pfizer-BioNTech first doses of mRNA vaccine, January 1, 2021–July 31, 2021.

SOURCE Authors’ analysis of customer data from CVS Health and Walgreens linked to the 100 percent Medicare Enrollment File. NOTE The denominator consists of the number of Medicare beneficiaries who received an mRNA vaccine for their first dose.
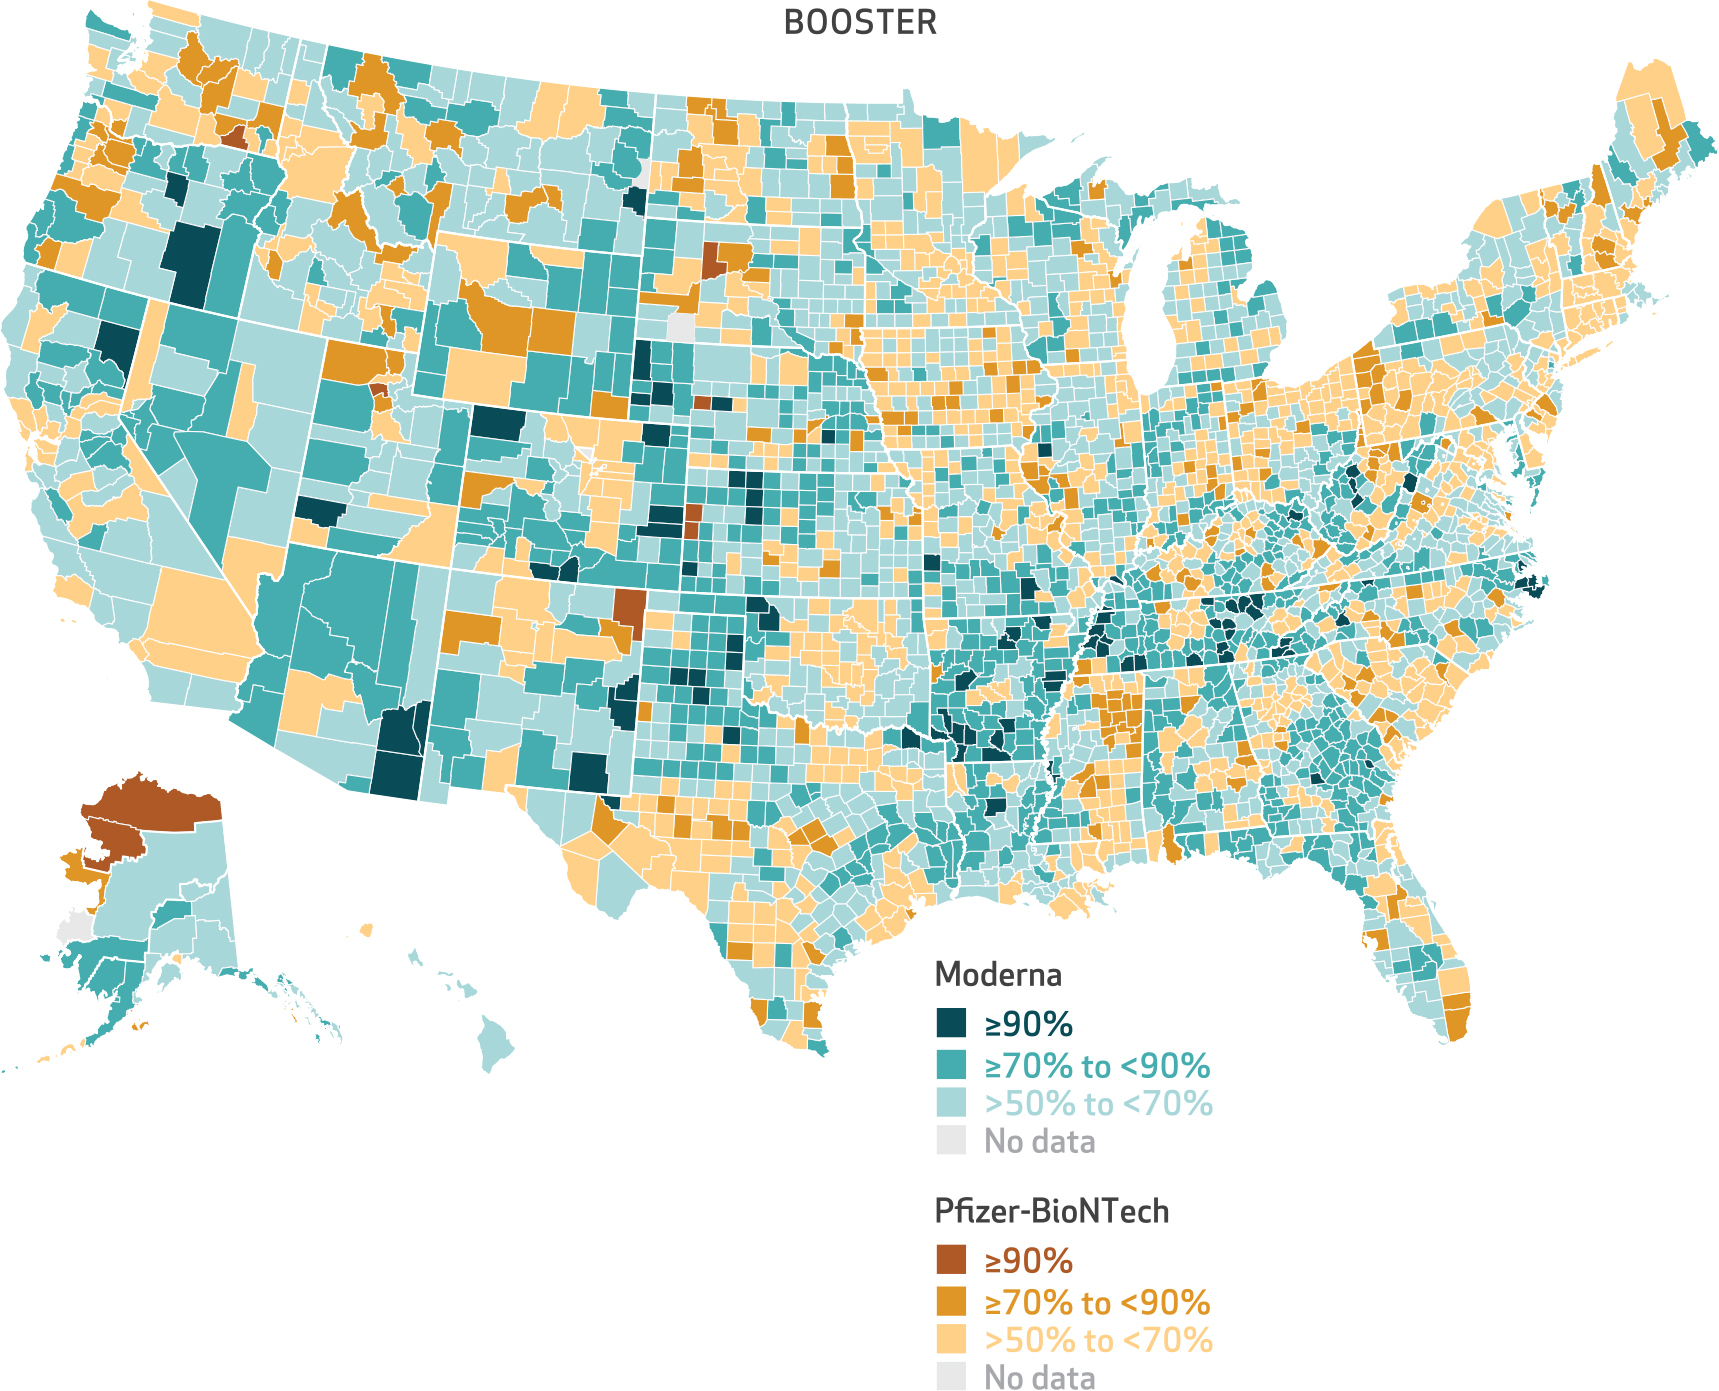
Although county-level variation in vaccine product and the association between urbanicity and the predicted probability of receiving a Pfizer-BioNTech vaccine persisted for the booster dose, its extent was reduced relative to the first dose (exhibits 2 and 6). The difference in the predicted probability of receiving a Pfizer-BioNTech vaccine between large central metro and small metro counties was 8.9 percentage points for the first dose (as of July 2021) compared with 3.5 percentage points for the booster dose (as of April 2022) (exhibits 1 and 2).
Exhibit 6. County-level percent of Medicare beneficiaries receiving Moderna and Pfizer-BioNTech booster doses of mRNA vaccine, August 1, 2021–April 30, 2022.

SOURCE Authors’ analysis of customer data from CVS Health and Walgreens linked to the 100 percent Medicare Enrollment File. NOTE The denominator consists of the number of Medicare beneficiaries who received an mRNA vaccine for their booster dose.
Last, we assessed the extent of missing vaccines in our data and the impact of missing vaccines on our inferences. Our data’s measure of mRNA vaccine administrations captured a median 36 percent (interquartile range: 27–46) of first-dose vaccinations reported by the CDC (appendix exhibit A-4).11 Regardless of whether counties had low, medium, or high missing vaccine data, people living in more urban counties were more likely to receive a Pfizer-BioNTech vaccine, and those living in more rural counties were more likely to receive a Moderna vaccine (appendix exhibit A-5).11
Discussion
Using a novel cohort of CVS Health and Walgreens customers linked to Medicare claims, we observed large geographic variation within and across US states in the use of Pfizer-BioNTech and Moderna mRNA vaccines. Beneficiaries in large central metro counties were most likely to receive Pfizer-BioNTech for their first and booster doses, and the probability of receiving Pfizer-BioNTech was lower in rural counties. These patterns persisted over time, and they likely do not reflect differences in when people were vaccinated, but rather geographic differences in where vaccines were allocated.
The association between urbanicity and whether a beneficiary received a Pfizer-BioNTech vaccine suggests that local infrastructure affected the distribution and administration of vaccines across counties. Operation Warp Speed, the federal effort to accelerate the development, manufacturing, and distribution of COVID-19 vaccines, recognized that Moderna’s vaccine would be easier to distribute to rural areas;8 Moderna vaccines did not require an ultra-cold-chain transportation network and were presumed to be more accessible for smaller facilities and local communities.
Although our findings were consistent when stratified across counties with different levels of missing data relative to CDC sources (see appendix exhibit A-5),11 we were unable confirm whether these patterns generalized to vaccines neither billed through Medicare nor administered at a CVS Health or Walgreens pharmacy. We also do not know whether vaccines missing in our data were random across rural or urban counties and vaccine products. In addition, the observed trends might reflect specific supply-chain management choices from the two major pharmacy providers. Nonetheless, given the size and geographical breadth of our data, consistency of results when stratified by counties with varying missing data, and sources citing a preference for the Moderna vaccine in rural areas,8,9 we believe that our results are robust to these limitations.
Our findings highlight that how vaccine products are manufactured and delivered has implications for product availability and which vaccines are administered; Pfizer-BioNTech was predominantly administered to Medicare beneficiaries in urban counties. Such differences in distribution could have public health implications. For example, differences in adverse events6,7,12 and effectiveness13 of the mRNA vaccines could affect population-level susceptibility to the virus. Differences in effectiveness also have individual health implications; for example, those who received Pfizer-BioNTech were more likely to experience a breakthrough infection.6
The observed geographic and temporal patterns in mRNA vaccine use have important individual and population health implications for future research, particularly when there are differences across products in vaccine effectiveness. Our study suggests that postapproval comparisons of vaccine safety and effectiveness should consider spatial differences in distribution and administration. Future studies might examine regional variation in the take-up of other vaccine products with varying effectiveness (for example, Prevnar 20 and Pneumovax 23). Furthermore, public health officials and pharmacies might consider differences in the effectiveness of vaccines when planning distribution ofandaccesstovaccines.TheCOVID-19pandemic has highlighted the importance of vaccine development, distribution, administration, and data gathering, all of which are factors that can affect which populations receive different vaccines and, in turn, potential differences in individual and population infection risk. ■
Supplementary Material
Acknowledgments
This work was supported by the National Institute on Aging (NIA), National Institutes of Health (Award No. U54AG063546), which funds the NIA Imbedded Pragmatic Alzheimer’s Disease and AD-Related Dementias Clinical Trials Collaboratory (NIA IMPACT Collaboratory). Supplemental funding was provided under Grant Nos. U54AG063546-S07 and U54AG063546-S08. The content is solely the responsibility of the authors and does not necessarily represent the official views of the National Institutes of Health. To access the authors’ disclosures, click on the Details tab of the article online.
Contributor Information
Katherine Wen, Vanderbilt University, Nashville, Tennessee..
Daniel A. Harris, Brown University, Providence, Rhode Island.
Preeti Chachlani, Brown University..
Kaleen N. Hayes, Brown University.
Ellen McCarthy, Harvard University, Boston, Massachusetts..
Andrew R. Zullo, Brown University.
Renae L. Smith-Ray, Walgreens, Deerfield, Illinois.
Tanya Singh, Walgreens..
Djeneba Audrey Djibo, CVS Health, Blue Bell, Pennsylvania..
Cheryl N. McMahill-Walraven, CVS Health.
Jeffrey Hiris, Brown University..
Rena M. Conti, Boston University, Boston, Massachusetts.
Jonathan Gruber, Massachusetts Institute of Technology, Cambridge, Massachusetts..
Vincent Mor, Brown University..
NOTES
- 1.Centers for Disease Control and Prevention. COVID data tracker [Internet]. Atlanta (GA): CDC; [last updated 2024 Feb 23; cited 2024 Mar 4]. Available from: https://covid.cdc.gov/covid-data-tracker [Google Scholar]
- 2.Holder J Tracking coronavirus vaccinations around the world. New York Times [serial on the Internet]. 2023. Mar 13 [cited 2024 Mar 4]. Available from: https://www.nytimes.com/interactive/2021/world/covid-vaccinations-tracker.html
- 3.Centers for Disease Control and Prevention [Internet]. Atlanta (GA): CDC. Press release, CDC endorses ACIP’s updated COVID-19 vaccine recommendations; 2021. Dec 16 [cited 2024 Mar 4]. Available from: https://archive.cdc.gov/#/details?url=https://www.cdc.gov/media/releases/2021/s1216-covid-19-vaccines.html [Google Scholar]
- 4.Rotshild V, Hirsh-Raccah B, Miskin I, Muszkat M, Matok I. Comparing the clinical efficacy of COVID-19 vaccines: a systematic review and network meta-analysis. Sci Rep. 2021;11(1):22777. [DOI] [PMC free article] [PubMed] [Google Scholar]
- 5.Hayes KN, Harris DA, Zullo AR, Chachlani P, Wen KJ, Smith-Ray RL, et al. Racial and ethnic disparities in COVID-19 booster vaccination among U.S. older adults differ by geographic region and Medicare enrollment. Front Public Health. 2023;11:1243958. [DOI] [PMC free article] [PubMed] [Google Scholar]
- 6.Dickerman BA, Gerlovin H, Madenci AL, Kurgansky KE, Ferolito BR, Figueroa Muñiz MJ, et al. Comparative effectiveness of BNT162b2 and mRNA-1273 vaccines in U.S. veterans. N Engl J Med. 2022;386(2):105–15. [DOI] [PMC free article] [PubMed] [Google Scholar]
- 7.Harris DA, Hayes KN, Zullo AR, Mor V, Chachlani P, Deng Y, et al. Comparative risks of potential adverse events following COVID-19 mRNA vaccination among older US adults. JAMA Netw Open. 2023;6(8):e2326852. [DOI] [PMC free article] [PubMed] [Google Scholar]
- 8.Maddipatla M Moderna vaccine storage requirements enables distribution in rural America—U.S. official. Reuters [serial on the Internet]. 2020. Nov 17 [cited 2024 Mar 4]. Available from: https://www.reuters.com/article/uk-health-coronavirus-vaccine-coldstorag-idUKKBN27W241
- 9.ESLee J Moderna’s low-maintenance vaccine has edge for rural hospitals. Bloomberg Law [serial on the Internet]. 2020. Dec 18 [cited 2024 Mar 4]. Available from: https://news.bloomberglaw.com/pharma-and-life-sciences/modernas-low-maintenance-vaccine-has-edge-for-rural-hospitals [Google Scholar]
- 10.Hayes KN, Harris DA, Zullo AR, Djibo DA, Smith-Ray RL, Taitel MS, et al. Data resource profile: COVid VAXines Effects on the Aged (COVVAXAGE). Int J Popul Data Sci. 2023;8(6):2170. [DOI] [PMC free article] [PubMed] [Google Scholar]
- 11.To access the appendix, click on the Details tab of the article online.
- 12.Naveed Z, Li J, Wilton J, Spencer M, Naus M, Velásquez García HA, et al. Comparative risk of myocarditis/pericarditis following second doses of BNT162b2 and mRNA-1273 coronavirus vaccines. J Am Coll Cardiol. 2022;80(20):1900–8. [DOI] [PMC free article] [PubMed] [Google Scholar]
- 13.Self WH, Tenforde MW, Rhoads JP, Gaglani M, Ginde AA, Douin DJ, et al. Comparative effectiveness of Moderna, Pfizer-BioNTech, and Janssen (Johnson & Johnson) vaccines in preventing COVID-19 hospitalizations among adults without immunocompromising conditions—United States, March–August 2021. MMWR Morb Mortal Wkly Rep. 2021;70(38):1337–43. [DOI] [PMC free article] [PubMed] [Google Scholar]
Associated Data
This section collects any data citations, data availability statements, or supplementary materials included in this article.


