Summary box.
More than a dozen studies and reports have assessed the association between COVID-19 health outcomes and the leading country-level metrics of pandemic preparedness: States Parties Annual Report, the Joint External Evaluation and the Global Health Security (GHS) Index.
The recent article by Ledesma et al in this journal is the rare exception in finding several correlations between GHS indicators and COVID-19 excess mortality, but it has a critical error—it fails to account properly for gross domestic product per capita.
Doing so fundamentally changes the conclusions of the research as nearly all the paper’s significant findings are no longer statistically significant when this problem is addressed.
The COVID-19 pandemic revealed that many countries are not equipped or able to effectively respond to emerging diseases. Doing better when the next dangerous pathogen emerges depends on understanding which capacities most effectively enable countries to prevent, detect and respond to epidemics and pandemics, and investing adequately in those capacities in advance. With that in mind, more than a dozen studies and reports have assessed the association between COVID-19 health outcomes and the leading country-level metrics of pandemic preparedness: States Parties Annual Report, the Joint External Evaluation (JEE) and the Global Health Security (GHS) Index. Most of the assessments have failed to find a clear association between COVID-19 mortality and infection rates and those pandemic preparedness metrics,1–8 including those studies that account for under-reporting and factors that influence COVID-19 fatality and infection rates such as age, sociodemographics, and key comorbidities.9
The recent article by Ledesma et al in this journal is the rare exception in finding several correlations between GHS indicators and COVID-19 excess mortality, but it has a critical error—it fails to account properly for gross domestic product (GDP) per capita.10 Doing so fundamentally changes the conclusions of the research as nearly all the paper’s significant findings are no longer statistically significant when this problem is addressed.
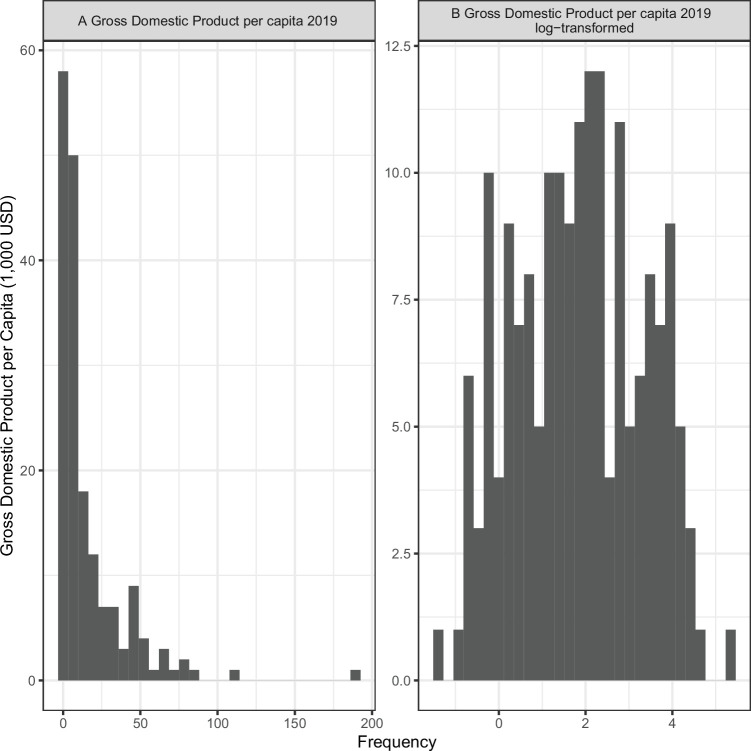
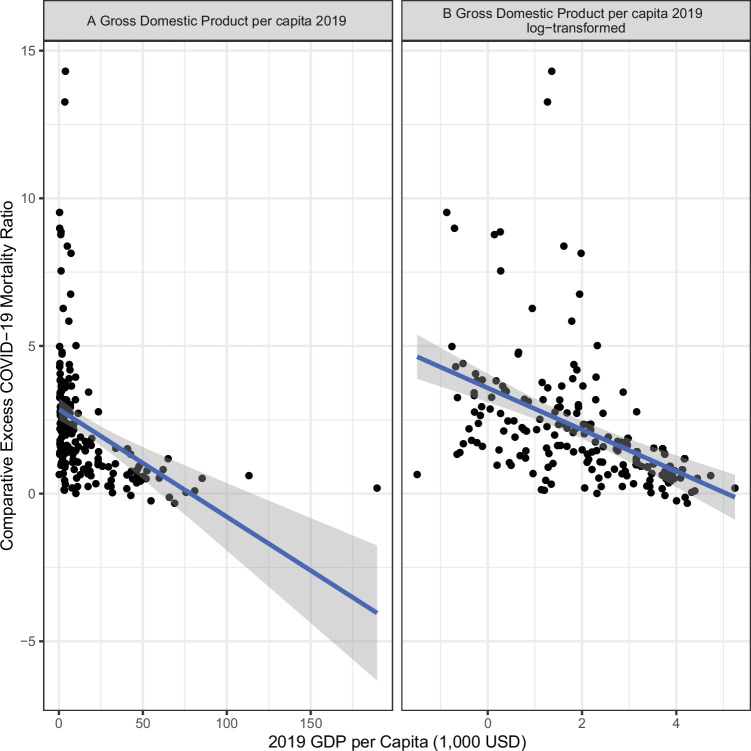
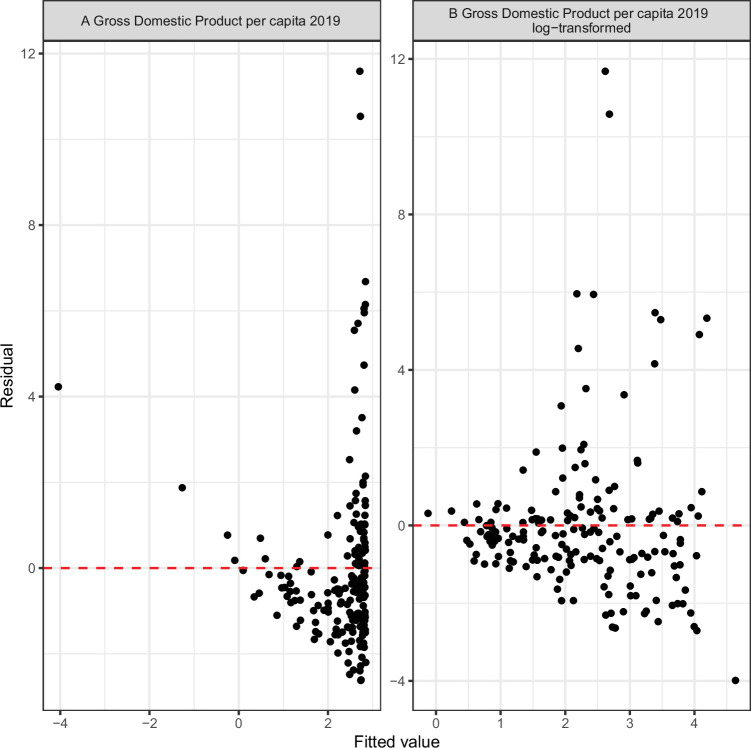
GDP per capita, a key control variable used in Ledesma et al’s paper, is highly right-skewed (figure 1A), meaning there are some countries’ values that are disproportionally larger than the mean and median values. Using a variable that is so heavily skewed often violates the necessary assumptions of a linear regression model—the model that Ledesma et al use—because the assumption of linearity is not met (figure 2A). In addition, a skewed variable can lead to heteroskedasticity, another violation of the standard linear regression model’s assumptions (figure 3A). Especially in smaller sample sizes (such as the one in Ledesma et al), skewed data can lead the estimator to be biased and inefficient, and the model results should not be trusted. Thus, it is the well-established standard to use a logarithmic transformation of GDP per capita.11 12 When GDP per capita is appropriately log-transformed, it leads to a distribution that is much closer to normal (figure 1B), has more of a linear relationship (figure 2B) with the dependent variable and has less heteroskedasticity (figure 3B). Critically, when GDP per capita is log-transformed the GHS composite index and 55 of its 56 subindices are no longer associated with lower excess COVID-19 mortality (table 1).
Figure 1.
The distribution of gross domestic product per capita: untransformed (A) and natural log transformed (B). Visual inspection suggests that the distribution of GDP per capita is closer to normal when it is natural log transformed. GDP = Gross domestic product.
Figure 2.
The relationship between GDP per capita and excess mortality with GDP per capita untransformed (A) and natural log transformed (B). Visual inspection suggests there is more of a linear relationship when GDP per capita is natural log transformed. GDP = Gross domestic product.
Figure 3.
Testing for heteroskedasticity: Gross domestic product untransformed (A) and natural log transformed (B). Visual inspection suggests natural log transformation reduces heteroskedasticity.
Table 1.
The estimated relationship between Global Health Security Index scores and excess mortality with and without natural log transformation of gross domestic product per capita. When adjusting for multiple hypotheses using the Bonferroni adjustment a traditional threshold for statistical significance 0.05 becomes 0.0009 because 57 different hypotheses are being tested. Green rows in the table are statistically significant using that threshold. When using the natural log transforming only one estimate shows a statistically significant relationship between a GHS Index score and excess mortality
| Income-adjusted analysis (Ledesma et al) | Log-transformed income-adjusted | |||
| Pandemic preparedness capacity | Coefficient (corrected 95% CI) | P value | Coefficient (corrected 95% CI) | P value |
| Overall score | −0.21 (−0.41 to 0.02) | 0.0004* | −0.11 (−0.32 to 0.10) | 0.0740 |
| Prevention of the emergence or release of pathogens | −0.11 (−0.26 to 0.03) | 0.0086 | −0.03 (−0.16 to 0.11) | 0.5130 |
| (1.1) Antimicrobial resistance | −0.05 (−0.14 to 0.04) | 0.0670 | −0.01 (−0.10 to 0.08) | 0.7153 |
| (1.2) Zoonotic disease | −0.09 (−0.23 to 0.04) | 0.0200 | −0.03 (−0.15 to 0.09) | 0.3704 |
| (1.3) Biosecurity | −0.05 (−0.16 to 0.06) | 0.1325 | 0.00 (−0.10 to 0.10) | 0.9771 |
| (1.4) Biosafety | −0.03 (−0.11 to 0.04) | 0.1577 | 0.01 (−0.06 to 0.08) | 0.7273 |
| (1.5) Dual-use research and culture of responsible science | −0.04 (−0.17 to 0.09) | 0.3027 | −0.01 (−0.11 to 0.09) | 0.7794 |
| (1.6) Immunisation | −0.08 (−0.17 to 0.01) | 0.0047 | −0.04 (−0.12 to 0.05) | 0.1573 |
| Early detection and reporting for epidemics of potential international concern | −0.09 (−0.22 to 0.03) | 0.0140 | −0.05 (−0.15 to 0.06) | 0.1402 |
| (2.1) Laboratory systems strength and quality | −0.05 (−0.13 to 0.03) | 0.0540 | −0.02 (−0.09 to 0.04) | 0.2659 |
| (2.1.1) Laboratory capacity for detecting priority diseases | −0.06 (−0.14 to 0.02) | 0.0166 | −0.03 (−0.10 to 0.04) | 0.1955 |
| (2.1.2) Laboratory quality systems | −0.02 (−0.09 to 0.05) | 0.2774 | −0.01 (−0.07 to 0.05) | 0.5731 |
| (2.2) Laboratory supply chains | 0.02 (−0.1 to 0.14) | 0.5140 | 0.05 (−0.07 to 0.17) | 0.1687 |
| (2.3) Real-time surveillance and reporting | −0.02 (−0.10 to 0.05) | 0.3634 | −0.01 (−0.07 to 0.06) | 0.7706 |
| (2.4) Surveillance data accessibility and transparency | −0.04 (−0.13 to 0.04) | 0.1103 | 0.00 (−0.08 to 0.08) | 0.9517 |
| (2.5) Case-based investigation | −0.09 (−0.19 to 0.01) | 0.0042 | −0.05 (−0.14 to 0.05) | 0.0987 |
| (2.6) Epidemiology workforce | −0.07 (−0.17 to 0.04) | 0.0332 | −0.07 (−0.18 to 0.03) | 0.0217 |
| Rapid response to and mitigation of the spread of an epidemic | −0.19 (−0.41 to 0.04) | 0.0072* | −0.08 (−0.33 to 0.17) | 0.2662 |
| (3.1) Emergency preparedness and response planning | −0.07 (−0.19 to 0.04) | 0.0270 | −0.03 (−0.15 to 0.08) | 0.3032 |
| (3.1.1) National public health emergency preparedness and response plan | −0.05 (−0.12 to 0.03) | 0.0398 | −0.02 (−0.08 to 0.05) | 0.3565 |
| (3.1.3) Non-pharmaceutical interventions planning | −0.04 (−0.11 to 0.02) | 0.0274 | −0.02 (−0.09 to 0.05) | 0.2821 |
| (3.2) Exercising response plans | −0.11 (−0.34 to 0.11) | 0.1003 | −0.12 (−0.34 to 0.10) | 0.0633 |
| (3.3) Emergency response operation | −0.06 (−0.19 to 0.07) | 0.1020 | −0.02 (−0.14 to 0.10) | 0.5684 |
| (3.4) Linking public health and security authorities | −0.02 (−0.07 to 0.04) | 0.3364 | 0.00 (−0.05 to 0.05) | 0.8315 |
| (3.5) Risk communication | −0.07 (−0.20 to 0.05) | 0.0523 | −0.04 (−0.16 to 0.08) | 0.2612 |
| (3.6) Access to communications infrastructure | −0.17 (−0.33 to 0.01) | 0.0007* | −0.03 (−0.30 to 0.23) | 0.6556 |
| (3.7) Trade and travel restrictions | 0.03 (−0.05 to 0.12) | 0.1835 | 0.00 (−0.08 to 0.08) | 0.9691 |
| Sufficient and robust health sector to treat the sick and protect health workers | −0.10 (−0.27 to 0.06) | 0.0366 | −0.03 (−0.20 to 0.14) | 0.5480 |
| (4.1) Health capacity in clinics, hospitals and community care centres | −0.10 (−0.24 to 0.05) | 0.0247 | −0.01 (−0.18 to 0.15) | 0.7643 |
| (4.1.2) Facilities capacity | −0.06 (−0.15 to 0.04) | 0.0436 | 0.00 (−0.10 to 0.09) | 0.8999 |
| (4.2) Supply chain for health system and healthcare workers | −0.06 (−0.17 to 0.05) | 0.0878 | −0.01 (−0.12 to 0.10) | 0.8481 |
| (4.3) Medical countermeasures and personnel deployment | −0.02 (−0.10 to 0.06) | 0.3205 | 0.01 (−0.06 to 0.08) | 0.5644 |
| (4.4) Healthcare access | −0.05 (−0.42 to 0.32) | 0.6395 | 0.01 (−0.32 to 0.34) | 0.9189 |
| (4.5) Communications with healthcare workers during a public health emergency | −0.02 (−0.10 to 0.05) | 0.3019 | −0.01 (−0.09 to 0.06) | 0.5135 |
| (4.6) Infection control practices | −0.03 (−0.08 to 0.03) | 0.0738 | −0.01 (−0.06 to 0.05) | 0.7408 |
| (4.7) Capacity to test and approve new medical countermeasures | −0.06 (−0.18 to 0.06) | 0.0991 | −0.04 (−0.15 to 0.08) | 0.2773 |
| Commitments to improving national capacity, financing and adherence to norms | −0.17 (−0.39 to 0.05) | 0.0127 | −0.12 (−0.33 to 0.09) | 0.0513 |
| (5.1) International Health Regulations reporting compliance and disaster risk reduction | 0.01 (−0.09 to 0.11) | 0.8552 | 0.02 (−0.07 to 0.11) | 0.4440 |
| (5.2) Cross-border agreements on public health and animal health emergency response | −0.07 (−0.14 to 0.00) | 0.0012 | −0.05 (−0.12 to 0.03) | 0.0336 |
| (5.3) International commitments | −0.06 (−0.16 to 0.03) | 0.0261 | −0.04 (−0.13 to 0.06) | 0.1803 |
| (5.4) Joint External Evaluation (JEE) and Performance of Veterinary Services (PVS) Pathway | 0.03 (−0.10 to 0.16) | 0.4266 | −0.04 (−0.18 to 0.09) | 0.2806 |
| (5.5) Financing | −0.07 (−0.19 to 0.05) | 0.0432 | −0.08 (−0.20 to 0.03) | 0.0198 |
| (5.6) Commitment to sharing of genetic and biological data and specimens | −0.05 (−0.26 to 0.16) | 0.4391 | 0.01 (−0.16 to 0.17) | 0.9171 |
| Overall risk environment and country vulnerability to biological threats | −0.30 (−0.50 to 0.10) | <0.0001* | −0.25 (−0.50 to 0.01) | 0.0016 |
| (6.1) Political and security risk | −0.15 (−0.30 to 0.00) | 0.0014 | −0.09 (−0.25 to 0.06) | 0.0454 |
| (6.1.1) Government effectiveness | −0.21 (−0.35 to 0.06) | <0.0001* | −0.16 (−0.31 to 0.00) | 0.0009* |
| (6.2) Socio-economic resilience | −0.23 (−0.39 to 0.07) | <0.0001* | −0.19 (−0.44 to 0.07) | 0.0156 |
| (6.2.3) Social inclusion | −0.13 (−0.24 to 0.02) | 0.0002* | −0.08 (−0.26 to 0.11) | 0.1599 |
| (6.2.4) Public confidence in government | −0.08 (−0.15 to 0.00) | 0.0008* | −0.06 (−0.14 to 0.02) | 0.0087 |
| (6.2.6) Inequality | −0.11 (−0.23 to 0.01) | 0.0035 | −0.10 (−0.22 to 0.02) | 0.0055 |
| (6.3) Infrastructure adequacy | −0.11 (−0.23 to 0.02) | 0.0049 | −0.01 (−0.17 to 0.15) | 0.7954 |
| (6.4) Environmental risks | −0.04 (−0.29 to 0.20) | 0.5659 | −0.07 (−0.31 to 0.17) | 0.3345 |
| (6.5) Public health vulnerabilities | −0.21 (−0.40 to 0.02) | 0.0003* | −0.10 (−0.32 to 0.11) | 0.1102 |
| (6.5.1) Access to quality healthcare | −0.27 (−0.68 to 0.14) | 0.0306 | −0.27 (−0.64 to 0.10) | 0.0152 |
| (6.5.4) Trust in medical and health advice | −0.01 (−0.10 to 0.07) | 0.5972 | −0.02 (−0.09 to 0.06) | 0.5214 |
| (6.5.4a) Trust medical and health advice from the government | 0.01 (−0.05 to 0.07) | 0.5280 | −0.01 (−0.06 to 0.05) | 0.7622 |
| (6.5.4b) Trust medical and health advice from medical workers | −0.04 (−0.13 to 0.06) | 0.1918 | −0.02 (−0.11 to 0.07) | 0.4498 |
GDP, Gross domestic product; JEE, Joint External Evaluation.
In reviewing the article published online we contacted the lead author and editor-in-chief in August 2023 to advocate that the paper should be substantially revised or retracted in order to correct two critical errors: the failure to properly specify GDP and a previous failure to fully account for the risk of multiple hypothesis bias. In September, an acknowledgement was added to the paper post-publication that most of the coauthors in this assessment of the performance of the GHS Index were also involved in creating that Index.13 14 In November the paper was revised to add a Bonferroni adjustment to address the paper’s earlier failure to fully account for the risk of multiple hypothesis bias. Nevertheless, the failure to log transform income remains unaddressed and unacknowledged.15
We continue to believe that the failure to properly specify GDP is a critical error and that the paper needs to be substantially revised to address it. The stated intention of Ledesma et al is to inform the ‘unprecedented increases in development assistance towards pandemic preparedness in low-income to middle-income countries’.10 Yet, an analysis that does not properly account for GDP per capita cannot distinguish between wealth and preparedness (as measured by JEE or GHS Index, among others). There are many reasons why wealthy nations might on average have better COVID-19 outcomes that are not captured by pandemic preparedness indicators, including the ability to secure greater and earlier access to vaccines, therapeutics, tests and other essential medical supplies. If this analysis is meant to guide investments in poorer nations, it must be able to demonstrate that its results hold irrespective of income. Currently, it does not.
The JEE and GHS Index were intended to be tools for identifying gaps in national capacity to direct financial and political support appropriately. They were never intended to predict pandemic outcomes and many analyses suggest they were indeed not predictive in the COVID-19 crisis. Yet, many of the measures assessed by these metrics, such as laboratory capacity, might well prove critically important against future emerging disease threats.
Uncertainty over how to assess a country’s preparedness to prevent, detect and respond to pandemic threats is undermining efforts to optimally allocate investments in pandemic preparedness and thwarting efforts to convince donors and policymakers to invest more in initiatives such as the Pandemic Fund that are designed to help countries improve global health security. An essential step in building broad-based support and confidence in global health security is building trust and this starts with being as rigorous and transparent in our assessments as possible. Without that trust, we cannot hope to better prevent, detect and respond to future threats.
Footnotes
Contributors: Planning: JLD, ENH, and TJB; analysis: ENH; draft or revised manuscript: all authors.
Funding: The authors have not declared a specific grant for this research from any funding agency in the public, commercial or not-for-profit sectors.
Competing interests: None declared.
Provenance and peer review: Not commissioned; externally peer reviewed.
Data availability statement
Data are available upon request.
Ethics statements
Patient consent for publication
Not applicable.
Ethics approval
Not applicable.
References
- 1. The Independent Panel for Pandemic Preparedness and Response . COVID-19: make it the last pandemic. 2021. Available: https:// recommendations.theindependentpanel.org/main-report/main- report/ [DOI] [PMC free article] [PubMed]
- 2. Haider N, Yavlinsky A, Chang Y-M, et al. The global health security index and joint external evaluation score for health preparedness are not correlated with countries’ COVID-19 detection response time and mortality outcome. Epidemiol Infect 2020;148:e210. 10.1017/S0950268820002046 [DOI] [PMC free article] [PubMed] [Google Scholar]
- 3. Milanovic B. Beware of Mashup indexes: how epidemic predictors got it all wrong: Globalinequality. Available: https://glineq.blogspot.com/2021/01/beware-ofmashup-indexes-how-epidemic.html [Accessed 25 Apr 2021].
- 4. Crosby S, Dieleman JL, Kiernan S, et al. All bets are off for measuring pandemic preparedness. Think Global Health. Council on Foreign Relations; 2020. Available: https://www.thinkglobalhealth.org/article/all-bets-are-measuring-pandemic-preparedness [Google Scholar]
- 5. Abbey EJ, Khalifa BAA, Oduwole MO, et al. The global health security index is not predictive of coronavirus pandemic responses among organization for economic cooperation and development countries. PLoS One 2020;15:e0239398. 10.1371/journal.pone.0239398 [DOI] [PMC free article] [PubMed] [Google Scholar]
- 6. Council on Foreign Relations, Independent Task Force . Improving pandemic preparedness: lessons from COVID-19. 2020. Available: https://www.cfr.org/report/pandemic-preparedness-lessons-covid-19
- 7. Fukuda-Parr S, Buss P, Ely Yamin A. Pandemic treaty needs to start with rethinking the paradigm of global health security. BMJ Glob Health 2021;6:e006392. 10.1136/bmjgh-2021-006392 [DOI] [PMC free article] [PubMed] [Google Scholar]
- 8. Rose SM, Paterra M, Isaac C, et al. Analysing COVID-19 outcomes in the context of the 2019 global health security (GHS) index. BMJ Glob Health 2021;6:e007581. 10.1136/bmjgh-2021-007581 [DOI] [PMC free article] [PubMed] [Google Scholar]
- 9. Bollyky TJ, Hulland EN, Barber RM, et al. Pandemic preparedness and COVID-19: an exploratory analysis of infection and fatality rates, and contextual factors associated with preparedness in 177. The Lancet 2022;399:1489–512. 10.1016/S0140-6736(22)00172-6 [DOI] [PMC free article] [PubMed] [Google Scholar]
- 10. Ledesma JR, Isaac CR, Dowell SF, et al. Evaluation of the global health security index as a predictor of COVID-19 excess mortality standardised for under-reporting and age structure. BMJ Glob Health 2023;8:e012203. 10.1136/bmjgh-2023-012203 [DOI] [PMC free article] [PubMed] [Google Scholar]
- 11. Kennedy PE. A Guide to Econometrics 6th edn. Malden: MA:Blackwell Publishing, 2008. [Google Scholar]
- 12. Gelman A, Hill J. Data Analysis Using Regression and Multilevel/Hierarchical Models. Cambridge: Cambridge University Press, Available: https://www.cambridge.org/core/product/identifier/9780511790942/type/book [Google Scholar]
- 13. Kentikelenis A, Seabrooke L. Organising knowledge to prevent global health crises: a comparative analysis of pandemic preparedness indicators. BMJ Glob Health 2021;6:e006864. 10.1136/bmjgh-2021-006864 [DOI] [PMC free article] [PubMed] [Google Scholar]
- 14. Dowell SF, Wang H, Blazes D. Better pandemic preparedness does correlate with lower COVID-19 mortality. Gates Open Res 2022;6:76. 10.12688/gatesopenres.13649.1 [DOI] [Google Scholar]
- 15. Correction: evaluation of the global health security index as a predictor of COVID-19 excess mortality standardised for under-reporting and age structure. BMJ Glob Health 2023;8:e012203corr1. 10.1136/bmjgh-2023-012203corr1 [DOI] [PMC free article] [PubMed] [Google Scholar]
Associated Data
This section collects any data citations, data availability statements, or supplementary materials included in this article.
Data Availability Statement
Data are available upon request.


