Abstract
In mice, exit from the totipotent 2-cell (2C) embryo stage requires silencing of the 2C-associated transcriptional program. However, the molecular mechanisms involved in this process remain poorly understood. Here, we demonstrate that the 2C-specific transcription factor DUX mediates an essential negative feedback loop by inducing the expression of DUXBL to promote this silencing. We show that DUXBL gains accessibility to DUX-bound regions specifically upon DUX expression. Furthermore, we determine that DUXBL interacts with TRIM24 and TRIM33, members of the tripartite motif superfamily involved in gene silencing and co-localizes with them in nuclear foci upon DUX expression. Importantly, DUXBL overexpression impairs 2C-associated transcription, whereas Duxbl inactivation in ESC increases DUX-dependent induction of the 2C-transcriptional program. Consequently, DUXBL deficiency in embryos results in sustained expression of 2C-associated transcripts leading to early developmental arrest. Our study identifies DUXBL as an essential regulator of totipotency exit enabling the first divergence of cell fates.
Keywords: DUXBL, DUX, ZGA, Totipotency, 2C-like cell
INTRODUCTION
Totipotency, the ability of a single cell to develop into a full organism, is a property associated with the zygote and the 2C embryo in mice1. This unlimited potential becomes restricted upon further development and zygotic genome activation (ZGA) seems to be the trigger for loss of totipotency in vivo2–4. ZGA is the process that determines the transition from maternal to zygotic transcription. In mice, it starts as a minor wave from S-phase of the zygote to G1 phase of the 2C embryo and is followed by a major transcriptional wave during the mid-to-late 2C embryo stage2–4. Interestingly, ZGA confers to the 2C embryo a unique transcriptional profile characterized by the expression of cleavage stage-specific genes, including Dux, genes from the Zscan4(a-f) cluster, Zfp352, and Pramef-family genes and the murine endogenous retroviral element (MERVL)-family of transposable elements (TE)5–7. These TE become derepressed following the wave of global demethylation after fertilization and are highly transcribed at the 2C stage8. Although the function of these sequences is still unclear, interfering with their expression leads to developmental defects9,10. Moreover, despite the requirement to quickly activate 2C-associated genes and MERVL elements during ZGA, their silencing is needed to ensure developmental progression and proper exit from totipotency at the 4C stage. Indeed, sustained activation of the 2C-associated transcriptional program induces developmental arrest with blastomeres at the 4C stage retaining a 2C transcriptional signature11. The mechanisms of silencing the 2C transcriptional program are not completely understood but involve redundant and independent processes, including transcriptional repression of the Dux gene by TRIM66, the E3 ligase PIAS4 or SMCHD1 as well as physical recruitment of genomic Dux loci to nucleolar heterochromatin12–15. Furthermore, the protein complex ZMYM2/LSD1, the chromatin remodeler CAF-1 and the RNA decay complex NEXT have been implicated in the silencing of MERVL repeats both at the transcriptional and post-transcriptional level16–18.
The protein DUX is a pioneer transcription factor that is necessary and sufficient to trigger a unique ZGA-associated transcriptional signature in embryonic stem cells (ESC)5–7. Indeed, expression of DUX increases the natural occurrence of 2C-like cells (2CLC), endogenous cells within ESC cultures that display transcriptional and chromatin features of 2C embryos5–8. Interestingly, the human ortholog DUX4 is involved in facioscapulohumeral muscular dystrophy, a disorder characterized by elevated levels of DUX4 and reactivation of endogenous retroviral sequences and ZGA transcripts in myofibers leading to pronounced cell toxicity19. Similarly, sustained DUX expression in mouse ESC induces cell death and extensive DNA damage20. DUX belongs to the family of double homeobox domain transcription factors. It contains two N-terminal DNA-binding homeodomains in addition to a C-terminal sequence that confers transcriptional activation through the recruitment of the histone acetyl transferases (HAT) CBP/P30021. Indeed, deletion of this C-terminal region (DUXΔC) abolishes DUX-mediated gene transactivation and cell toxicity suggesting that this interaction is necessary to mediate the DUX-induced transcriptional program21. Another member of the DUX family is DUXBL, only found in the mouse and rat genomes22,23. DUXBL is involved in β-selection by inducing apoptosis in pre-T cells with failed rearrangements and plays a critical role in regeneration-dependent rhabdomyosarcoma formation24,25. However, the role of DUXBL during early development remains unknown.
In this work we show that DUXBL expression leads to impaired DUX-induced transcription and 2CLC conversion. DUXBL inactivation results in defective silencing of 2C-specific transcripts and early developmental arrest. Our study identifies DUXBL as an essential regulator of the exit from totipotency.
RESULTS
DUX directly induces expression of the Duxbl gene
We first examined expression dynamics of Duxbl during mouse preimplantation development using published transcriptomic data26. We found that Duxbl follows the wave of Dux expression overlapping with the major wave of ZGA (Fig. 1a). Since many ZGA genes are transcriptional targets of DUX, we next tested whether DUX induces Duxbl expression. Using ESC carrying a doxycycline (DOX)-inducible Dux cDNA (hereafter, ESCDUX), we found that Dux induced Duxbl expression in a dose-dependent manner (Fig. 1b). Analysis of DUX-HA ChIP-seq datasets5 revealed that DUX binds three regions upstream of the start codon of the Duxbl gene (Fig. 1c). To explore whether these binding regions (BR1, 2 and 3) contribute to Duxbl gene expression, we generated fluorescence-based reporter vectors by subcloning each BR upstream of a GFP cDNA. In addition, we examined MERVL reactivation using an LTR-RFP reporter in which RFP expression is driven by a specific LTR from MERVL sequences8. We observed that BR1 was constitutively active in ESC, independent of DUX expression (Extended Data Fig. 1a). However, BR2 and BR3 showed DUX-dependent activation with expression levels of GFP correlating with those of RFP (Fig. 1d and Extended Data Fig. 1b, Supplementary Videos 1 and 2).
Fig. 1: The Duxbl gene generates two protein products upon DUX expression.
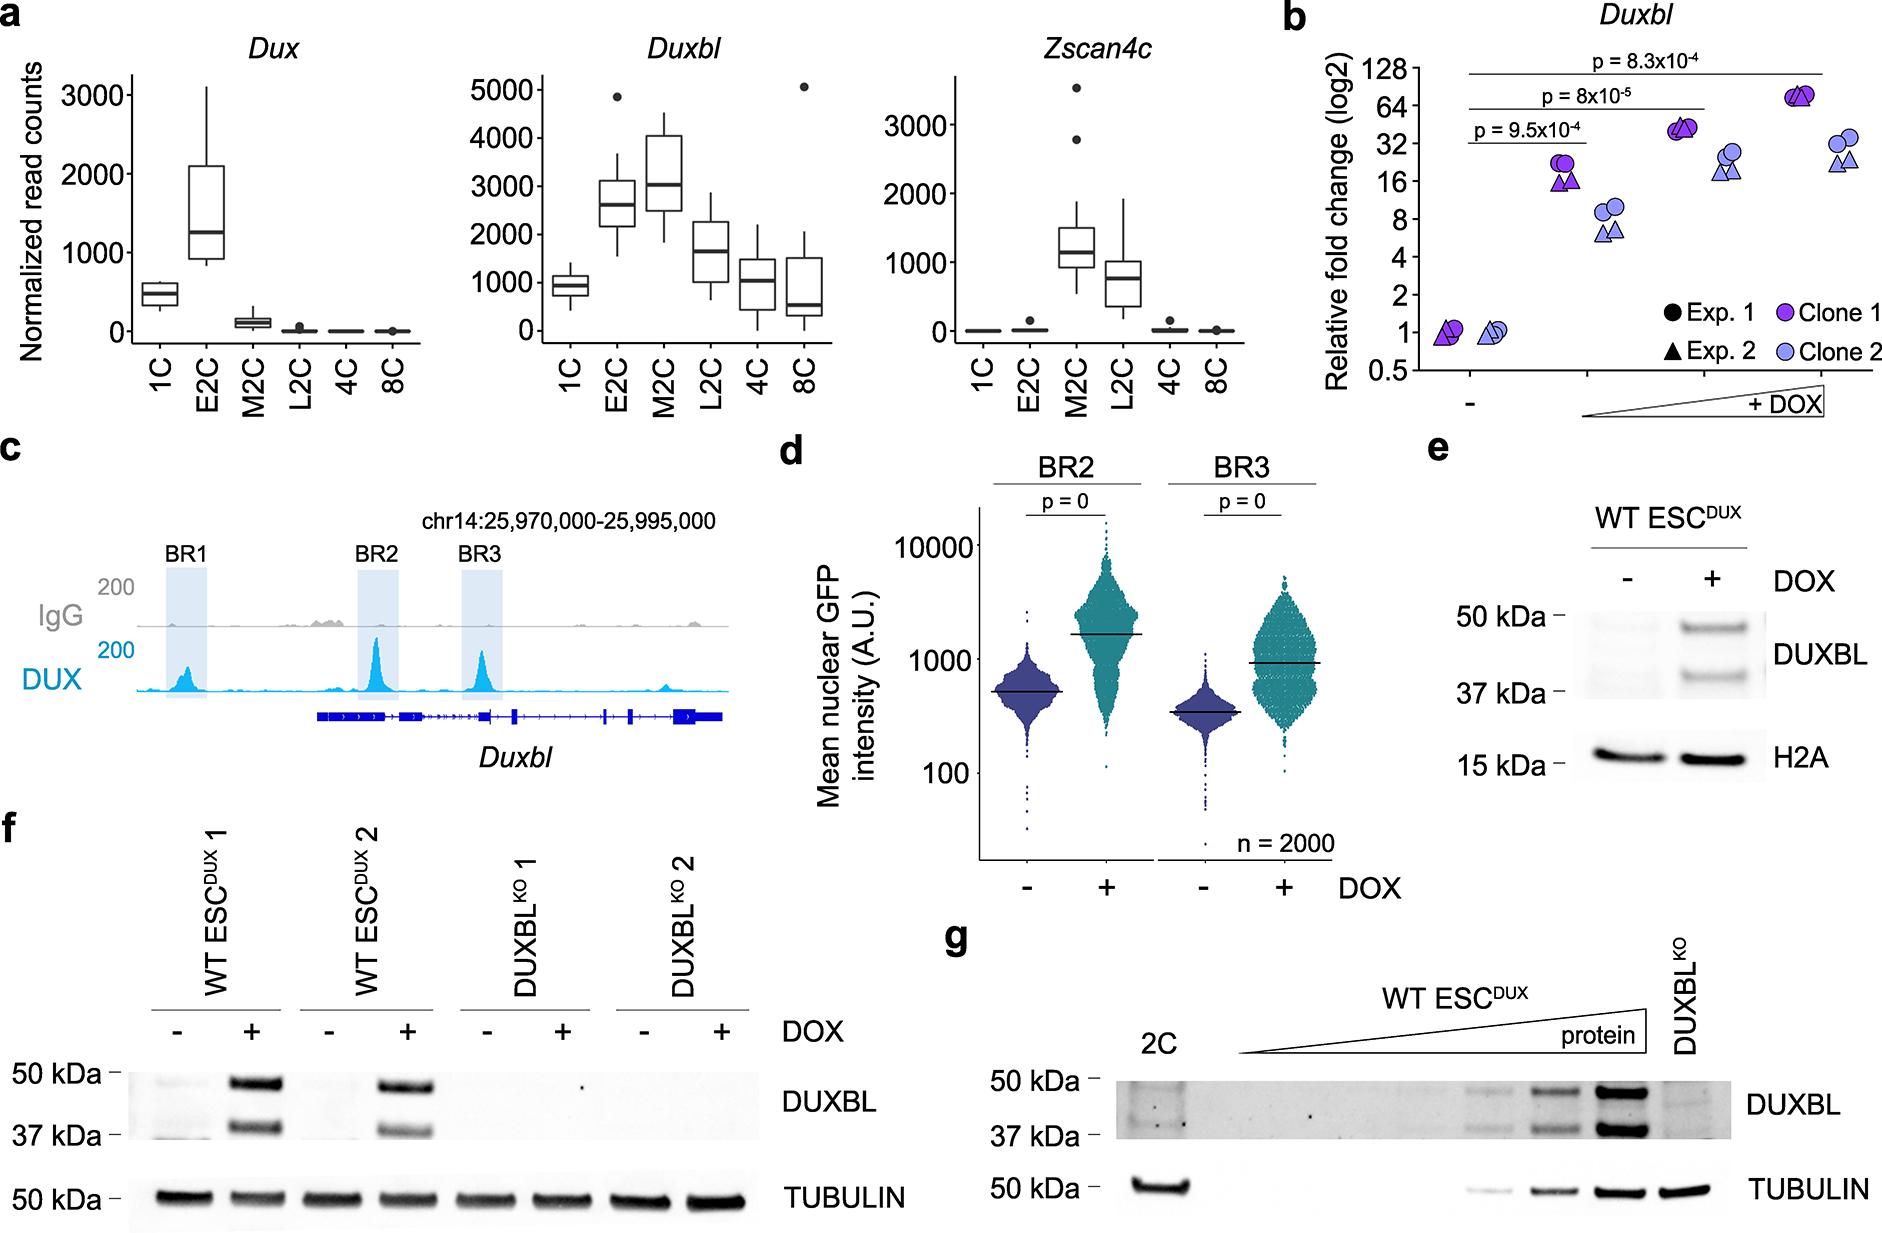
a) Box and whisker plots showing normalized read counts for Duxbl, Dux and Zscan4c during early development. Zscan4c is included as a key DUX-dependent gene of major ZGA. Single cell RNAseq data was extracted from26. Center line indicates the median, box extends from the 25th to 75th percentiles and whiskers extend from the hinge to the largest or smallest value no further than 1.5-fold from the inter-quartile range. Data beyond the whiskers are plotted individually. 1C (n=4), E2C (n=8), M2C (n=12), L2C (n=10), 4C (n=14), 8C (n=28); E2C, M2C and L2C: early, mid and late 2C embryo. b) Relative fold change (log2) expression of Duxbl upon DUX expression in ESCDUX. Reactions were performed in duplicate with two independent experiments using two different ESCDUX lines. p values are shown from two-tailed paired t-tests. c) Genome browser tracks from individual representative samples showing DUX occupancy at the Duxbl gene. ChIP-seq data obtained from5. DUX binding sites and BR regions are highlighted. Read mapping was performed using the mm39 mouse genome version. d) High-throughput imaging quantification of GFP mean nuclear intensity in untreated or DOX-treated for 16 hours BR2 or BR3-GFP reporter ESCDUX. Center lines indicate mean values. n=2000; p values are shown from one-tailed unpaired t-tests. e) Western blot analysis of DUXBL performed in lysates from untreated or DOX-treated for 16 hours ESCDUX. H2A levels are shown as a loading control. f) Western blot analysis of DUXBL performed in lysates from untreated or DOX-treated for 16 hours WT and DUXBLKO ESCDUX. g) Western blot analysis of DUXBL performed in lysates from a pool of approximately one thousand late 2C-embryos. Increasing amounts of DOX-treated WT ESCDUX as well as DOX-treated DUXBLKO ESCDUX lysates were included as controls. Tubulin levels are shown as a loading control. For (e-g) two independent experiments were performed but one representative experiment is shown.
Next, we generated an antibody against the C-terminal region of DUXBL. Interestingly, we detected two bands of equal intensity by Western blot analysis upon DUX expression in ESC (Fig. 1e). The upper band corresponds to a protein form of the predicted molecular weight for DUXBL while the lower band could represent a shorter DUXBL protein form via an alternative ATG located at the end of the second exon (Extended Data Fig. 1c–e). Indeed, both protein forms were confirmed by mass spectrometry analyses as Duxbl products (Supplementary Table 1). Importantly, CRISPR/Cas9-based deletions affecting proper splicing of exon 2 and/or elimination of the alternative ATG led to a full Duxbl knockout in ESCDUX (DUXBLKO ESCDUX) and confirmed the specificity of the DUXBL antibody (Fig. 1f, Extended Data Fig. 1c–e). We then examined whether DUXBL is expressed in mouse embryos. Although our DUXBL antibody was not useful to detect endogenous levels of DUXBL by immunofluorescence, Western blot analyses confirmed that both DUXBL protein isoforms are expressed in late 2C embryos following the wave of DUX expression (Fig. 1g and Extended Data Fig. 1f).
DUXBL expression levels determine 2CLC conversion efficiency
Next, we asked whether DUXBL plays a similar role as DUX in enhancing 2C-associated transcription. DUXBL overexpression in ESC did not elicit major transcriptional changes indicating that DUXBL does not function as a transcriptional activator (Extended Data Fig. 2a,b; Supplementary Table 2). Interestingly, DUXBL lacks the C-terminal domain contained in DUX, suggesting that DUXBL, similar to DUXΔC lacks transcriptional activation potential21. In agreement, co-immunoprecipitation assays showed that DUXBL does not interact with p300 in contrast to DUX which shows a strong interaction (Extended Data Fig. 2c). These data suggest that DUXBL could act as a transcriptional repressor rather than as an activator. Following this idea, we first examined the dynamics of endogenous 2CLC conversion in wild type (WT) and DUXBLKO ESC. The residency time in the 2CLC state after conversion was significantly extended in DUXBLKO ESC (Fig. 2a and Extended Data Fig. 3a). Moreover, DUXBL deficiency promoted a slight increase in endogenous 2CLC conversion (Extended Data Fig. 3b). Furthermore, 2C-associated genes showed increased levels in 2CLC obtained from DUXBLKO ESC compared to those obtained from WT ESC (Extended Data Fig. 3c). We next performed RNAseq in untreated or DOX-treated WT ESCDUX or DUXBLKO ESCDUX. Consistent with previous reports5–7, DUX induced the 2C-associated transcriptional program in all ESC lines (Extended Data Fig. 3d). To examine the consequences of DUXBL loss, we focused our analysis on comparing DOX-treated ESCDUX because DUXBL would only be expressed upon DUX induction. We identified several hundred differentially expressed genes and significantly upregulated MERVL-elements in DOX-treated DUXBLKO ESCDUX compared to WT ESCDUX (Fig. 2b and Supplementary Table 3). Interestingly, while the expression of downregulated genes in DOX-treated DUXBLKO ESCDUX did not show enrichment for any specific developmental stage, upregulated genes were enriched at the 2C embryo stage compared to other stages of preimplantation development (Fig. 2c, Extended Data Fig. 3e)27. Furthermore, these upregulated genes had significant overlap with genes induced by DUX expression in ESC and revealed that DUXBL inactivation exacerbates the induction of 2C-associated genes and MERVL expression (Extended Data Fig. 3f,g). Consistent with the idea that DUXBL could act as a transcriptional repressor, co-expression of DUXBL together with DUX resulted in a significant downregulation of DUX-induced genes (Fig. 2d,e, Supplementary Table 2).
Fig. 2: DUXBL counteracts 2CLC conversion.
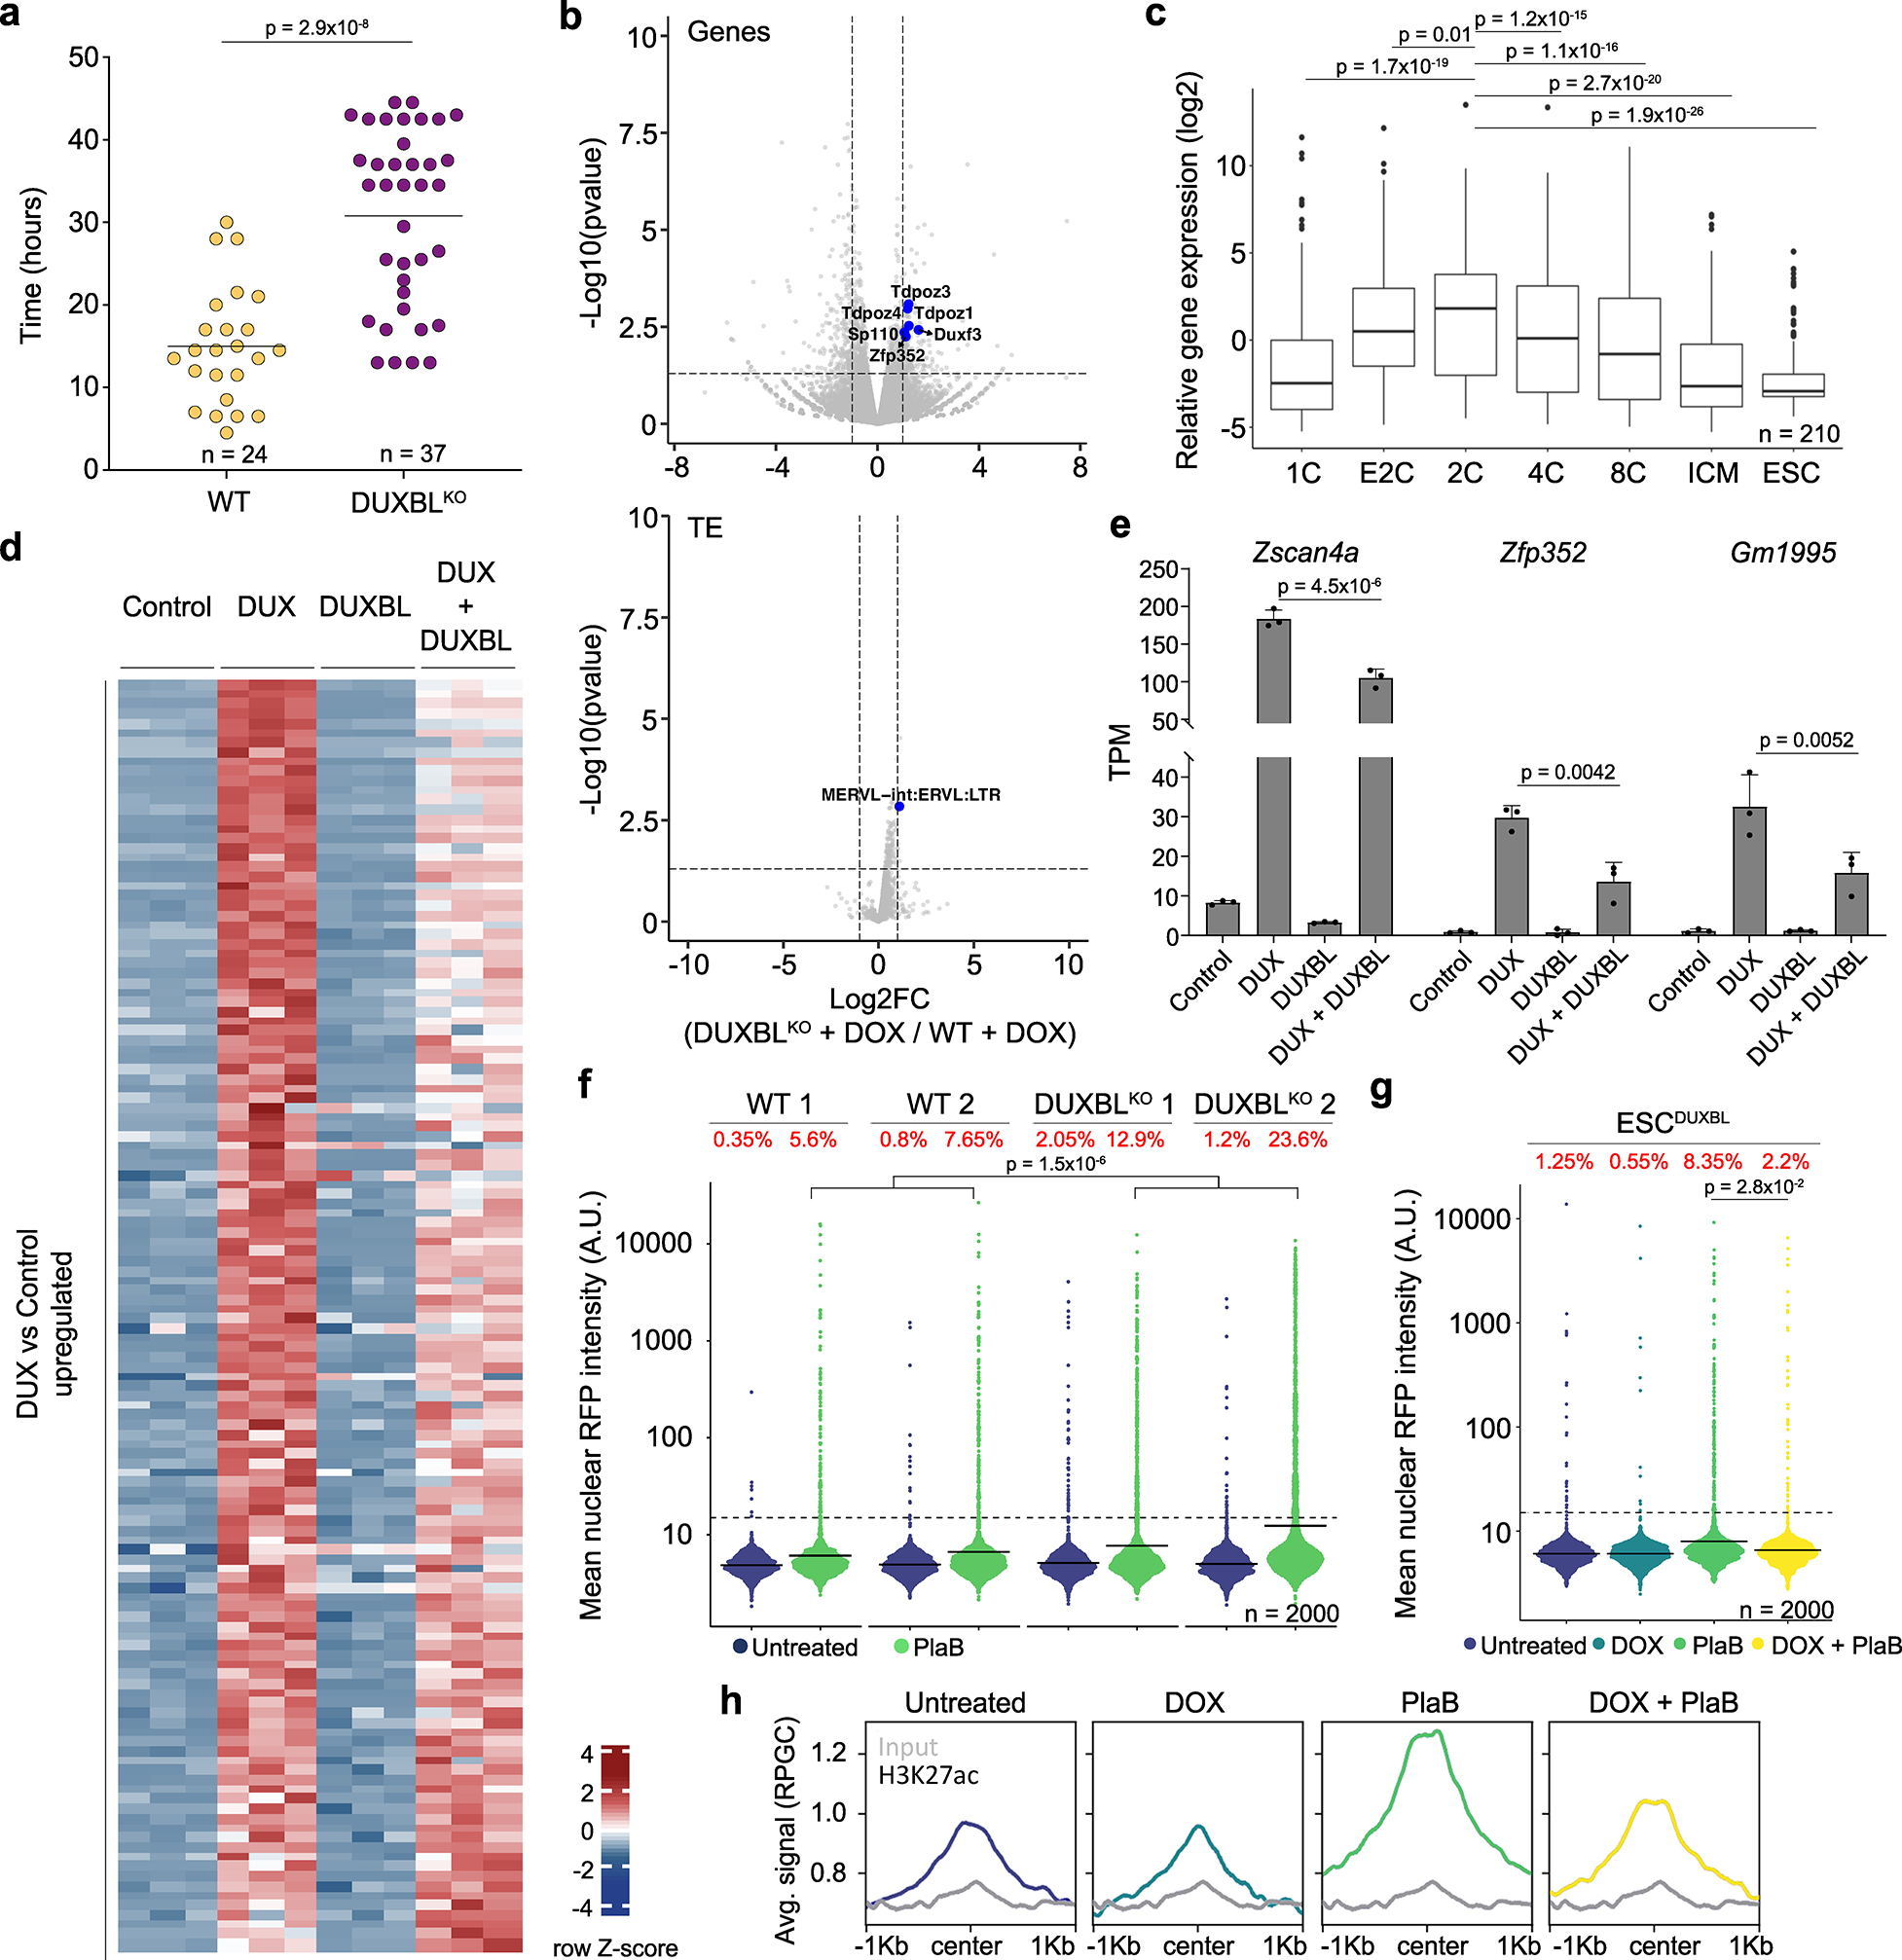
a) Graph showing 2CLC residency time evaluated by using the LTR-RFP reporter. p value is shown from a two-tailed unpaired t-test. Two independent experiments were performed but one representative is shown including two ESC lines per condition. b) Volcano plots showing differentially expressed genes (upper panel) and TE (lower panel) between DOX-treated DUXBLKO ESCDUX compared to DOX-treated WT ESCDUX. Relevant genes and TE are highlighted. c) Box and whisker plot showing normalized fold change expression of upregulated genes from (b) during preimplantation development including ESC. RNAseq data obtained from27. p-values are shown from two-tailed unpaired t-tests. Center line indicates the median, box extends from the 25th to 75th percentiles and whiskers extend from the hinge to the largest or smallest value no further than 1.5-fold from the inter-quartile range. Data beyond whiskers are plotted individually. ICM: Inner cell mass. For (b, c), data was generated using two independent ESC lines per genotype and condition. d) Heatmap showing differentially expressed genes between control and DUX and/or DUXBL-expressing ESC. e) Plot showing mean±standard deviation (SD) for transcript per million (TPM) values for Zscan4a, Zfp352 and Gm1995. Data was obtained from (d). p value was obtained from two-tailed Wald test. For (d, e), data was generated using three replicates per condition. f) High-throughput imaging (HTI) quantification of RFP+ cells in LTR-RFP reporter WT and DUXBLKO ESC incubated with 2.5 μM PlaB for 24 hours. g) HTI quantification of RFP+ cells in untreated or DOX-treated LTR-RFP reporter ESCDUXBL incubated with 2.5 μM PlaB for 24 hours. For (f, g), center lines indicate mean values. Percentages of RFP+ cells above the threshold (dotted line) are indicated. n=2000; p value is shown from one-tailed unpaired t-test. Three independent experiments were performed but one representative is shown. h) CUT&RUN read density plot (reads per genome content, RPGC) showing H3K27ac enrichment at DUX-bound sites in untreated or DOX-treated ESCDUXBL incubated with 2.5 μM PlaB for 24 hours. Input (IgG) is shown as control. Data was generated using two independent ESC lines per condition but results from one representative ESC line are shown.
To further assess the role of DUXBL in limiting 2CLC conversion we generated DOX-inducible ESC lines expressing the full-length DUXBL protein form (Extended Data Fig. 4a). We then tested the influence of DUXBL expression by inducing 2CLC reprogramming by adding the spliceosome inhibitor pladienolide B (PlaB) or retinoic acid (RA) to the culture media28,29. We observed that 2CLC conversion mediated by PlaB or RA treatment was further increased in DUXBLKO ESC compared to WT ESC (Fig. 2f, Extended Data Fig. 4b). Conversely, overexpression of DUXBL reduced the percentage of 2CLC in both PlaB and RA-treated cells (Fig. 2g, Extended Data Fig. 4c). Consistent with this, Western blot and real-time PCR analysis showed a significant decrease in the expression of 2C-associated genes upon induction of DUXBL expression in PlaB- or RA-treated WT ESC (Extended Data Fig. 4d,e). CTCF depletion is an alternative approach to efficiently induce 2CLC conversion20. Therefore, we generated DOX-inducible DUXBL as well as DUXBLKO cell lines in an auxin-inducible degron line for Ctcf (ESCCTCF-AID) (Extended Data Fig. 4a). Like PlaB and RA-treatments, overexpression of DUXBL impaired 2CLC conversion whereas an increase in the percentage of LTR-RFP+ cells was observed in DUXBLKO ESCCTCF-AID after CTCF depletion (Extended Data Fig. 4f–h). Finally, because DUX-induced 2CLC conversion depends on the recruitment of the HATs CBP/P30021, we examined the levels of H3K27ac in PlaB-treated cells. DUXBL expression prevented H3K27ac accumulation at DUX-bound regions upon PlaB-treatment (Fig. 2h). Taken together, these results demonstrate that DUXBL expression limits 2CLC conversion and DUX-induced transcription.
Zygotic expression of DUXBL impairs development
Based on our observations in ESC, we reasoned that DUXBL expression before that of DUX would prevent the activation of the 2C-associated transcriptional program in the developing embryo. To test this idea, we microinjected 1-cell (1C) embryos with either a control mRNA encoding mCherry with a nuclear localization signal (mCherryNLS) or mRNA encoding a V5-tagged DUXBL (DUXBLV5) in tandem with mCherryNLS (Fig. 3a, Extended Data Fig. 5a,b). Intriguingly, compared to non-injected and control-injected 1C embryos that developed normally into blastocysts, DUXBL overexpression prior to ZGA completely blocked developmental progression beyond the 2C embryo stage (Fig. 3b,c). To determine how precocious DUXBL expression prevented developmental progression, we collected late 1C, early and late 2C embryos previously injected either with control or DuxblV5 mRNAs at the 1C stage and performed RNAseq. Principal component analysis (PCA) showed that late 1C and early 2C embryos microinjected with control or DuxblV5 mRNA cluster together suggesting that DUXBL expression has marginal influence on the minor wave of ZGA (Fig. 3d, Extended Data Fig. 5c–e, Supplementary Table 4). However, DuxblV5 mRNA-injected late 2C embryos appeared as a clearly distinct cluster separated from control late 2C embryos resulting from profound transcriptional deregulation (Fig. 3d, e). Strikingly, comparison of transcriptomes of embryos injected with DuxblV5 mRNA to those of wild-type early and mid-2C stage embryos26 (Supplementary Table 5) revealed that 50.1% (2700/5377) of major wave-associated ZGA genes, including many genes regulated by DUX, were significantly downregulated upon DUXBL overexpression (Fig. 3f–h, Supplementary Table 4,5, Extended Data Fig. 5f). Next, we injected DuxblV5 mRNAs into each blastomere of late 2C stage embryos, a developmental time point when the majority of the 2C-associated transcriptional program is silenced. Intriguingly, embryos with DUXBLV5 overexpression developed into blastocysts at frequencies similar to controls (Supplementary Fig. 1). These data demonstrate that timed expression of DUXBL is critical to downregulate transcripts from the major wave of ZGA allowing further development.
Fig. 3: DUXBL overexpression in zygotes halts development.
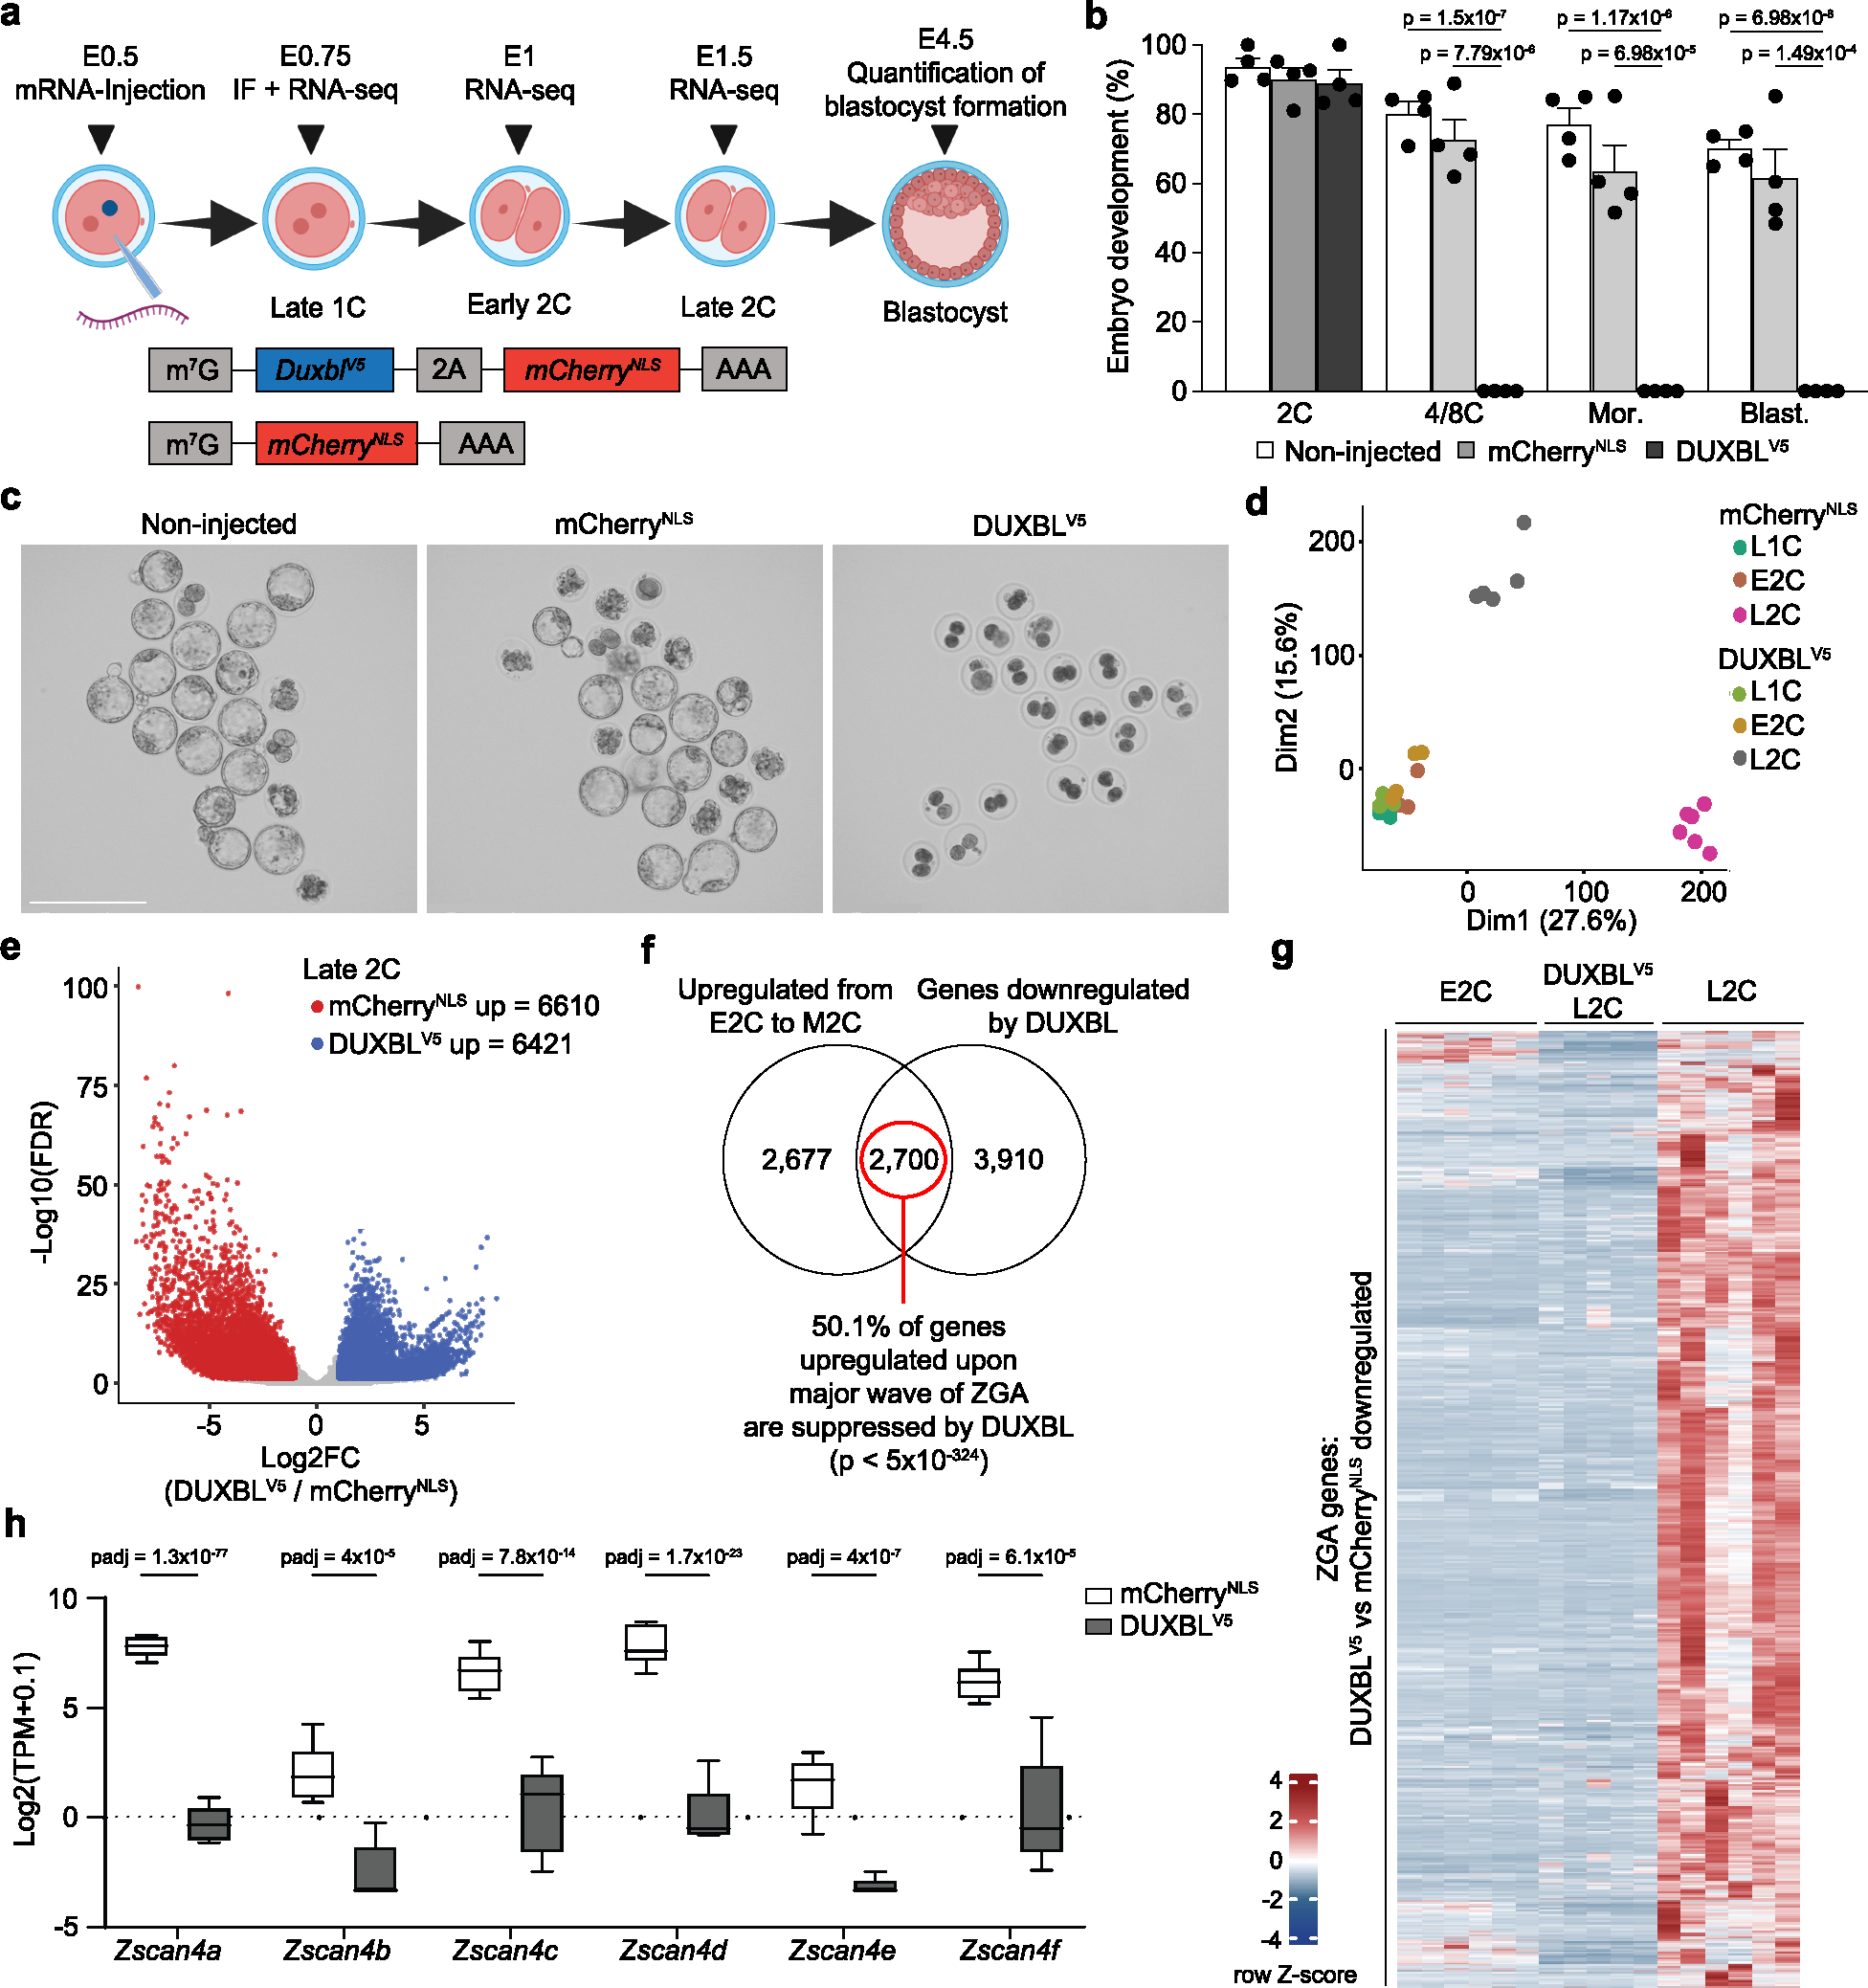
a) Schematic representation of the microinjection experiment (done with BioRender). 1C embryos (24 hours post hCG injection) were microinjected with mRNA encoding mCherryNLS or V5-tagged DUXBL plus mCherryNLS. Embryos were collected for immunofluorescence at the late 1C stage (28–30-post hCG injection), for RNAseq at late 1C, early 2C (32 hours post hCG injection) and late 2C (48 hours post hCG injection), and at late blastocyst stage (120 hours post hCG injection) to examine embryonic development. b) Bar plot showing mean±standard error of the mean (SEM) summarizing four independent experiments with 20–39 microinjected 1C embryos per group [non-microinjected, microinjected with mCherryNLS mRNA and microinjected with DUXBLV5-microinjected mRNA] per experiment. Embryos correspond to late 2C, 4C/8C, Mor (morula) and Blast (blastocyst) (48, 72, 96 and 120 hours post hCG, respectively). p values are shown from one-tailed unpaired t-tests. c) Brightfield images of the embryos at the endpoint from one representative experiment out of five from (b). Scale bars, 275 μm. d) PCA plot of RNAseq data of late 1C, early 2C and late 2C mCherryNLS- and DUXBLV5-microinjected mRNA embryos. e) Volcano plot from samples in (d) highlighting the differentially expressed genes observed by RNAseq analysis between DUXBLV5 and mCherryNLS-overexpressing embryos (red: FC≥2 DUXBL/mCherry; blue: FC≤−2 DUXBLV5/mCherry; padj<0.05). f) Venn diagram showing the overlap of genes downregulated upon precocious DUXBL overexpression with genes upregulated during the transition from early to mid 2C-stage in WT embryos. Data from26. Hypergeometric test (one-tailed Fisher’s exact) was used to calculate significance of overlap (p value<5×10−324). g) Heatmap showing the expression level of the subset of 2700 genes from (f) in the indicated samples. h) Box and whisker plot showing TPM values (log2) for the indicated genes from the Zscan4 cluster in the indicated samples. Data was obtained from the RNAseq analysis shown in (d). padj values were derived by Benjamini-Hochberg procedure. Center line indicates the median, box extends from the 25th to 75th percentiles and whiskers show Min to Max values. For (d-h) a total of 4–6 pools of 5 embryos/pool were used per embryo stage and condition.
DUXBL is required for embryos to exit from totipotency
To examine whether DUXBL is required for preimplantation development, we blocked DUXBL protein expression and followed embryonic development. To this end, we microinjected morpholino oligonucleotides (MO) targeting the expression of DUXBL proteins in 1C embryos. We observed a highly penetrant 2C-arrest in DUXBL-knockdown embryos compared to non-injected or control MO-injected embryos that developed normally into blastocysts (Fig. 4a,b). Similar results were obtained by using a second MO that targeted a distinct region and by microinjecting siRNAs targeting Duxbl in oocytes followed by in vitro maturation and fertilization (Extended data Fig. 6a–c).
Fig. 4: DUXBL is essential for mouse embryo development.
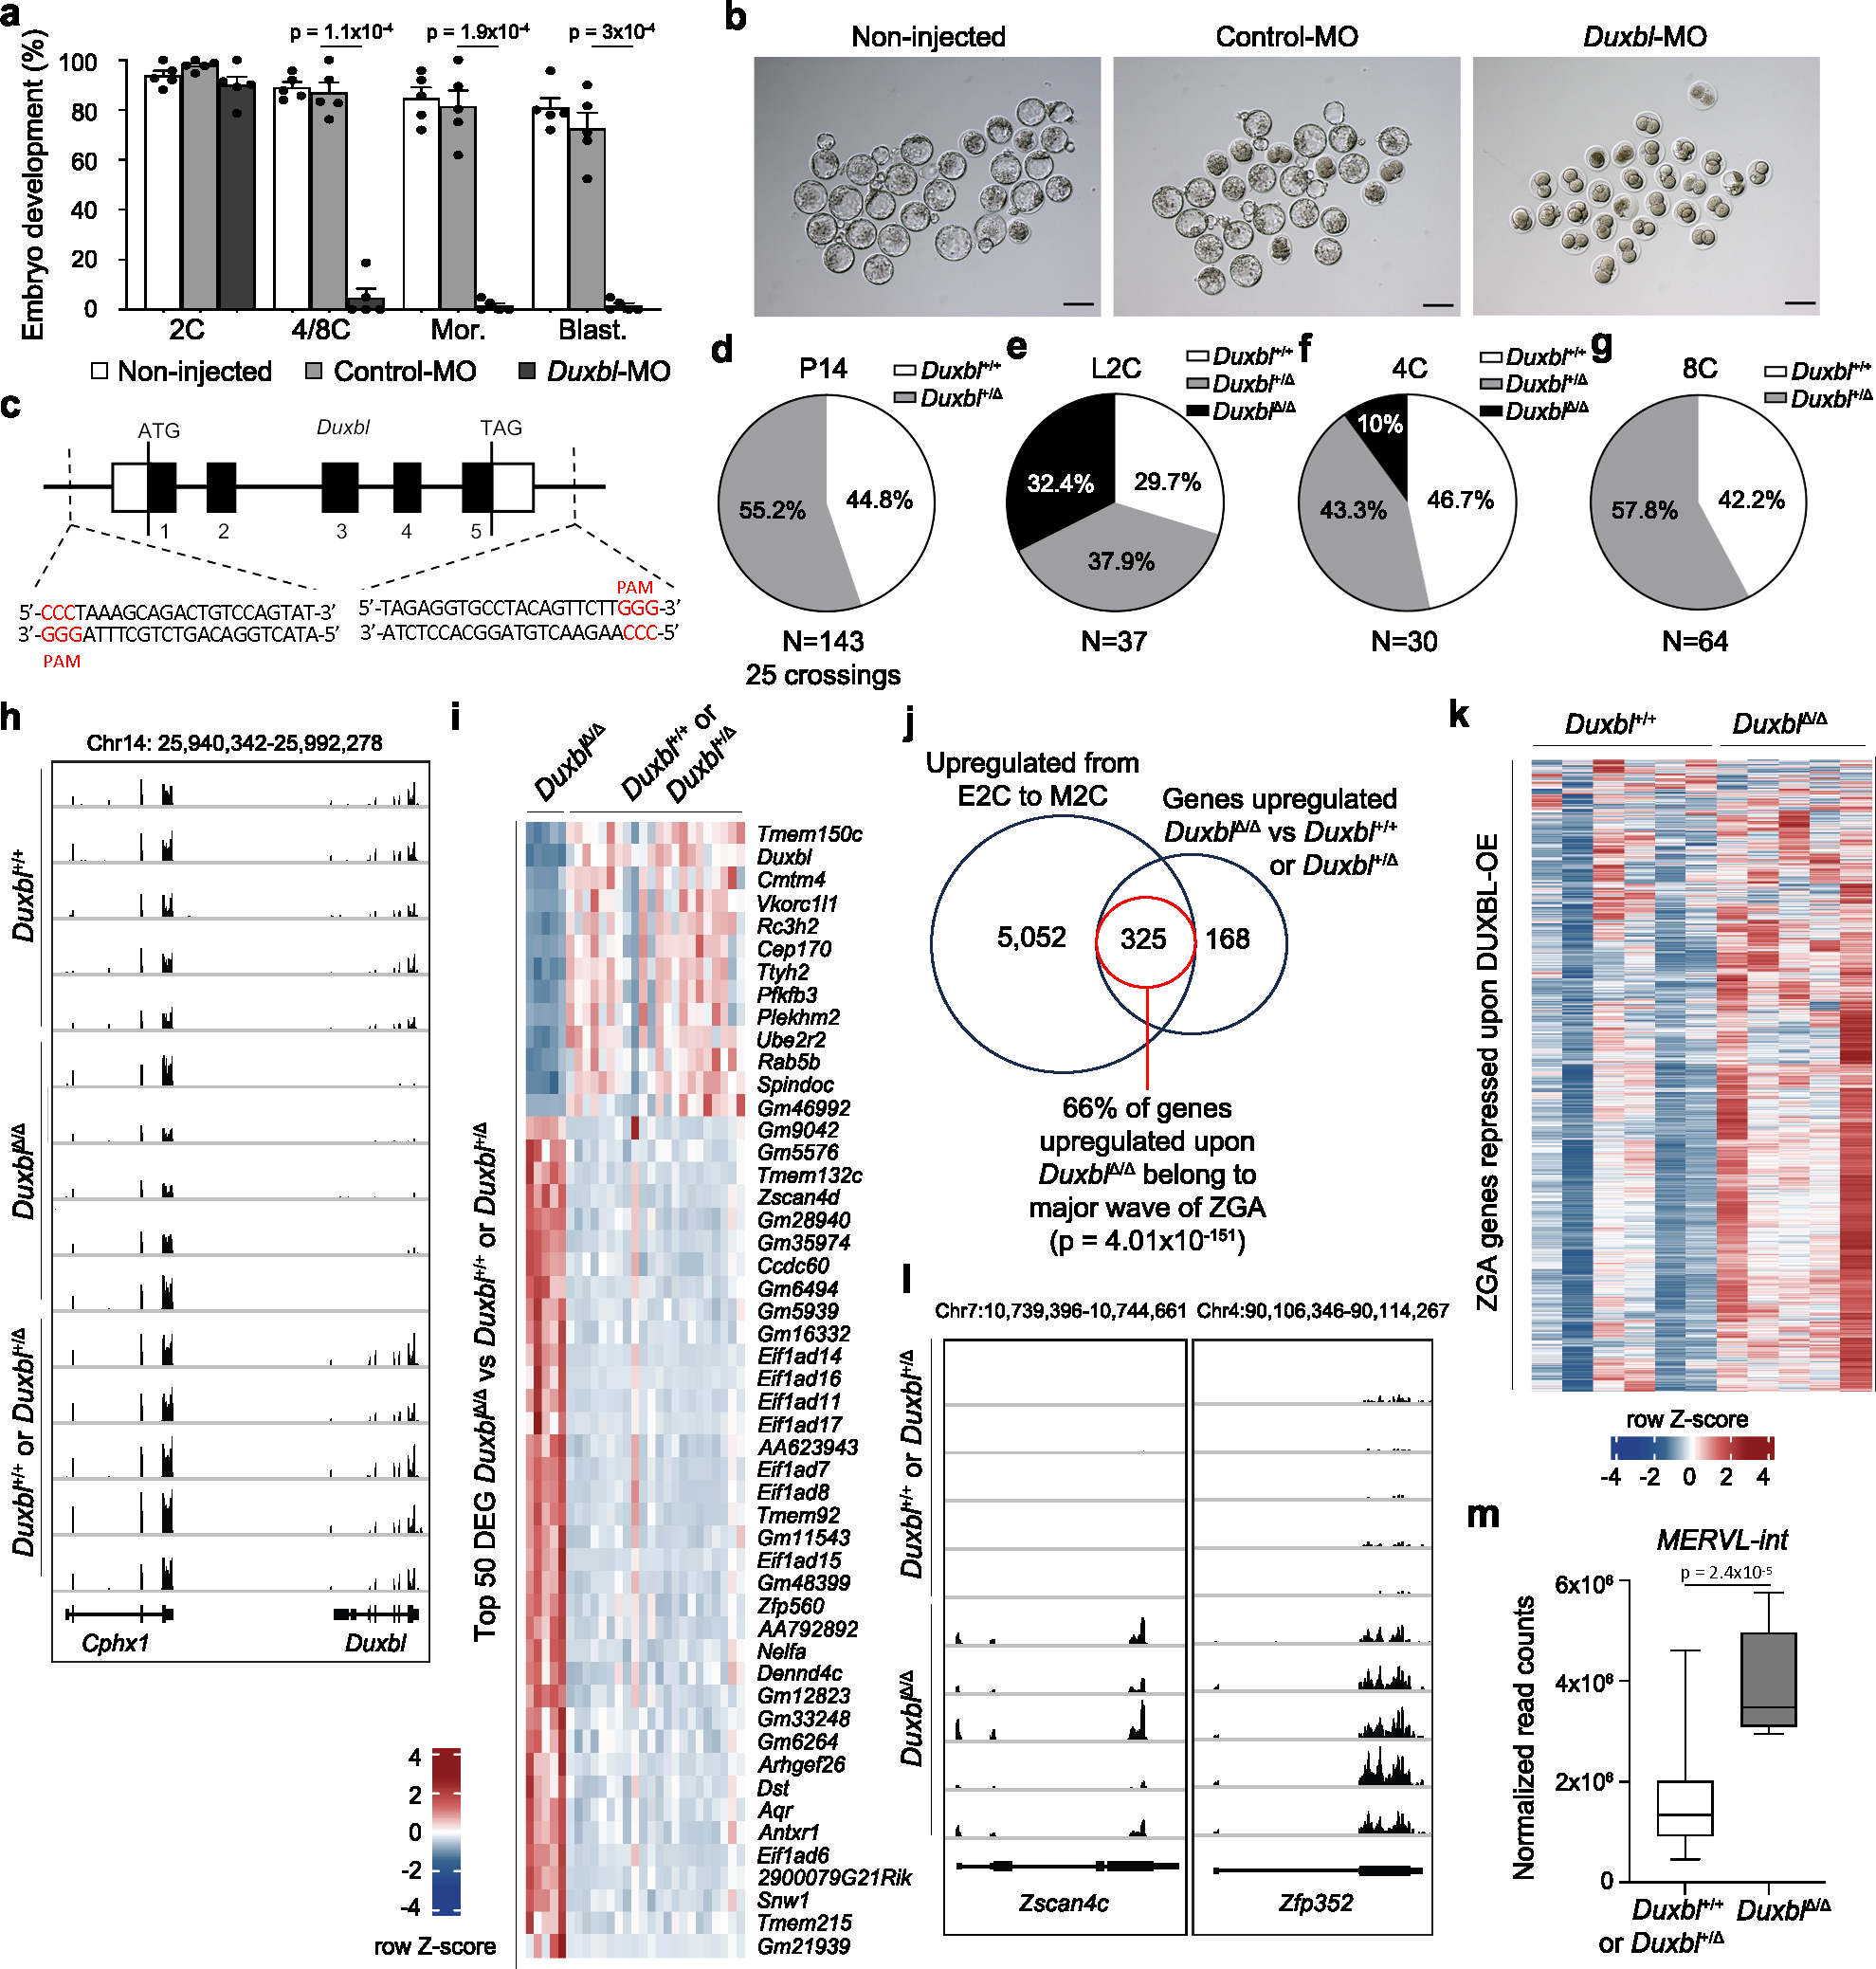
a) Bar plot showing mean±standard error of the mean (SEM) summarizing five independent experiments with 25–45 microinjected 1C embryos per group [non-microinjected, control morpholino (Control-MO), or Duxbl morpholino (Duxbl-MO)-injected embryos] per experiment. Embryos correspond to late 2C, 4C/8C, Mor (morula) and Blast (blastocyst) (48, 72, 96 and 120 hours post hCG, respectively). p values are from one-tailed unpaired t-tests. b) Brightfield images of the embryos from one representative experiment out of five from (a). Scale bar,100 μm. c) Duxbl locus and sgRNAs used for the CRISPR-based knockout strategy. d-g) Pie charts showing percentages of genotypes from Duxbl+/Δ crossings at P14 (d), late 2C (e), 4C (f) and 8C (g). h) Genome browser tracks from individual embryos showing normalized expression levels of Duxbl and Cphx in WT embryos and embryos obtained from Duxbl+/Δ crossings. i) Heatmap showing the expression level of the top 50 differentially expressed genes according to p-adj when comparing DuxblΔ/Δ and Duxbl+/Δ or Duxbl+/+ embryos. j) Overlap between genes upregulated in DuxblΔ/Δ embryos compared to Duxbl+/Δ or Duxbl+/+ embryos at late 2C and genes upregulated during the transition from early to mid 2C-stage in WT embryos (Supplementary Table 5). Data from26. Hypergeometric test (one-tailed Fisher’s exact) was used to calculate significance of overlap. k) Heatmap comparing the expression of ZGA genes repressed by DUXBL overexpression (overlap set from Fig. 3f) in WT embryos and DuxblΔ/Δ embryos. l) Genome browser tracks from individual embryos obtained from Duxbl+/Δ crossings as in (h) showing normalized expression levels of known DUX targets5. m) Box plots showing normalized read counts of MERVL-int elements in Duxbl+/+ or Duxbl+/Δ and DuxblΔ/Δ embryos. Center line indicates the median, box extends from the 25th to 75th percentiles and whiskers show Min to Max values. p value is shown from one-tailed unpaired t-test. A total of Duxbl+/+ or Duxbl+/Δ (n=22 combined) and DuxblΔ/Δ (n=5) late 2C embryos were used to generate plots from (i, j and m). For (h, k and l) a set of representative Duxbl+/+ or Duxbl+/Δ and all DuxblΔ/Δ late 2C embryos are shown.
Next, we genetically inactivated the Duxbl gene in ESC by Cas9-based editing (Fig. 4c) and generated two independent Duxbl+/Δ founders that established viable and healthy mouse lines. Importantly, we obtained three DuxblΔ/Δ mice from intercrosses between the first offspring of the male founders (Extended Data Fig. 6d). However, subsequent crossings between Duxbl+/Δ mice for more than 8 generations with 25 crossings and 143 born pups revealed that no DuxblΔ/Δ mice could be obtained (Fig. 4d). To determine when DuxblΔ/Δ embryos die, we genotyped single embryos collected from intercrosses between Duxbl+/Δ mice at the 2C, 4C and 8C embryo stage (Extended Data Fig. 6e). Mendelian inheritance ratios were obtained from embryos collected at the late 2C stage (Fig. 4e). However, the number of knockout embryos was dramatically decreased at the 4C stage as only 10% of the embryos were DuxblΔ/Δ (Fig. 4f) and no DuxblΔ/Δ embryos were obtained beyond the 4C stage (Fig. 4g).
To examine the consequences of DUXBL depletion during totipotency to pluripotency transition, we collected 27 embryos at the late 2C stage from Duxbl+/Δ intercrosses, of which five were identified as DuxblΔ/Δ, and performed single embryo RNAseq (Fig. 4h, Supplementary Table 6). Late 2C embryos from Duxbl+/+ intercrosses were also included as controls. In comparison to Duxbl+/+ or Duxbl+/Δ embryos, the majority of the strongest differentially expressed genes were upregulated in DuxblΔ/Δ embryos (Fig. 4i). Moreover, most of the upregulated genes are normally expressed during the major wave of ZGA (Fig. 4j). Furthermore, the expression of genes prevented by precocious DUXBL expression (Fig. 3f) was dramatically increased in DuxblΔ/Δ embryos compared to Duxbl+/+ embryos (Fig. 4k). Upregulated genes included DUX targets such as Zscan4c and Zfp352 as well as MERVL-int elements (Fig. 4l,m, Supplementary Table 6,7). Consistent with developmental arrest, gene set enrichment analysis revealed that cell cycle-associated genes were strongly downregulated in DuxblΔ/Δ embryos (Extended Data Fig. 6f). All together, these data demonstrate that DUXBL is necessary and sufficient for suppressing 2C-associated transcription at the late 2C stage enabling the transition toward pluripotency.
DUXBL gains chromatin accessibility to DUX targets in 2CLC
To obtain a better understanding of how DUXBL antagonizes DUX-induced transcription, we overexpressed DUXBL in ESC and performed native CUT&RUN sequencing using an antibody against DUXBL. We identified 2353 overlapping peaks between two independent DUXBL-expressing ESC lines (Supplementary Table 8). These peaks were significantly enriched for the predicted binding sequence for DUXBL (Extended Data Fig. 7a and Supplementary Table 9)30. Furthermore, over 70% of these peaks were captured by using a FLAG antibody on DOX-inducible ESC expressing a FLAG-tagged version of DUXBL (ESCDUXBL; Extended Data Fig. 7b,c and Supplementary Table 10). DUXBL bound to promoters of hundreds of genes and was particularly enriched at ESC enhancers (507/9981 enhancers) and super-enhancers (76/231 super-enhancers) (Fig. 5a–c and Extended Data Fig. 7d,e)31,32. Notably, gene ontology analysis of DUXBL-bound regions showed significant enrichment for “chromatin organization”, “cellular response to leukemia inhibitory factor” and “blastocyst development” (Extended Data Fig. 7f). We next examined the chromatin binding overlap between DUXBL and DUX as they bind a similar DNA sequence (Extended Data Fig. 7a). Interestingly, we found little overlap between DUX and DUXBL binding sites (317/2353 DUXBL peaks) and no enrichment for DUXBL binding at MERVL elements (Fig. 5d and Extended Data Fig. 7g). Indeed, DUXBL preferentially bound to genomic regions having an open chromatin configuration compared to DUX, which bound mostly inaccessible regions in ESC as determined by ATAC-seq analysis (Extended Data Fig. 7h,i)33.
Fig. 5: DUX-mediated chromatin opening facilitates DUXBL binding to DUX-bound regions.
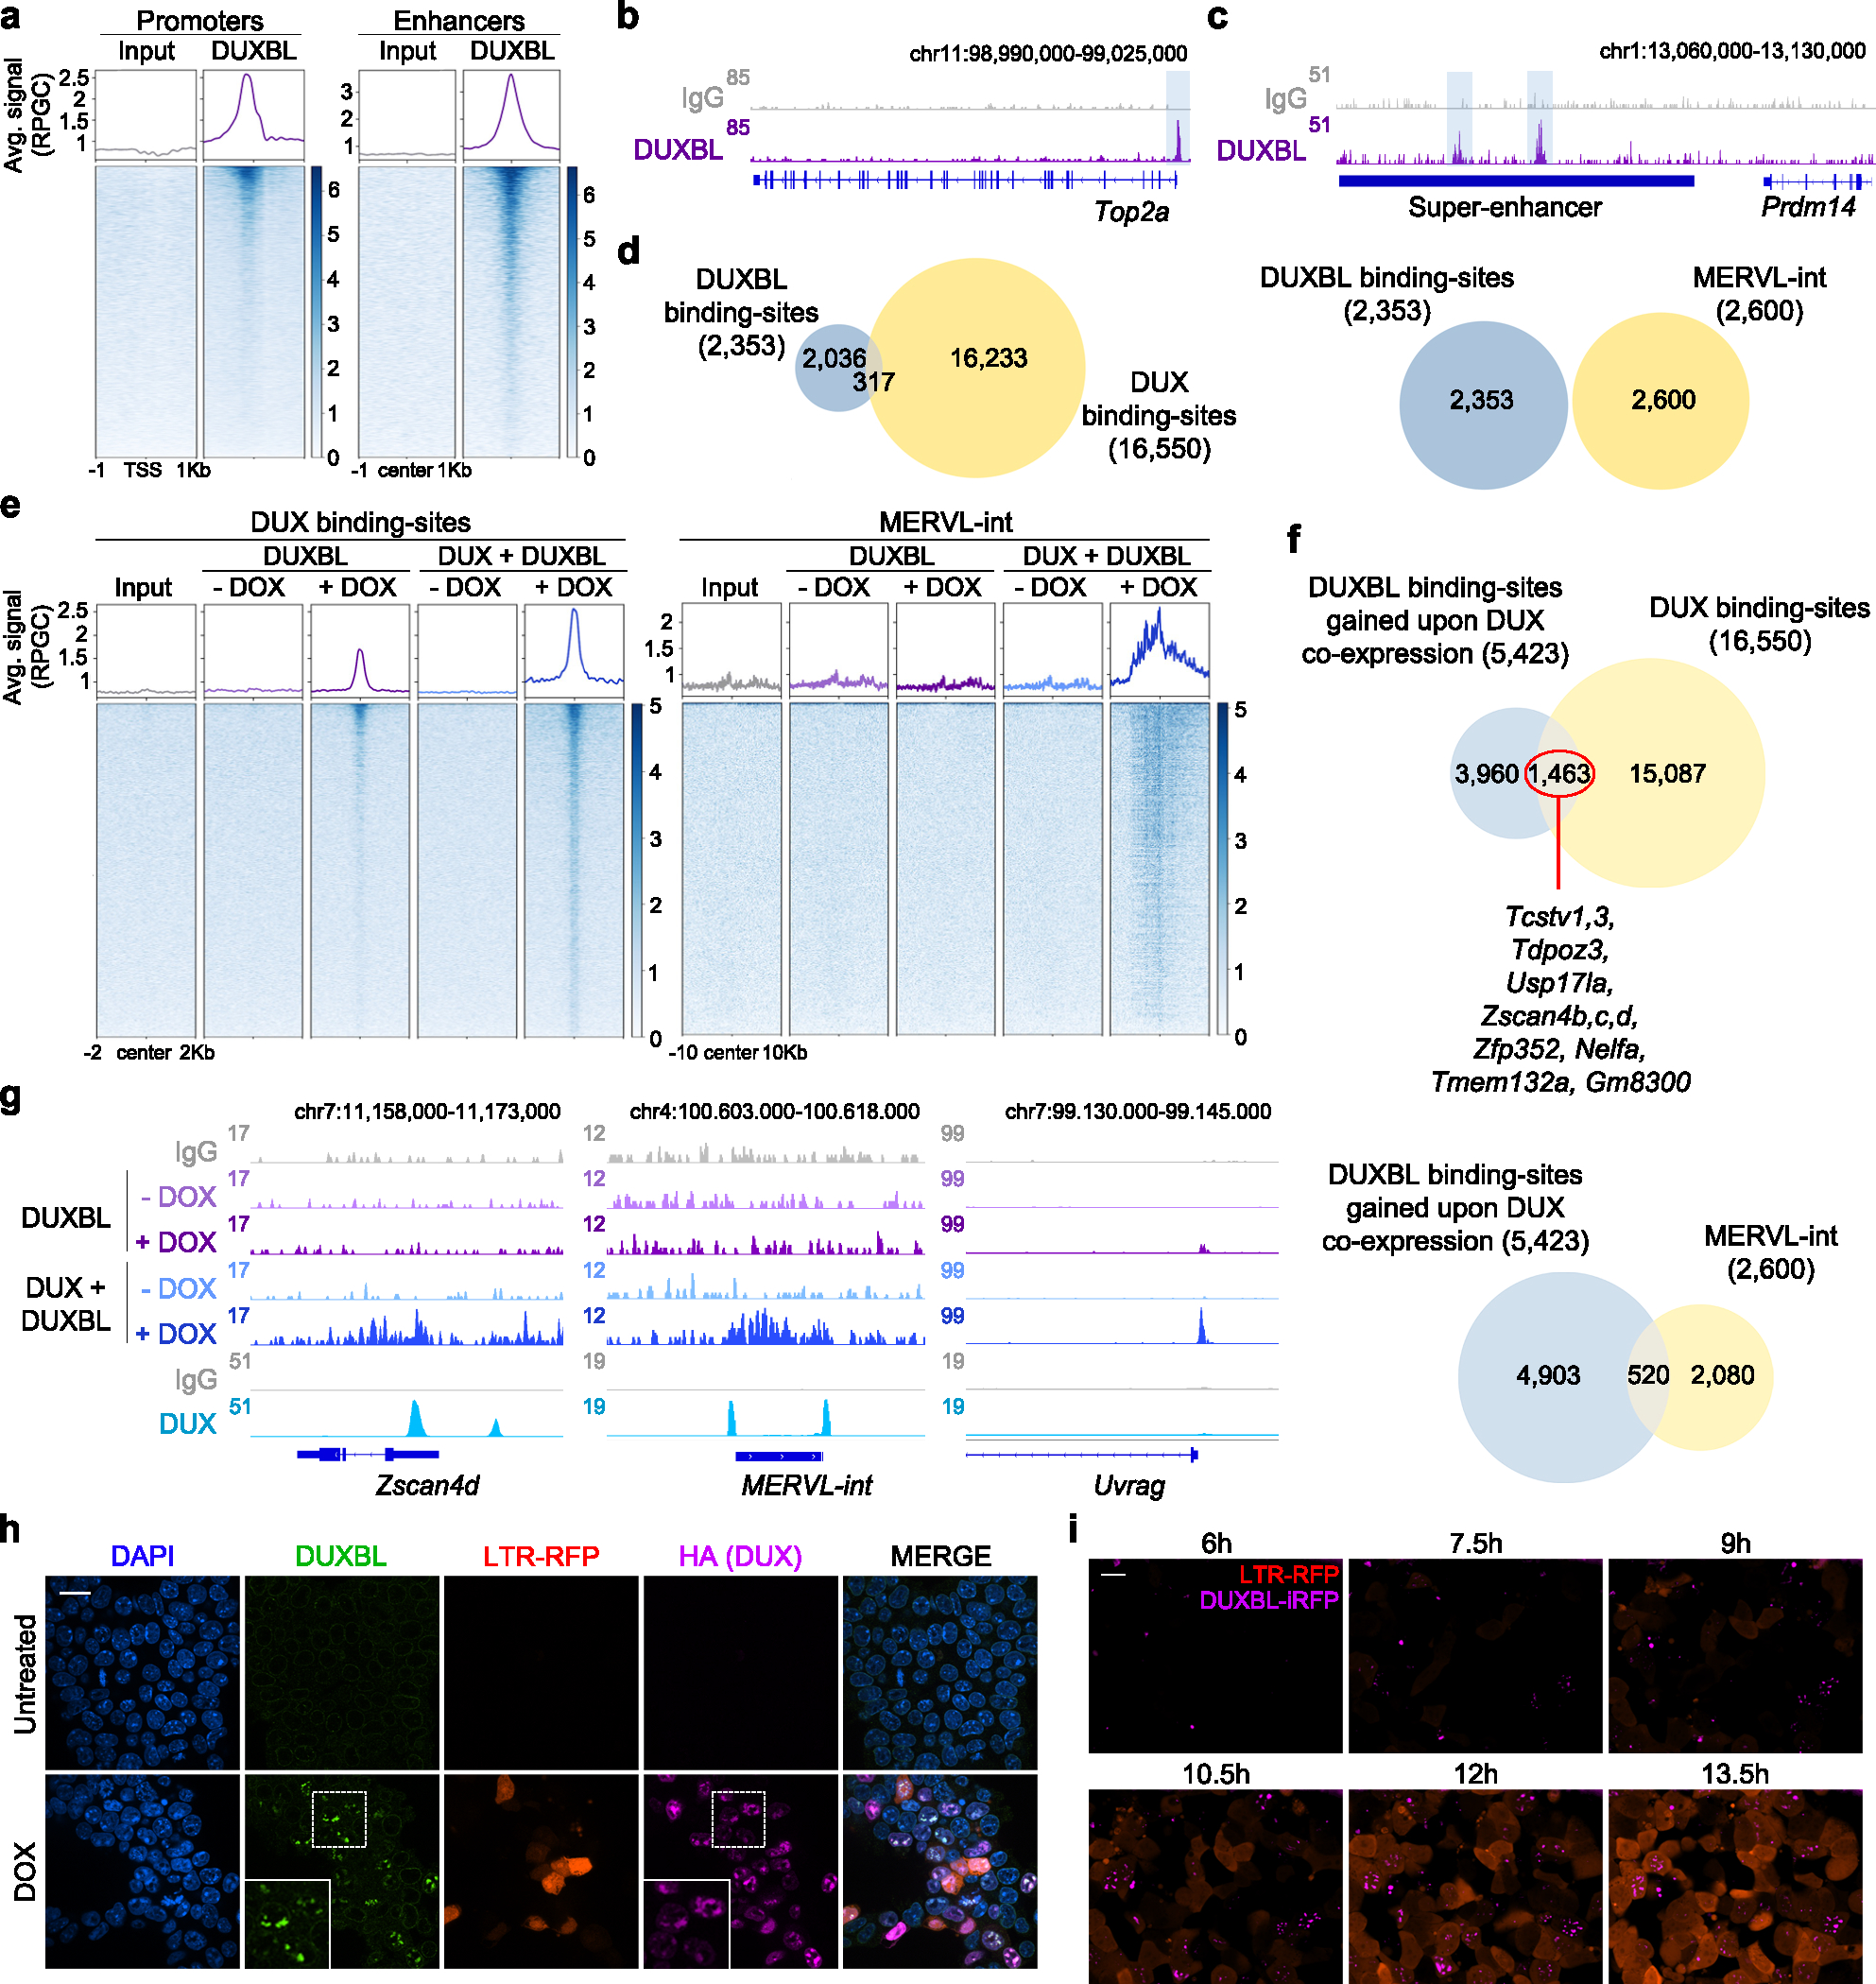
a) CUT&RUN normalized read density plot (reads per genomic content, RPGC) and corresponding heatmaps showing DUXBL enrichment at gene transcriptional start sites (TSS, left panel) and traditional ESC enhancers (right panel) in WT ESC expressing DUXBL. Input (IgG) is shown as control. Two independent ESC lines were used but data from one representative is shown. b, c) Genome browser tracks corresponding to individual samples from (a) showing DUXBL occupancy at a representative example of a gene promoter (b) or a super-enhancer (SE) (c). DUXBL binding site are highlighted. Input (IgG) is shown as control. d) Venn diagrams showing the number of DUXBL peaks overlapping with DUX-binding sites (left) and MERVL-int repeats (right). The set of DUXBL peaks was generated using data from two independent ESC lines. e) CUT&RUN read density plot (RPGC) and corresponding heatmaps showing DUXBL enrichment at the indicated genomic regions in DOX-treated WT ESC expressing DUXBL or DUX/DUXBL as shown. Input (IgG) is shown as control. Two independent experiments were performed but one representative is shown. f, Venn diagrams showing the number of DUXBL binding-sites gained upon DUX co-expression overlapping with DUX-binding sites (upper panel) and MERVL-int elements (lower panel). Representative genes in proximity to DUX-bound sites enriched for DUXBL binding are shown. g) Genome browser tracks corresponding to individual samples from (e) showing DUX (data from5) and DUXBL enrichment (our data) at the indicated genomic region with a representative example of DUXBL binding to DUX-bound regions, Zscan4d and a MERVL-int repeat, and to a DUX unbound gene, Uvrag. Input (IgG) is shown as control. h) Immunofluorescence analysis of DUX (HA) and endogenous DUXBL in LTR-RFP reporter DOX-treated ESCDUX. DAPI was used to visualize nuclei. Scale bar, 20 μm. Dashed regions are zoomed-in in the insets. i) Time lapse microscopy experiment performed in LTR-RFP reporter DOX-induced ESCDUX endogenously tagged with miRFP702 at the Duxbl locus. Time since the addition of DOX is indicated. Scale bar, 20 μm. For (h, i), two independent experiments using at least two ESC lines were performed but one representative is shown.
Based on the sequential expression of DUX followed by DUXBL during ZGA and the sequence similarities between their binding motifs, we hypothesized that DUXBL could bind to 2C-associated chromatin regions that are opened by DUX expression. Thus, we generated DOX-inducible ESC lines expressing DUXBL or DUXBL/DUX and found that DUX-bound regions showed increased accessibility to DUXBL following DUX expression (Fig. 5e–g and Extended Data Fig. 7j, Supplementary Table 11). Furthermore, DUXBL was particularly enriched at MERVL sequences in DUX-expressing ESC (520/2600 MERVL-int elements) (Fig. 5e–g). Interestingly, DUXBL peaks at DUX-bound sites were broader compared to DUXBL peaks observed in the absence of DUX (Fig. 5g). Furthermore, DUXBL co-localized with DUX in nuclear foci in DOX-induced ESCDUX (Fig. 5h, Extended Data Fig. 7k). However, this localization in nuclear foci was dependent on the expression of DUX as exogenous DUXBL showed pan-nuclear distribution in untreated cells (Extended Data Fig. 7l). We next examined the translocation dynamics of endogenous DUXBL by tagging the Duxbl locus with a fluorescent protein (iRFP702) in LTR-RFP reporter ESCDUX. Upon DUX expression, we observed DUXBL induction and nuclear foci formation early in the 2CLC conversion process (Fig. 5i and Supplementary Video 3). These data combined show that DUXBL translocates to chromatin regions specifically enriched for DUX binding.
DUXBL interacts with TRIM33 and TRIM24
We next sought to investigate the mechanism by which DUXBL regulates the 2C-associated transcriptional program. To this end, we first performed immunoprecipitation-mass spectrometry (IP-MS) analysis in untreated and DOX-treated ESCDUXBL. We detected 160 proteins enriched in the DUXBL pulldown (fold change>5 as compared with the control, p value<0.05) including DUXBL (Fig. 6a, Extended data Fig. 8a and Supplementary Table 12). We speculated that DUXBL interactors might differ when DUXBL is expressed in a 2CLC environment. Therefore, we also performed IP-MS analyses by pulling down endogenous DUXBL from untreated and DOX-treated ESCDUX and in this experimental setting detected 13 significantly enriched proteins (Extended data Fig. 8b,c and Supplementary Table 12). We identified specific interactors for each condition, suggesting context-specific protein interactions. Of note, CBP/P300 was not among the DUXBL interactors, confirming that the lack of the C-terminal domain observed in DUX precludes this interaction. We also found that DUXBL does not interact with DUX (Extended data Fig. 8d). However, we observed in both experimental conditions a consistent interaction of DUXBL with the proteins TRIM24 and TRIM33, related members of the transcriptional intermediary factor 1 of chromatin binding proteins and part of the larger tripartite-motif (TRIM) family34. Both proteins contain an N-terminal RING, B-box and coiled-coil (RBCC) domains conferring E3 ubiquitin ligase activity and a plant homeodomain finger (PHD) and a bromodomain, which read methylation and acetylation status of histone H3, respectively34. Moreover, TRIM24 contains a heterochromatin protein 1 (HP1) binding region and interacts with histone deacetylases (HDAC)34,35. We first confirmed the interaction of DUXBL with TRIM24 and TRIM33 by IP-Western blot analysis (Fig. 6b). This interaction requires the C-terminal part of DUXBL and the BCC domain of TRIM24, involved in the heterodimerization with TRIM33 (Extended Data Fig. 8e–i). In addition, although TRIM24 and TRIM33 showed pan-nuclear staining in untreated ESC, they translocated to nuclear foci upon DUX expression and co-localized with DUXBL and DUX (Fig. 6c,d and Extended Data Fig. 9a). Furthermore, the localization of TRIM24 in nuclear foci was also observed in endogenous 2CLC (Extended Data Fig. 9b).
Fig. 6: DUXBL interacts with the TRIM33/TRIM24 complex.
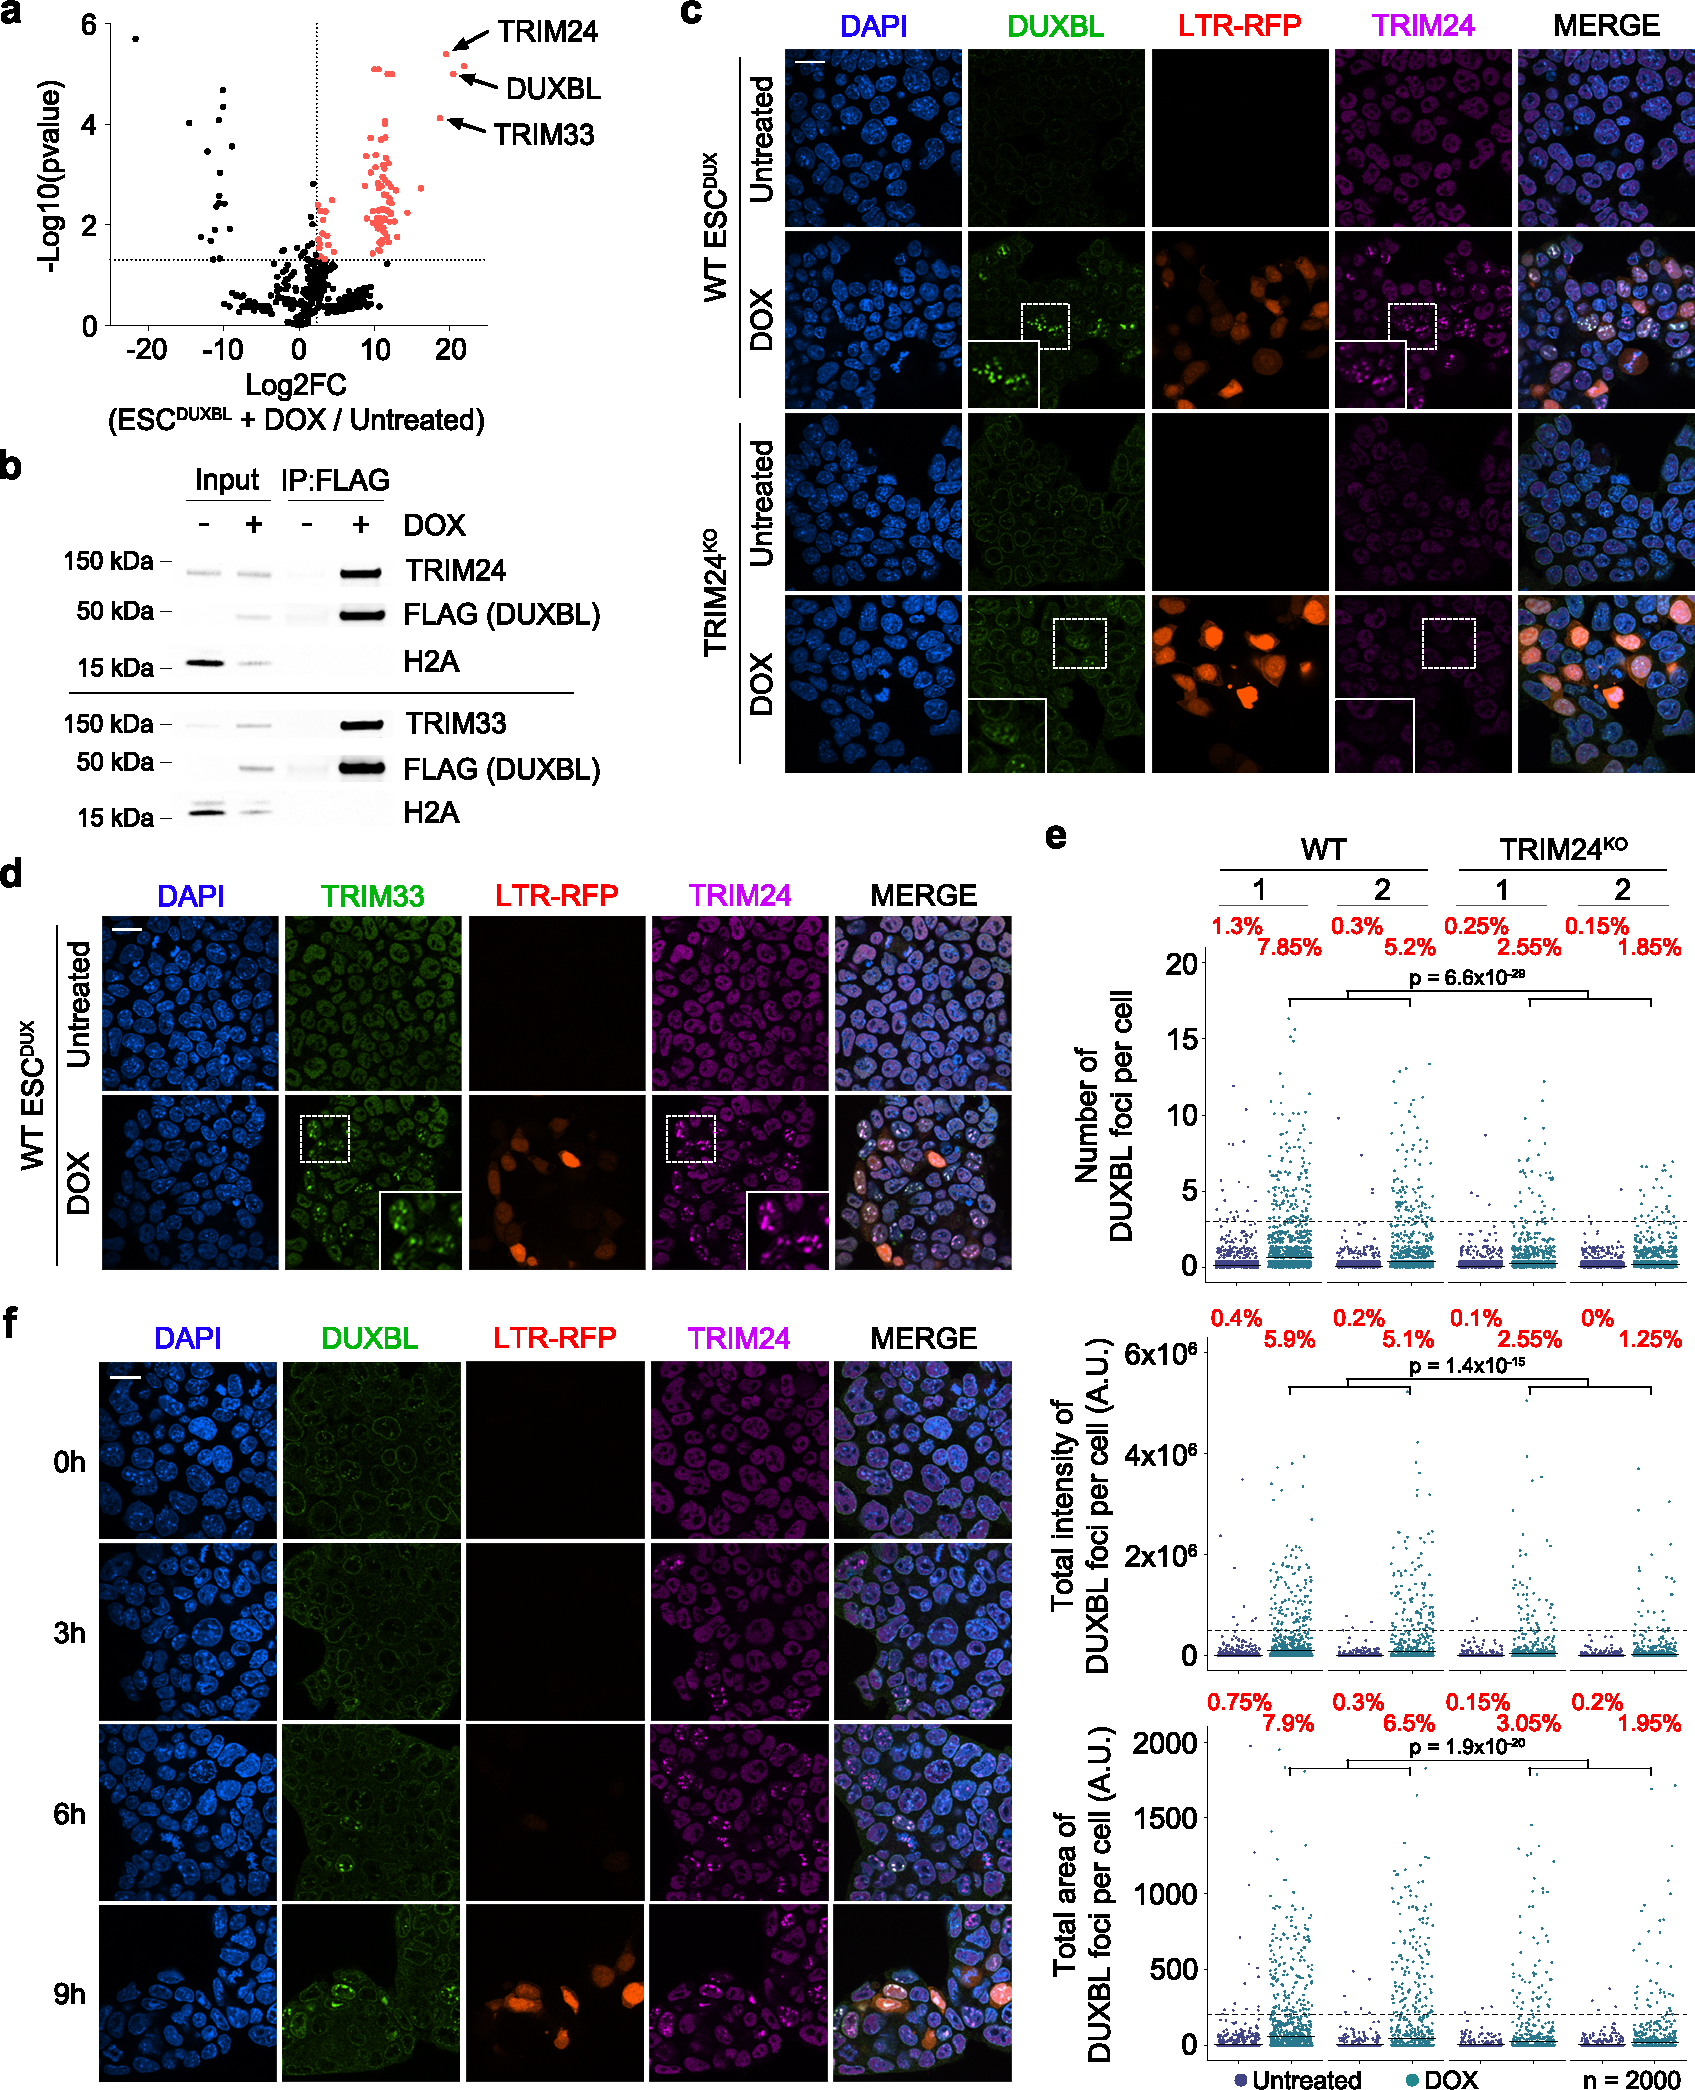
a) Volcano plot showing the enrichment of proteins immunoprecipitated from DOX-treated over untreated ESCDUXBL by using two independent ESC lines from a DUXBL IP-MS experiment. Enriched proteins in DOX-treated cells are highlighted in red. b) Western blot analysis of the indicated proteins performed with FLAG immunoprecipitates obtained from untreated or DOX-treated ESCDUXBL. Two independent experiments were performed but only one representative is shown. c) Immunofluorescence analysis of endogenous DUXBL and TRIM24 in untreated or DOX-treated LTR-RFP reporter WT or TRIM24KO ESCDUX. DAPI was used to visualize nuclei. Scale bars, 20 μm. Dashed regions are magnified in the insets. d) Immunofluorescence analysis of endogenous TRIM33 and TRIM24 in untreated or DOX-treated LTR-RFP reporter ESCDUX. DAPI was used to visualize nuclei. Scale bars, 20 μm. Dashed regions are magnified in the insets. e) High-throughput imaging quantification of the number of DUXBL foci per cell (upper panel), the total intensity of DUXBL foci per cell (middle panel) and the total area of DUXBL foci per cell (lower panel) in untreated or DOX-treated LTR-RFP reporter WT or TRIM24KO ESCDUX. Center lines indicate mean values. n=2000; Percentages above the threshold (dotted line) are indicated. Relevant p values are shown from one-tailed unpaired t-tests. f) Immunofluorescence analysis of endogenous DUXBL and TRIM24 at different timepoints in untreated or DOX-treated WT ESCDUX. Time since the addition of DOX is indicated. DAPI was used to visualize nuclei. Scale bar, 20 μm. Three independent experiments using at least two WT and TRIM24KO ESCDUX clones (c, e) or two ESCDUX clones (d, f) were performed but one representative experiment is shown.
To test whether DUXBL is necessary to promote TRIM24/TRIM33 recruitment, we examined the formation of TRIM24 nuclear foci in untreated and DOX-treated DUXBLKO ESCDUX and observed no differences in the number of foci compared to WT ESC (Extended Data Fig. 9c). We then generated TRIM24KO and TRIM33KO ESCDUX (Extended Data Fig. 9d,e) and determined their ability to generate DUXBL nuclear foci upon DUX expression. We observed a reduction in DUXBL recruitment to foci in Trim24-knockout ESCDUX but not in Trim33-knockout ESCDUX suggesting that TRIM24 facilitates the recruitment of DUXBL to nuclear foci (Fig. 6c,e and Extended Data Fig. 9f). In support of these observations, Trim24-knockout ESC showed extended residency time in the 2CLC state after conversion (Extended Data Fig. 9g). Interestingly, TRIM24 and DUXBL combined deficiency further extended the 2CLC residency time suggesting they might also perform independent functions in regulating the 2CLC state (Extended Data Fig. 9h–j). Furthermore, TRIM24 was quickly recruited within a few hours after DUX induction and was then followed by DUXBL translocation (Fig. 6f). Importantly, TRIM24 and TRIM33 expression coincide with DUXBL expression in the 2C-stage embryo (Supplementary Fig. 2). Interestingly, Trim24- and Trim33-knockout ESCDUX did not show major changes in the levels of 2C-associated genes and MERVL expression suggesting functional compensation between them (Supplementary Fig. 3 and Supplementary Table 13). Finally, we examined whether the interaction between DUXBL and the TRIM24/33 complex is required to impair DUX-induced transcription. Overexpression of a DUXBL mutant containing only the two homeodomains (DUXBLHD1/HD2), which does not interact with the TRIM24/33 complex, decreased 2C-like conversion similar to full length DUXBL (Supplementary Fig. 4). Altogether, these results show that DUXBL is recruited along with the repressor complex TRIM24/TRIM33 to DUX-bound regions although this interaction is not required to impair DUX-induced transcription.
DUXBL/TRIM24/TRIM33 complex co-localizes with H3K9me3
We next asked whether the presence of DUX at the nuclear foci is required to maintain these foci. Thus, we generated DOX-inducible ESC lines expressing a FKBP-tagged DUX protein that is degraded when exposed to dTAG compounds (ESCDUX-FKBP; Extended data Fig. 10a)36. DUX-expressing cells showed consistent enrichment of DUX/DUXBL/TRIM24 at nuclear foci on LTR-RFP positive ESC. However, dTAG treatment of DOX-induced cells led to the dissolution of the nuclear foci with the consequent release of DUXBL and TRIM24 (Extended data Fig. 10b–d), demonstrating that DUX is necessary and sufficient to initiate and maintain DUX-induced nuclear foci, and its loss dictates their dissolution.
TRIM24 and TRIM33 physically interact with each other and are found complexed with the histone deacetylases HDAC1 and HDAC2, HP1 proteins and, to a lesser extent, TRIM2834,35. Importantly, ESC either deficient for HP1 or TRIM28 or that are treated with HDAC inhibitors show increased 2CLC conversion37–39. We found that HDAC1 and HP1 proteins were enriched on DUXBL/TRIM24/TRIM33 nuclear foci upon DUX expression (Fig. 7a,b, Extended data Fig. 10e,f) suggesting these regions might be undergoing H3K9me3 deposition and heterochromatin formation. Intriguingly, we observed increasing accumulation of H3K9me3 deposition on DUX-induced nuclear foci concurrent with TRIM24 recruitment following DUX expression (Fig. 7c,d, Extended data Fig. 10g). Consistent with this, DUXBL-enriched chromatin regions identified in DUX-induced ESCDUX showed a sharp H3K9me3 enrichment in vivo during the 2C to 4C embryo transition, especially at MERVL elements (Fig. 7e,f)40. These data revealed that DUX-induced nuclear foci undergo a progressive heterochromatinization following the accumulation of DUXBL and TRIM33/TRIM24.
Fig. 7: DUXBL and TRIM24/TRIM33 co-localize with H3K9me3 deposition.
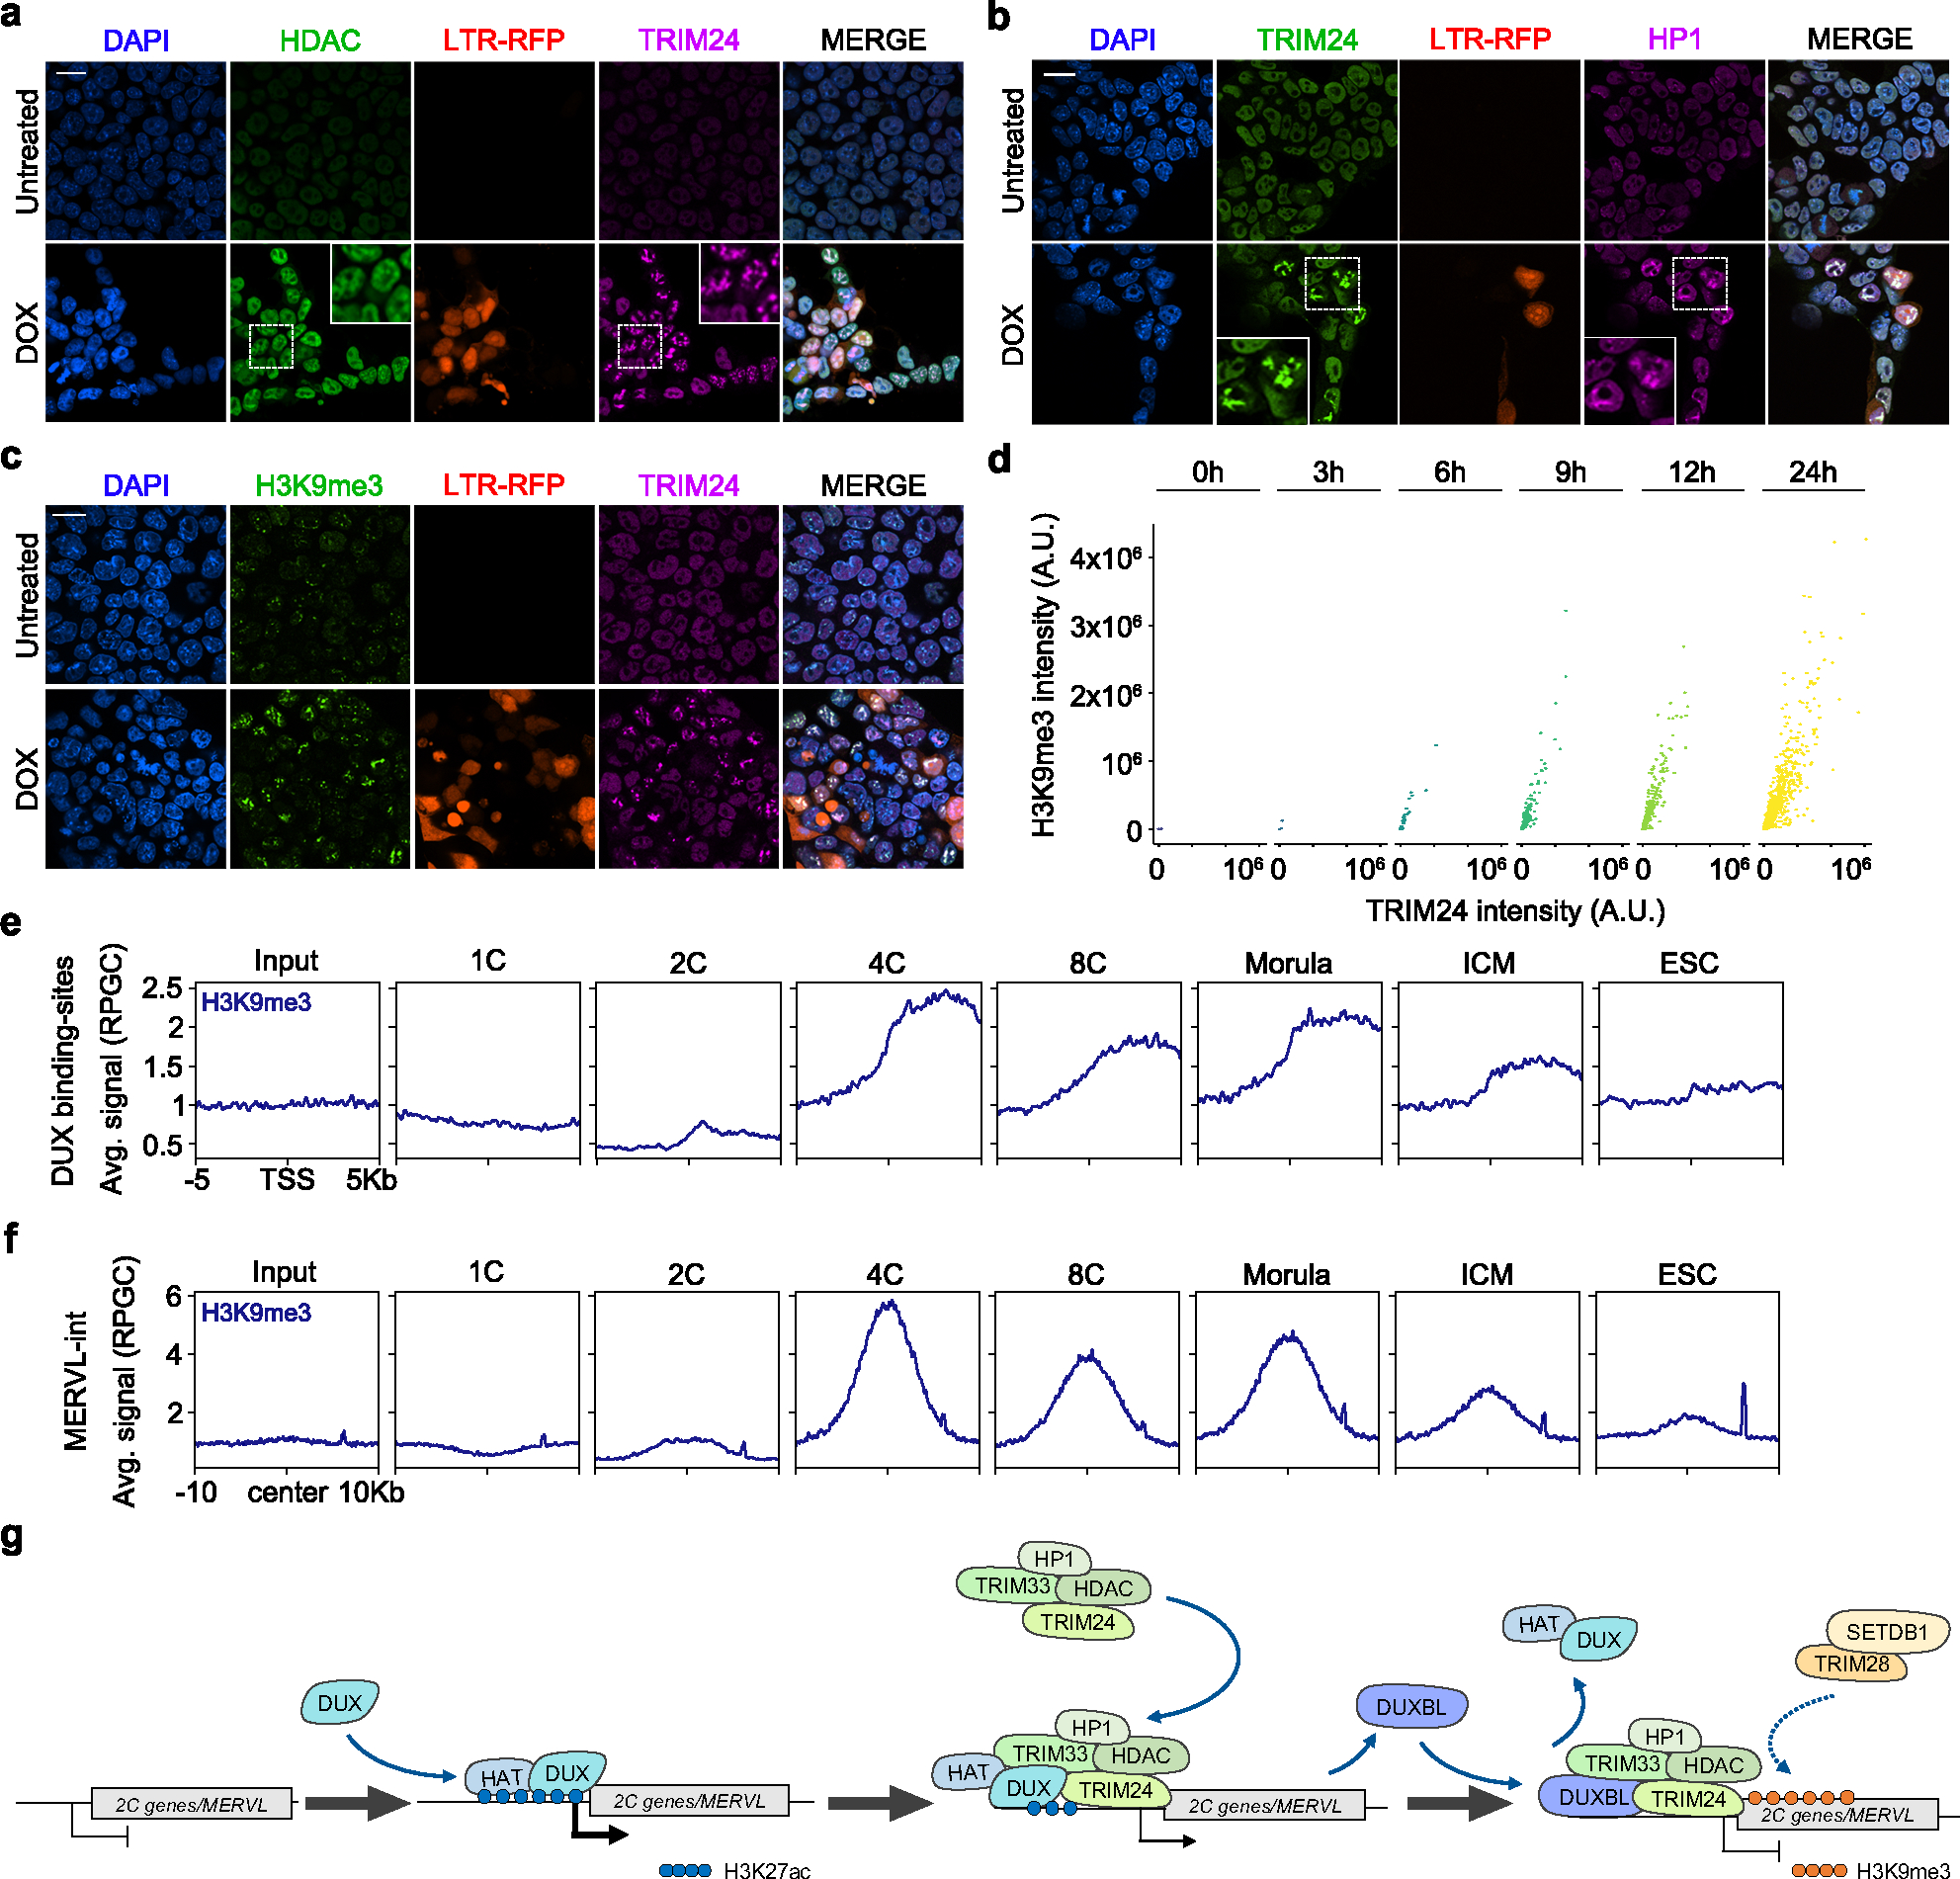
a, b) Immunofluorescence analysis of HDAC (a) and HP1 (b) in untreated or DOX-treated LTR-RFP reporter ESCDUX. DAPI was used to visualize nuclei. Scale bars, 20 μm. Dashed regions are magnified in the insets. c) Immunofluorescence analysis of H3K9me3 in untreated or DOX-treated LTR-RFP reporter ESCDUX. DAPI was used to visualize nuclei. Scale bars, 20 μm. d) Graphs showing TRIM24 and H3K9me3 fluorescence intensity at TRIM24-foci at different times after the addition of DOX in ESCDUX. e, f) ChIPseq read density plot (RPGC) showing H3K9me3 enrichment at DUX-bound sites (e) and MERVL (f) elements occupied by DUXBL after DUX expression during embryonic development. Input (IgG) is shown as reference control. ChIP-seq data obtained from40. g) Schematic representation of the model showing the role of DUXBL facilitating the silencing of DUX-induced transcription. TRIM24/TRIM33 interact with TRIM28 which by recruiting SETDB1 could mediate H3K9me3 deposition. At least two independent experiments using two ESCDUX clones (a-d) were performed but one representative experiment is shown.
DISCUSSION
Upon exit from totipotency and transition to the 4C-embryo stage, the 2C-associated transcriptional program needs to be quickly and efficiently decommissioned to allow development to proceed. Our work suggests a model where DUX-mediated transcriptional activation promotes the expression of DUXBL and its recruitment to DUX-bound regions to facilitate gene and MERVL silencing. We show that DUX induction of the Duxbl gene leads to two different DUXBL protein forms, expressed at similar levels in vivo. Interestingly, alternative protein isoforms during preimplantation development allows for the expansion of new protein functions needed during development41. Further work will be necessary to dissect the precise role of each DUXBL isoform.
During ZGA, MERVL elements undergo extensive demethylation, allowing LTRs to act as alternative promoters of 2C-associated protein-coding genes8. Recent results have unveiled an epigenetic switch from DNA methylation to H3K9me3 deposition to regulate retrotransposon expression including MERVL elements40,42. Interestingly, DUX may contribute to the establishment of H3K9me3 regions as Dux-deficient embryos showed a significant reduction of H3K9me3 deposition42. Our data show that DUX-induced chromatin opening and MERVL activation in ESC leads to the formation of DUX-associated nuclear foci and the recruitment of the TRIM24/TRIM33/DUXBL complex (Fig. 7g). Indeed, ERV derepression in ESC leads to the formation of transcriptional condensates associated with transcribing ERV loci43. At these foci, we propose that DUXBL functions as a DUX-dependent dominant negative that competes with DUX for the same binding sites (Fig. 7g). Indeed, although DUXBL only has access to DUX-bound regions in the presence of DUX, overexpression of DUXBL or DUXBLHD1/HD2 is sufficient to overcome the proper activation of the 2C-transcriptional program. In addition to the eviction of DUX and associated HATs from chromatin mediated by DUXBL competition, translocation of the TRIM24/TRIM33 complex could further recruit HDAC proteins and HP1, promoting heterochromatin formation (Fig. 7g). Furthermore, the interaction of TRIM24/TRIM33 with TRIM28 might facilitate the recruitment of the H3K9me3 methyltransferase SETDB135,38 (Fig. 7g). In fact, SETDB1 is a barrier for 2CLC conversion by depositing H3K9me3 at 2C-associated genes44. Our data suggest a model where DUXBL and the TRIM24/33 complex participate cooperatively in the silencing of the 2C-associated transcriptional program but still could perform independent functions. In summary, H3K9me3 establishment and silencing of the 2C-associated program seems facilitated by an elegant negative feedback loop following DUX expression, suggesting that a decreased activation of the 2C transcriptional program results in defective establishment of silencing signals.
We show that DUXBL is required for totipotency exit. DUXBL-deficient embryos do not progress beyond the 4C-embryo stage and show defective silencing of 2C-transcripts. We demonstrate the relevance of DUXBL in this silencing by showing that precocious expression of DUXBL in 1C embryos led to impaired activation of ZGA-associated transcripts, preventing further development. It is remarkable that DUXBL is essential to suppress 2C-transcripts considering that ZGA is secured by multiple factors based on the finding that Dux-deficient mice are viable45,46. Interestingly, expression of OBOX4, a transcription factor that secures ZGA in the absence of DUX47, is upregulated in DuxblΔ/Δ embryos (Supplementary Table 4). Furthermore, additional members of the OBOX family regulate ZGA, including MERVL elements, in parallel to DUX48. Future studies will determine whether and to what extent DUXBL could also interfere with OBOX-dependent gene expression.
Finally, the Duxbl gene is only found in the mouse and rat genomes raising the question of whether related genes present in other mammals could serve a similar function during embryonic development. DUXB, a gene found in eutherian mammals, has been proposed as a DUXBL paralog as they both share a similar gene structure, high homeodomain identity and are contained in a syntenic genomic region22. Nevertheless, we cannot exclude the possibility that other members of the DUX family, including DUXA or DUXC, could also perform some functions mediated by DUXBL in different species. In summary, our study demonstrates the unique role of DUXBL in securing normal developmental competence during the transition from totipotency to pluripotency.
METHODS
Mice
All mouse breeding and experimentation followed protocols approved by the National Institutes of Health Institutional Animal Care & Use Committee (ACUC, protocol 07–37) Guideline for Breeding and Weaning and according to the regulations issued by the Committee for Animal Rights Protection of the State of Hessen (Regierungspraesidium Darmstadt). Mice were maintained in a dark/light cycle of 12 hours each in a temperature range of 68°-76°F and a range of 30–70% humidity. For generating DuxblΔ/+ mice, two sgRNA sequences were selected through CRISPICK (https://portals.broadinstitute.org/gpp/public/analysis-tools/sgrna-design) and corresponding oligos (Sigma-Aldrich) were inserted into px458 (Gift from Feng Zhang, 48138, Addgene) according to protocol (https://media.addgene.org/cms/filer_public/3e/e1/3ee1ce9c-99f9-4074-9a28-109d34971471/zhang-lab-sam-cloning-protocol.pdf; Supplementary Table 14). The two constructed CRISPR/Cas9 vectors were then electroporated into SV129/C57BL6 E14 mouse ESC and selected via FACS two days after transfection. Genotyping was performed via PCR using primers listed in Supplementary Table 14. Two independent founder lines were generated by microinjection of heterozygous DuxblΔ/+ ES cells isolated from two independent colonies into blastocysts from wildtype C57BL6/J mice (The Jackson Laboratory, Bar Harbor, ME). Interestingly, we obtained three DuxblΔ/Δ mice from intercrosses between the first offspring of the male founders. It is possible that the genetic background of the founder (129 ES cells) animals allowed for the generation of these three DuxblΔ/Δ male animals. It is important to mention, that i) these DuxblΔ/Δ mice appeared only in the F1 generation and never again thereafter and ii) they were not fertile. Duxbl+/Δ mice were backcrossed to a C57BL/6 background, and these mice never gave rise to DuxblΔ/Δ mice. Except for infertility, the three DuxblΔ/Δ males did not display any gross abnormalities and aged normally.
One-cell and two-cell embryo collection
Three to twelve-week-old NSA (CF-1) (Envigo, Indianapolis, IN) or C57BL6/J (Jackson Laboratory, Bar Harbor, ME) female mice were injected intraperitoneally with 7.5–10 IU eCG, followed 48 h later by 7.5–10 IU hCG and mating to B6SJLF1/J or C57BL6/J males (Jackson Laboratory, Bar Harbor, ME). Females were sacrificed, and 1-cell (1C) or 2-cell (2C) embryos were flushed from the oviducts of superovulated females 20 and 48 hours post-hCG, respectively. The collection medium was MEM, HEPES (Thermo Fisher Scientific, 12360038) supplemented with 0.1% PVA (MEM/PVA). Cumulus cells were removed from 1C embryos by treatment with 1 mg/ml hyaluronidase in MEM/PVA. One- and two-cell embryos were transferred to KSOM (Millipore-Sigma, MR-106-D) at 37°C in an atmosphere of 5% CO2, 5% O2 and 90% N2 until microinjection. Two-cell embryos were also collected as above, snap frozen in 50 mM Tris pH 8, 8 M Urea (Sigma) and 1% Chaps (Millipore) and stored at −80°C for immunoblot.
Oocyte and 1-cell embryo microinjection
For knockdown experiments, microinjections in oocyte and 1C embryo were performed using a Femtojet injector and TransferMan 4r micromanipulators (Eppendorf, Enfield, CT) on a Leica DMI 6000B inverted microscope. Oocytes/embryos were injected in the cytoplasm with 5–10 pl of morpholino oligonucleotides (MO) or siRNAs. Morpholinos were injected at 1 mM concentration; siRNAs were injected at 50 μM concentration. The following MO were used: Duxbl-MO: 5’-ATCCCAAGAGGCCCAAGAGAGCTGT-3’, Duxbl-MO2: 5’-TAGAGCCCAGAGTGGCCCACCCATT-3’; standard control-MO: 5’-CCTCTTACCTCAGTTACAATTTATA-3’. The following siRNAs were used: Duxbl Silencer Select Pre-designed siRNA ID# s114932, Silencer Select Negative Control No. 1 (Thermo Fisher, Waltham, MA). Following microinjection, oocytes were put in the incubator in MEMα containing 5% FBS and 2.5 μM milrinone for 3–4 h and then in vitro matured for 16 h in MEMα + FBS. Embryos were placed back in the incubator and cultured for 4 days in KSOM in a humidified atmosphere of 5% CO2, 5%O2 and 90% N2. For siRNA experiments, we decided to perform the microinjections in oocytes, let them mature and fertilized them in vitro to achieve a more efficient degradation of DUXBL before it is required at the 2C-embryo stage.
Microinjection of mRNAs was also performed by using a FemtoJet® 4i (Eppendorf, 5252000013). mRNAs were injected into 1C or both blastomeres of late 2C-stage embryos 24 h or 48 h post hCG injection, respectively. 15–25 embryos per condition were microinjected with 200 ng/μl of Duxbl-V5–2A-mCherryNLS or 400 ng/μl of mCherryNLS. 6 hours post microinjection, expression of mCherryNLS was examined by live cell imaging and nuclear localization of Duxbl-V5 was assessed by immunostaining followed by confocal microscopy.
Oocyte collection
Germinal vesicle-intact (GV) oocytes were collected from 6–12-week-old female CF-1 mice 44–48 h after injection with 7.5 IU eCG. Females were sacrificed, ovaries were placed in MEM/PVA containing 2.5 μM milrinone, and antral follicles were obtained by poking with 27G needles. Cumulus-enclosed oocytes were collected, and cumulus cells were removed by pipetting up and down through a narrow bore capillary. Oocytes were placed in MEMα (Thermo Fisher, 32561037) containing 5% fetal bovine serum (FBS) and 2.5 μM milrinone at 37°C in a humidified atmosphere of 5% CO2 until microinjection. Oocyte maturation and in vitro fertilization were performed as previously described49.
Cell culture
Wild-type (R1, G4, E14) ESC, ESCDUX and ESCCTCF-AID (ID: EN52.9.1) were grown on 0.1% gelatin-coated plates or alternatively on a feeder layer of growth-arrested MEFs in high-glucose DMEM (Gibco) supplemented with 15% FBS, 1:500 LIF (made in house), 0.1 mM non-essential amino acids, 1% glutamax, 1mM Sodium Pyruvate, 55 mM β-mercaptoethanol, and 1% penicillin/streptomycin (all from ThermoFisher Scientific) at 37°C and 5% CO2. Occasionally, 1 μM PD 0325901 (Sigma-Aldrich, PZ0162) and 3 μM CHIR99021 (Sigma-Aldrich, SML1046) was added to the media. Cells were routinely passaged with Trypsin 0.05% (Gibco). Media was changed every other day and passaged every 2–3 days. R1, G4 and KH2 (ESCDUX) ESC were a gift from Dr. Sagrario Ortega, Transgenic mouse Unit, CNIO, Madrid, Spain), E14 and EN52.9.1 ESC were a gift from Dr. Benoit Bruneau and Dr. Elphege Nora (Gladstone Institute of Cardiovascular Disease, San Francisco, USA). HEK293T (a gift from Dr. Inder Verma, SALK Institute, San Diego, CA, USA) cells were grown in DMEM, 10% FBS, and 1% penicillin/streptomycin. Generation of infective lentiviral particles and ESC infections were performed as described20. None of the cell lines used in this manuscript are listed in the ICLAC Database of Cross-contaminated or Misidentified Cell Lines.
To overexpress DUX and DUXBL transiently in ESC, cultures cells were transfected with 1μg of the corresponding plasmids using Lipofectamine 3000 (ThermoFisher, L3000015) per million of ESC according to manufacturer’s instructions.
To generate DUXBL, TRIM24 and TRIM33 knockout ESC lines, we independently infected a suspension of ESC with lentiviral supernatants, generated by using LentiCRISPRv2 (gift from Feng Zhang, 52961, Addgene), encoding sgRNAs designed to target the corresponding protein (Supplementary Table 14 for sgRNA sequences).
To generate DOX-inducible DUXBL ESC lines, co-expressing wild-type and/or the corresponding mutant forms of DUXBL and TRIM24 ESC lines as well as ESCDUX-FKBP or ESCDUX−2XHA lines, the corresponding sequences were PCR amplified from cDNA or synthetic gene fragments obtained from IDT or Twist Biosciences including a 3XFLAG or an HA tag and subcloned by Gibson assembly into the plasmid PB-TRE-dCas9-VPR (Gift from George Church, 63800, Addgene), after removing the dCas9-VPR insert. DOX-inducible PiggyBac plasmids together with a plasmid encoding for a supertransposase were co-transfected in ESC using jetPRIME (PolyPlus transfection) and further selected with Hygromycin (200ug/ml) and/or Puromycin (1ug/ml) for one week. (Supplementary Table 14). To induce degradation of the DUX-FKBP, ESCDUX-FKBP lines were treated with a combination of 500 nM dTAGv and dTAG13.
To generate DUXBL-BR1, BR2 and BR3 ESCDUX reporter cell lines, the corresponding DUX-bound sequences were PCR amplified from mouse genomic DNA and subcloned in a PiggyBac plasmid upstream of a GFP coding region to generate the corresponding reporter (Supplementary Table 14). ESCDUX carrying the LTR-RFP reporter were co-transfected with each of the BR-reporters together with a plasmid encoding for a supertransposase using jetPRIME (PolyPlus transfection) and further selected with puromycin (1ug/ml) for one week.
To generate DUXBLiRFP702-knock-in ESCDUX lines, we made a targeting construct using the backbone from the CTCF-mAC donor (Gift from Masato Kanemaki, 140646, Addgene) and containing the sequence DuxblExon 5-iRFP702-Duxbl3’UTR after amplifying the corresponding sequences by PCR followed by Gibson assembly (New England Biolabs) (Supplementary Table 14). In addition, we also used a targeting construct to target Oct4 with an IRES-GFP cassette (Gift from Rudolf Jaenisch, 21547, Addgene). DUXBL is not expressed in ESC and thus, to identify targeting events in Duxbl, ESCDUX were co-transfected using jetPRIME (PolyPlus transfection) with both targeting vectors as well as with LentiCRISPRv2 encoding sgRNAs designed to target the sequences surrounding the stop codons of Oct4 and Duxbl. Co-targeting events are common and therefore, GFP+ ESCDUX were sorted on a BD FACSAria Fusion instrument and tested for iRFP702 expression upon DUX induction. A similar strategy was used to generate TRIM24FKBP-knock-in ESC lines (Supplementary Table 14).
Immunofluorescence
Cells were fixed in 4 % paraformaldehyde (PFA, Electron Microscopy Sciences) for 10 min at RT followed by 10 min of permeabilization using the following permeabilization buffer (100 mM Tris-HCl pH 7.4, 50 mM EDTA pH 8.0, 0.5 % Triton X-100). The following primary antibodies were incubated overnight: TRIM24 (1:200, TA802797, Origene), TRIM33 (1:200, A301–060A, Bethyl Laboratories), DUXBL (1:500, custom antibody, GenScript), HDAC1 (1:100, D5C6U, #34589, Cell Signaling), HP1 (1:200, #2616, Cell Signaling), HA (1:500, C29F4, #3724, Cell Signaling), HA (1:100, 6E2, #2367, Cell Signaling), H3K9me3 (1:500, D4W1U, #13969, Cell Signaling), FLAG (1:500, F1804, Sigma Aldrich). Corresponding Alexa Fluor 488 Chicken anti-Rabbit IgG (H+L) (Thermo Fisher Scientific, Cat# 31431), Alexa Fluor 488 Goat anti-Mouse IgG (H+L) (Thermo Fisher Scientific, Cat# A-11001), Alexa Fluor 647 Chicken anti-Rabbit IgG (H+L) (Thermo Fisher Scientific, Cat# A-21443) or Alexa Fluor 647 Chicken anti-Mouse IgG (H+L) (Thermo Fisher Scientific, Cat# A-21463) secondary antibodies were used to reveal primary antibody binding (1:1000). DNA was stained using DAPI (4′,6-diamidino-2-phenylindole). Images were acquired using a Nikon SoRa spinning disk microscope (CSU-W1). Image processing was done using Nikon’s NIS-Element version 5.42.02.
For embryo immunostaining late 1C stage (30 h post hCG injection) or late 2C stage (48 h post hCG injection) embryos were fixed for 10 min at room temperature in 4 % methanol-free formaldehyde (ThermoFisher, 28906), washed in phosphate buffered saline (PBS) with 0.1 M glycine, permeabilized for 10 min with 0.5 % Triton X-100 in PBS and blocked for 1 h with 5 % FBS, 0.1 % Triton X-100 in PBS (blocking buffer). Samples were incubated with primary anti-V5 antibody (Cell Signaling, D3H8Q, 1:100) in blocking buffer overnight at 4° C. The following day, embryos were washed three times in 0.1% Triton X-100 in PBS (wash buffer) and incubated with Alexa 647 donkey anti-rabbit (ThermoFisher, A32795, 1:400) overnight at 4° C. Embryos were washed three times, incubated for 5 min with DAPI and washed twice again. Embryos were placed in microdroplets covered by light mineral oil (Sigma-Aldrich, ES-005-C) and images were taken at 40x magnification using a Leica SP8 confocal microscope.
TRIM24 and TRIM33 immunofluorescence in 2C embryos was performed as previously described48, using a 1:100 dilution of each primary antibody and Alexa 488 goat anti-rabbit IgG as secondary antibody.
CUT&RUN protocol
The CUT&RUN protocol was performed as described20. In brief, 500,000 trypsinized ESC were washed a total of three times with Wash Buffer (20 mM HEPES-KOH pH 7.5, 150 mM NaCl, 0.5 mM spermidine, Roche complete Protease Inhibitor tablet EDTA free) and bound to activated Concanavalin A beads (Polysciences) for 10 minutes at room temperature. Cell permeabilization was done in 200μl of Digitonin Buffer (0.05 % Digitonin and 0.1% BSA in Wash Buffer) followed by incubation with 4μl of the antibody against DUXBL (TA331435, Origene), 1μl of the antibody against FLAG (F1804, Sigma Aldrich) or 2μl of the antibody against H3K27ac (1μg/μl, ab4729, Abcam) at 4°C for 2 hours. For negative controls, we used a Guinea Pig anti-Rabbit IgG (ABIN101961, Antibodies-online). After antibody incubation, cells were washed with Digitonin Buffer, followed by incubation with purified hybrid protein A-protein G-Micrococcal nuclease (pAG-MNase) at 4°C for 1 hour. Samples were washed again in Digitonin Buffer, resuspended in 150 μl Digitonin Buffer and equilibrated to 0°C on ice water for 5 minutes. To start with MNase cleavage, 3 μl of 100 mM CaCl2 was added to cells and after 1 hour of digestion, reactions were stopped with the addition of 150 μl 2x Stop Buffer (340 mM NaCl, 20 mM EDTA, 4 mM EGTA, 0.02 % Digitonin, 50 μg/ml RNase A, 50 μg/ml Glycogen). Samples were incubated at 37°C for 10 minutes to release DNA fragments and centrifuged at 16,000 g for 5 minutes. Supernatants were collected and a mix of 1.5 μl 20% SDS / 2.25 μl 20 mg/ml Proteinase K was added to each sample followed by incubation at 65°C for 35 minutes. DNA was precipitated with ethanol and sodium acetate and pelleted by centrifugation at 4°C, washed, air-dried and resuspended in 10 μl 0.1x TE.
CUT&RUN library preparation and sequencing
For all experiments, we used half of the precipitated DNA obtained from CUT&RUN to prepare Illumina compatible sequencing libraries as described20. In brief, end-repair was performed in 50 μl of T4 ligase reaction buffer, 0.4 mM dNTPs, 3 U of T4 DNA polymerase (NEB), 9 U of T4 Polynucleotide Kinase (NEB) and 1 U of Klenow fragment (NEB) at 20°C for 30 minutes. Following this step, end-repair reaction was cleaned using AMPure XP beads (Beckman Coulter) and eluted in 16.5 μl of Elution Buffer (10 mM Tris-HCl pH 8.5) followed by A-tailing reaction in 20 μl of dA-Tailing reaction buffer (NEB) with 2.5 U of Klenow fragment exo- (NEB) at 37°C for 30 minutes. The total volume of the A-tailing reaction was mixed with Quick Ligase buffer 2X (NEB), 3000 U of Quick Ligase (NEB) and 10 nM of annealed adaptor (Illumina truncated adaptor) in a final volume of 50 μl and incubated for 20 min at room temperature. The adaptor was prepared by annealing the following HPLC-purified oligos: 5′-Phos/GATCGGAAGAGCACACGTCT-3′ and 5′-ACACTCTTTCCCTACACGACGCTCTTCCGATC∗T-3′ (∗phosphorothioate bond). Ligation was stopped by adding 50 mM of EDTA, cleaned with AMPure XP beads and eluted in 14 μl of Elution Buffer. All volume was used for PCR amplification in a 50 μl reaction with 1 μM primers TruSeq barcoded primer p7, 5′-CAAGCAGAAGACGGCATACGAGATXXXXXXXXGTGACTGGAGTTCAGACGTGTGCTCTTCCGATC∗T-3′ and TruSeq barcoded primer p5 5′-AATGATACGGCGACCACCGAGATCTACACXXXXXXXXACACTCTTTCCCTACACGACGCTCTTCCGATC*T-3′ (∗ represents a phosphothiorate bond and XXXXXXXX a barcode index sequence), and 2X Kapa HiFi HotStart Ready mix (Kapa Biosciences). PCR amplification was performed with the following program: 45 s at 98°C followed by 15 cycles of 15 s at 98°C, 30 s at 63°C, 30 s at 72°C and a final 5 min extension at 72°C. PCR reactions were cleaned with AMPure XP beads (Beckman Coulter), run on a 2% agarose gel and a band of 300bp approximately was cut and gel purified using QIAquick Gel Extraction Kit (QIAGEN). Library concentration was determined with KAPA Library Quantification Kit for Illumina Platforms (Kapa Biosystems). Sequencing was performed on the Illumina NextSeq550 (75bp pair-end reads) or on the Illumina NextSeq2000 (50bp pair-end reads).
CUT&RUN data processing and analysis
Data were processed using a modified version of Cut&RunTools as previously reported20 (see our custom code provided). Read quality was assessed using FastQC v0.11.9. Reads were adapter trimmed using fastp v.0.20.0. An additional trimming step was performed to remove up to 6bp adapter from each read. Next, reads were aligned to the mm10 genome using bowtie2 v2.2.6 with the ‘dovetail’ and ‘sensitive’ settings enabled. Peaks were called using macs2 v2.1.050 with a q-value cutoff of <0.01. For broad peaks calling, SICER v1.1 (https://pubmed.ncbi.nlm.nih.gov/19505939/) was used with parameters “redundancy threshold”=100, “window-size”=300, “gap size”=600 and E-value= 100. Signal tracks normalized to 1X coverage (reads per genomic coverage, RPGC) were generated using the ‘bamCoverage’ utility from deepTools v3.3.051 with parameters bin-size=25, smooth length=75, and ‘center_reads’ and ‘extend_reads’ options enabled. For motif analysis of DUXBL peaks, FIMO v5.1.052 from the MEME suite was used to scan either the entire peak sequence or the 300bp of sequence surrounding peak summits using the predicted DUXBL motif from the JASPAR database (https://jaspar.genereg.net/matrix/UN0671.1/). To examine differential enrichment of DUXBL to DUX binding sites in the condition of DUX/DUXBL-transgene co-expression over DUXBL-only expression we used MANorm version 1.14 (https://pubmed.ncbi.nlm.nih.gov/22424423/). We used a |og2(FC) cutoff of >1 and p-value <0.01 to define differentially enriched sites.
RNAseq libraries from ESC samples
RNAseq libraries were prepared using NEBNext Ultra II Directional RNA Library Prep Kit for Illumina (New England Biolabs, NEB) and NEBNext rRNA Depletion Kit (Human/Mouse/Rat) (NEB) according to the manufacturer’s protocol. RNA quality and yield were measured using RNA integrity number (RIN) algorithm, using the Fragment Analyzer (Agilent) or LabChip Gx Touch 24 (Perkin Elmer). Samples with 7.0–10.0 RIN value were used for library preparation. 2 μg of total RNA was used as input for VAHTS Stranded mRNAseq Library preparation. Sequencing was performed on a NextSeq500 instrument (Illumina) using v2 chemistry.
RNAseq data processing and batch correction
Fastq files for publicly available RNAseq experiments were downloaded from SRA. Read quality was assessed using FastQC v0.11.9. RNAseq reads were adapter trimmed using cutadapt v1.1853. Trimmed reads were aligned to either the mm10 genome with the GENCODE transcriptome annotation version M25 or the mm39 genome with the GENCODE transcriptome annotation M28 using STAR v2.7.6a54 when indicated. Transcript and transposable element expression was quantified using TEcount from tetoolkit v2.1.455. Differential expression analysis was performed using the DESeq2 package56. To compare the RNAseq experiments with public data, batch correction was performed. Gene counts across samples were first quantile-normalized using the limma v3.52.4 package. Batch correction was then performed on quantile-normalized counts using COMBAT v3.44.0 from the sva package.
For RNAseq analysis from Fig. 2d,e and Extended Data Fig. 2a,b all RNAseq performed in embryos, Trimmomatic version 0.39 was employed to trim reads following quality drop below a mean of Q20 in a window of 20 nucleotides and keeping only filtered reads longer than 15 nucleotides57. Reads were aligned to mouse genome version mm39 (Ensembl release 104) with STAR 2.7.10a354. Aligned reads were filtered to remove duplicates with Picard 2.27.1 (Picard: A set of tools (in Java) for working with next generation sequencing data in the BAM format, http://broadinstitute.github.io/picard), multi-mapping, ribosomal, or mitochondrial reads. Gene counts were established with featureCounts 2.0.3 by aggregating reads overlapping exons on the correct strand excluding those overlapping multiple genes58. The raw count matrix was normalized with DESeq2 version 1.30.156. Contrasts were created with DESeq2 based on the raw count matrix. For data from mouse embryos, genes were classified as differentially expressed at average count > 5, multiple testing adjusted p-value < 0.05 and −0.585 < log2FC > 0.585 (unless otherwise indicated in the Figure legend), for data from mESC average count > 5, p-value < 0.05 and −1 < log2FC > 1. The Ensemble annotation was enriched with UniProt data (Activities at the Universal Protein Resource (UniProt)). DEGs per contrast were split into separate lists by up/down regulation and submitted to gene set overrepresentation analyses with KOBAS v3.059. The resulting bar plot shows gene sets with Benjamini-Hochberg corrected p-value < 0.2.
Statistics &reproducibility
For every experiment, at least two biological replicates were performed, and two independent ESC lines were used. The precise number of independent experiments and statistical test used for each case can be found in the Figure Legends. Differential expression analysis from RNAseq data (Fig. 2e, 3h, Extended Data Fig. 5d–f and Supplementary Tables 2–4,6, 7 and 13) was performed using the DESeq2 package. Wald test p-values for differential expression were corrected for multiple testing using the Benjamini-Hochberg procedure. No statistical method was used to predetermine sample size nor were data excluded from the analyses. The experiments were not randomized, and investigators were not blinded to allocation during experiments and outcome assessment. Data distribution was assumed to be normal, but this was not formally tested.
Extended Data
Extended Data Figure 1: DUX induces two protein products from the Duxbl gene.
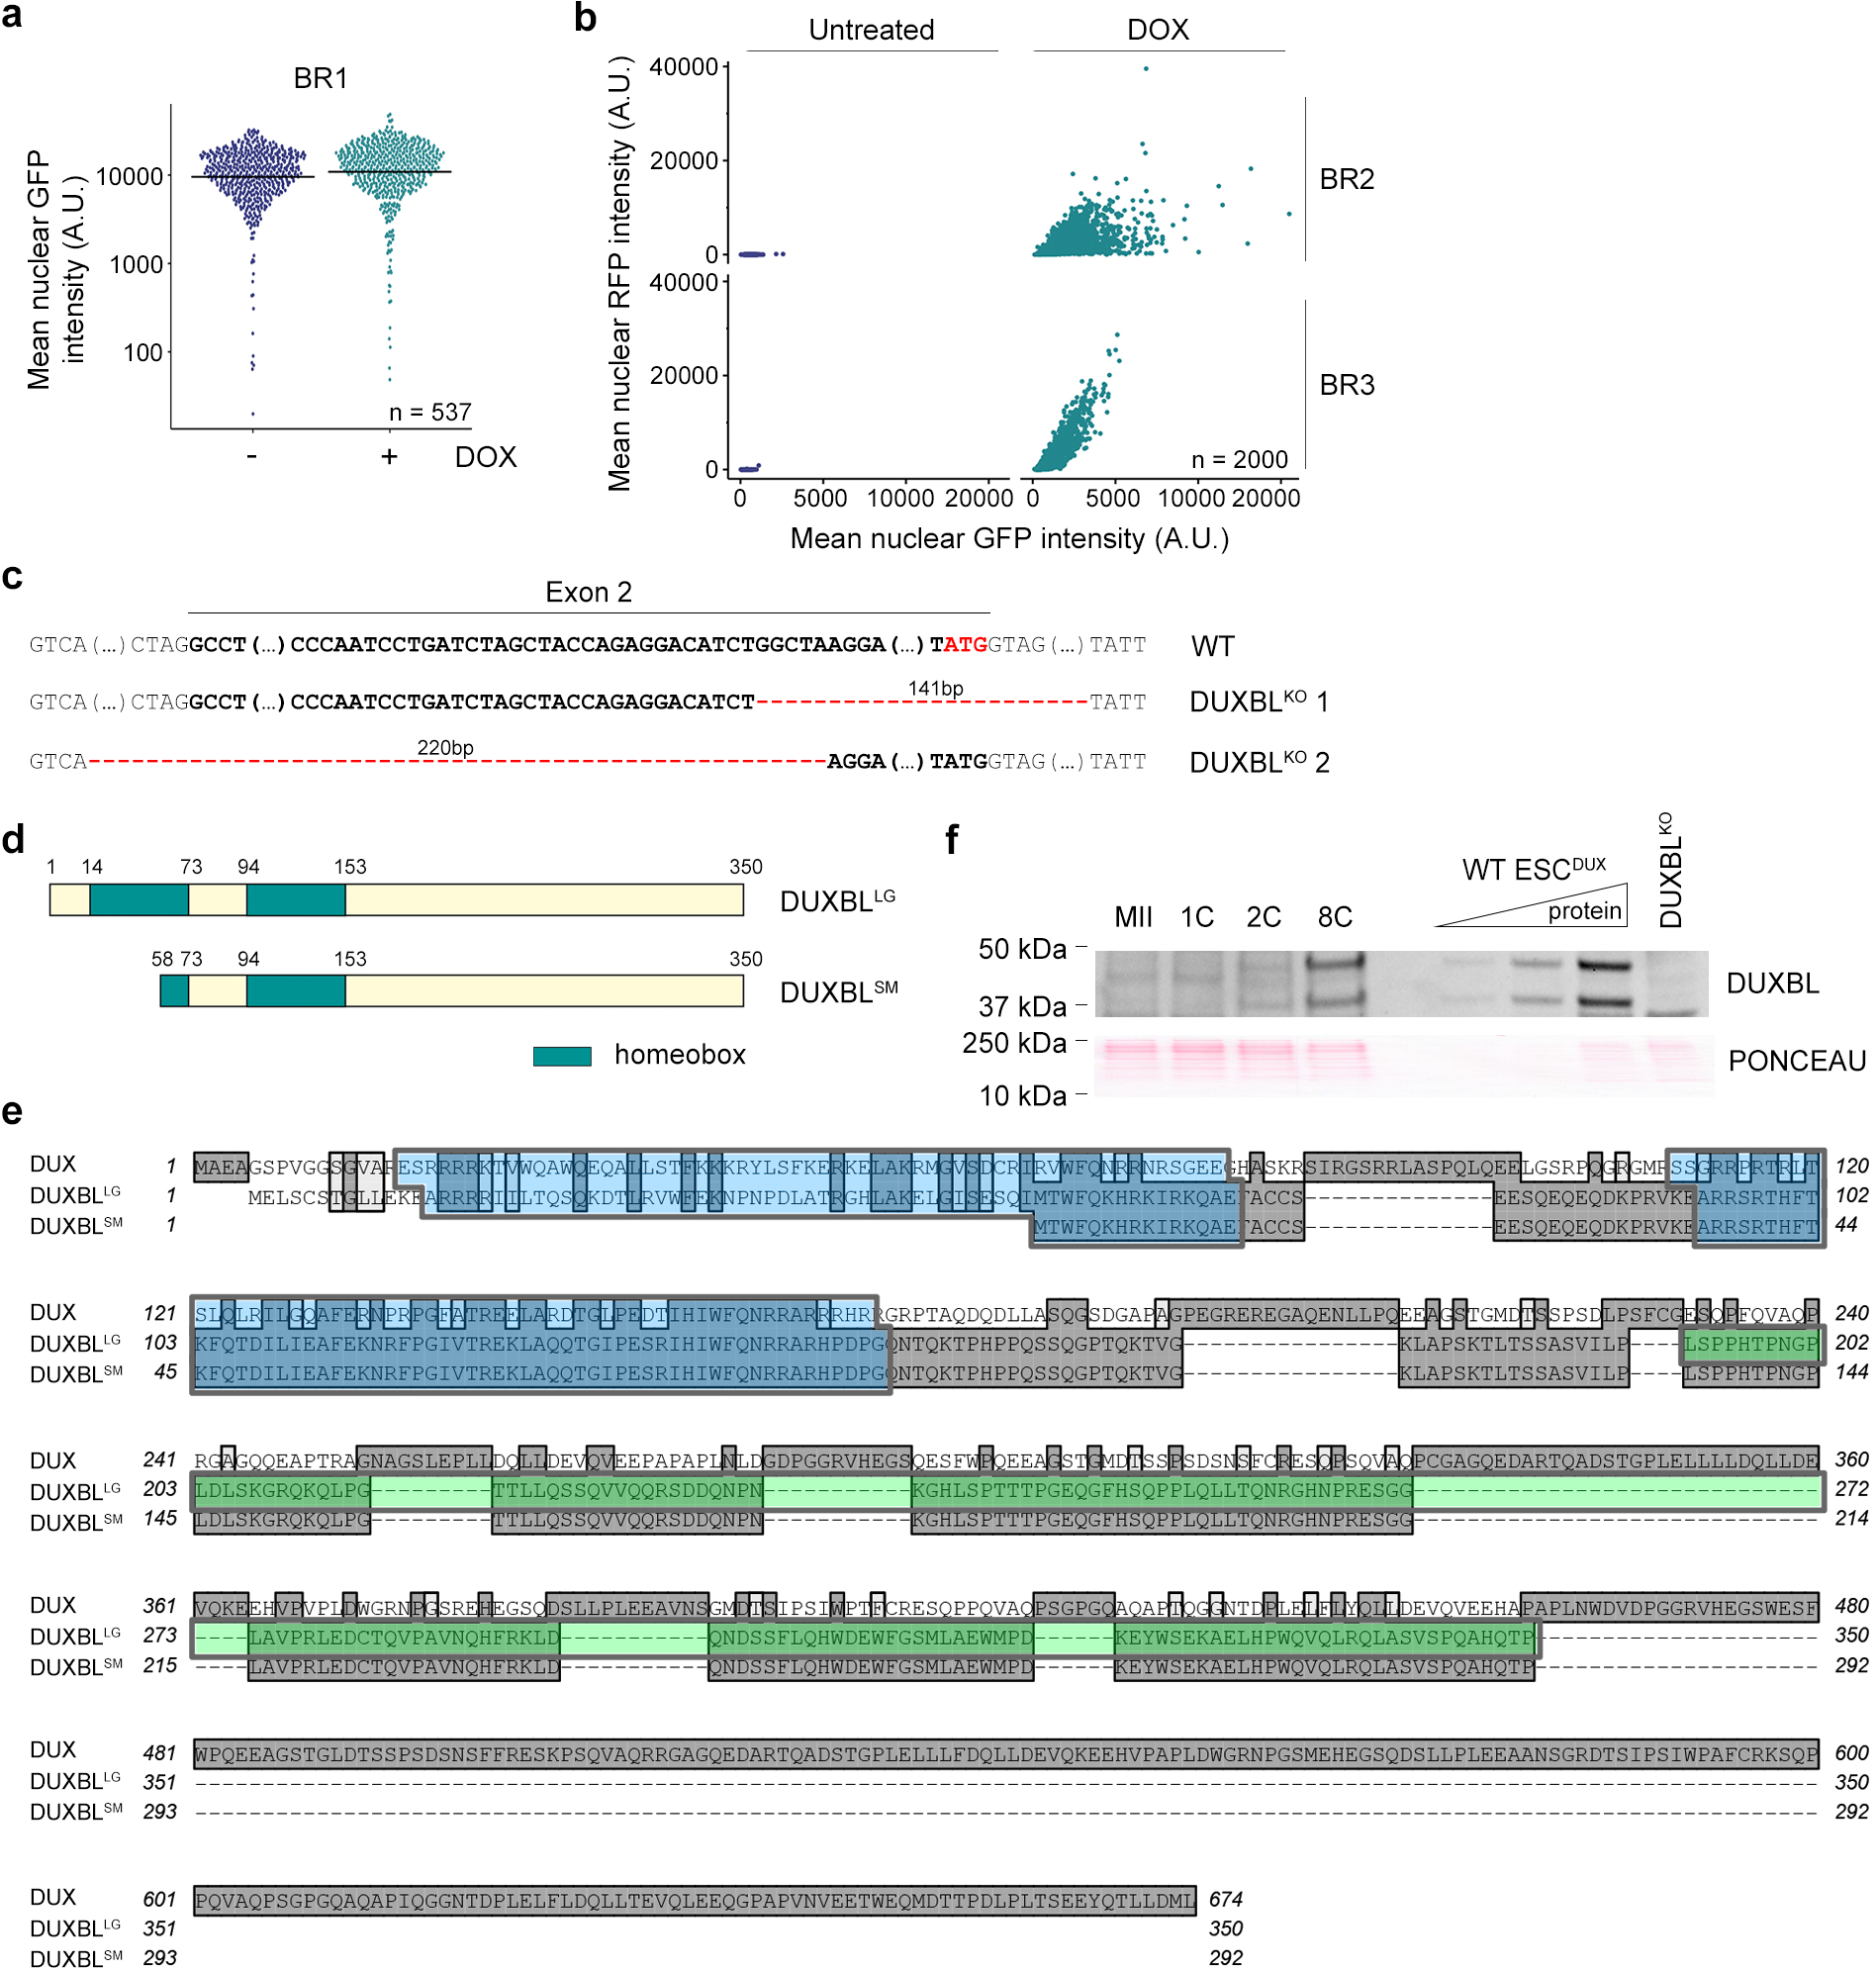
a) High-throughput imaging quantification of GFP mean nuclear intensity in untreated or DOX-treated for 16 hours BR1-GFP reporter ESCDUX. Center lines indicate mean values. n=537. b) Graph plots showing quantified mean intensity levels of RFP and GFP obtained from untreated and DOX-treated LTR-RFP reporter BR2- or BR3-GFP ESCDUX. c) DNA sequences surrounding exon 2 of Duxbl showing the deletions detected in representative DUXBLKO ESCDUX clones analyzed. DNA sequence from exon 2 is highlighted in bold. The alternative ATG at the end of the second Duxbl exon is highlighted in red. d) Schematic representation of the DUXBL protein products. e) Protein sequence alignment of DUX, DUXBLLG (large DUXBL isoform) and DUXBLSM (small DUXBL isoform). Highlighted in blue are the two homeodomains (note than DUXBLSM lacks most of the first homeodomain). Highlighted in dark grey are conserved residues and in light grey are similar residues. Highlighted in green is the peptide sequence used to generate our custom DUXBL antibody. f) Western blot analysis of DUXBL performed in lysates from a pool of approximately 488 embryos at the indicated stages of development. Increasing amounts of DOX-treated WT ESCDUX as well as DOX-treated DUXBLKO ESCDUX lysates were included as controls. Ponceau staining is shown as a loading control. For (a, b and f), two independent experiments were performed but one representative experiment is shown.
Extended Data Figure 2: DUXBL does not function as a transcriptional activator.
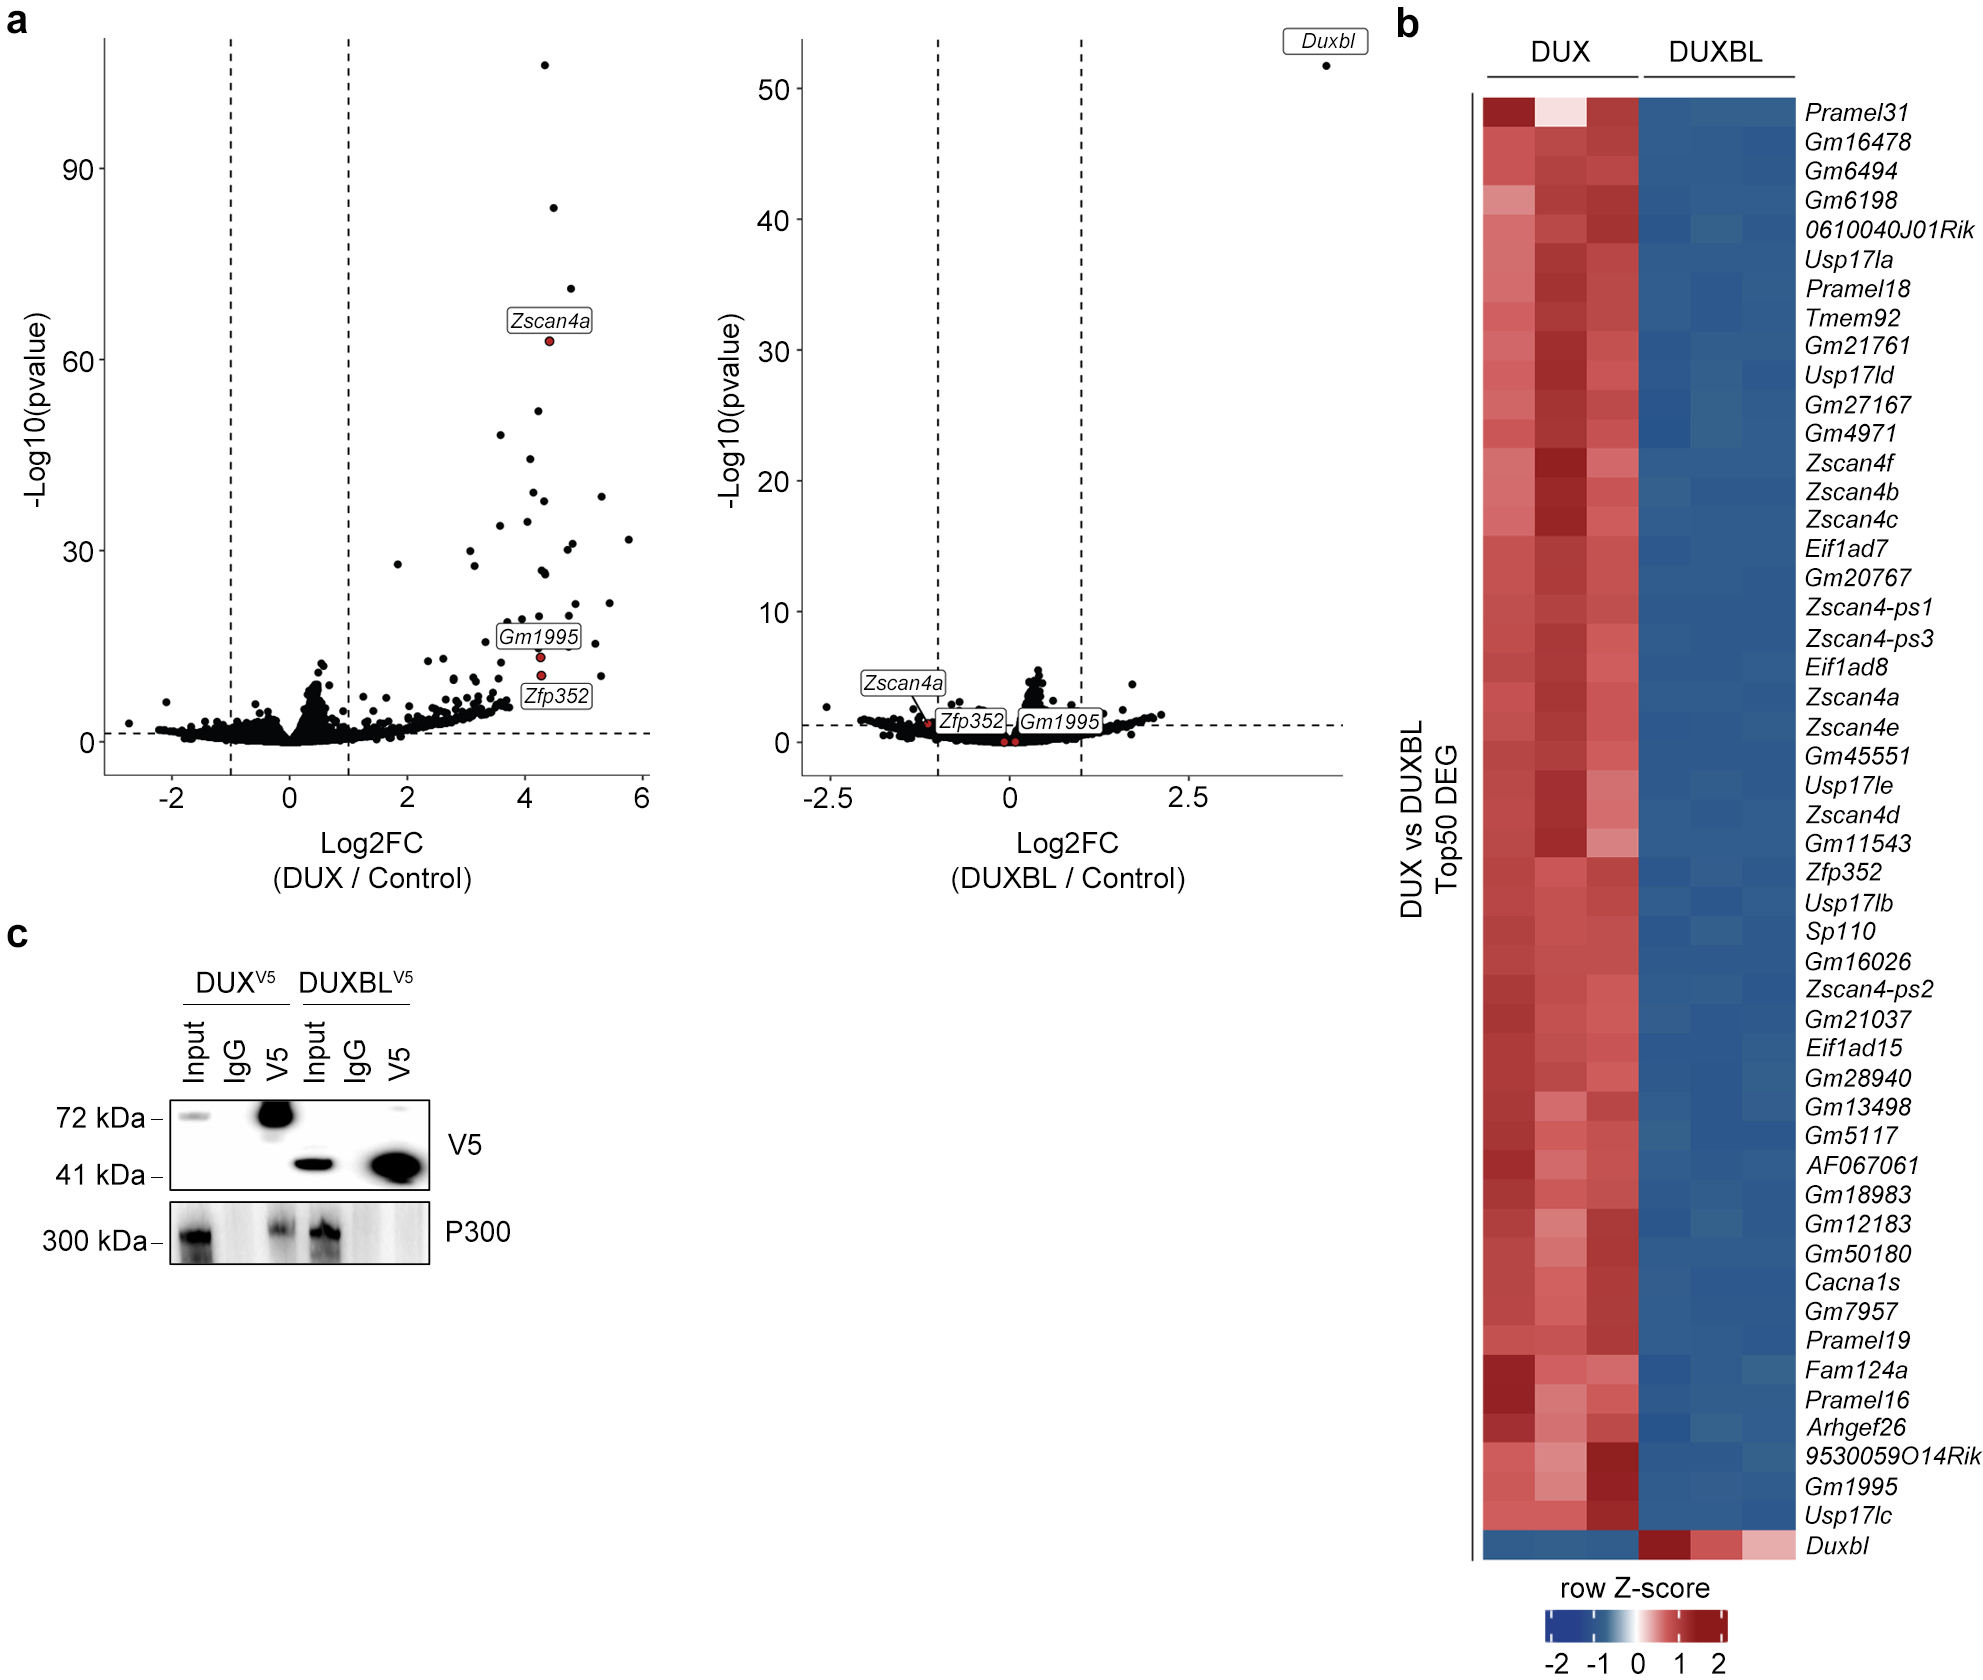
a) Volcano plots showing differentially expressed genes between DUX- (left panel) or DUXBL-expressing ESC (right panel) compared to control ESC. b) Heatmap showing the top 50 differentially expressed genes between DUX- and DUXBL-expressing ESC. c) Western blot analysis of the indicated proteins performed with V5 immunoprecipitates obtained from 293T cells transfected with the corresponding expression vectors. This experiment was repeated multiple times, but one is shown. Data in (a, b) was generated using three replicates per condition.
Extended Data Figure 3: Duxbl-deficient ESC showed increased 2CLC-conversion.
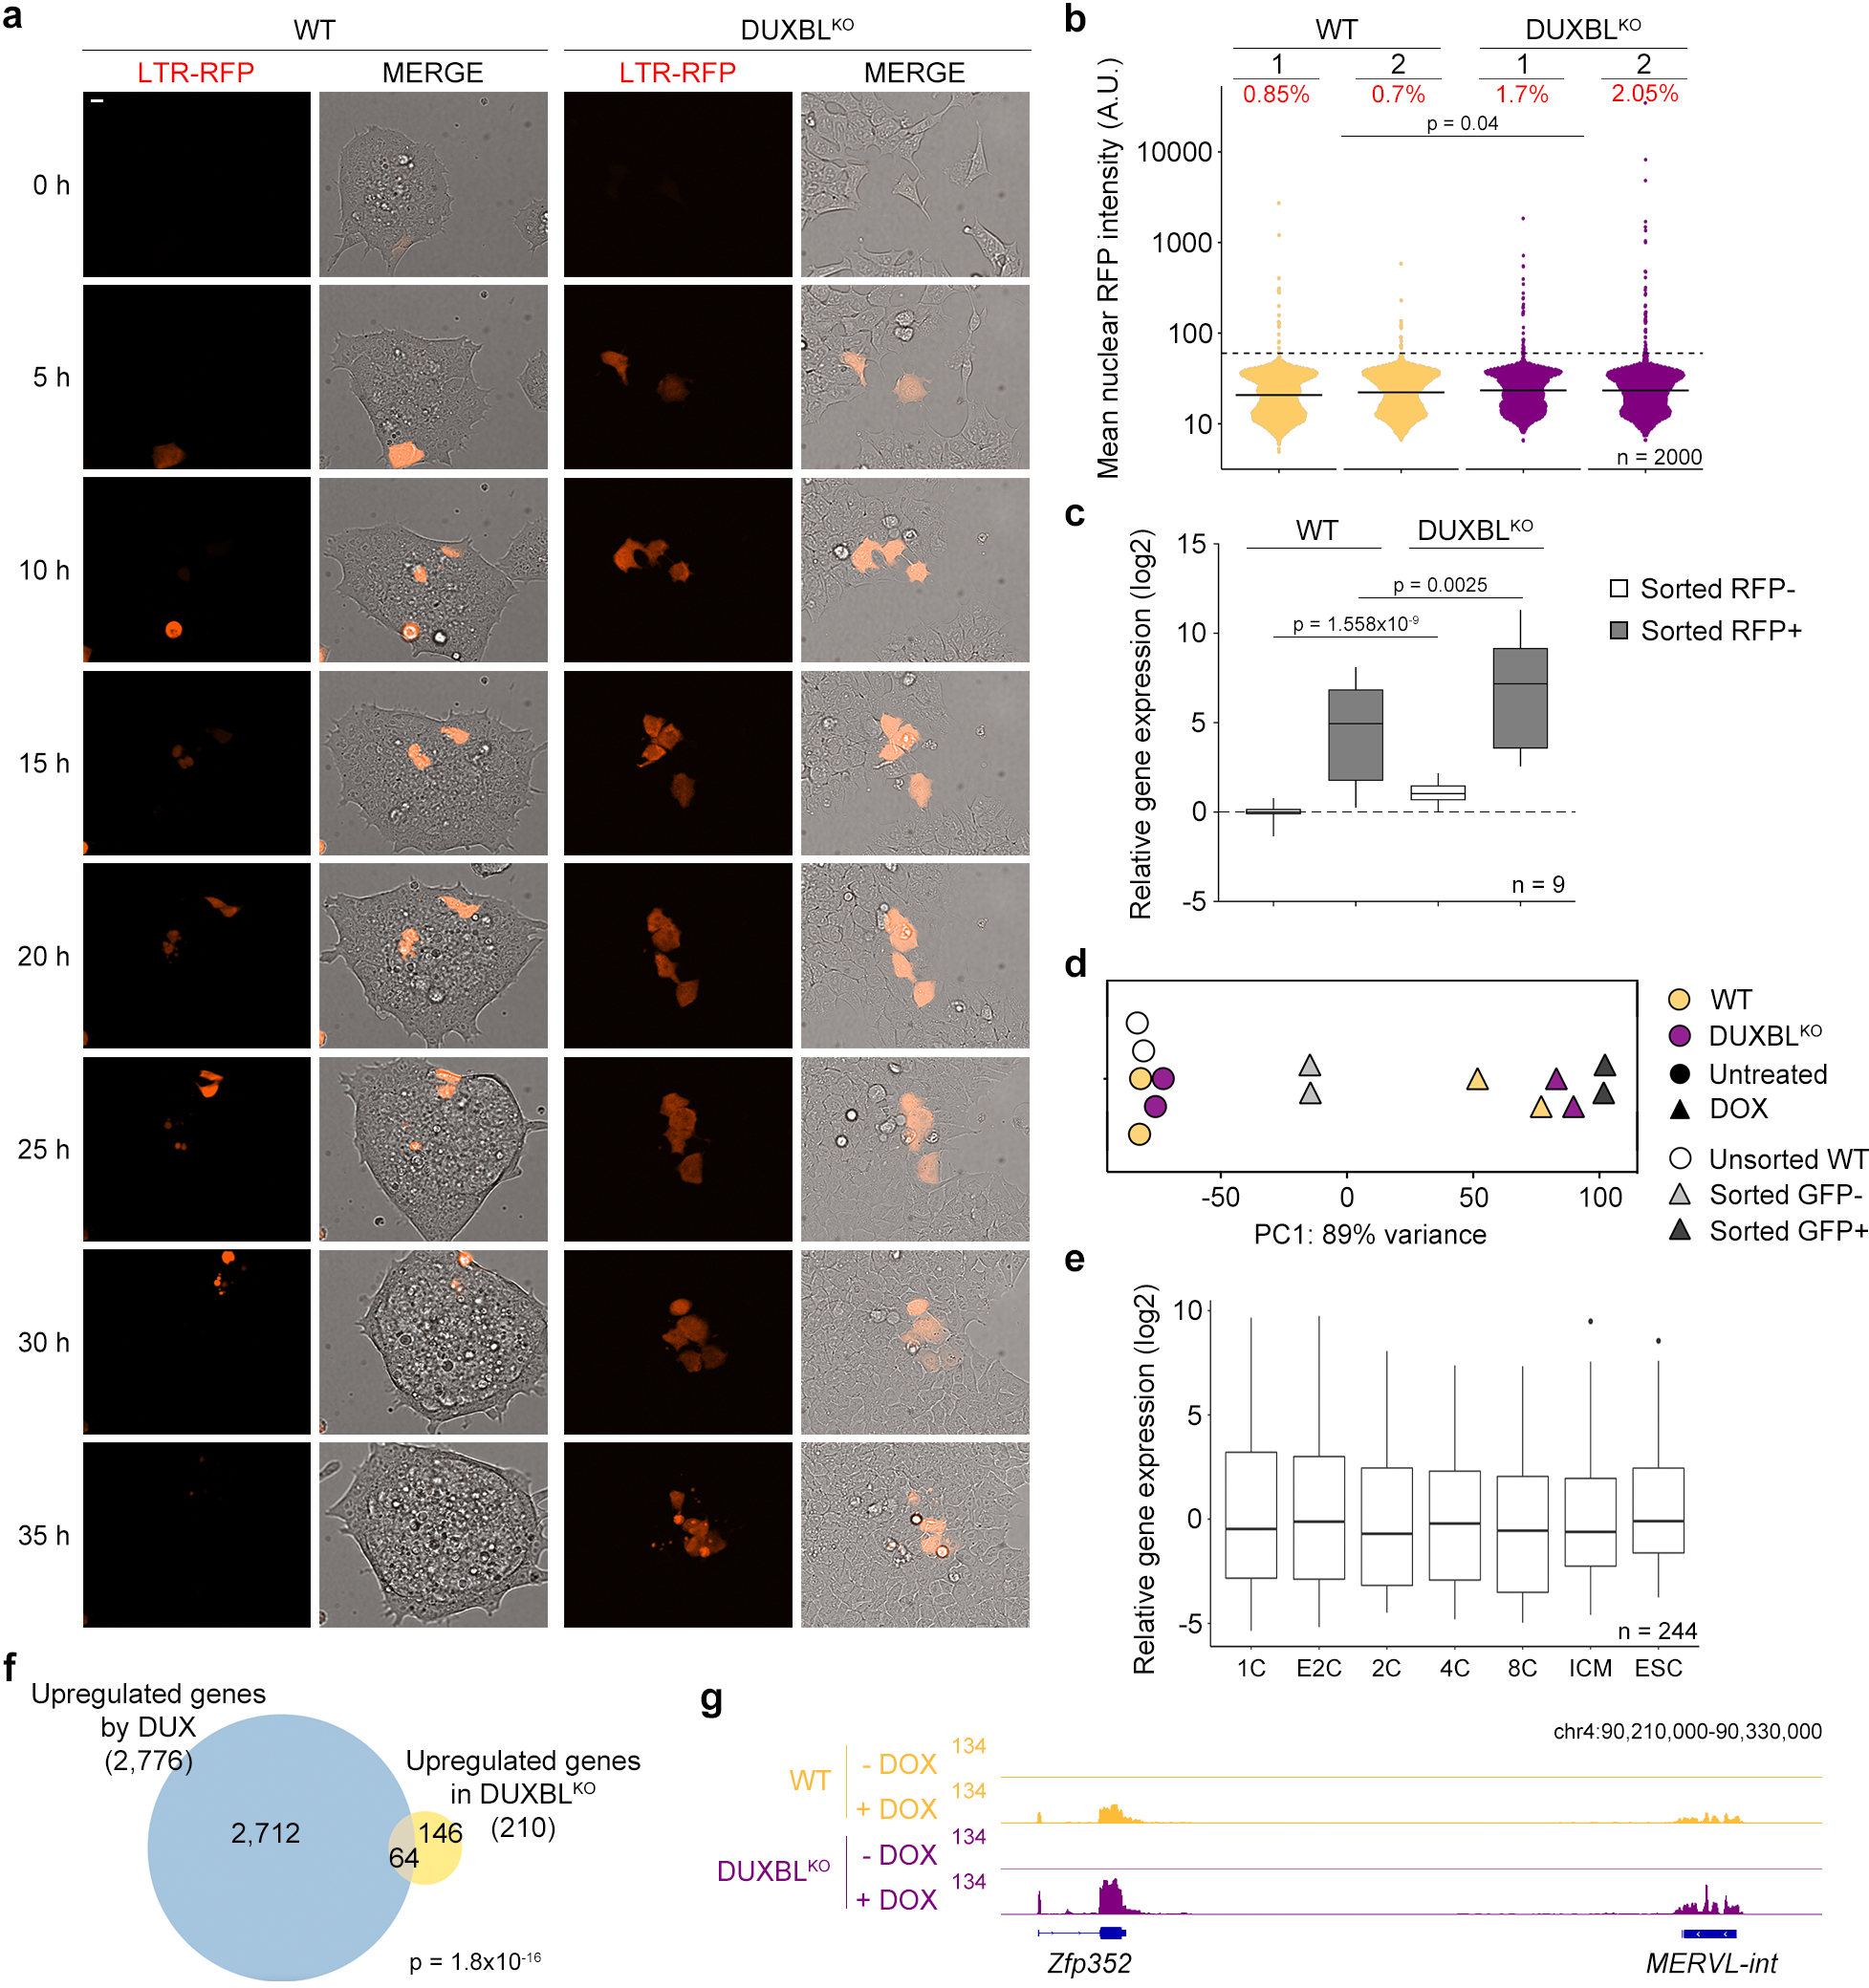
a) Time lapse microscopy experiment performed in LTR-RFP reporter WT and DUXBLKO ESCDUX. Two independent experiments with two ESC lines per condition were performed, but one representative is shown. Time since the addition of DOX is indicated. Scale bar, 10 μm. b) High-throughput imaging (HTI) quantification of RFP+ cells in LTR-RFP reporter WT and DUXBLKO ESC. Center lines indicate mean values. Percentages of RFP+ cells above the threshold (dotted line) are indicated. n=2000; p value is from one-tailed unpaired t-test. Three independent experiments were performed but one representative is shown. c) Real time-PCR analysis shown in a box and whisker plot showing the relative fold change expression of nine 2C-associated genes/repeats (Dux, Zscan4c, Zfp352, Tcstv3, Sp110, Tdpoz1, Dub1, Eif1ad8, and MERVLs) in RFP negative, and RFP positive cells sorted from LTR-RFP reporter WT and DUXBLKO ESCDUX cultures. Gapdh expression was used to normalize. Center line indicates the median, box extends from the 25th to 75th percentiles and whiskers show Min to Max values. p values are shown from one-tailed unpaired t-tests. Two independent experiments were performed but one representative is shown. d) Unidimensional PCA plot of RNAseq data from untreated or DOX-treated WT and DUXBLKO ESCDUX (two replicates each) together with WT DUX-expressing ESC from5. DUX-expressing ESC were sorted into GFP+ or GFP- based on the activation of the LTR-GFP reporter. e) Box and whisker plot showing normalized fold change expression of the 244 genes downregulated as shown in Fig. 2b. RNAseq data obtained from27. Center line indicates the median, box extends from the 25th to 75th percentiles and whisker extends from the hinge to the largest or smallest value no further than 1.5-fold from the inter-quartile range. Data beyond whiskers were plotted individually. For (c-e), data was generated using two independent ESC lines per genotype and condition. f) Venn diagram showing the overlap between the 210 genes described in Fig. 2d and the upregulated genes in LTR+ sorted DUX-expressing ESC (data obtained from5). p value was obtained from a two-tailed Fisher’s exact test. g) Genome browser tracks from individual samples showing RNAseq RPKM read count in untreated or DOX-treated WT and DUXBLKO ESCDUX.
Extended Data Figure 4: DUXBL expression limits 2CLC conversion.
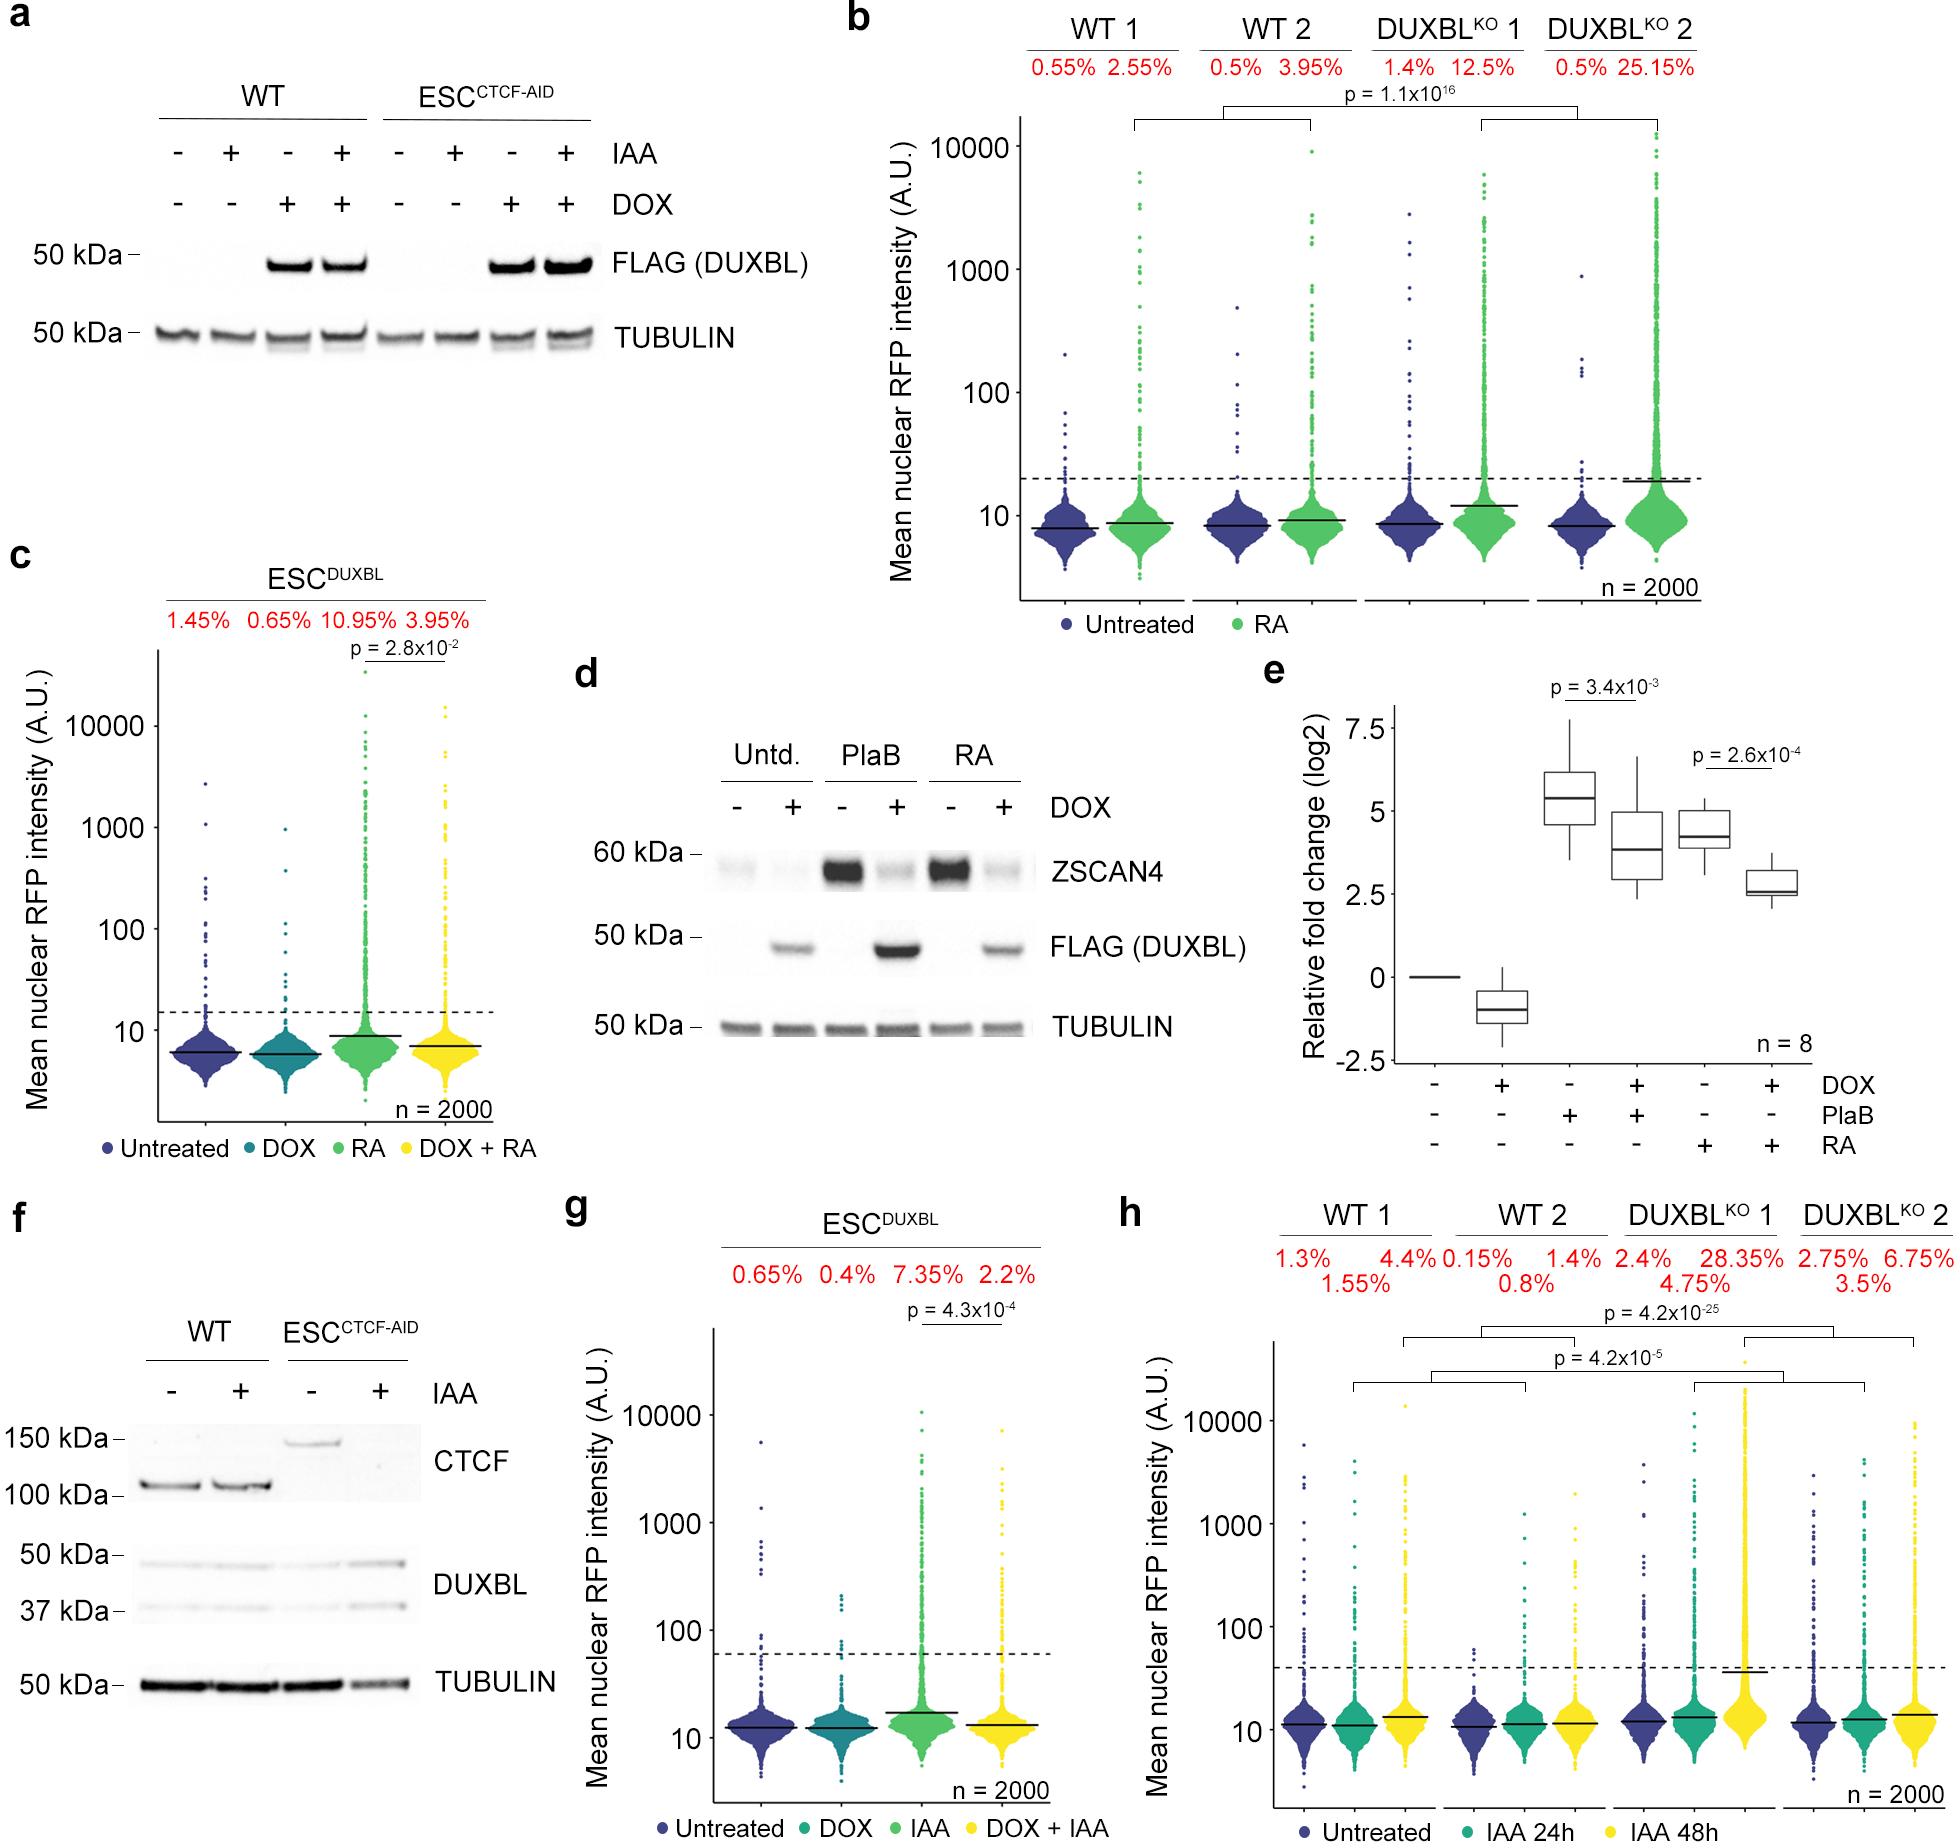
a) Western blot analysis of DUXBL (FLAG) performed in lysates from untreated or indole-3-acetic acid (IAA)/DOX-treated WT or ESCCTCF-AID expressing DUXBL (FLAG). Tubulin levels are shown as a loading control. b) High-throughput imaging (HTI) quantification of RFP+ cells in LTR-RFP reporter WT and DUXBLKO ESC incubated with 0.53 mM RA for 48 hours. c) HTI quantification of RFP+ cells in untreated or DOX-treated LTR-RFP reporter ESCDUXBL incubated with 0.53 mM RA for 48 hours. d) Western blot analysis using lysates from untreated or DOX-treated ESCDUXBL incubated with 2.5 mM PlaB for 24 hours or 0.53 mM RA for 48 hours. e) Box and whisker plot showing the relative fold change (log2) expression of eight 2C-associated genes (Dux, Zscan4c, Zfp352, Tcstv3, Sp110, Tdpoz1, Dub1 and Eif1ad8) in untreated or DOX-treated ESCDUXBL incubated with 2.5 mM PlaB for 24 hours or 0.53 mM RA for 48 hours. Two independent experiments were performed but one representative is shown. p values are shown from one-tailed unpaired t-tests. Center line indicates the median, box extends from the 25th to 75th percentiles and whiskers show Min to Max values. f) Western blot analysis of CTCF performed in lysates from untreated or IAA-treated ESCCTCF-AID. Tubulin levels are shown as a loading control. g) HTI quantification of RFP+ cells in untreated or IAA/DOX-treated for 48 hours LTR-RFP reporter ESCCTCF-AID expressing DUXBL. h) HTI quantification of RFP+ cells in untreated or IAA-treated for 24 and 48 hours LTR-RFP reporter WT or DUXBLKO ESCCTCF-AID. For (a,d and f), two independent experiments were performed but one representative is shown. For (b,c,g and h), center lines indicate mean values. Percentages of RFP+ cells above the threshold (dotted line) are indicated. n=2000. p values are shown from one-tailed unpaired t-tests. In all cases, three independent experiments were performed but only one representative is shown.
Extended Data Figure 5: DUXBL expression in zygotes impairs proper ZGA.
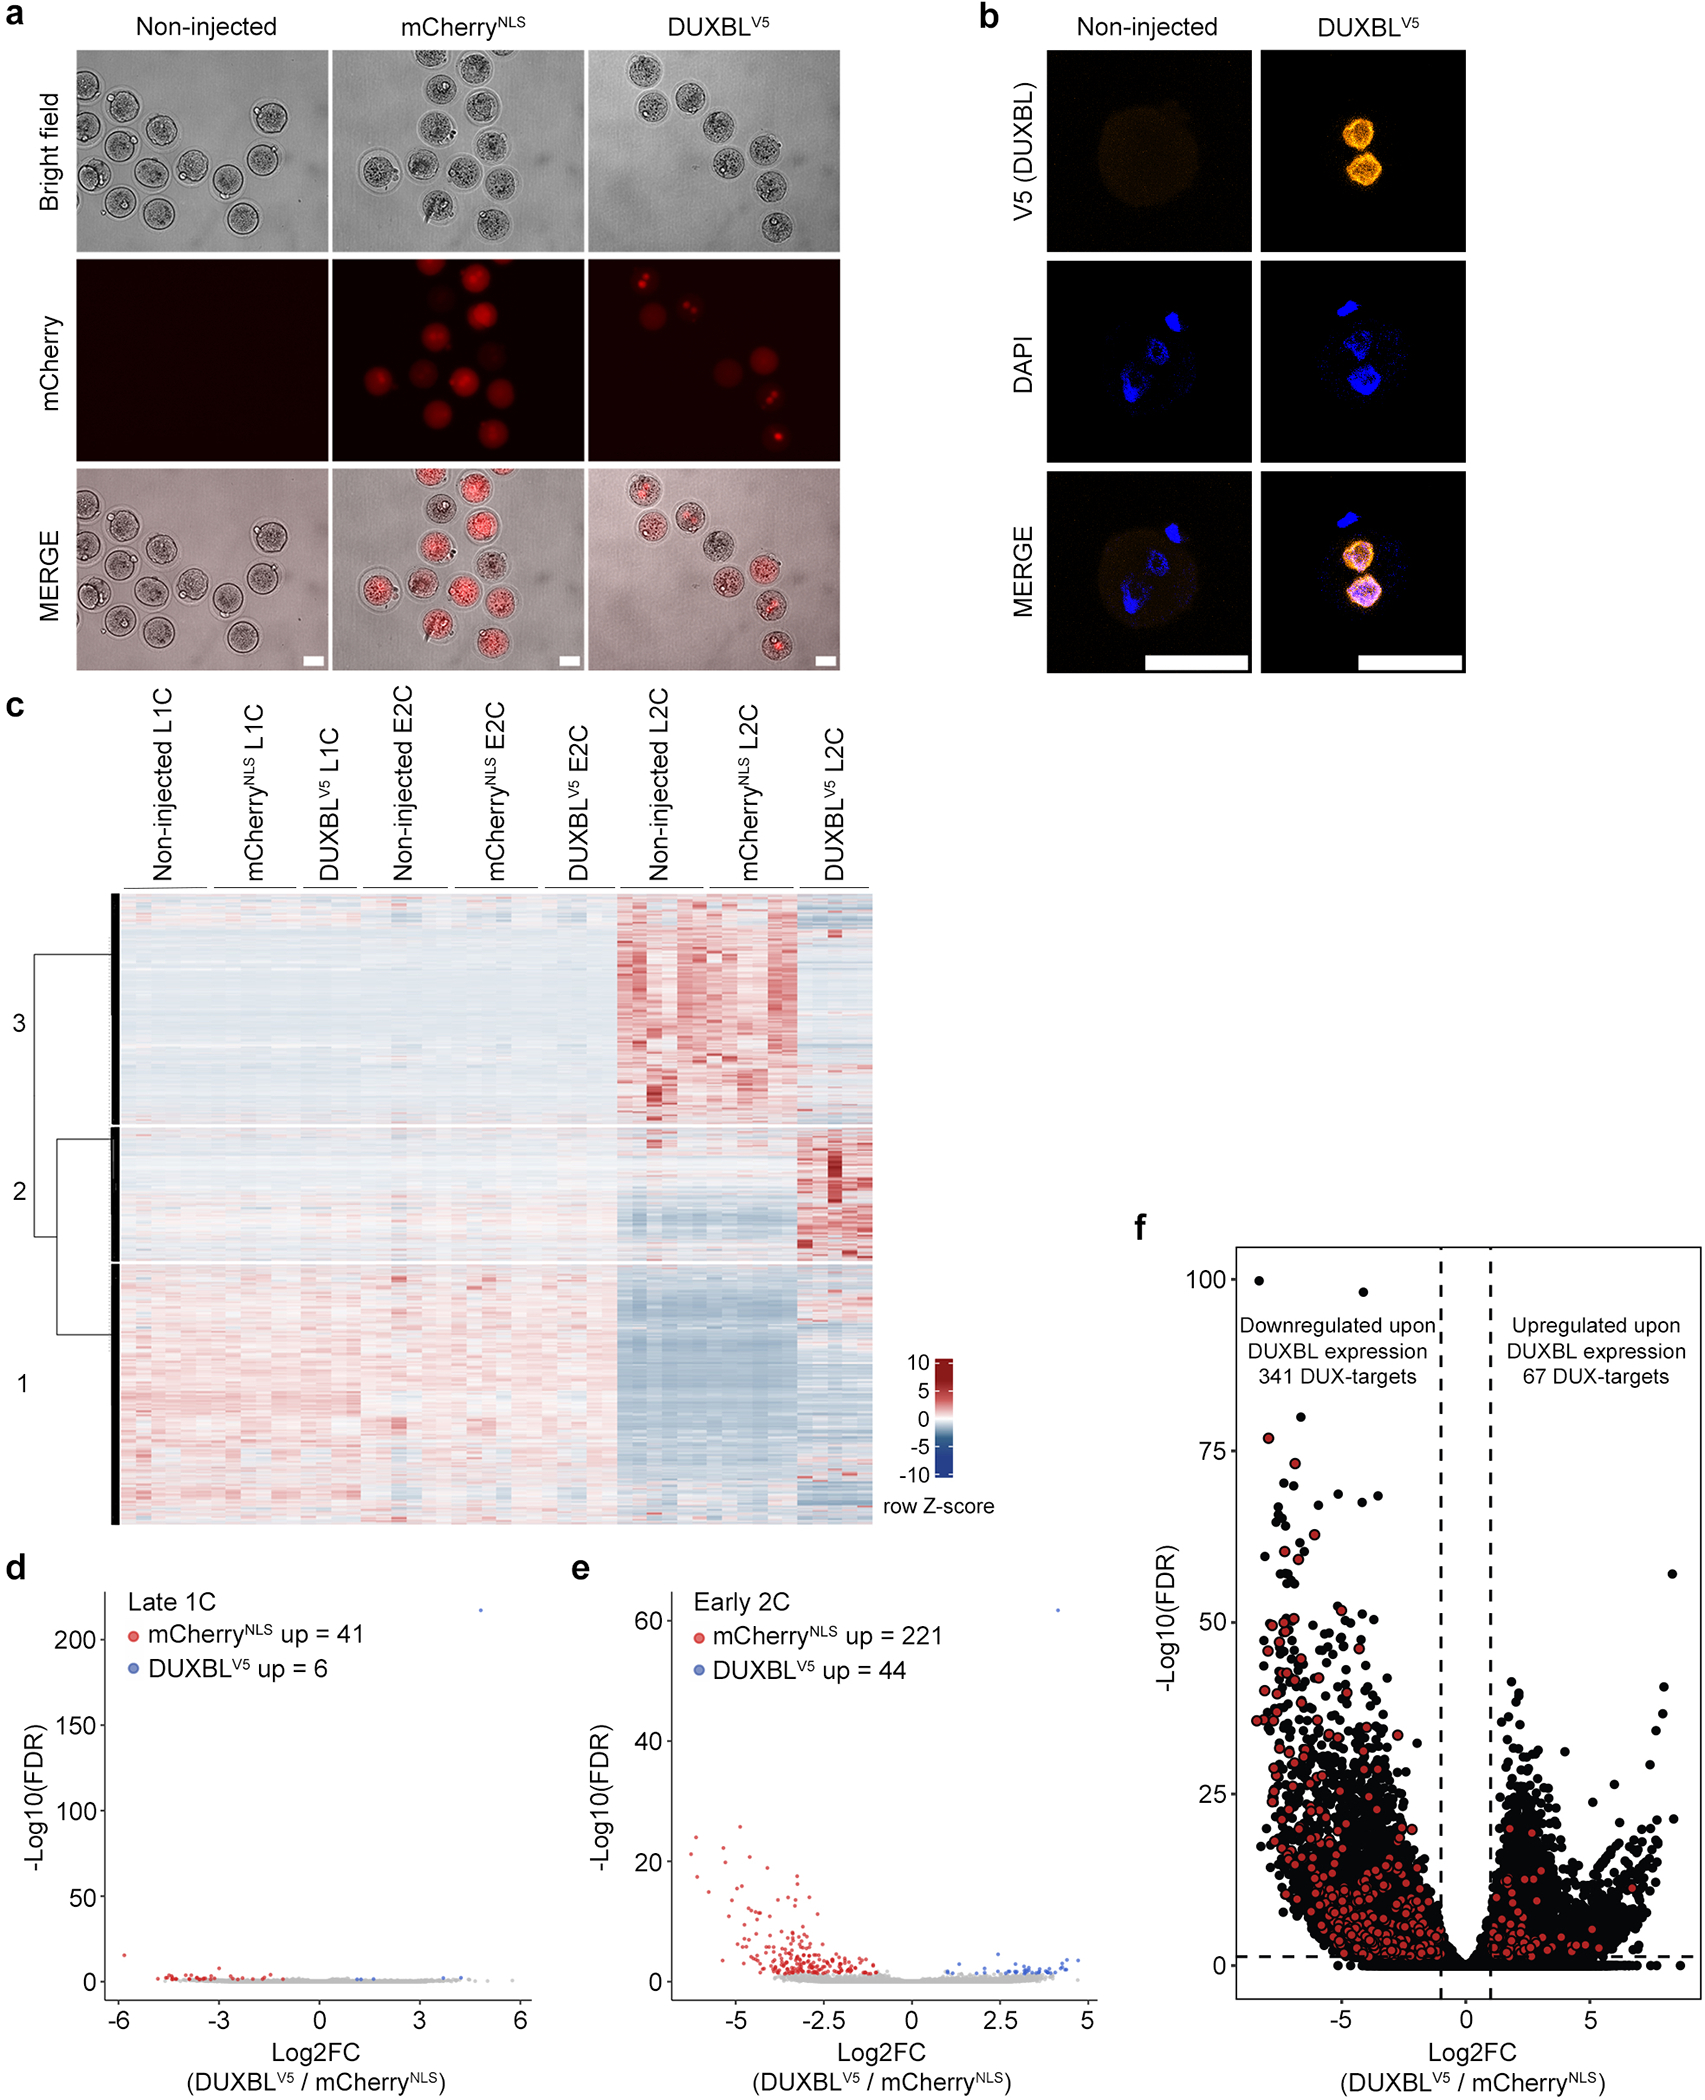
a) Representative bright field and fluorescence images of zygotes not injected or microinjected with mRNA encoding for mCherryNLS or DUXBLV5 plus mCherryNLS. Images were taken 6 hours post microinjection. Scale bar, 50 μm. Five independent experiments were performed but one representative is shown. b) Representative immunofluorescence analysis of the V5 tag in zygotes not injected or microinjected with mRNA encoding DUXBLV5 plus mCherryNLS. DAPI was used to visualize the nuclei. Scale bars, 50 μm. At least 10 independent embryos per condition were stained but one representative is shown. c) Heatmap and k-means clustering (3) showing the distribution of the indicated samples described in Figure 3a. d, e) Volcano plots highlighting the differentially expressed genes observed by RNAseq analysis between DUXBLV5 and mCherryNLS-overexpressing embryos (red: FC≥2 DUXBL/mCherry; blue: FC≤−2 DUXBLV5/mCherry; padj<0.05). f) Volcano plot showing differentially expressed genes between DUXBL-overexpressing embryos compared to mCherry-overexpressing embryos. Genes differentially induced by DUX are highlighted in red. Log2 fold change>1; pValue<0.01. For (c-f), data was generated by using a total of 4–6 pools of 5 embryos/pool per stage and condition.
Extended Data Figure 6: Downregulation of Duxbl in zygotes compromises development.
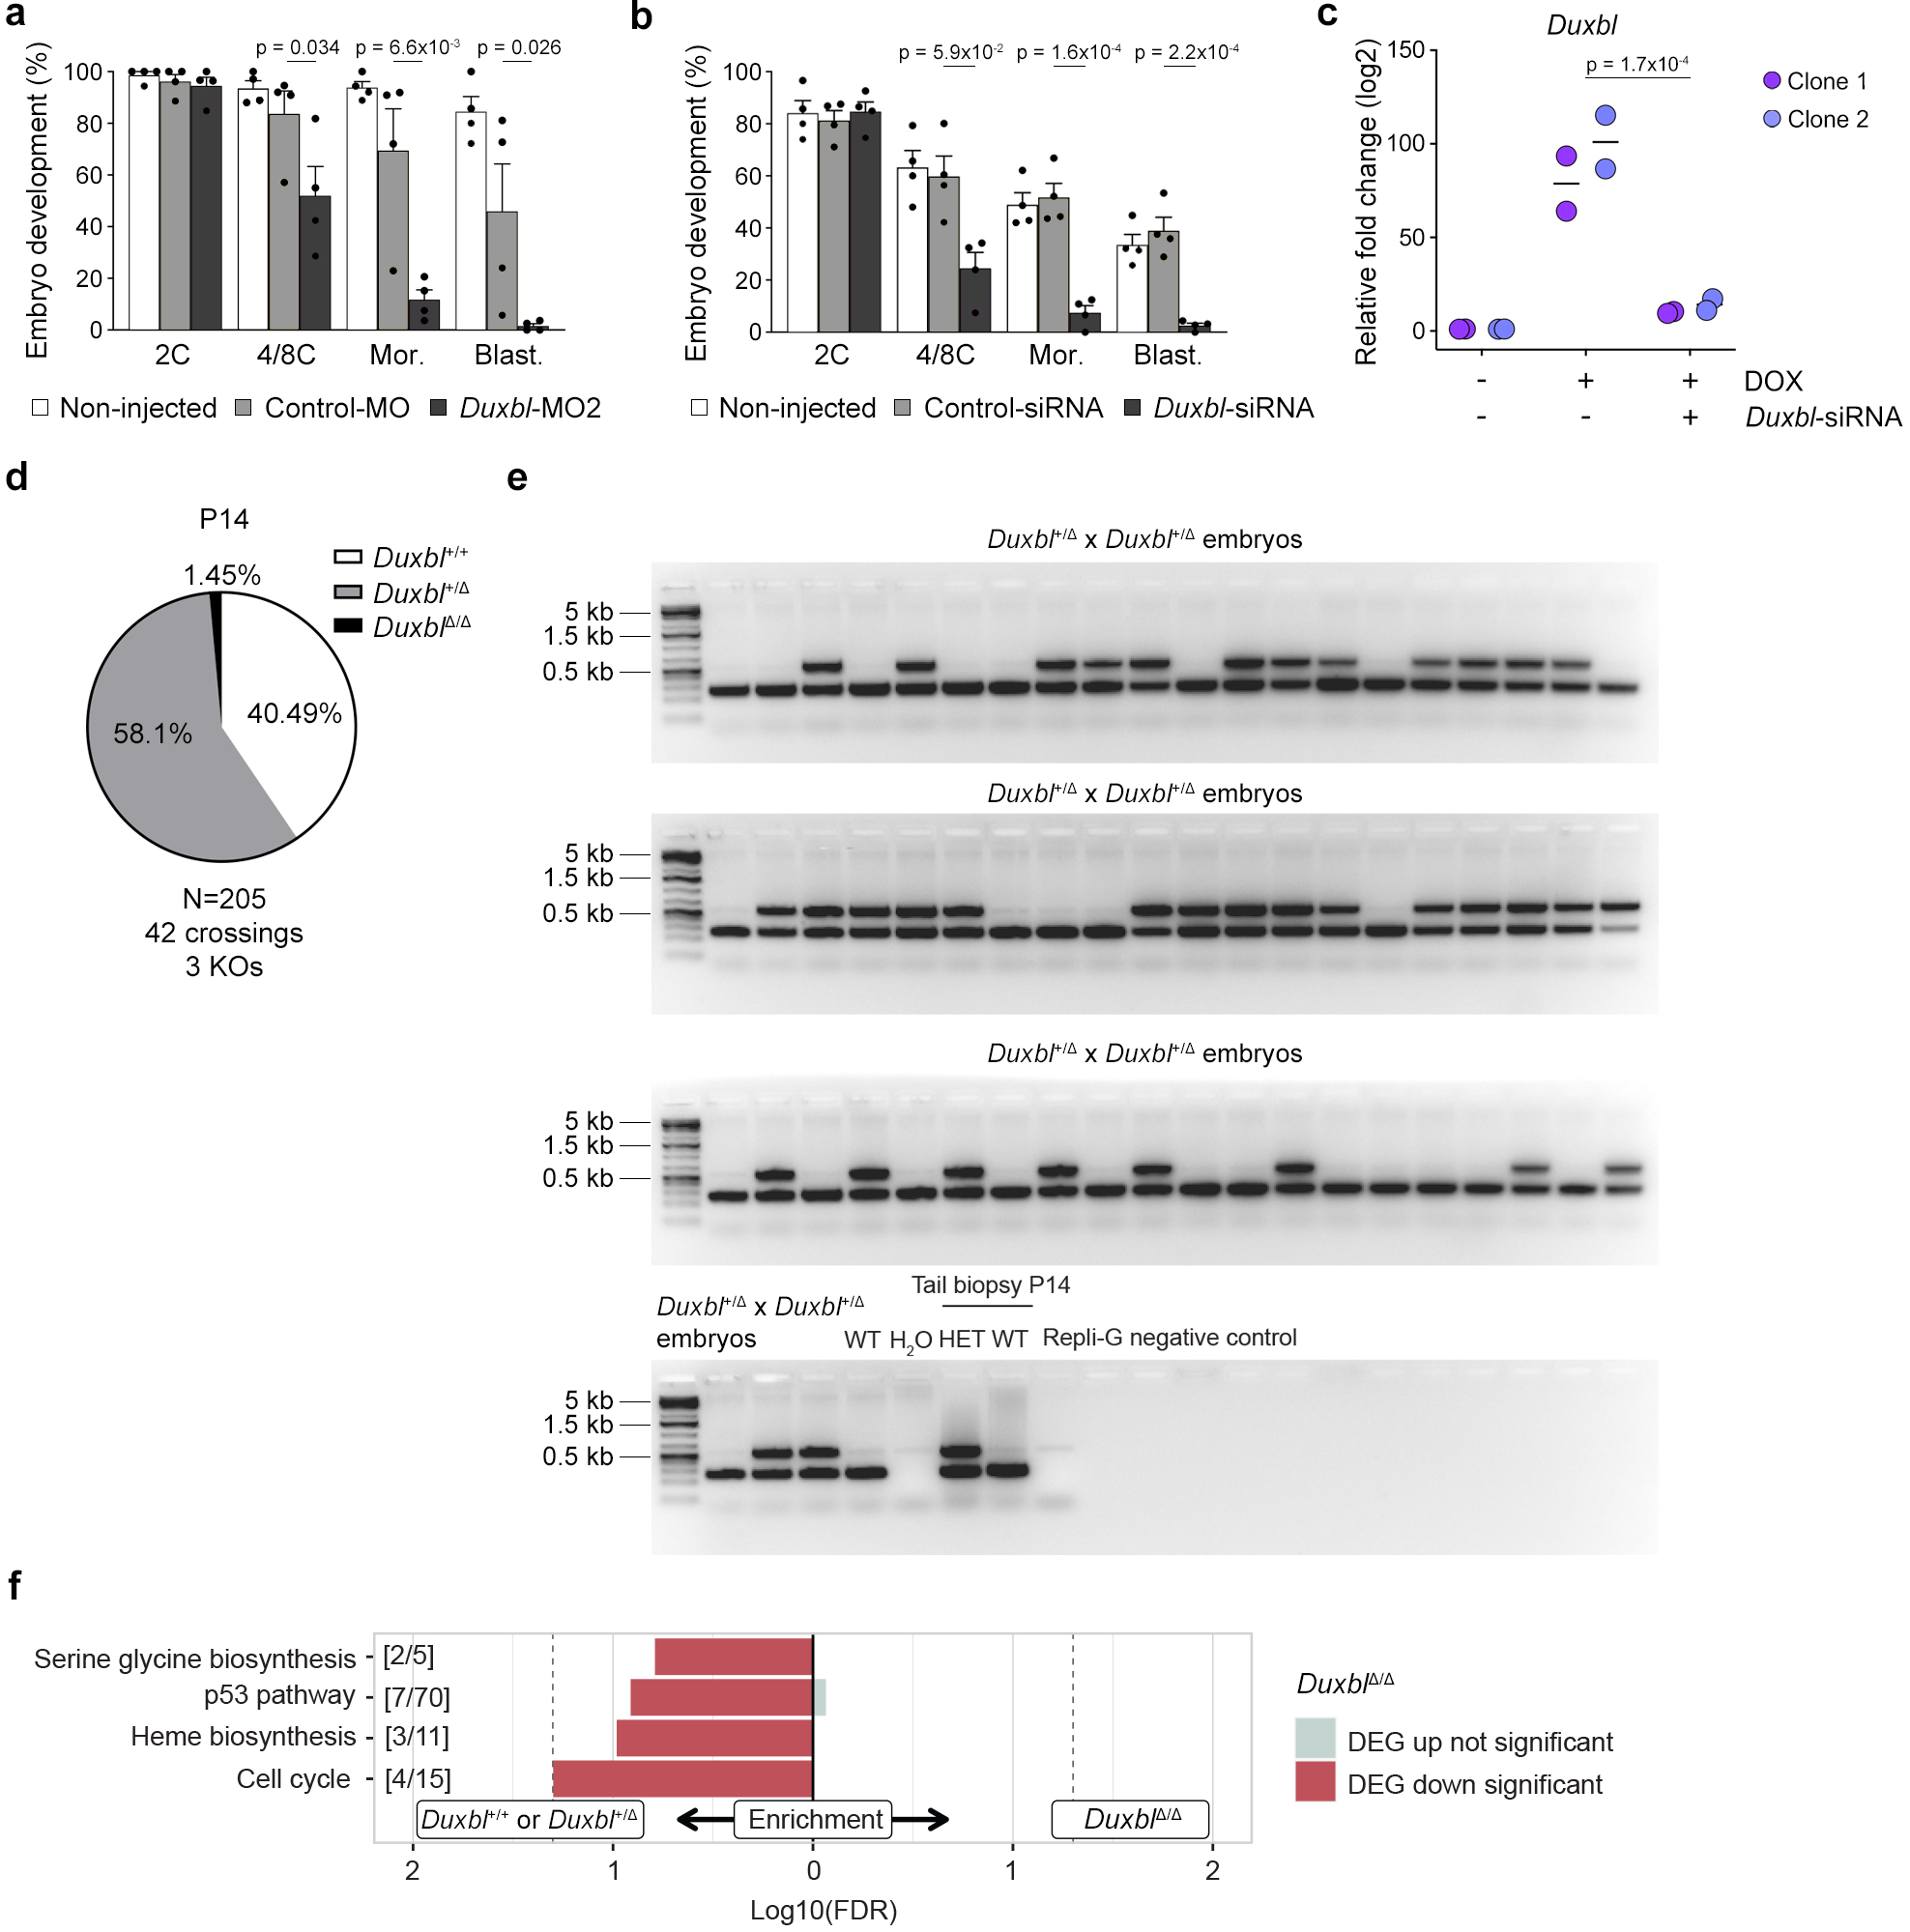
a) Plot showing mean±standard error of the mean (SEM) summarizing four independent experiments with a total of 25–45 microinjected zygotes per group (non-microinjected, control morpholino (MO), or a second morpholino (MO2)-injected zygotes) per experiment. The percentage of embryos reaching each embryo stage is shown. Mor: morula, Blast: blastocyst. p values are shown from one-tailed unpaired t-tests. b) Plot showing mean±standard error of the mean (SEM) summarizing four independent experiments with a total of 25–45 microinjected zygotes per group (non-microinjected, control or Duxbl siRNAs injected GV oocytes) per experiment. The percentage of embryos reaching each embryo stage is shown. Mor: morula, Blast: blastocyst. p values are shown from one-tailed unpaired t-tests. c) Relative fold change (log2) expression of Duxbl in uninduced or DOX-induced in ESCDUX transfected 36 hours prior to induction with the corresponding siRNAs. Reactions were performed by duplicate in two different ESCDUX lines. Two independent experiments were performed but one representative is shown. p value is shown from one-tailed unpaired t-test. d) Pie chart showing percentages of genotypes from Duxbl+/Δ crossings at P14 after F1 generation. e) Gel showing PCR results from genotyping all 8C-stage embryos obtained from Duxbl+/Δ crossings. The identity of the bands obtained by PCR was confirmed by genotyping on positive and negative controls at least two times. f) Gene set enrichment analysis (PANTHER gene sets) according to differentially expressed genes observed in Duxbl Δ/Δ embryos compared to Duxbl+/Δ/Duxbl+/+ embryos (Kobas FDR < 0.2).
Extended Data Figure 7: DUXBL gains access at DUX-bound sites following DUX expression.
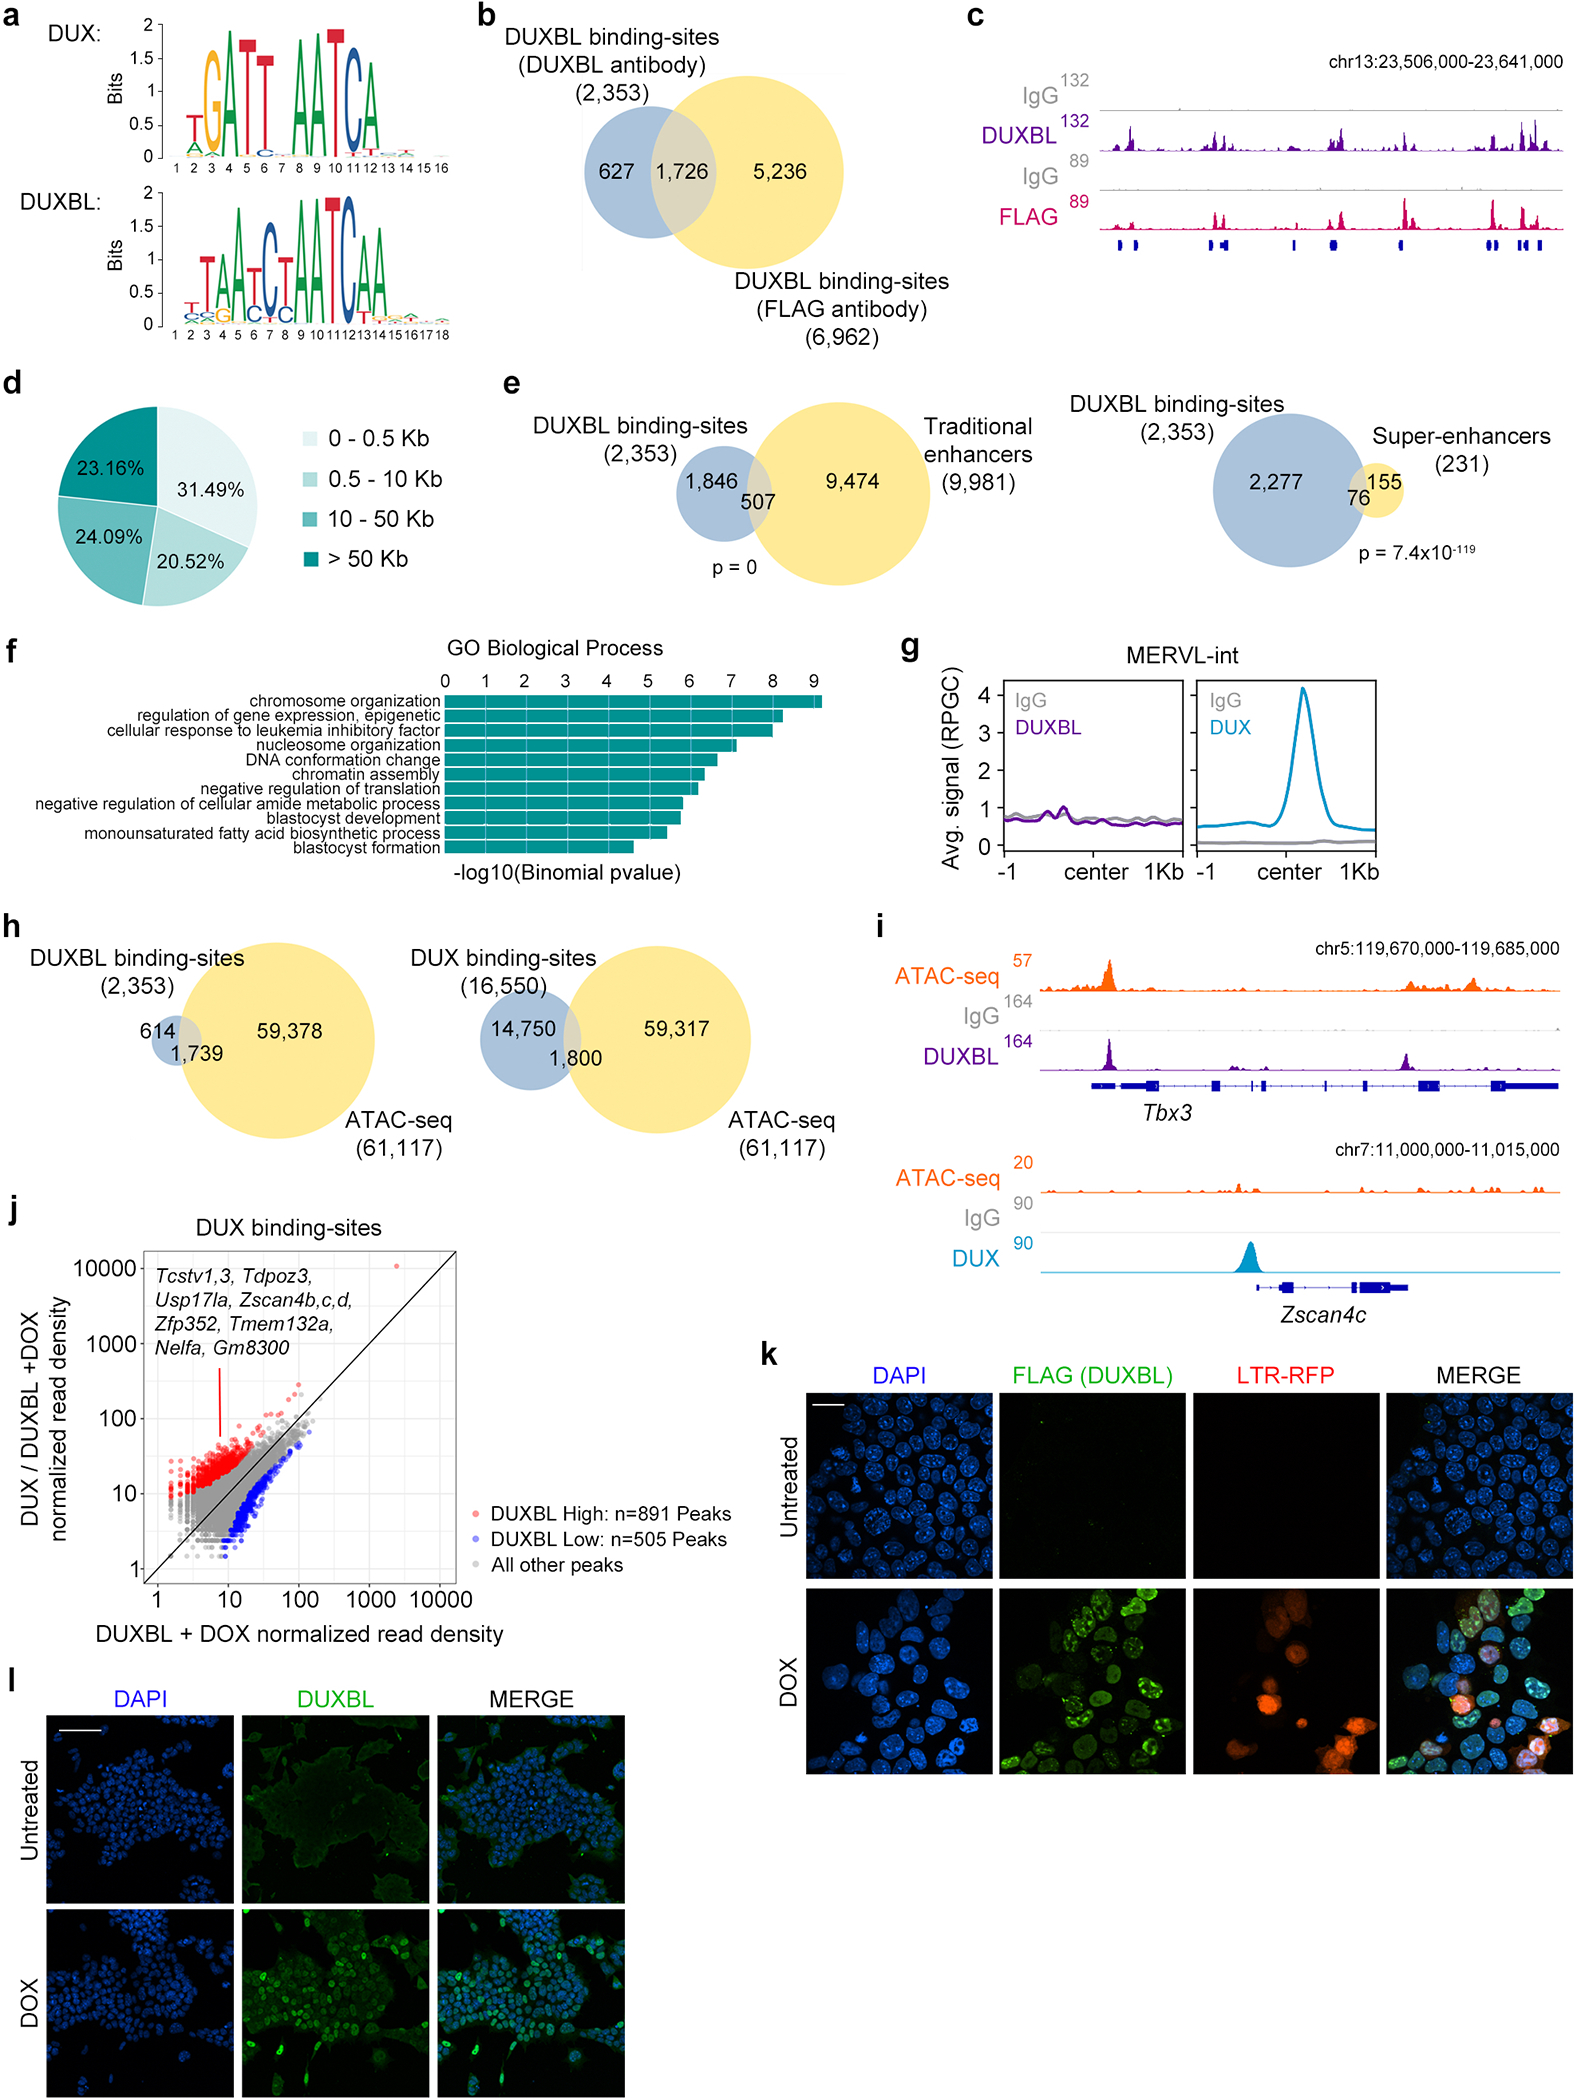
a) Predicted binding sites for DUX and DUXBL (Jaspar database). b) Venn diagrams showing the number of DUXBL peaks overlapping between those identified with DUXBL antibodies (blue) and FLAG antibodies (yellow) in ESCDUXBL. c) Genome browser tracks corresponding to individual samples from (b) showing DUXBL occupancy. Input (IgG) is shown as control. For (b,c), two independent experiments with two independent ESC lines were performed. d) Pie chart showing the genomic distance of DUXBL peaks from gene TSS. e) Venn diagrams showing the number of DUXBL peaks overlapping with traditional ESC enhancers (left) and ESC super-enhancers (SE, right). Enhancer data obtained from31,32. p values shown are from two-tailed Fisher’s exact test. f) Gene ontology (GO) terms obtained from analyzing DUXBL peaks. p-values were obtained from a binomial test. g) CUT&RUN read density plot (RPGC) showing DUXBL and DUX enrichment at MERVL-int elements in DOX-treated ESCDUXBL. Data from DUX-expressing ESC was obtained from5. Input (IgG) is shown as control. Data from one representative ESC line is shown. h) Venn diagrams showing the number of DUXBL (left panel, blue) and DUX peaks (right panel, blue) overlapping with accessible regions in ESC (yellow). ATAC-seq data was obtained from33. i) Genome browser tracks from individual samples showing DUXBL and DUX occupancy as well as ATACseq signal in DOX-treated WT ESC expressing DUX or DUXBL. Data from DUX-expressing ESC and ATACseq experiments were obtained from5,33. Input (IgG) is shown as control. j) Plot showing DUXBL enrichment over DUX-bound sites in the condition of DUX/DUXBL co-expression compared to only DUXBL expression. We used a |og2(FC) cutoff of >1 and p-value <0.01 to define differentially enriched sites. Representative genes in proximity to DUX-bound sites enriched for DUXBL binding are shown. Two independent experiments using one ESC line were performed but data from one representative experiment is shown. k) Immunofluorescence analysis of DUXBL (FLAG) in untreated or DOX-treated LTR-RFP reporter ESCDUXBL/DUX. Scale bar, 20 μm. l) Immunofluorescence analysis of DUXBL in untreated or DOX-treated ESCDUXBL. In (k and l), two independent experiments were performed but one representative is shown. DAPI was used to visualize nuclei. Scale bar, 100 μm.
Extended Data Figure 8: DUXBL interacts with the TRIM33/TRIM24 complex.
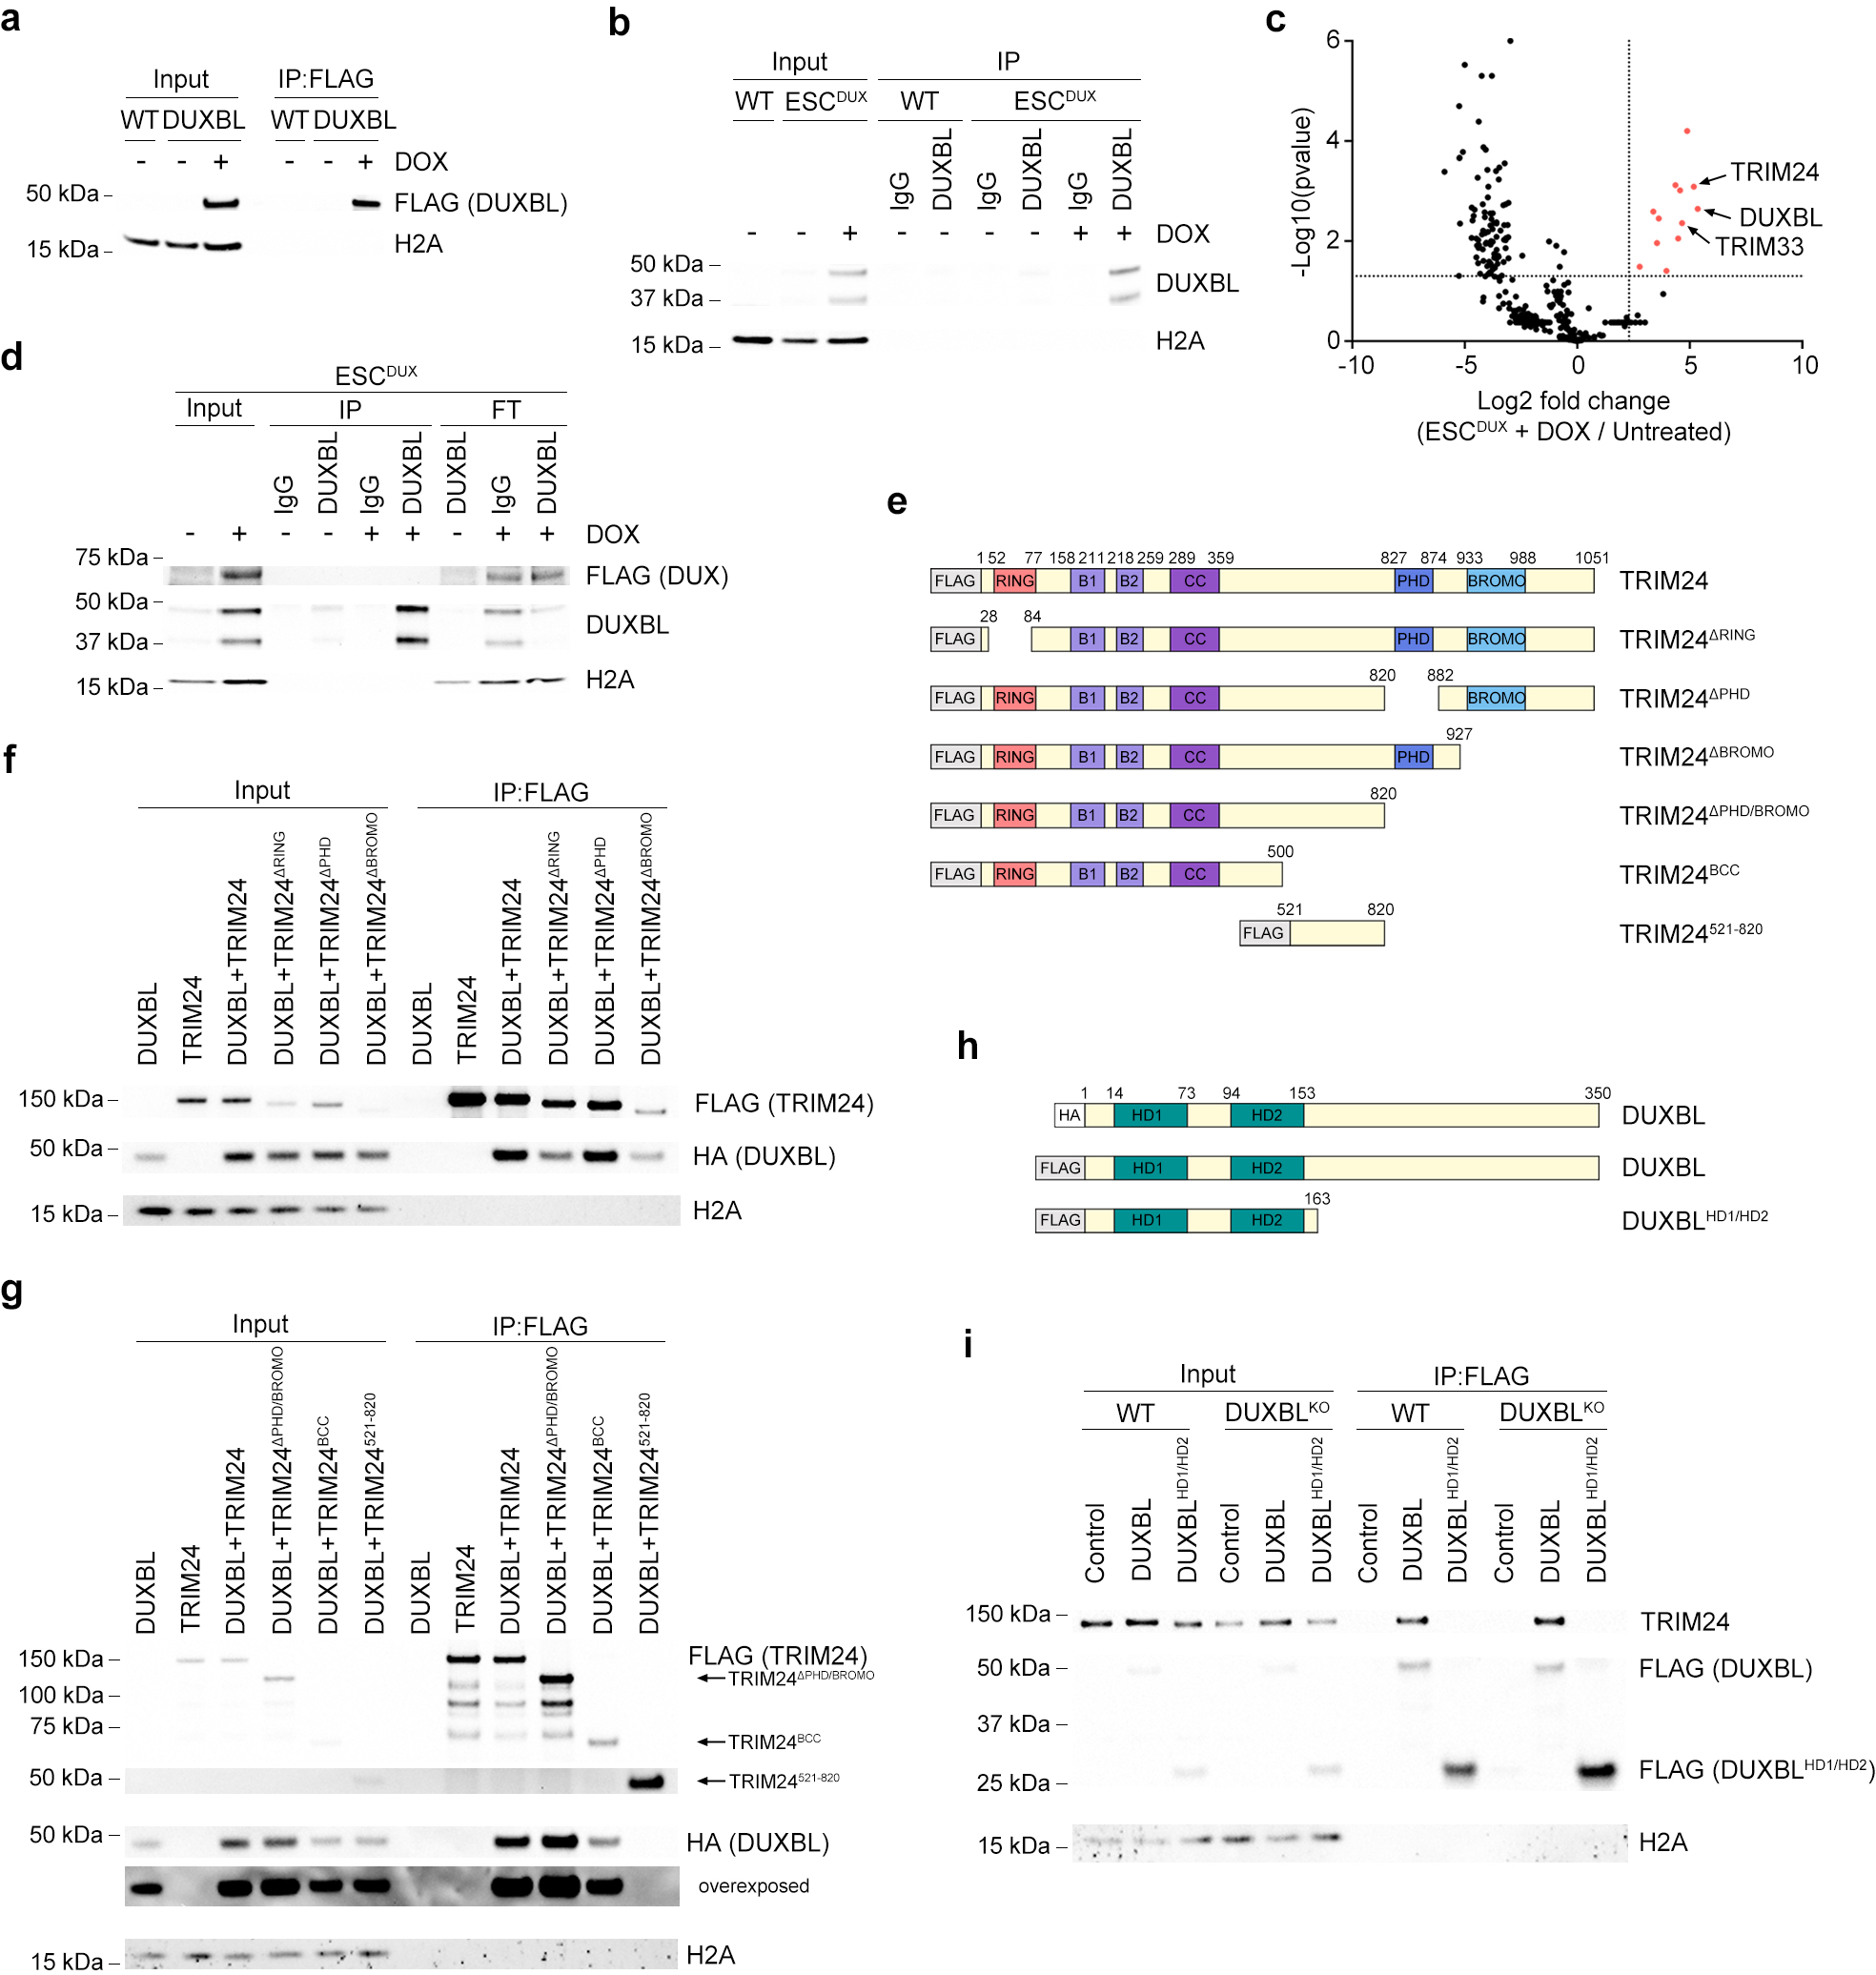
a, b) Western blot analysis of the indicated proteins performed with total protein extracts (input) and DUXBL immunoprecipitates (10% of total IP) obtained from untreated or DOX-treated ESCDUXBL (a) or untreated or DOX-treated ESCDUX (b). c) Volcano plot showing the enrichment of proteins obtained from endogenous DUXBL immunoprecipitation followed by mass spectrometry (IP-MS) analysis in two independent WT untreated or DOX-treated ESCDUX. d) Western blot analyses of the indicated proteins performed with total extracts (input) and DUXBL immunoprecipitates (IP) obtained from untreated and doxycycline treated ESCDUX. We also included the flowthrough (FT) following the immunoprecipitation to show the specific depletion of DUXBL where corresponds. e) Schematic representation of the different TRIM24 mutants used in our immunoprecipitation assays. f, g) Western blot analysis of the indicated proteins performed with total protein extracts (input) and FLAG pulldowns obtained from DOX-treated ESC containing stably transfected Piggy-bac constructs encoding for HA-tagged DUXBL and/or each of the different FLAG-tagged TRIM24 mutants. h) Schematic representation of the different DUXBL protein forms used in our immunoprecipitation assays. i) Western blot analysis of the indicated proteins performed with total protein extracts (input) and FLAG pulldowns obtained from DOX-treated DUXBLKO ESC containing stably transfected Piggy-bac constructs encoding for each of the different FLAG-tagged DUXBL protein forms. TRIM24 endogenous levels are shown. Two independent experiments were performed in (a, b, d, f, g and i) but one representative is shown.
Extended Data Figure 9: DUXBL/TRIM33/TRIM24 colocalize at DUX-induced nuclear foci.
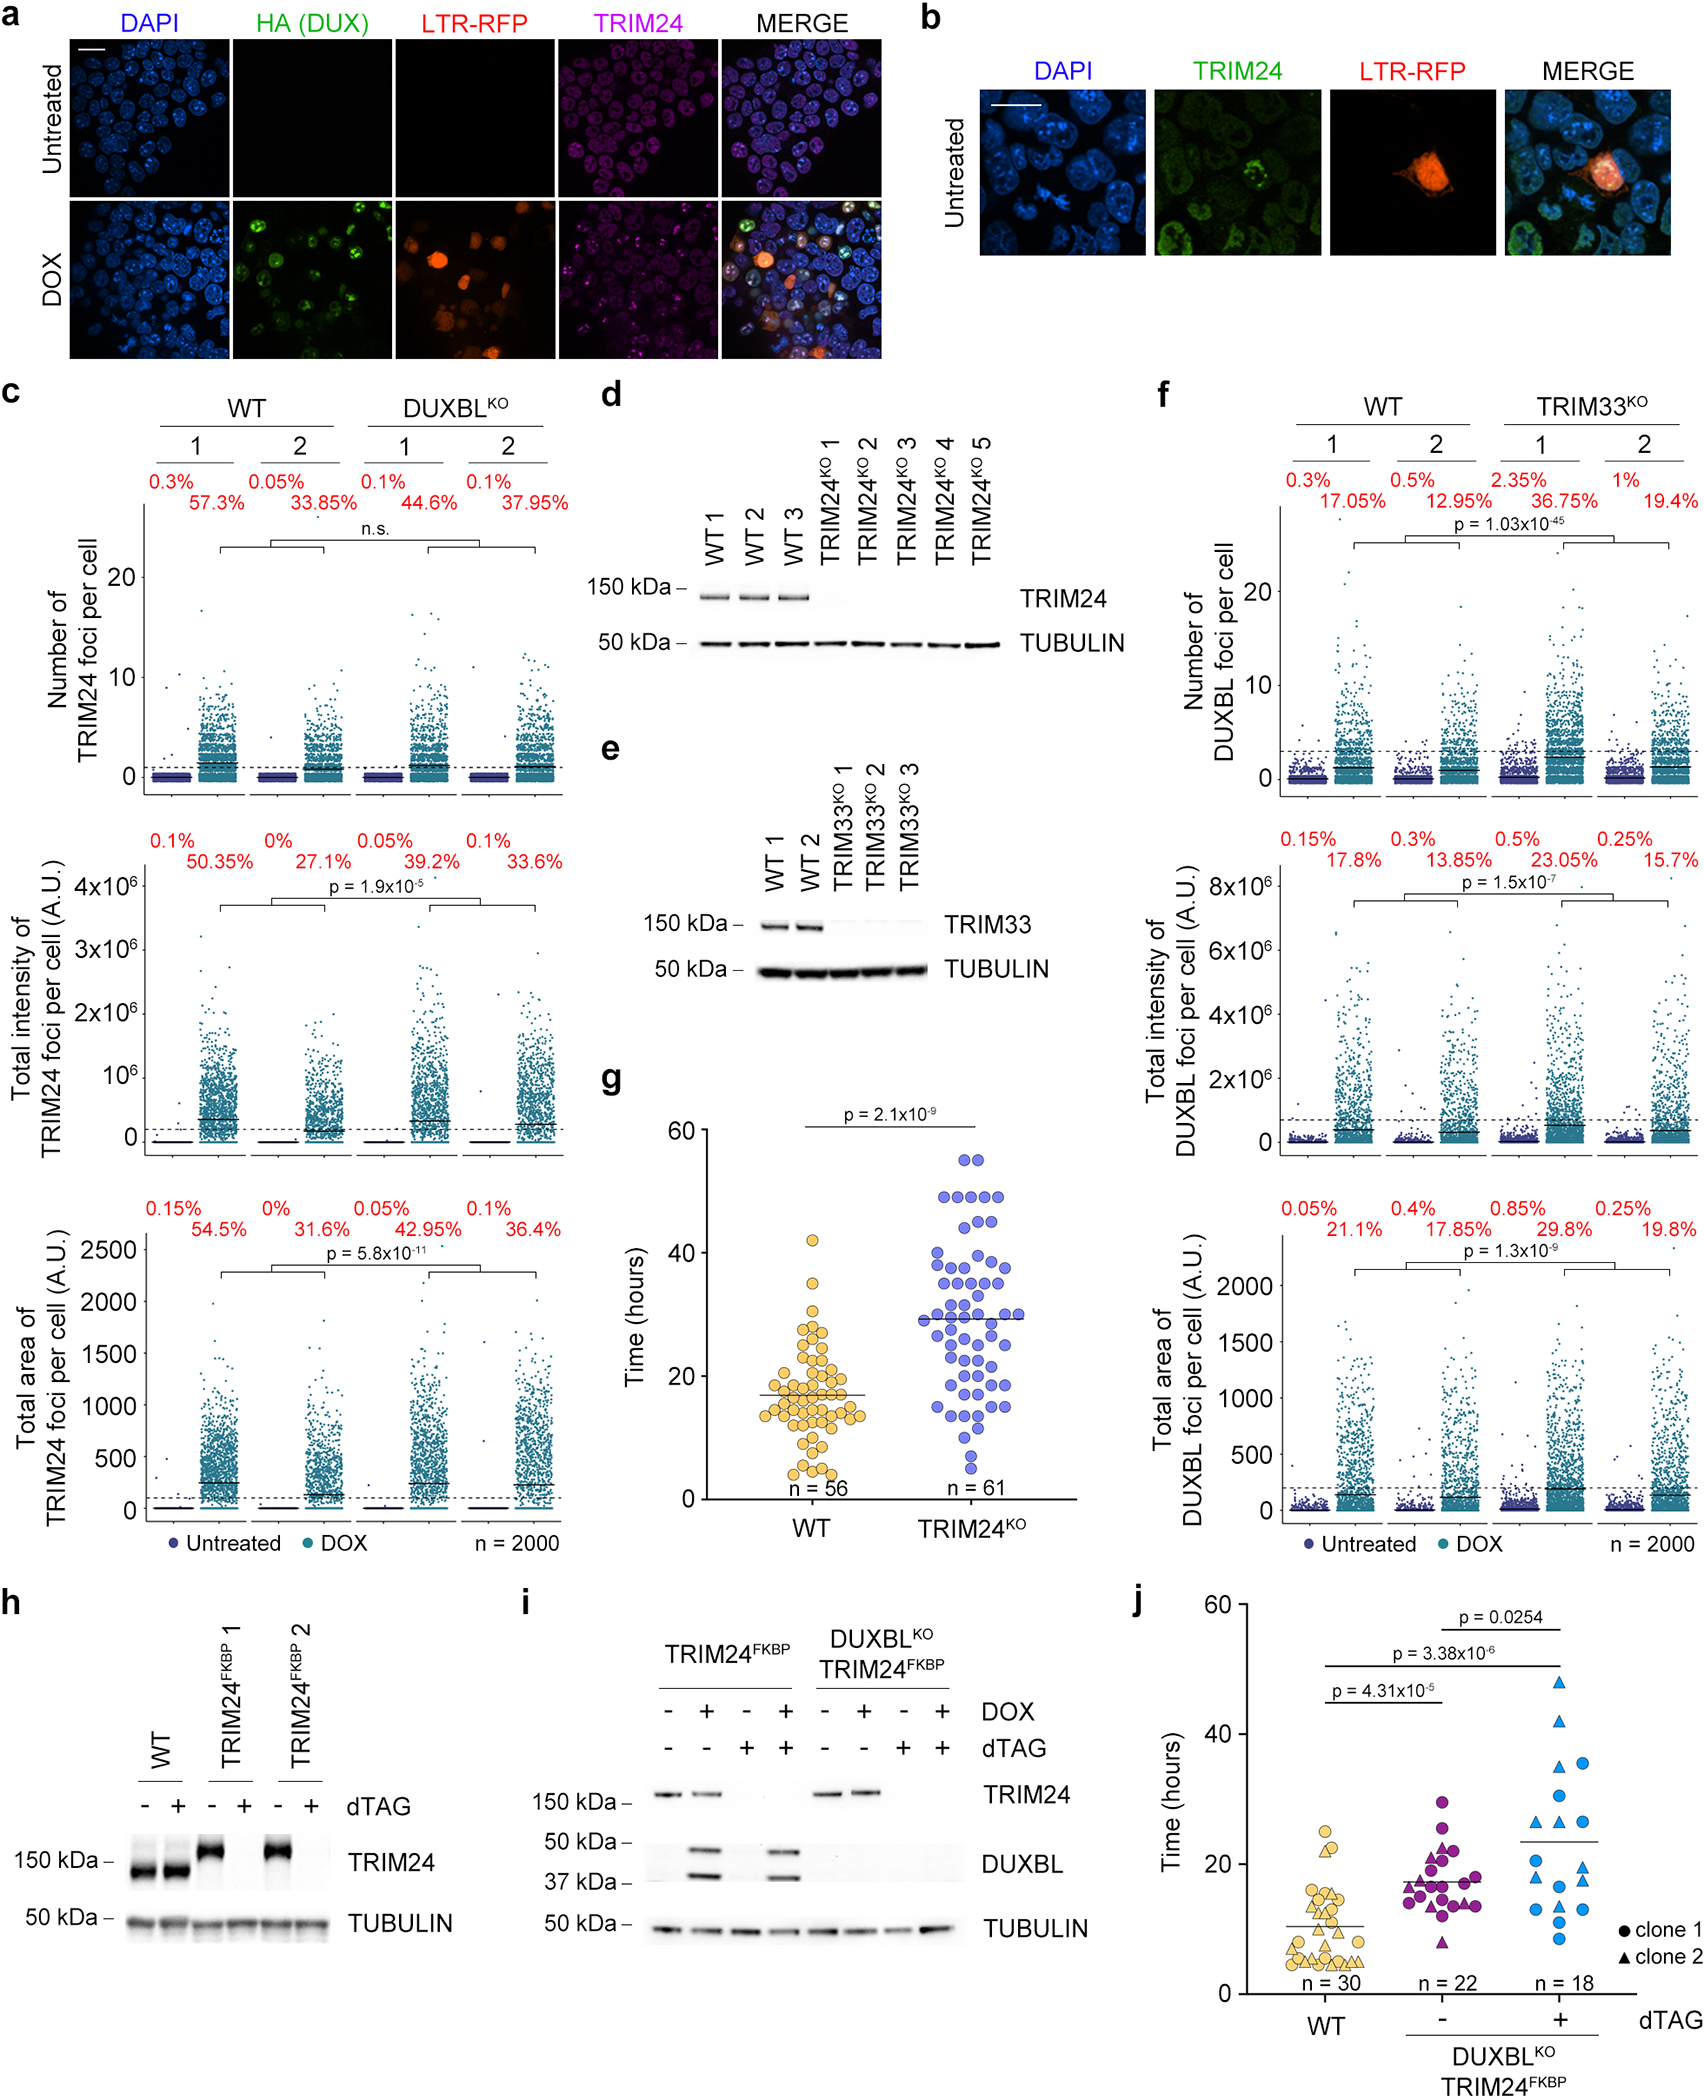
a) Immunofluorescence analysis of DUX (HA) and endogenous TRIM24 in untreated or DOX-treated ESCDUX−2XHA. Scale bars, 20 μm. b) Immunofluorescence analysis of endogenous TRIM24 in endogenous 2CLC observed in LTR-RFP reporter WT ESC. Scale bars, 20 μm. For (a,b), DAPI was used to visualize nuclei and two independent experiments were performed but one representative is shown. c) High-throughput imaging (HTI) quantification of the number, total intensity and area of TRIM24 foci (upper, middle and lower panel, respectively) per cell in untreated or DOX-treated LTR-RFP reporter WT or DUXBLKO ESCDUX. d) Western blot analysis of TRIM24 performed in WT and TRIM24KO ESCDUX. e) Western blot analysis of TRIM33 performed in WT and TRIM33KO ESCDUX lysates. f) HTI quantification of the number, total intensity and area of DUXBL foci (upper, middle and lower panel, respectively) per cell in untreated or DOX-treated LTR-RFP reporter WT or TRIM33KO ESCDUX. For (c and f) Percentages of cells above the threshold (dotted line) are indicated. Center lines indicate mean values. n=2000; p values are shown from one-tailed unpaired t-tests. Two independent experiments using at least two WT, DUXBLKO ESCDUX or TRIM33KO ESCDUX clones were performed but one representative is shown. g) Graph showing 2CLC residency time evaluated by using the LTR-RFP reporter in DOX-treated WT and TRIM24KO ESCDUX. p value is shown from a two-tailed unpaired t-test. Plot was generated by using data from two independent ESC lines per genotype. h) Western blot analysis of TRIM24 performed in WT and TRIM24FKBP ESCDUX. i) Western blot analysis of TRIM24 and DUXBL performed in untreated and DOX/dTAG-treated TRIM24FKBP and DUXBLKO; TRIM24FKBP ESCDUX for 16 hours. For (d,e,h,i), tubulin levels were used as loading control and two independent experiments were performed but one representative is shown. j) Graph showing 2CLC residency time evaluated by using the LTR-RFP reporter in dTAG-treated WT and DUXBLKO; TRIM24FKBP ESCDUX. p values are shown from two-tailed unpaired t-tests. Plot was generated by using data from two independent ESC lines per genotype.
Extended Data Figure 10: DUXBL/TRIM24/TRIM33 complex co-localizes with H3K9me3 at DUX-induced nuclear foci.
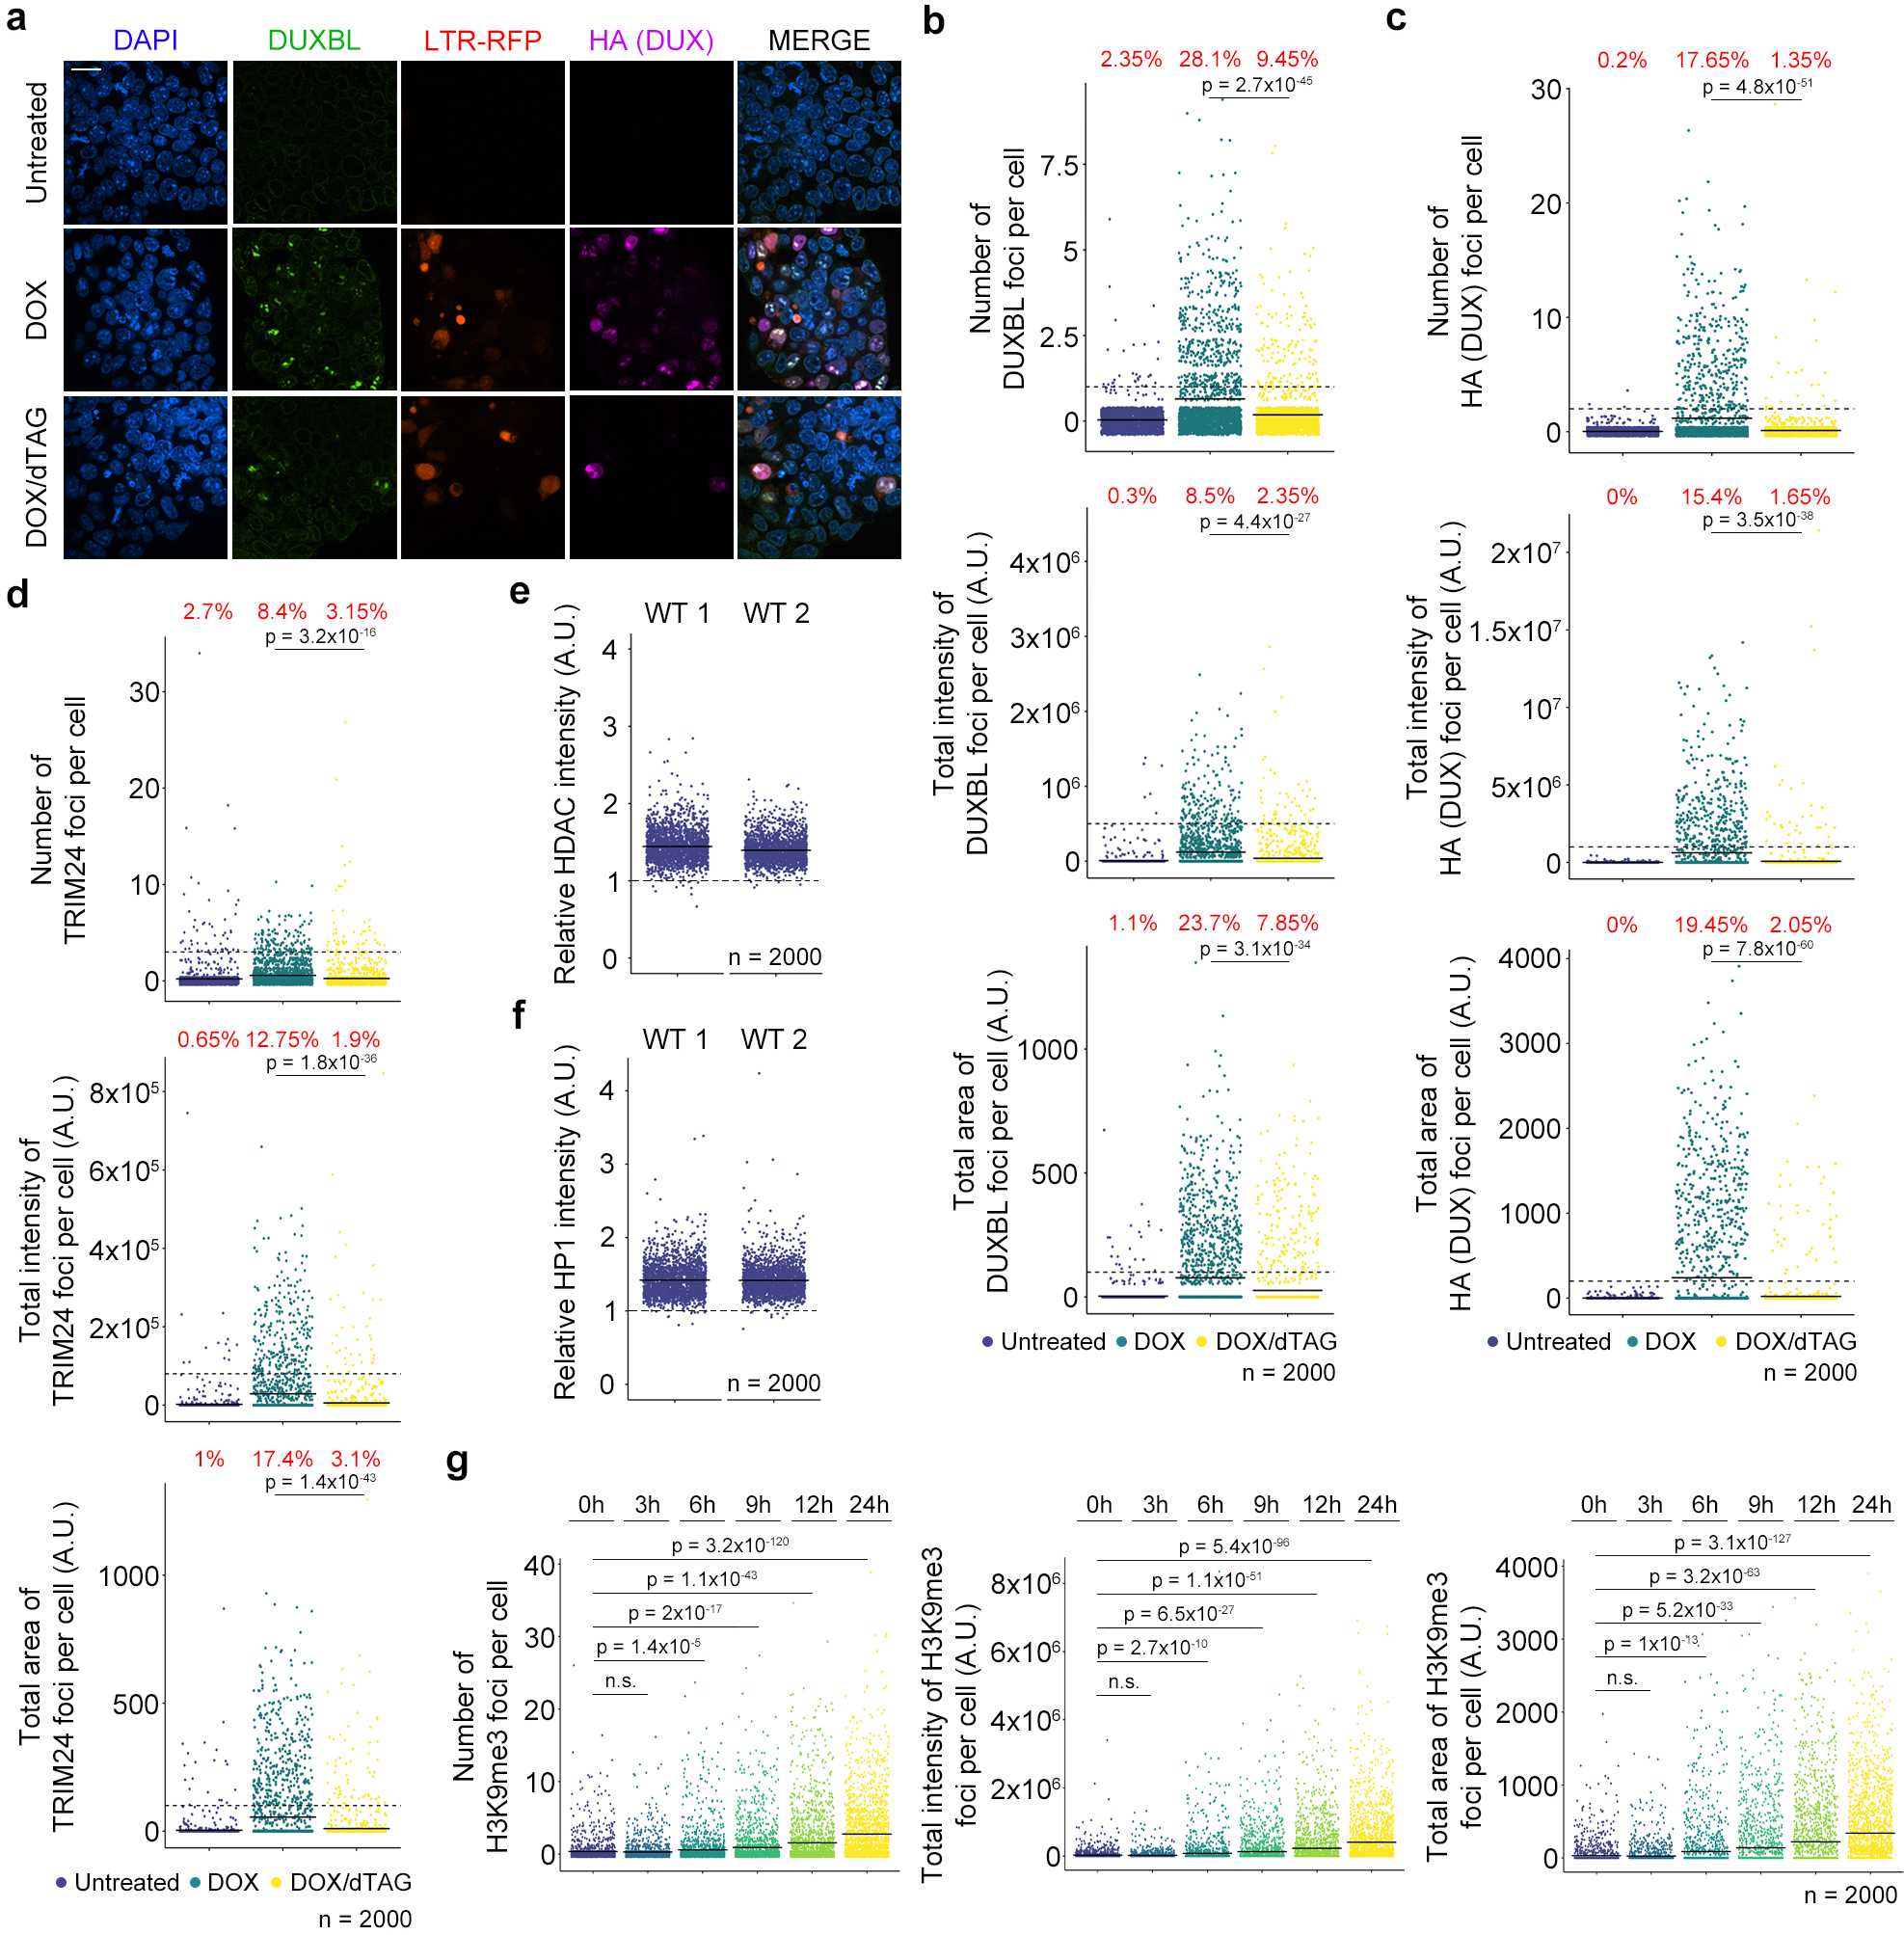
a) Immunofluorescence analysis of DUXBL in untreated or DOX-treated ESCDUX-FKBP. Treatments include DOX for 24 hours or DOX for 16 hours plus 8 hours with dTAG compounds. DAPI was used to visualize nuclei. Scale bar, 20 μm. Three independent experiments were performed but one representative is shown. b) High-throughput imaging (HTI) quantification of the number, total intensity and area of DUXBL foci (upper, middle and lower panel, respectively) per cell in ESCDUX-FKBP treated as in (a). c) HTI quantification of the number, total intensity and area of DUX (HA) foci (upper, middle and lower panel, respectively) per cell in untreated or DOX-treated ESCDUX-FKBP treated as in (a). d) HTI quantification of the number, total intensity and total area of TRIM24 foci (upper, middle and lower panel, respectively) per cell in ESCDUX-FKBP treated as in (a). For (b,c, and d), center lines indicate mean values; n=2000. p values are shown from one-tailed unpaired t-tests. Percentages of cells above the threshold (dotted line) are indicated. At least, two independent experiments were performed but one representative experiment is shown. e, f) Plot showing the ratio for HDAC (e) and HP1 (f) between the fluorescence intensity found at TRIM24 foci and the mean nuclear intensity per cell detected in DOX-treated LTR-RFP reporter ESCDUX. Center lines indicate mean values. n=2000. Two independent experiments using two ESCDUX clones were performed but one representative is shown. g) HTI quantification of the number, total intensity and area of H3K9me3 foci (right, middle and left panel, respectively) per cell in untreated or DOX-treated LTR-RFP reporter ESCDUX. Center lines indicate mean values. n=2000; p values are shown from one-tailed unpaired t-tests. Three independent experiments using at least two ESCDUX clones were performed but one representative is shown.
Supplementary Material
ACKNOWLEDGMENTS
We thank principal investigators from the Laboratory of Genome Integrity for helpful comments and discussion on this work. We thank Kikuë Tachibana and Wataru Kobayashi for suggestions and critical reading of the manuscript. We also thank Mariam Malik, David Goldstein and the CCR Genomics Core for sequencing support, Ferenc Livak, Shafi Siddiqui and the CCR Flow cytometry Core, Gianluca Pegoraro and the High-Throughput Imaging Facility and Michael Kruhlak and the Microscopy Core for experimental support at the NCI, to the Epigenomics and DNA Sequencing, Fluorescence Microscopy and Imaging Core facilities at NIEHS and to the core facilities in MPI-BN for support with mouse transgenics (Sonja Krüger, Susanne Kreutzer and Daniel Heil). Research in S.R. and C.J.W. laboratory is supported by the Intramural Research Program of the NIH. T.O. is supported by a postdoctoral fellowship of the Helen Hay Whitney Foundation. Research in J.K. laboratory was supported by the Max Planck Society and the DFG Excellence Cluster ECCPS/CPI (Exc2026). D.B. is supported by the R01 grant 1R01AR081228–01.
Footnotes
COMPETING INTERESTS
The authors declare no competing interests.
CODE AVAILABILITY
The code used in this manuscript to analyze Cut&Run data and expression of transposable elements can be found in the following github repositories:
DATA AVAILABILITY
The proteomics data and search results associated with this study have been deposited to the ProteomeXchange Consortium via the MassIVE partner repository with the dataset identifier PXD047807, project doi:10.25345/C5XW4867R. The sequencing data generated in this study have been deposited in the Gene Expression Omnibus database under accession code GSE210892 and GSE213703. Datasets obtained from publicly available sources include GSE98149, GSE95517, GSE45719, GSE85627, GSE66582 and GSE97304 (https://www.ncbi.nlm.nih.gov/geo/query/acc.cgi?acc= GSE98149 / GSE95517 / GSE45719 / GSE85627 / GSE66582 and GSE97304, respectively). Additional data and/or reagents that support the findings of this study are available from the corresponding authors upon reasonable request. Source data are provided with this paper.
REFERENCES
- 1).Riveiro AR, & Brickman JM From pluripotency to totipotency: An experimentalist’s guide to cellular potency. Development (Cambridge, England) 147, dev189845 (2020). [DOI] [PubMed] [Google Scholar]
- 2).Sha QQ, Zhang J, & Fan HY A story of birth and death: mRNA translation and clearance at the onset of maternal-to-zygotic transition in mammals. Biology of Reproduction 101, 579–590 (2019). [DOI] [PubMed] [Google Scholar]
- 3).Schultz KN, & Harrison MM Mechanisms regulating zygotic genome activation. Nature Reviews Genetics 20, 221–234 (2019). [DOI] [PMC free article] [PubMed] [Google Scholar]
- 4).Jukamm D, Shariati SAM, & Skotheim JM Zygotic genome activation in vertebrates. Developmental Cell, 42, 316–332 (2017). [DOI] [PMC free article] [PubMed] [Google Scholar]
- 5).Hendrickson PG, Doráis JA, Grow EJ, Whiddon JL, Lim JW, Wike CL, Weaver BD, Pflueger C, Emery BR, Wilcox AL, Nix DA, Peterson CM, Tapscott SJ, Carrell DT. & Cairns BR. Conserved roles of mouse DUX and human DUX4 in activating cleavage-stage genes and MERVL/HERVL retrotransposons. Nat. Genet. 49, 925–934 (2017). [DOI] [PMC free article] [PubMed] [Google Scholar]
- 6).De Iaco A, Planet E, Coluccio A, Verp S, Duc J & Trono D DUX-family transcription factors regulate zygotic genome activation in placental mammals. Nat. Genet. 49, 941–945 (2017). [DOI] [PMC free article] [PubMed] [Google Scholar]
- 7).Whiddon JL, Langford AT, Wong CJ, Zhong JW & Tapscott SJ Conservation and innovation in the DUX4-family gene network. Nat. Genet. 49, 935–940 (2017). [DOI] [PMC free article] [PubMed] [Google Scholar]
- 8).Macfarlan TS, Gifford WD, Driscoll S, Lettieri K, Rowe HM, Bonanomi D, Firth A, Singer O, Trono D & Pfaff SL. Embryonic stem cell potency fluctuates with endogenous retrovirus activity. Nature 487, 57–63 (2012). [DOI] [PMC free article] [PubMed] [Google Scholar]
- 9).Huang Y, Kim JK, Do DV, Lee C, Penfold CA, Zylicz JJ, Marioni JC, Hackett JA & Surani MA Stella modulates transcriptional and endogenous retrovirus programs during maternal-to-zygotic transition. Elife 6, e22345 (2017). [DOI] [PMC free article] [PubMed] [Google Scholar]
- 10).Sakashita A, Kitano T, Ishizu H, Guo Y, Masuda H, Ariura M, Murano K and Siomi H Transcription of MERVL retrotransposons is required for preimplantation embryo development. Nat. Genet. doi: 10.1038/s41588-023-01324-y (2023). [DOI] [PMC free article] [PubMed] [Google Scholar]
- 11).Guo M, Zhang Y, Zhou J, Bi Y, Xu J, Xu C, Kou X, Zhao Y, Li Y, Tu Z, Liu K, Lin J, Yang P, Gao S & Wang Y Precise temporal regulation of Dux is important for embryo development. Cell Res. 29, 956–959 (2019). [DOI] [PMC free article] [PubMed] [Google Scholar]
- 12).Zuo F, Jiang J, Fu H, Yan K, Liefke R, Zhang J, Hong Y, Chang Z, Liu N, Wang Z & Xi Q A TRIM66/DAX1/Dux axis suppresses the totipotent 2-cell-like state in murine embryonic stem cells. Cell Stem Cell 29, 948–961 (2022). [DOI] [PubMed] [Google Scholar]
- 13).Yan YL, Zhang C, Hao J, Wang XL, Ming J, Mi L, Na J, Hu X & Wang Y DPPA2/4 and SUMO E3 ligase PIAS4 opposingly regulate zygotic transcriptional program. PLoS Biol. 17, e3000324 (2019). [DOI] [PMC free article] [PubMed] [Google Scholar]
- 14).Xie SQ, Leeke BJ, Whilding C, Wagner RT, Garcia-Llagostera F, Low Y, Chammas P, Cheung NT, Dormann D, McManus MT & Percharde M Nucleolar-based Dux repression is essential for embryonic two-cell stage exit. Genes Dev. 36, 331–347 (2022). [DOI] [PMC free article] [PubMed] [Google Scholar]
- 15).Ruebel ML, Vincent KA, Schall PZ, Wang K & Latham KE SMCHD1 terminates the first embryonic genome activation event in mouse two-cell embryos and contributes to a transcriptionally repressive state. Am. J. Physiol. Cell Physiol. 317, C655–C664 (2019). [DOI] [PMC free article] [PubMed] [Google Scholar]
- 16).Yang F, Huang X, Zang R, Chen J, Fidalgo M, Sanchez-Priego C, Yang J, Caichen A, Ma F, Macfarlan T, Wang H, Gao S, Zhou H & Wang DUX -miR-344-ZMYM2-Mediated Activation of MERVL LTRs Induces a Totipotent 2C-like State. Cell Stem Cell 26, 234–250 (2020). [DOI] [PMC free article] [PubMed] [Google Scholar]
- 17).Garland W, Müller I, Wu M, Schmid M, Imamura K, Rib L, Sandelin A, Helin K & Jensen TH Chromatin modifier HUSH co-operates with RNA decay factor NEXT to restrict transposable element expression. Mol. Cell, 82, 1691–1707 (2022). [DOI] [PMC free article] [PubMed] [Google Scholar]
- 18).Ishiuchi T, Enriquez-Gasca R, Mizutani E, Bošković A, Ziegler-Birling C, Rodriguez-Terrones D, Wakayama T, Vaquerizas JM and Torres-Padilla ME Early embryonic-like cells are induced by downregulating replication-dependent chromatin assembly. Nat. Struct. Mol. Biol. 22, 662–671 (2015). [DOI] [PubMed] [Google Scholar]
- 19).Clapp J, Mitchell LM, Bolland DJ, Fantes J, Corcoran AE, Scotting PJ, Armour JA and Hewitt JE Evolutionary conservation of a coding function for D4Z4, the tandem DNA repeat mutated in facioscapulohumeral muscular dystrophy. Am. J. Hum. Genet. 81, 264–279 (2007). [DOI] [PMC free article] [PubMed] [Google Scholar]
- 20).Olbrich T, Vega-Sendino M, Tillo D, Wu W, Zolnerowich N, Pavani R, Tran AD, Domingo CN, Franco M, Markiewicz-Potoczny M, Pegoraro G, FitzGerald PC, Kruhlak MJ, Lazzerini-Denchi E, Nora EP, Nussenzweig A & Ruiz S CTCF is a barrier for 2C-like reprogramming. Nat. Commun. 12, 4856 (2021). [DOI] [PMC free article] [PubMed] [Google Scholar]
- 21).Choi SH, Gearhart MD, Cui Z, Bosnakovski D, Kim M, Schennum N & Kyba M DUX4 recruits p300/CBP through its C-terminus and induces global H3K27 acetylation changes. Nucleic Acids Res. 44, 5161–5173 (2016). [DOI] [PMC free article] [PubMed] [Google Scholar]
- 22).Leidenroth A & Hewitt JE A family history of DUX4: phylogenetic analysis of DUXA, B, C and Duxbl reveals the ancestral DUX gene. BMC Evol. Biol. 10, 364 (2010). [DOI] [PMC free article] [PubMed] [Google Scholar]
- 23).Wu SL, Tsai MS, Wong SH, Hsieh-Li HM, Tsai TS, Chang WT, Huang SL, Chiu CC & Wang SH Characterization of genomic structures and expression profiles of three tandem repeats of a mouse double homeobox gene: Duxbl. Dev. Dyn. 239, 927–940 (2010). [DOI] [PubMed] [Google Scholar]
- 24).Klein F, Mitrovic M, Roux J, Engdahl C, von Muenchow L, Alberti-Servera L, Fehling HJ, Pelczar P, Rolink A & Tsapogas P The transcription factor Duxbl mediates elimination of pre-T cells that fail β-selection. J. Exp. Med. 216, 638–655 (2019). [DOI] [PMC free article] [PubMed] [Google Scholar]
- 25).Preussner J, Zhong J, Sreenivasan K, Günther S, Engleitner T, Künne C, Glatzel M, Rad R, Looso M, Braun T & Kim J Oncogenic Amplification of Zygotic Dux Factors in Regenerating p53-Deficient Muscle Stem Cells Defines a Molecular Cancer Subtype. Cell Stem Cell 23, 794–805 (2018). [DOI] [PubMed] [Google Scholar]
- 26).Deng Q, Ramsköld D, Reinius B & Sandberg R Single-cell RNA-seq reveals dynamic, random monoallelic gene expression in mammalian cells. Science 343, 193–6 (2014). [DOI] [PubMed] [Google Scholar]
- 27).Wu J, Huang B, Chen H, Yin Q, Liu Y, Xiang Y, Zhang B, Liu B, Wang Q, Xia W, Li W, Li Y, Ma J, Peng X, Zheng H, Ming J, Zhang W, Zhang J, Tian G, Xu F, Chang Z, Na J, Yang X & Xie W The landscape of accessible chromatin in mammalian preimplantation embryos. Nature 534, 652–657 (2016). [DOI] [PubMed] [Google Scholar]
- 28).Iturbide A, Ruiz Tejada Segura ML, Noll C, Schorpp K, Rothenaigner I, Ruiz-Morales ER, Lubatti G, Agami A, Hadian K, Scialdone A & Torres-Padilla ME Retinoic acid signaling is critical during the totipotency window in early mammalian development. Nat. Struct. Mol. Biol. 28, 521–532 (2021). [DOI] [PMC free article] [PubMed] [Google Scholar]
- 29).Shen H, Yang M, Li S, Zhang J, Peng B, Wang C, Chang Z, Ong J & Du P Mouse totipotent stem cells captured and maintained through spliceosomal repression. Cell 184, 2843–2859 (2021). [DOI] [PubMed] [Google Scholar]
- 30).Raccaud M, Friman ET, Alber AB, Agarwal H, Deluz C, Kuhn T, Gebhardt JCM and Suter DM Mitotic chromosome binding predicts transcription factor properties in interphase. Nat. Commun. 10, 487 (2019). [DOI] [PMC free article] [PubMed] [Google Scholar]
- 31).Hnisz D, Abraham BJ, Lee TI, Lau A, Saint-André V, Sigova AA, Hoke HA & Young RA Super-enhancers in the control of cell identity and disease. Cell 155, 934–947 (2013). [DOI] [PMC free article] [PubMed] [Google Scholar]
- 32).Whyte WA, Orlando DA, Hnisz D, Abraham BJ, Lin CY, Kagey MH, Rahl PB, Lee TI & Young RA Master transcription factors and mediator establish super-enhancers at key cell identity genes. Cell 153, 307–319 (2013). [DOI] [PMC free article] [PubMed] [Google Scholar]
- 33).Xie L, Torigoe SE, Xiao J, Mai DH, Li L, Davis FP, Dong P, Marie-Nelly H, Grimm J, Lavis L, Darzacq X, Cattoglio C, Liu Z & Tjian R A dynamic interplay of enhancer elements regulates Klf4 expression in naïve pluripotency. Genes Dev. 31, 1795–1808 (2017). [DOI] [PMC free article] [PubMed] [Google Scholar]
- 34).Herquel B, Ouararhni K & Davidson I The TIF1α-related TRIM cofactors couple chromatin modifications to transcriptional regulation, signaling and tumor suppression. Transcription 2, 231–236 (2011). [DOI] [PMC free article] [PubMed] [Google Scholar]
- 35).Herquel B, Ouararhni K, Khetchoumian K, Ignat M, Teletin M, Mark M, Béchade G, Van Dorsselaer A, Sanglier-Cianférani S, Hamiche A, Cammas F, Davidson I & Losson R Transcription cofactors TRIM24, TRIM28, and TRIM33 associate to form regulatory complexes that suppress murine hepatocellular carcinoma. Proc. Natl. Acad. Sci. USA 108, 8212–8217 (2011). [DOI] [PMC free article] [PubMed] [Google Scholar]
- 36).Nabet B, Roberts JM, Buckley DL, Paulk J, Dastjerdi S, Yang A, Leggett AL, Erb MA, Lawlor MA, Souza A, Scott TG, Vittori S, Perry JA, Qi J, Winter GE, Wong KK, Gray NS & Bradner JE The dTAG system for immediate and target-specific protein degradation. Nat. Chem. Biol. 14, 431–441 (2018). [DOI] [PMC free article] [PubMed] [Google Scholar]
- 37).Maksakova IA, Thompson PJ, Goyal P, Jones SJ, Singh PB, Karimi MM & Lorincz MC Distinct roles of KAP1, HP1 and G9a/GLP in silencing of the two-cell-specific retrotransposon MERVL in mouse ES cells. Epigenetics Chromatin 6, 15 (2013). [DOI] [PMC free article] [PubMed] [Google Scholar]
- 38).Rowe HM, Kapopoulou A, Corsinotti A, Fasching L, Macfarlan TS, Tarabay Y, Viville S, Jakobsson J, Pfaff SL & Trono D TRIM28 repression of retrotransposon-based enhancers is necessary to preserve transcriptional dynamics in embryonic stem cells. Genome Res. 23, 452–61 (2013). [DOI] [PMC free article] [PubMed] [Google Scholar]
- 39).Dan J, Yang J, Liu Y, Xiao A & Liu L Roles for Histone Acetylation in Regulation of Telomere Elongation and Two-cell State in Mouse ES Cells. J. Cell Physiol. 230, 2337–2344 (2015). [DOI] [PMC free article] [PubMed] [Google Scholar]
- 40).Wang C, Liu X, Gao Y, Yang L, Li C, Liu W, Chen C, Kou X, Zhao Y, Chen J, Wang Y, Le R, Wang H, Duan T, Zhang Y & Gao S Reprogramming of H3K9me3-dependent heterochromatin during mammalian embryo development. Nat. Cell Biol. 20, 620–631 (2018). [DOI] [PubMed] [Google Scholar]
- 41).Modzelewski AJ, Shao W, Chen J, Lee A, Qi X, Noon M, Tjokro K, Sales G, Biton A, Anand A, Speed TP, Xuan Z, Wang T, Risso D and He L A mouse-specific retrotransposon drives a conserved Cdk2ap1 isoform essential for development. Cell 184, 5541–5558 (2021). [DOI] [PMC free article] [PubMed] [Google Scholar]
- 42).Xu R, Li S, Wu Q, Li C, Jiang M, Guo L, Chen M, Yang L, Dong X, Wang H, Wang C, Liu X, Ou X & Gao S Stage-specific H3K9me3 occupancy ensures retrotransposon silencing in human pre-implantation embryos. Cell Stem Cell 29, 1051–1066 (2022). [DOI] [PubMed] [Google Scholar]
- 43).Asimi V, Sampath Kumar A, Niskanen H, Riemenschneider C, Hetzel S, Naderi J, Fasching N, Popitsch N, Du M, Kretzmer H, Smith ZD, Weigert R, Walther M, Mamde S, Meierhofer D, Wittler L, Buschow R, Timmermann B, Cisse II, Ameres SL, Meissner A & Hnisz D Hijacking of transcriptional condensates by endogenous retroviruses. Nat. Genet. doi: 10.1038/s41588-022-01132-w. Online ahead of print (2022). [DOI] [PMC free article] [PubMed] [Google Scholar]
- 44).Wu K, Liu H, Wang Y, He J, Xu S, Chen Y, Kuang J, Liu J, Guo L, Li D, Shi R, Shen L, Wang Y, Zhang X, Wang J, Pei D & Chen J SETDB1-Mediated Cell Fate Transition between 2C-Like and Pluripotent States. Cell Rep. 30, 25–36 (2020). [DOI] [PubMed] [Google Scholar]
- 45).De Iaco A, Verp S, Offner S, Grun D, & Trono D DUX is a non-essential synchronizer of zygotic genome activation. Development (Cambridge, England) 147, dev.177725 (2019). [DOI] [PMC free article] [PubMed] [Google Scholar]
- 46).Chen Z, & Zhang Y Loss of DUX causes minor defects in zygotic genome activation and is compatible with mouse development. Nature Genetics 51, 947–951(2019). [DOI] [PMC free article] [PubMed] [Google Scholar]
- 47).Guo Y, Kitano T, Murano K, Li TD, Sakashita A, Ishizu H, Sato M & Siomi H Obox4 secures zygotic genome activation upon loss of Dux. BioRxiv 498763, 10.1101/2022.07.04.498763, (2022). [DOI] [Google Scholar]
- 48).Ji S, Chen F, Stein P, Wang J, Zhou Z, Wang L, Zhao Q, Lin Z, Liu B, Xu K, Lai F, Xiong Z, Hu X, Kong T, Kong F, Huang B, Wang Q, Xu Q, Fan Q, Liu L, Williams CJ, Schultz RM and Xie W OBOX regulates mouse zygotic genome activation and early development. Nature 620, 1047–1053 (2023). [DOI] [PMC free article] [PubMed] [Google Scholar]
METHODS-ONLY REFERENCES
- 49).Gambini A, Stein P, Savy V, Grow EJ, Papas BN, Zhang Y, Kenan AC, Padilla-Banks E, Cairns BR & Williams CJ Developmentally Programmed Tankyrase Activity Upregulates β-Catenin and Licenses Progression of Embryonic Genome Activation. Dev. Cell 53, 545–560 (2020). [DOI] [PMC free article] [PubMed] [Google Scholar]
- 50).Zhang Y, Liu T, Meyer CA, Eeckhoute J, Johnson DS, Bernstein BE, Nusbaum C, Myers RM, Brown M, Li W & Liu XS Model-based analysis of ChIP-Seq (MACS). Genome Biol. 9, R137 (2008). [DOI] [PMC free article] [PubMed] [Google Scholar]
- 51).Ramírez F, Ryan DP, Grüning B, Bhardwaj V, Kilpert F, Richter AS, Heyne S, Dündar F, and Manke T deepTools2: a next generation web server for deep-sequencing data analysis. Nucleic Acids Res. 44, 160–165 (2016). [DOI] [PMC free article] [PubMed] [Google Scholar]
- 52).Grant CE, Bailey TL, Noble WS FIMO: scanning for occurrences of a given motif. Bioinformatics, 27, 1017–1018 (2011). [DOI] [PMC free article] [PubMed] [Google Scholar]
- 53).Martin M Cutadapt removes adapter sequences from high-throughput sequencing reads. 10.14806/ej.17.1.200. [DOI] [Google Scholar]
- 54).Dobin A, Davis CA, Schlesinger F, Drenkow J, Zaleski C, Jha S, Batut P, Chaisson M & Gingeras TR STAR: ultrafast universal RNA-seq aligner. Bioinformatics, 29, 15–21 (2013). [DOI] [PMC free article] [PubMed] [Google Scholar]
- 55).Jin Y, Tam OH, Paniagua E & Hammell M TEtranscripts: a package for including transposable elements in differential expression analysis of RNA-seq datasets. Bioinformatics, 31, 3593–3599 (2015). [DOI] [PMC free article] [PubMed] [Google Scholar]
- 56).Love MI, Huber W & Anders S Moderated estimation of fold change and dispersion for RNA-seq data with DESeq2.Genome Biol. 15, 550 (2014). [DOI] [PMC free article] [PubMed] [Google Scholar]
- 57).Bolger AM, Lohse M & Usadel B Trimmomatic: a flexible trimmer for Illumina sequence data. Bioinformatics 30, 2114–2120 (2014). [DOI] [PMC free article] [PubMed] [Google Scholar]
- 58).Liao Y, Smyth GK & Shi W featureCounts: an efficient general-purpose program for assigning sequence reads to genomic features. Bioinformatics 30, 923–930 (2014). [DOI] [PubMed] [Google Scholar]
- 59).Xie C, Mao X, Huang J, Ding Y, Wu J, Dong S, Knog L, Gao G, Li CY. & Wei L. KOBAS 2.0: a web server for annotation and identification of enriched pathways and diseases. Nucleic Acids Res 39, W316–322 (2011). [DOI] [PMC free article] [PubMed] [Google Scholar]
Associated Data
This section collects any data citations, data availability statements, or supplementary materials included in this article.
Supplementary Materials
Data Availability Statement
The proteomics data and search results associated with this study have been deposited to the ProteomeXchange Consortium via the MassIVE partner repository with the dataset identifier PXD047807, project doi:10.25345/C5XW4867R. The sequencing data generated in this study have been deposited in the Gene Expression Omnibus database under accession code GSE210892 and GSE213703. Datasets obtained from publicly available sources include GSE98149, GSE95517, GSE45719, GSE85627, GSE66582 and GSE97304 (https://www.ncbi.nlm.nih.gov/geo/query/acc.cgi?acc= GSE98149 / GSE95517 / GSE45719 / GSE85627 / GSE66582 and GSE97304, respectively). Additional data and/or reagents that support the findings of this study are available from the corresponding authors upon reasonable request. Source data are provided with this paper.


