
PLOS One logoLink to PLOS One
. 2024 Jun 4;19(6):e0305074. doi: 10.1371/journal.pone.0305074

Association between gait speed deterioration and EEG abnormalities

Daysi García-Agustin 1, Valia Rodríguez-Rodríguez 2,*, Rosa Ma Morgade-Fonte 3,¤, María A Bobes 3, Lídice Galán-García 3
Editor: Ryota Sakurai4
PMCID: PMC11149873  PMID: 38833443

Abstract

Physical and cognitive decline at an older age is preceded by changes that accumulate over time until they become clinically evident difficulties. These changes, frequently overlooked by patients and health professionals, may respond better than fully established conditions to strategies designed to prevent disabilities and dependence in later life. The objective of this study was twofold; to provide further support for the need to screen for early functional changes in older adults and to look for an early association between decline in mobility and cognition. A cross-sectional cohort study was conducted on 95 active functionally independent community-dwelling older adults in Havana, Cuba. We measured their gait speed at the usual pace and the cognitive status using the MMSE. A value of 0.8 m/s was used as the cut-off point to decide whether they presented a decline in gait speed. A quantitative analysis of their EEG at rest was also performed to look for an associated subclinical decline in brain function. Results show that 70% of the sample had a gait speed deterioration (i.e., lower than 0.8 m/s), of which 80% also had an abnormal EEG frequency composition for their age. While there was no statistically significant difference in the MMSE score between participants with a gait speed above and below the selected cut-off, individuals with MMSE scores below 25 also had a gait speed<0.8 m/s and an abnormal EEG frequency composition. Our results provide further evidence of early decline in older adults–even if still independent and active—and point to the need for clinical pathways that incorporate screening and early intervention targeted at early deterioration to prolong the years of functional life in older age.

Introduction

Despite age-related degeneration, older individuals can have a high quality of life if they do not develop cognitive and mobility disorders and become disabled. Yet, disability in older age begins with changes that gradually accumulate and become an incident difficulty [1, 2].

One way to identify early declines is to ask older adults about limitations for performing specific tasks or activities. However, this strategy will depend on their awareness of the difficulty, which might be masked by adopting compensatory modifications to accomplish the relevant tasks [1, 2]. Objective assessment of physical performance, on the other hand, provides direct and unbiased information on essential components of physical function and constitutes a reliable, cost-effective method to detect the presence of early changes.

Among the different components of physical function, gait speed (GS) has been found to be predictive of adverse health outcomes and increased mortality [3, 4]. Several studies have also found that GS deterioration is frequently associated with cognitive decline [5, 6] and with transitioning from mild to severe cognitive impairment [79]. Based on these known associations, GS has been proposed as a useful screening measure to identify older individuals at risk for developing these types of disorders [10, 11].

However, gait is a process that, besides musculoskeletal and sensorial components, also depends on significant contributions from high-order cerebral areas for planning, execution, and control. Therefore, deterioration of GS in older individuals that cannot be attributed to significant peripheral disorders or uncontrolled systemic disease is likely associated with abnormal brain function as part of its underlying physiopathology. Such a brain dysfunction could also be the antecedent of the cognitive impairment frequently seen in association with GS decline and serve as its preclinical marker.

In this study, we assessed the gait speed and cognitive status of a cohort of functionally independent older adults to look for changes in GS and the possible association with preclinical cognitive impairment. We also recorded the participants’ brain electrical activity (electroencephalogram, EEG) at rest to evaluate the integrity of brain function. Given its high sensitivity, EEG is a valuable tool for assessing alterations in cerebral activity associated with functional states and for capturing the dynamic fluctuations linked to cognitive processes, emotions, and neurological conditions [12, 13]. EEG measurements taken during resting states hold predictive value for cognitive task performance [14, 15], as the signal mirrors the functioning of underlying networks.

Our working hypothesis was that a GS decline present in our participants would be associated with a low MMSE score and EEG patterns abnormal for the age. Confirming our hypothesis would support the screening for early declines in functional older people and the inclusion of GS and EEG as part of the assessment pathways aimed at preventing disability at a point where intervention would be most efficient.

Methods

A cross-sectional observational study was carried out on 95 community-dwelling older adults—over 60 years old—who regularly practised mild exercise in the community with an instructor and did not have evident cognitive impairment. All participants were recruited through their family doctor and provided written informed consent. Those with uncontrolled chronic medical conditions or acute illness were excluded (n = 5). The research project was approved by the Ethics Committee of the Cuban Centre for Longevity, Ageing, and Health Studies.

A gait speed test was performed on all participants using the 4-Meter Walk Test commonly employed in physiotherapy and geriatric clinics. Participants were instructed to stand still behind a starting line marked on the floor and then walk at their usual pace for 6 meters. The first and last meters were used as acceleration and deceleration zones, while the middle four were the testing zone (Fig 1). GS was quantified with a stopwatch as the time spent to cover the testing zone (i.e., 4 meters) and was expressed in meters per second (m/s). The average time of two trials was used in the analysis. Participants were divided into two groups according to their GS value: ’NorGS’ was made up of participants who walked 4 m in less than 5 s (i.e., GS > = 0.8 m/s), and ’LowGS’ was made up of participants who walked 4 m in more than 5 s (i.e., GS < 0.8 m/s). The 0.8 m/s cut-off point was based on recommendations made by several authors [5, 16].

Fig 1. Diagram representing the gait speed assessment.

Fig 1

Measurements were performed in a flat and unobstructed space by a trained researcher. Participants were instructed to stand at the beginning of the acceleration zone (first black rectangle covering 1 metre) and, upon a command, to walk at their usual pace, passing the deceleration zone (second black rectangle also covering 1 metre). Gait speed was timed with a stopwatch in the middle 4 metres (time zone, the white rectangle in the diagram).

Besides the GS assessment, participants were assessed with the Spanish version of the Mini-mental State Examination (MMSE) and a 10-minute resting-state EEG. The electrophysiological recording was obtained using a 32-channel system (MEDICID 5–32, Neuronic SA) with nineteen Ag/AgCl electrodes placed on the scalp according to the international 10/20 placement system referenced to linked earlobes. Electrode impedance was kept below 10 kΩ. The following acquisition parameters were employed: gain of 10 000, pass-band filters between 0.3–30 Hz, sampling rate of 200 Hz, noise level of 2 μV RMS and environmental temperature of approximately 23°C. Participants were asked to close and open their eyes at different moments to explore reactivity and avoid drowsiness.

After a standard visual evaluation, a quantitative analysis of the EEG was carried out on the recording of each participant. An expert electroencephalographer (DGA) manually selected artefact-free segments of 2.56 s in duration from eyes-closed periods. About 24 segments obtained from each participant were submitted to a quantitative frequency analysis using a Fast Fourier Transform (FFT). Power spectra were obtained from 0.39 to 19.11 Hz at steps of 0.39 Hz. Absolute Power (AP) in the four classic frequency bands (delta, theta, alpha and beta)—here referred to as broad-band spectral parameters (BBSP)—were calculated and compared to the Cuban normative data [17].

The Z-transformed statistic was used to compare each participant’s BBSP against the normative data. This transformation expresses the distance between an individual BBSP and the average BBSP of the normal population for the participant’s age. The distance is measured in values of standard deviations (SD), where | Z | > 1.96 indicates that the variable is outside the range of the normal population with a 5% risk of error (p<0.05). Therefore, a participant’s BBSP was classified as abnormal if the absolute Z value of the AP for any frequency band was above 1.96. A flowchart describing the steps for data processing and analysis is shown in Fig 2.

Fig 2. Flowchart representing the steps followed in this study for the data processing and analysis.

Fig 2

The possible association between presenting a GS slower than 0.8 m/s and an abnormal quantitative EEG (qEEG) was determined using a Chi-square test. We also used logistic regression to assess whether the GS value predicted the qEEG result. Finally, a frequency-domain source analysis was performed using sLORETA [18]. sLORETA computes the standardised current source density at each of the 6239 voxels in the grey matter and the hippocampus of the MNI-reference brain based on linear weighted sums of the scalp electric potentials. The underlying sources are estimated under the assumption that the neighbouring voxels should have maximally similar electrical activity. Differences between the current source densities of LowGS and NorGS in each frequency band are displayed in non-threshold statistical topographical maps using LORETA-KEY software.

Results

According to the GS value, 27 participants were included in NorGS and 63 in LowGS. Table 1 shows the cohort’s characteristics per GS group according to age, sex, known chronic diseases and MMSE score. The distribution of health conditions was similar in both subgroups. Arterial hypertension was present in 41% of the total sample, but other comorbidities (i.e., diabetes and history of stroke) had low prevalence. While some participants scored below 25 in the MMSE in LowGS, 75% of the test scores were at or above this limit (Table 1). There were no significant statistical differences (independent t-test, p>0.05) between NorGS and LowGS in the MMSE.

Table 1. Characteristics of the cohort included in this study.

Cohort Characteristics NorGS LowGS
n = 27 n = 63
Age Mean (SD)
76.8 (8.9) 80.1 (7.2)
MMSE score Mean (SD), Min-Max, Percentile 25–75%
29 (1.2), 25–30, 28–30 27.8 (2.25), 20–30, 27–30
Female Proportion (%)
23 (85.1) 58 (92.1)
Diabetes Mellitus 3 (11.1) 10 (15.8)
Hypertension 9 (33.3) 28 (44.4)
History of Stroke 1 (3.7) 2 (3.1)

Fig 3 shows the distribution of participants according to their gait speed and MMSE scores. Note that most of the participants with a GS > = 0.8 m/s and an MMSE score above or equal to 25 had a normal EEG. On the other hand, a larger number of participants with a GS below the 0.8 m/s cut-off or with both lower GS and MMSE below 25 had abnormalities in EEG frequency composition.

Fig 3. Distribution of participants according to their gait speed and MMSE scores.

Fig 3

Participants with normal and abnormal EEG frequency composition are represented separately in Panel A and B. The blue line marks the GS cut-off point of 0.8m/s, and the red line marks an MMSE score equal to 25. Black circles: participants with a GS > 0.8 m/s and an MMSE score equal to or above 25. Blue circles: participants with a GS < 0.8 m/s and an MMSE score equal to or above 25. Green circles: participants with a GS > = 0.8 m/s and an MMSE score below 25. Red circles: participants with GS < 0.8 m/s and an MMSE score below 25.

Table 2 shows the proportion of normal and abnormal BBSP qEEG studies in both groups. 62 of 90 participants (69%) had EEG frequency abnormalities. Most of these abnormalities (54/62, 87%) were present in participants with GS < 0.8 m/s (LowGS).

Table 2. Proportion of normal and abnormal qEEG studies in each gait speed group (qEEG: Quantitative EEG, N: Sample size).

Groups Normal qEEG Abnormal qEEG
NorGS (N = 27) 19 (70.3%) 8 (29.6%)
LowGS (N = 63) 9 (14%) 54 (86%)
Total (N = 90) 28 (31.1%) 62 (68.8%)

The type of EEG alterations per frequency band in each group is shown in Table 3. An abnormal increment in the energy of delta and theta bands for the age was observed in 37 of 54 individuals (68%) in LowGS. Thirteen participants (24%) in this group also had an abnormal reduction in the energy of the alpha band. On the other hand, while some participants in NorGS (6/27, 22%) had an abnormal increase in the energy of the slow frequency bands, none showed abnormal changes in the alpha power. Otherwise, changes in beta band power were similar in the two groups, with 7% and 6% of participants in NorGS and LowGS, respectively, showing energy increment in this band.

Table 3. Proportion of abnormal changes per clinical EEG frequency band in each gait speed group.

The frequency band was considered abnormal if its power differed more than 1.96 SD from the population normative data for the corresponding age.

Groups ↑Delta ↑Theta ↓Alpha ↑Beta
NorGS 2 4 0 2
LowGS 15 22 13 4
Total 17 26 13 6

The association between GS < 0.8 m/s and the presence of EEG frequency alterations was statistically significant (X2(1) = 7.38, p<0.001; OR 14.25, 95% CI 4.81–42.23) with a positive predictive value of 0.87 and a likelihood ratio of 2.86. The logistic regression analysis also showed that GS values predict the presence of abnormalities in the EEG (Wald (1) = 8.6, p = 0.003; OR = 2.96, 95% CI 1.05–5.3).

The distribution of the differences between NorGS’s and LowGS’s current source maps is shown in Fig 4. As can be seen, the difference in the oscillatory activity was mainly characterised by a widespread increase in theta oscillations in LowGS compared to NorGS, with maxima in the occipitotemporal lobe. LowGS also presented weaker delta oscillations in frontopolar regions. Other oscillatory differences were mild, with LowGS showing increased delta in parietooccipital areas, weaker alpha oscillations in precentral, postcentral and cingulate gyri and a widespread mild increase in beta. Nevertheless, the difference between groups in the oscillatory activity, while present, was not statistically significant.

Fig 4. Topographic maps of the current source difference between groups.
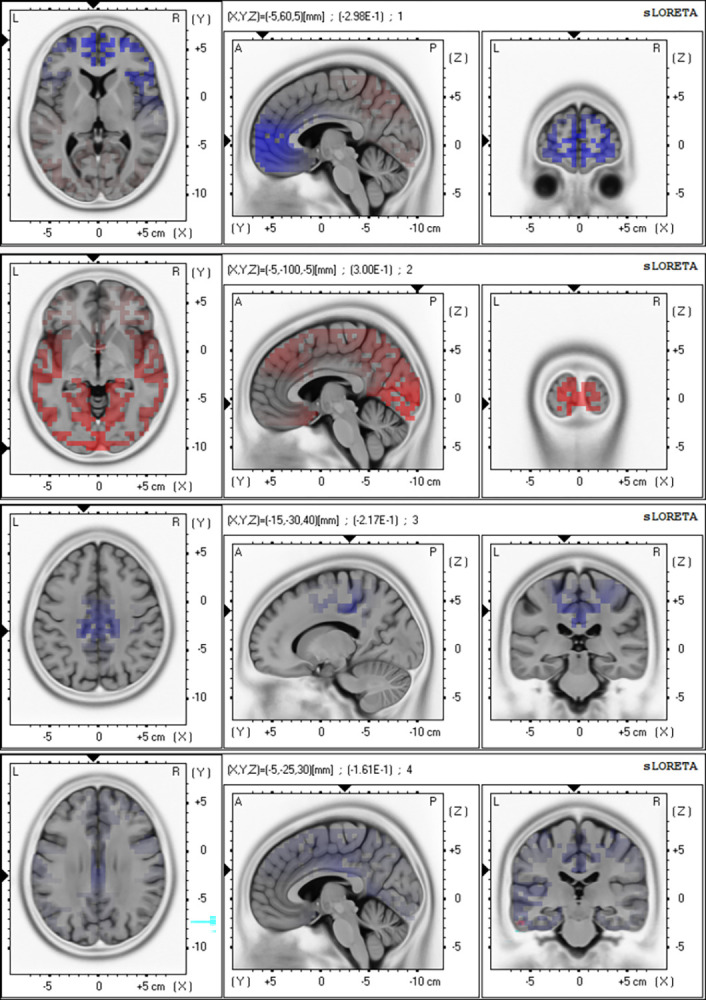
Fig 4

The difference was obtained by subtracting the current source map of NorGS from LowGS (i.e., LowGS—NorGS). Results are plotted by frequency bands on an MNI T2 template of an average brain, with maps centred in the maximum/minimum. Reddish areas are regions where oscillations were stronger in LowGS than in NorGS, while blueish areas are regions with weaker oscillations. First row: delta band: 1–4 Hz, Second row: theta band: 4–8 Hz, Third row: alpha band: 8–12, Fourth row: beta band: 12–30 Hz. L: left, R: right, A: anterior, P: posterior.

Discussion

Our participants comprised older individuals who lived independently and regularly practised mild exercise in community groups with an instructor. Despite that, 70% (63/90) of the total sample had a gait speed slower than 0.8 m/s, of which 86% (54/63) also had abnormal changes in the EEG frequency composition. Furthermore, the gait speed reduction in these individuals was associated with a higher amount of slow frequency activity than expected for their age. Previous research has shown that healthy older individuals have a gait speed above 1 m/s, although this lower limit decreases to ~0.9 m/s in people older than 85 [19]. Values below 0.6 m/s, on the other hand, have been reported in individuals with significant functional and cognitive impairment and are also associated with institutionalisation, hospitalisation, and death [6, 20]. Values lower than the cut-off point used in this study (GS < 0.8 m/s) have been proposed as a risk for developing adverse outcomes [5, 7]. For instance, in a longitudinal study by Montero-Odasso and co-workers (2016), slow gait—defined as walking below 1 m/s at the usual pace—was associated with cognitive impairment and progression to dementia.

In our study, 79% (50/63) of participants with GS < 0.8 m/s (vs 22% (6/27) with GS > = 0.8 m/s) had an abnormally slow EEG. It has been widely demonstrated that EEG background activity slows during physiological ageing. Changes in EEG at an older age are characterised by alpha power reduction and delta/theta power increase [21]. Nonetheless, there is still some debate regarding the extent to which slow activity is a normal pattern in healthy ageing [22]. In this study, EEG frequency changes were considered abnormal only if the individual frequency band deviated more than 1.96 SD from the normative data for the corresponding age.

The association between an early decline in gait speed and an abnormal EEG is not surprising. Gait is a complex function supported by the coordinated interaction of sensorimotor and cognitive processes where several brain areas play a fundamental role [2325]. A change in the gait speed of older individuals that are otherwise functionally normal (i.e. no significant musculoskeletal or uncontrolled systemic disorders) must necessarily reflect modifications in the cerebral processes or related networks underlying gait control and implementation [2628]. On the other hand, as the EEG originates from synchronic neural activity generated across large cortical areas, the signal is sensitive to alterations in brain function. Any disruption in neuronal communication, neural metabolism or changes in the underlying neural network structure will alter the frequency composition of the EEG [29, 30]. Therefore, the presence of abnormal frequency changes in the EEG of our cohort, especially in those participants with slower GS, represents an important subclinical finding as it is a sign of mild brain dysfunction. The presence of brain dysfunction in older individuals with reduced gait speed is also supported by the frequent association between neurological alterations such as delirium and physical deterioration in older persons without primary neurological diseases [3133].

Several authors have reported increments in the EEG spectral power at slower frequencies (delta and theta) and a decrease in alpha band energy, especially in alpha-1, in individuals with Alzheimer’s disease (AD), vascular dementia and mild cognitive impairment (MCI) [21, 3436]. In particular, higher power in the theta band over the temporal lobe compared to age-matched control has been proposed as a marker of Alzheimer’s dementia [37]. Moreover, its association with increased energy in high alpha relative to low alpha frequency has been found to predict the conversion of patients with MCI to AD [38]. In our study, few participants scored below 25 in the MMSE, but those that did also had an abnormal EEG and a GS<0.8 m/s. Nevertheless, as most of our participants with GS deterioration did not have a degree of cognitive decline that the MMSE could identify, we failed to find a relationship between early changes in GS and cognition. Other studies have reported, however, that MMSE has low sensitivity for detecting minor cognitive impairment [39, 40]. Its use represents the main limitation of our study as we cannot rule out that more individuals in our cohort could have had a preclinical cognitive decline–especially those with slower gait speed and an abnormal EEG. Nonetheless, another possibility is that our participants were in an early stage where cognitive changes had not yet occurred. It is known from previous studies [41, 42] that GS deterioration can precede the decline in cognition by several years.

We do not know the temporal relationship between the beginning of the gait deterioration and the development of EEG changes. Regardless of the moment when the changes occurred, we found that a GS < 0.8 m/s represented a three times greater risk for having an abnormal EEG and consequently for the presence of brain dysfunction, with a positive predictive value of 87%. Given that GS deterioration and EEG slow frequency composition have been individually identified as predictors of further decline at an older age, their association in the same individual is likely to represent a higher risk of vulnerability to develop conditions such as cognitive frailty or cognitive decline.

In this study we assessed the association between gait speed decline and the presence of brain dysfunction by analysing the EEG at rest. However, we aim to incorporate in future research studies, the simultaneous acquisition of brain electrical activity during walking tasks which was not possible in this investigation. By simultaneously acquiring the EEG and gait, it is possible to elucidate specific changes in brain dynamics related to the different phases of gait. Furthermore, the high temporal resolution of EEG allows us to closely follow the coupling between movement planning, implementation and control and the brain’s electrical activity. This strategy is essential to better understand the nature of the gait deterioration and design specific rehabilitation.

Even though participants in our study engaged in regular, mild exercise in the community, the GS decline was present in 70% of the sample. The fact that both groups were mainly composed of women with a mean age of 76.8 (NorGS) and 80 (LowGS) could have been one reason for the predominance of low GS values. While there was not a significant difference in age between groups, it is known that the level of physical deterioration increases with age. Muscle strength decreases by 1.5% per year and accelerates to 3% per year after 60 years of age [43]. Therefore, the combination of a higher female composition and a mean age of about 80 could have determined lower GS values in the LowGS group. Nevertheless, the prevalence of lower gait values in our study compared to the literature is puzzling. Previous studies conducted in comparable samples have found higher GS values [19, 4446]. For example, in their 2022 study, Dommershuijsen and colleagues found that individuals aged 89 exhibited GS values higher than 1 m/s for both sexes, while men and women older than 90 showed GS values of 0.9 m/s and 0.8 m/s, respectively. Bohannon and Wang (2019) reported similar findings, with the exception that GS for women aged 80–85 was 0.88 m/s. A study by Lau and co-workers (2020) described normative values higher than 1 m/s in Southeast Asian older adults of both sexes aged below 80 and 0.8 m/s in participants aged 81 and older. Finally, Lusardi’s study [46] also found that older women aged 80 and above showed GS values of 0.8 m/s (SD 0.20).

One explanation for the disagreement with the literature could be methodological differences in the GS assessment protocol. While Bohannon and Wang (2019) assessed the gait speed in a 4 m walkway, they did not use an acceleration zone. Different studies have reported that the use of dynamic or static protocols produces different gait results [4749]. On the other hand, Dommershuijsen, Lau and Lusardi’s studies measured the participants’ gait with a GaitRite system [19, 45, 46] and 6 m/s walkways [19, 45]. Short (3–4 m) and long (5–10 m) walkway lengths produce reliable results across testing sessions, but they do not have sufficient concurrent validity [50]. The same applies to gait measurements obtained with the GaitRite system and walking tests using a stopwatch. In a study by Peters and co-workers (2015), GS measured with GaitRite showed higher values in all trials performed by community ambulators than in the 3 m walking test [51].

We cannot ignore, however, the socioeconomics of the study sample. Despite being classified as an upper middle-income country according to the World Bank, Cuba’s sustained poor economic situation puts individuals in constant hardships. Notwithstanding good health care and social initiatives to improve life, older people are one of the main vulnerable groups affected by pensions of deficient purchasing power, food scarcity, deficient nutrition, deteriorated housing, uncertainty regarding the future and persistent stress. We cannot rule out that these conditions have also influenced our results as it is known that wider determinants, nutrition and well-being impact people’s health, including their frailty levels and how they age. A comparative study, which includes cohorts with similar and distinct socioeconomic characteristics to that of our sample, is essential to determine if this is the cause for the observed differences.

Conclusions

Our results support screening for and intervening in early decline in mobility to prevent or delay the onset of disability and dependence. Specifically, they support the inclusion of gait speed evaluation in the standard assessment of older adults, given its simplicity, sensitivity, and association with underlying brain function. The latter would be beneficial to intervene in gait deterioration early enough to avoid falls, hospitalisation and the evolution towards physical and cognitive decline. Here, we showed that, despite being physically active, older people can present declines in GS (= <0.8 m/s). Slower GS was associated in this study with abnormally slow brain electrical activity for age, representing mild brain dysfunction. The latter poses an additional risk of developing further decline, including cognitive deterioration. Electrophysiological markers such as those used in this study are inexpensive and easy to implement, which makes it feasible to incorporate them in the functional assessment of older adults contributing to risk stratification. With the challenge of prolonging years of functional life in ageing societies, it is essential to design strategies to restore early declines. A strategy that combines markers such as gait speed and quantitative EEG measures may be especially valuable in objectively assessing the success of intervention programs aimed at rehabilitating changes in mobility.

Data Availability

Data is available from the Aston Data Explorer database (accession number: https://doi.org/10.17036/researchdata.aston.ac.uk.00000557).

Funding Statement

VRR (the corresponding author) received funds from the Global Challenge Research Fund - Aston University internal call (ID-28014), but the funder had no role in study design, data collection and analysis, decision to publish, or preparation of the manuscript.

References

  • 1.Wolinsky FD, Miller DK, Andresen EM, Malmstrom TK, Miller JP. Further Evidence for the Importance of Subclinical Functional Limitation and Subclinical Disability Assessment in Gerontology and Geriatrics. J Gerontol B Psychol Sci Soc Sci. 2005;60(3):S146–51. doi: 10.1093/geronb/60.3.s146 [DOI] [PubMed] [Google Scholar]
  • 2.Fried LP, Bandeen-Roche K, Chaves PHM, Johnson BA. Preclinical mobility disability predicts incident mobility disabilityin older women. J Gerontol A Biol Sci Med Sci. 2000;55(1):M43–52. doi: 10.1093/gerona/55.1.m43 [DOI] [PubMed] [Google Scholar]
  • 3.Studenski S, Perera S, Patel K, Rosano C, Faulkner K, Inzitari M, et al. Gait speed and survival in older adults. JAMA—Journal of the American Medical Association. 2011. Jan 5;305(1):50–8. doi: 10.1001/jama.2010.1923 [DOI] [PMC free article] [PubMed] [Google Scholar]
  • 4.Perera S, Patel K V., Rosano C, Rubin SM, Satterfield S, Harris T, et al. Gait Speed Predicts Incident Disability: A Pooled Analysis. J Gerontol A Biol Sci Med Sci. 2016;71(1):63–71. doi: 10.1093/gerona/glv126 [DOI] [PMC free article] [PubMed] [Google Scholar]
  • 5.Abellan Van Kan G, Rolland Y, Andrieu S, Bauer J, Beauchet O, Bonnefoy M, et al. Gait speed at usual pace as a predictor of adverse outcomes in community-dwelling older people an International Academy on Nutrition and Aging (IANA) Task Force. J Nutr Health Aging. 2009;13(10):881–9. doi: 10.1007/s12603-009-0246-z [DOI] [PubMed] [Google Scholar]
  • 6.Inzitari M, Newman AB, Yaffe K, Boudreau R, de Rekeneire N, Shorr R, et al. Gait Speed Predicts Decline in Attention and Psychomotor Speed in Older Adults: The Health Aging and Body Composition Study. Neuroepidemiology. 2007;29(3–4):156–62. doi: 10.1159/000111577 [DOI] [PMC free article] [PubMed] [Google Scholar]
  • 7.Montero-Odasso MM, Barnes B, Speechley M, Muir Hunter SW, Doherty TJ, Duque G, et al. Disentangling Cognitive-Frailty: Results From the Gait and Brain Study. J Gerontol A Biol Sci Med Sci. 2016;71(11):1476–82. doi: 10.1093/gerona/glw044 [DOI] [PubMed] [Google Scholar]
  • 8.Sargent L, Nalls M, Starkweather A, Hobgood S, Thompson H, Amella EJ, et al. Shared biological pathways for frailty and cognitive impairment: A systematic review. Vol. 47, Ageing Research Reviews. Elsevier Ireland Ltd; 2018. p. 149–58. [DOI] [PMC free article] [PubMed] [Google Scholar]
  • 9.Borges MK, Canevelli M, Cesari M, Aprahamian I. Frailty as a Predictor of Cognitive Disorders: A Systematic Review and Meta-Analysis. Front Med. 2019; Vol. 6. doi: 10.3389/fmed.2019.00026 [DOI] [PMC free article] [PubMed] [Google Scholar]
  • 10.Peel NM, Kuys SS, Klein K. Gait Speed as a Measure in Geriatric Assessment in Clinical Settings: A Systematic Review. The Journals of Gerontology: Series A. 2013;68(1):39–46. [DOI] [PubMed] [Google Scholar]
  • 11.Cesari M, Kritchevsky SB, Penninx BWHJ, Nicklas BJ, Simonsick EM, Newman AB, et al. Prognostic Value of Usual Gait Speed in Well‐Functioning Older People—Results from the Health, Aging and Body Composition Study. J Am Geriatr Soc. 2005;53(10):1675–80. doi: 10.1111/j.1532-5415.2005.53501.x [DOI] [PubMed] [Google Scholar]
  • 12.Frenkel-Toledo S, Bentin S, Perry A, Liebermann DG, Soroker N. Dynamics of the EEG power in the frequency and spatial domains during observation and execution of manual movements. Brain Res. 2013;1509:43–57. doi: 10.1016/j.brainres.2013.03.004 [DOI] [PubMed] [Google Scholar]
  • 13.Gunay SY, Hocaoglu E, Patoglu V, Cetin M. Classification of motor task execution speed from EEG data. 2016 24th Signal Processing and Communication Application Conference, SIU 2016—Proceedings. 2016;2257–60. [Google Scholar]
  • 14.Anderson AJ, Perone S. Developmental change in the resting state electroencephalogram: Insights into cognition and the brain. Brain Cogn. 2018;126:40–52. doi: 10.1016/j.bandc.2018.08.001 [DOI] [PubMed] [Google Scholar]
  • 15.Sargent K, Chavez-Baldini UY, Master SL, Verweij KJH, Lok A, Sutterland AL, et al. Resting-state brain oscillations predict cognitive function in psychiatric disorders: A transdiagnostic machine learning approach. Neuroimage Clin. 2021;30:102617. doi: 10.1016/j.nicl.2021.102617 [DOI] [PMC free article] [PubMed] [Google Scholar]
  • 16.Montero-Odasso M, Schapira M, Varela C, Pitteri C, Soriano ER, Kaplan R, et al. Gait velocity in senior people. An easy test for detecting mobility impairment in community elderly. J Nutr Health Aging. 2004;8(5):340–3. [PubMed] [Google Scholar]
  • 17.Valdes-Sosa PA, Biscay R, Galan L, Bosch J, Szava S, Virues T. High resolution spectral EEG norms for topography. Brain Topogr. 1990;3:281–2. [Google Scholar]
  • 18.Pascual-Marqui RD. Standardized low-resolution brain electromagnetic tomography (sLORETA): technical details. Methods Find Exp Clin Pharmacol. 2002;24 Suppl D:5–12. [PubMed] [Google Scholar]
  • 19.Dommershuijsen LJ, Ragunathan J, Ruiter R, Groothof D, Mattace-Raso FUS, Ikram MA, et al. Gait speed reference values in community-dwelling older adults–Cross-sectional analysis from the Rotterdam Study. Exp Gerontol. 2022;158:111646. doi: 10.1016/j.exger.2021.111646 [DOI] [PubMed] [Google Scholar]
  • 20.Montero-Odasso M, Schapira M, Soriano ER, Varela M, Kaplan R, Camera LA, et al. Gait velocity as a single predictor of adverse events in healthy seniors aged 75 years and older. J Gerontol A Biol Sci Med Sci. 2005;60(10):1304–9. doi: 10.1093/gerona/60.10.1304 [DOI] [PubMed] [Google Scholar]
  • 21.Rossini PM, Rossi S, Babiloni C, Polich J. Clinical neurophysiology of aging brain: From normal aging to neurodegeneration. Vol. 83, Progress in Neurobiology. Pergamon; 2007. p. 375–400. [DOI] [PubMed] [Google Scholar]
  • 22.Hartikainen P, Soininen H, Partanen J, Helkala EL, Riekkinen P. Aging and spectral analysis of EEG in normal subjects: a link to memory and CSF AChE. Acta Neurol Scand. 1992;86(2):148–55. doi: 10.1111/j.1600-0404.1992.tb05057.x [DOI] [PubMed] [Google Scholar]
  • 23.Allali G, Montembeault M, Brambati SM, Bherer L, Blumen HM, Launay CP, et al. Brain Structure Covariance Associated With Gait Control in Aging. J Gerontol A Biol Sci Med Sci. 2019;74(5):705–13. doi: 10.1093/gerona/gly123 [DOI] [PubMed] [Google Scholar]
  • 24.Yogev-Seligmann G, Hausdorff JM, Giladi N. The role of executive function and attention in gait. Movement Disorders. 2008;23(3):329–42. doi: 10.1002/mds.21720 [DOI] [PMC free article] [PubMed] [Google Scholar]
  • 25.Holtzer R, Verghese J, Xue X, Lipton RB. Cognitive processes related to gait velocity: Results from the Einstein aging study. Neuropsychology. 2006;20(2):215–23. doi: 10.1037/0894-4105.20.2.215 [DOI] [PubMed] [Google Scholar]
  • 26.Wilson J, Allcock L, Mc Ardle R, Taylor JP, Rochester L. The neural correlates of discrete gait characteristics in ageing: A structured review. Neurosci Biobehav Rev. 2019;100:344–69. doi: 10.1016/j.neubiorev.2018.12.017 [DOI] [PMC free article] [PubMed] [Google Scholar]
  • 27.Verlinden VJA, Van Der Geest JN, Hofman A, Ikram MA. Cognition and gait show a distinct pattern of association in the general population. Alzheimer’s and Dementia. 2014;10(3):328–35. doi: 10.1016/j.jalz.2013.03.009 [DOI] [PubMed] [Google Scholar]
  • 28.Holtzer R, Epstein N, Mahoney JR, Izzetoglu M, Blumen HM. Neuroimaging of Mobility in Aging: A Targeted Review. J Gerontol A Biol Sci Med Sci. 2014;69(11):1375–88. doi: 10.1093/gerona/glu052 [DOI] [PMC free article] [PubMed] [Google Scholar]
  • 29.Steriade M, Gloor P, Llinás RR, Lopes da Silva FH, Mesulam MM. Basic mechanisms of cerebral rhythmic activities. Electroencephalogr Clin Neurophysiol. 1990;76(6):481–508. [DOI] [PubMed] [Google Scholar]
  • 30.Steriade M. Grouping of brain rhythms in corticothalamic systems. 2006;137:1087–106. [DOI] [PubMed] [Google Scholar]
  • 31.Sato T, Hatakeyama S, Okamoto T, Yamamoto H, Hosogoe S, Tobisawa Y, et al. Slow Gait Speed and Rapid Renal Function Decline Are Risk Factors for Postoperative Delirium after Urological Surgery. Black PC, editor. PLoS One. 2016;11(5):e0153961. doi: 10.1371/journal.pone.0153961 [DOI] [PMC free article] [PubMed] [Google Scholar]
  • 32.Oikawa M, Okamoto T, Hatakeyama S, Yamamoto H, Imai A, Yoneyama T, et al. Slow Gait Speed Predict of Post-Operative Delirium in Elderly Patients. Journal of Urology. 2015;193(4S). [Google Scholar]
  • 33.Fong TG, Tulebaev SR, Inouye SK. Delirium in elderly adults: diagnosis, prevention and treatment. Nat Rev Neurol. 2009;5(4):210–20. doi: 10.1038/nrneurol.2009.24 [DOI] [PMC free article] [PubMed] [Google Scholar]
  • 34.Moretti D V., Zanetti O, Binetti G, Frisoni GB. Quantitative EEG markers in mild cognitive impairment: Degenerative versus vascular brain impairment. International Journal of Alzheimer’s Disease. 2012; Vol. 2012:917537. doi: 10.1155/2012/917537 [DOI] [PMC free article] [PubMed] [Google Scholar]
  • 35.Moretti DV. The Contribution of EEG to the Diagnosis of Dementia. J Biomed Sci Eng. 2014;07(08):546–62. [Google Scholar]
  • 36.Meghdadi AH, Karic MS, McConnell M, Rupp G, Richard C, Hamilton J, et al. Resting state EEG biomarkers of cognitive decline associated with Alzheimer’s disease and mild cognitive impairment. PLoS One. 2021;16:e0244180. doi: 10.1371/journal.pone.0244180 [DOI] [PMC free article] [PubMed] [Google Scholar]
  • 37.Musaeus CS, Engedal K, Høgh P, Jelic V, Mørup M, Naik M, et al. EEG Theta Power Is an Early Marker of Cognitive Decline in Dementia due to Alzheimer’s Disease. Journal of Alzheimer’s Disease. 2018;64(4):1359–71. doi: 10.3233/JAD-180300 [DOI] [PubMed] [Google Scholar]
  • 38.Moretti D V., Prestia A, Binetti G, Zanetti O, Frisoni GB. Increase of theta frequency is associated with reduction in regional cerebral blood flow only in subjects with mild cognitive impairment with higher upper alpha/low alpha EEG frequency power ratio. Front Behav Neurosci. 2013;7(DEC):188. doi: 10.3389/fnbeh.2013.00188 [DOI] [PMC free article] [PubMed] [Google Scholar]
  • 39.Pendlebury ST, Mariz J, Bull L, Mehta Z, Rothwell PM. MoCA, ACE-R, and MMSE versus the national institute of neurological disorders and stroke-canadian stroke network vascular cognitive impairment harmonization standards neuropsychological battery after TIA and stroke. Stroke. 2012;43(2):464–9. doi: 10.1161/STROKEAHA.111.633586 [DOI] [PMC free article] [PubMed] [Google Scholar]
  • 40.Pinto TCC, Machado L, Bulgacov TM, Rodrigues-Júnior AL, Costa MLG, Ximenes RCC, et al. Is the Montreal Cognitive Assessment (MoCA) screening superior to the Mini-Mental State Examination (MMSE) in the detection of mild cognitive impairment (MCI) and Alzheimer’s Disease (AD) in the elderly? Vol. 31, International Psychogeriatrics. Cambridge University Press; 2019. p. 491–504. [DOI] [PubMed] [Google Scholar]
  • 41.Hoogendijk EO, Rijnhart JJM, Skoog J, Robitaille A, van den Hout A, Ferrucci L, et al. Gait speed as predictor of transition into cognitive impairment: Findings from three longitudinal studies on aging. Exp Gerontol. 2020;129. doi: 10.1016/j.exger.2019.110783 [DOI] [PMC free article] [PubMed] [Google Scholar]
  • 42.Skillbäck T, Blennow K, Zetterberg H, Skoog J, Rydén L, Wetterberg H, et al. Slowing gait speed precedes cognitive decline by several years. Alzheimer’s & Dementia. 2022;18(9):1667–76. doi: 10.1002/alz.12537 [DOI] [PMC free article] [PubMed] [Google Scholar]
  • 43.Morley JE, Baumgartner RN, Roubenoff R, Mayer J, Nair KS. Sarcopenia. J Lab Clin Med. 2001;137(4):231–43. doi: 10.1067/mlc.2001.113504 [DOI] [PubMed] [Google Scholar]
  • 44.Bohannon RW, Wang YC. Four-Meter Gait Speed: Normative Values and Reliability Determined for Adults Participating in the NIH Toolbox Study. Arch Phys Med Rehabil. 2019;100(3):509–13. doi: 10.1016/j.apmr.2018.06.031 [DOI] [PMC free article] [PubMed] [Google Scholar]
  • 45.Lau LK, Wee SL, Pang WJB, Chen KK, Jabbar KA, Yap PLK, et al. Reference Values of Gait Speed and Gait Spatiotemporal Parameters for a South East Asian Population: The Yishun Study. Clin Interv Aging. 2020;15:1753–65. doi: 10.2147/CIA.S270407 [DOI] [PMC free article] [PubMed] [Google Scholar]
  • 46.Lusardi MM, Pellecchia GL, Schulman M. Functional Performance in Community Living Older Adults. Journal of Geriatric Physical Therapy. 2003;26(3):14–22. [Google Scholar]
  • 47.Krumpoch S, Lindemann Ulrich, Rappl A, Clemens Becker·, Cornel ·, Sieber C, et al. The effect of different test protocols and walking distances on gait speed in older persons. 2021;33:141–6. doi: 10.1007/s40520-020-01703-z [DOI] [PMC free article] [PubMed] [Google Scholar]
  • 48.Macfarlane PA, Looney MA. Walkway length determination for steady state walking in young and older adults. Res Q Exerc Sport. 2008;79(2):261–7. doi: 10.1080/02701367.2008.10599489 [DOI] [PubMed] [Google Scholar]
  • 49.Phan-Ba R, Calay P, Grodent P, Delrue G, Lommers E, Delvaux V, et al. A corrected version of the Timed-25 Foot Walk Test with a dynamic start to capture the maximum ambulation speed in multiple sclerosis patients. NeuroRehabilitation. 2012;30(4):261–6. doi: 10.3233/NRE-2012-0754 [DOI] [PubMed] [Google Scholar]
  • 50.Peters DM, Fritz SL, Krotish DE. Assessing the reliability and validity of a shorter walk test compared with the 10-Meter Walk Test for measurements of gait speed in healthy, older adults. J Geriatr Phys Ther. 2013;36(1):24–30. doi: 10.1519/JPT.0b013e318248e20d [DOI] [PubMed] [Google Scholar]
  • 51.Peters DM, Middleton A, Donley JW, Blanck EL, Fritz SL. Concurrent validity of walking speed values calculated via the GAITRite electronic walkway and 3 meter walk test in the chronic stroke population. Physiother Theory Pract. 2014;30(3):183–8. doi: 10.3109/09593985.2013.845805 [DOI] [PMC free article] [PubMed] [Google Scholar]

Decision Letter 0

Alice Coles-Aldridge

5 Nov 2022

PONE-D-22-18110Hidden decline in older adults: association between gait speed deterioration and EEG abnormalities.

PLOS ONE

Dear Dr. Rodriguez-Rodriguez,

 Thank you for submitting your manuscript to PLOS ONE. After careful consideration, we feel that it has merit but does not fully meet PLOS ONE’s publication criteria as it currently stands. Therefore, we invite you to submit a revised version of the manuscript that addresses the points raised during the review process.

Please note that we have only been able to secure a single reviewer to assess your manuscript. We are issuing a decision on your manuscript at this point to prevent further delays in the evaluation of your manuscript. Please be aware that the editor who handles your revised manuscript might find it necessary to invite additional reviewers to assess this work once the revised manuscript is submitted.

Please submit your revised manuscript by Dec 19 2022 11:59PM. If you will need more time than this to complete your revisions, please reply to this message or contact the journal office at plosone@plos.org. When you're ready to submit your revision, log on to https://www.editorialmanager.com/pone/ and select the 'Submissions Needing Revision' folder to locate your manuscript file.

Please include the following items when submitting your revised manuscript:

  • A rebuttal letter that responds to each point raised by the academic editor and reviewer(s). You should upload this letter as a separate file labeled 'Response to Reviewers'.

  • A marked-up copy of your manuscript that highlights changes made to the original version. You should upload this as a separate file labeled 'Revised Manuscript with Track Changes'.

  • An unmarked version of your revised paper without tracked changes. You should upload this as a separate file labeled 'Manuscript'.

If you would like to make changes to your financial disclosure, please include your updated statement in your cover letter. Guidelines for resubmitting your figure files are available below the reviewer comments at the end of this letter.

If applicable, we recommend that you deposit your laboratory protocols in protocols.io to enhance the reproducibility of your results. Protocols.io assigns your protocol its own identifier (DOI) so that it can be cited independently in the future. For instructions see: https://journals.plos.org/plosone/s/submission-guidelines#loc-laboratory-protocols. Additionally, PLOS ONE offers an option for publishing peer-reviewed Lab Protocol articles, which describe protocols hosted on protocols.io. Read more information on sharing protocols at https://plos.org/protocols?utm_medium=editorial-email&utm_source=authorletters&utm_campaign=protocols.

We look forward to receiving your revised manuscript.

Kind regards,

Alice Coles-Aldridge

Editorial Office

PLOS ONE

Journal Requirements:

When submitting your revision, we need you to address these additional requirements.

1. Please ensure that your manuscript meets PLOS ONE's style requirements, including those for file naming. The PLOS ONE style templates can be found at https://journals.plos.org/plosone/s/file?id=wjVg/PLOSOne_formatting_sample_main_body.pdf and 

https://journals.plos.org/plosone/s/file?id=ba62/PLOSOne_formatting_sample_title_authors_affiliations.pdf

2. We note that you have stated that you will provide repository information for your data at acceptance. Should your manuscript be accepted for publication, we will hold it until you provide the relevant accession numbers or DOIs necessary to access your data. If you wish to make changes to your Data Availability statement, please describe these changes in your cover letter and we will update your Data Availability statement to reflect the information you provide.

[Note: HTML markup is below. Please do not edit.]

Reviewers' comments:

Reviewer's Responses to Questions

Comments to the Author

1. Is the manuscript technically sound, and do the data support the conclusions?

The manuscript must describe a technically sound piece of scientific research with data that supports the conclusions. Experiments must have been conducted rigorously, with appropriate controls, replication, and sample sizes. The conclusions must be drawn appropriately based on the data presented.

Reviewer #1: Partly

**********

2. Has the statistical analysis been performed appropriately and rigorously?

Reviewer #1: Yes

**********

3. Have the authors made all data underlying the findings in their manuscript fully available?

The PLOS Data policy requires authors to make all data underlying the findings described in their manuscript fully available without restriction, with rare exception (please refer to the Data Availability Statement in the manuscript PDF file). The data should be provided as part of the manuscript or its supporting information, or deposited to a public repository. For example, in addition to summary statistics, the data points behind means, medians and variance measures should be available. If there are restrictions on publicly sharing data—e.g. participant privacy or use of data from a third party—those must be specified.

Reviewer #1: Yes

**********

4. Is the manuscript presented in an intelligible fashion and written in standard English?

PLOS ONE does not copyedit accepted manuscripts, so the language in submitted articles must be clear, correct, and unambiguous. Any typographical or grammatical errors should be corrected at revision, so please note any specific errors here.

Reviewer #1: Yes

**********

5. Review Comments to the Author

Please use the space provided to explain your answers to the questions above. You may also include additional comments for the author, including concerns about dual publication, research ethics, or publication ethics. (Please upload your review as an attachment if it exceeds 20,000 characters)

Reviewer #1: Overall, the manuscript is written well and in easy to understand manner. The materials are informative and contain some interesting findings. However, some revision is required.

1. Some clarification is required regarding the naming of the groups used in the manuscript.

Lines 158-159: “However, changes in beta band power were similar in the two groups, with 7% and 6% of participants in NorGS and B, respectively, showing energy increment in this band.”

NorGS was defined before and is clear, however, “group B” seems a bit unclear. If it refers to the figure1, panel B, then the samples presented in panel B should be defined somewhere in the text as group B.

Following, in lines 172-173: “The difference was obtained by subtracting the spectral power of NorGS from LowGS (i.e., B-A).”

Meaning that “B” refers to LowGS. Is it the same “B” as before?

2. “Conclusions” section is missing. Some conclusions seem to be drawn in the Discussion section. I recommend separating the two into Discussion and Conclusions sections.

**********

6. PLOS authors have the option to publish the peer review history of their article (what does this mean?). If published, this will include your full peer review and any attached files.

If you choose “no”, your identity will remain anonymous but your review may still be made public.

Do you want your identity to be public for this peer review? For information about this choice, including consent withdrawal, please see our Privacy Policy.

Reviewer #1: No

**********

[NOTE: If reviewer comments were submitted as an attachment file, they will be attached to this email and accessible via the submission site. Please log into your account, locate the manuscript record, and check for the action link "View Attachments". If this link does not appear, there are no attachment files.]

While revising your submission, please upload your figure files to the Preflight Analysis and Conversion Engine (PACE) digital diagnostic tool, https://pacev2.apexcovantage.com/. PACE helps ensure that figures meet PLOS requirements. To use PACE, you must first register as a user. Registration is free. Then, login and navigate to the UPLOAD tab, where you will find detailed instructions on how to use the tool. If you encounter any issues or have any questions when using PACE, please email PLOS at figures@plos.org. Please note that Supporting Information files do not need this step.

PLoS One. 2024 Jun 4;19(6):e0305074. doi: 10.1371/journal.pone.0305074.r002

Author response to Decision Letter 0


13 Dec 2022

Dear PLOS ONE editorial office:

Please, find below a point-to-point reply to Reviewer#1’s comments.

Sincerely yours,

Valia Rodriguez-Rodriguez

Aston University

Reply to Reviewer #1:

Comment 1. Some clarification is required regarding the naming of the groups used in the manuscript. Lines 158-159: “However, changes in beta band power were similar in the two groups, with 7% and 6% of participants in NorGS and B, respectively, showing energy increment in this band.” NorGS was defined before and is clear, however, “group B” seems a bit unclear. If it refers to the figure1, panel B, then the samples presented in panel B should be defined somewhere in the text as group B.

We used A and B to name the groups in the first draft. For clarity, we renamed A as NorGS (normal gait speed) and B as LowGS (low gait speed). However, we did not replace the ’B’ in Lines 158-159. Thanks to the reviewer for spotting that error that is now corrected.

Comment 2: in lines 172-173: “The difference was obtained by subtracting the spectral power of NorGS from LowGS (i.e., B-A). ”Meaning that “B” refers to LowGS. Is it the same “B” as before?

Yes, ‘B’ refers to ‘LowGS’. As before, we did not replace it. It is corrected and lines 173-174 now read:

‘The difference was obtained by subtracting the spectral power of NorGS from LowGS (i.e., LowGS - NorGS).’

Comment 3: “Conclusions” section is missing. Some conclusions seem to be drawn in the Discussion section. I recommend separating the two into Discussion and Conclusions sections

We did not include Conclusions because the section is optional according to PLOS submission guidelines. Nevertheless, we are now closing the manuscript with a Conclusion paragraph.

Attachment

Submitted filename: Reply2Reviewer1.pdf

pone.0305074.s001.pdf (115.5KB, pdf)

Decision Letter 1

Hugh Cowley

28 Jun 2023

PONE-D-22-18110R1Hidden decline in older adults: association between gait speed deterioration and EEG abnormalities.PLOS ONE

Dear Dr. Rodriguez-Rodriguez,

Thank you for submitting your manuscript to PLOS ONE. After careful consideration, we feel that it has merit but does not fully meet PLOS ONE’s publication criteria as it currently stands. Therefore, we invite you to submit a revised version of the manuscript that addresses the points raised during the review process.

Your manuscript has been evaluated by three reviewers: the single reviewer from the previous version, and two new reviewers. Their comments are appended below. The new reviewers have raised a number of concerns, particularly regarding the study design, reporting, and discussion. Please ensure you address each of the reviewers' comments when revising your manuscript.

Please submit your revised manuscript by Aug 11 2023 11:59PM. If you will need more time than this to complete your revisions, please reply to this message or contact the journal office at plosone@plos.org. When you're ready to submit your revision, log on to https://www.editorialmanager.com/pone/ and select the 'Submissions Needing Revision' folder to locate your manuscript file.

Please include the following items when submitting your revised manuscript:

  • A rebuttal letter that responds to each point raised by the academic editor and reviewer(s). You should upload this letter as a separate file labeled 'Response to Reviewers'.

  • A marked-up copy of your manuscript that highlights changes made to the original version. You should upload this as a separate file labeled 'Revised Manuscript with Track Changes'.

  • An unmarked version of your revised paper without tracked changes. You should upload this as a separate file labeled 'Manuscript'.

If you would like to make changes to your financial disclosure, please include your updated statement in your cover letter. Guidelines for resubmitting your figure files are available below the reviewer comments at the end of this letter.

If applicable, we recommend that you deposit your laboratory protocols in protocols.io to enhance the reproducibility of your results. Protocols.io assigns your protocol its own identifier (DOI) so that it can be cited independently in the future. For instructions see: https://journals.plos.org/plosone/s/submission-guidelines#loc-laboratory-protocols. Additionally, PLOS ONE offers an option for publishing peer-reviewed Lab Protocol articles, which describe protocols hosted on protocols.io. Read more information on sharing protocols at https://plos.org/protocols?utm_medium=editorial-email&utm_source=authorletters&utm_campaign=protocols.

We look forward to receiving your revised manuscript.

Kind regards,

Hugh Cowley

Staff Editor

PLOS ONE

[Note: HTML markup is below. Please do not edit.]

Reviewers' comments:

Reviewer's Responses to Questions

Comments to the Author

1. If the authors have adequately addressed your comments raised in a previous round of review and you feel that this manuscript is now acceptable for publication, you may indicate that here to bypass the “Comments to the Author” section, enter your conflict of interest statement in the “Confidential to Editor” section, and submit your "Accept" recommendation.

Reviewer #1: All comments have been addressed

Reviewer #2: (No Response)

Reviewer #3: All comments have been addressed

**********

2. Is the manuscript technically sound, and do the data support the conclusions?

The manuscript must describe a technically sound piece of scientific research with data that supports the conclusions. Experiments must have been conducted rigorously, with appropriate controls, replication, and sample sizes. The conclusions must be drawn appropriately based on the data presented.

Reviewer #1: Yes

Reviewer #2: Partly

Reviewer #3: Partly

**********

3. Has the statistical analysis been performed appropriately and rigorously?

Reviewer #1: Yes

Reviewer #2: Yes

Reviewer #3: Yes

**********

4. Have the authors made all data underlying the findings in their manuscript fully available?

The PLOS Data policy requires authors to make all data underlying the findings described in their manuscript fully available without restriction, with rare exception (please refer to the Data Availability Statement in the manuscript PDF file). The data should be provided as part of the manuscript or its supporting information, or deposited to a public repository. For example, in addition to summary statistics, the data points behind means, medians and variance measures should be available. If there are restrictions on publicly sharing data—e.g. participant privacy or use of data from a third party—those must be specified.

Reviewer #1: (No Response)

Reviewer #2: Yes

Reviewer #3: Yes

**********

5. Is the manuscript presented in an intelligible fashion and written in standard English?

PLOS ONE does not copyedit accepted manuscripts, so the language in submitted articles must be clear, correct, and unambiguous. Any typographical or grammatical errors should be corrected at revision, so please note any specific errors here.

Reviewer #1: Yes

Reviewer #2: Yes

Reviewer #3: Yes

**********

6. Review Comments to the Author

Please use the space provided to explain your answers to the questions above. You may also include additional comments for the author, including concerns about dual publication, research ethics, or publication ethics. (Please upload your review as an attachment if it exceeds 20,000 characters)

Reviewer #1: The article is well written, has thorough explanation and addresses all important aspects. The authors have addressed all of the prior comments and I have no additional ones. I recommend this article to be accepted.

Reviewer #2: This work explores the gait speed and cognitive status (through MMSE) of 95 older adults. Along with this, a quantitative analysis of their resting state EEG was performed. Results showed that 70% of the sample size had lower gait speed of which 80% have abnormal EEG frequency composition. Overall, the work is fine. However, there are several important points which should be addressed before the final acceptance of the article.

1. The introduction may benefit by highlighting the relevance of using EEG modality.

2. Please cite the previous literature in the introduction which proved that resting state EEG can predict the changes in brain functions while executing the task.

3. Please add a picture of the representative participant while conducting the experiments in the method section. This will improve readability.

4. It would be better if the authors could add a flowchart describing the analysis and data processing of the study.

5. Line 101-102- “Participants were asked to close and open their eyes at different moments to explore reactivity and avoid drowsiness”. I believe that this might have affected the resting state EEG data. Additionally, the authors need to explain why they have not considered the data in eyes open condition. During the trials, the individuals were walking with their eyes open. The authors should consider this.

6. Topographical maps of Beta band are missing in figure 2. Please check.

7. Line 112-113- “This transformation expresses the distance between an individual BBSP and the average BBSP of the normal population for the participant's age.” When did the authors recruit age matched normal population? It is not mentioned in the document anywhere.

8. It will be good if the authors can discuss why they have not measured the participant’s EEG while they were walking at a certain gait speed. Measuring simultaneous EEG and gait speed would be more beneficial. It can help scientists and clinicians to interpret the hidden changes in brain activity more precisely.

9. Along with gait speed, it would be good if the authors could measure other gait parameters such as swing/ stance interval, toe-off and heel strikes, etc. and link these parameters with the changes in the cortical activity. This will add new insights into the study and help the future studies working on the rehabilitation of these individuals.

10. The authors can also consider finding the functional connectivity between highlighted brain regions.

11. The translation of the present findings into clinical applications is not clear. The article would benefit if the authors could explain this point in the conclusion of the study.

Reviewer #3: The study sought to explain whether the “hidden functional changes” in older adults are associated with an early decline in older adults' mobility. Although the study's results were evident, I believe that several issues should be taken into account before drawing a conclusion about the “hidden functional changes” and considering the replies to the authors' hypotheses. I've highlighted a few concerns and suggestions below, particularly for the discussion section:

Line 27: Please consider replacing “doctors” with “allied health professionals”.

Lines 32-33: The information regarding gait speed was not clear in the abstract. “We measured their gait speed at the usual pace (0.8 m/s cut-off point)”. In lines 35-36, the authors stated that 70% of the sample had a preclinical gait speed deterioration (i.e. lower than 0.8 m/s). After all, was 0.8 m/s seen as a sharp cut-off value for the usual pace or as an impaired gait speed? The abstract does not make this clear. Please make this information more understandable. I understand you, firstly, just measured walking speed. After, you consider the value of 0.8 m/s to differentiate the groups based on participants’ gait speed.

Lines 62-63: Please provide at least a reference to this statement: “However, gait is a process that, besides musculoskeletal and sensorial components, also depends on significant contributions from high-order cerebral areas for planning, execution, and control.”

Lines 63-66: Please provide at least a reference to this statement: “A preclinical deterioration of GS in older individuals without significant peripheral disorders or uncontrolled systemic disease is likely to be accompanied by subclinical changes in brain function as part of its underlying physiopathology.”

Methods

Lines 90, and 117: Please standardize the gait unit measure to m/s.

Why did the authors opt for dichotomous data (GS slower than 0.8 m/s: yes or no; normal or abnormal BBSP) and a Chi-square test, rather than continuous data for correlation analyses, for example, by a Pearson or Spearman correlation test?

Results

Table 1 – Please replace “N” with “n”.

Table 1 – Please delete the comma in “Mean (SD),”.

Discussion

Were the study hypotheses confirmed or refuted?

Despite the participants age around 77 years old, living independently in the community, and practicing physical activity with moderate regularity, to what do the authors attribute the percentage of 70% of the sample to have presented walking speed below 0.8 m/s? This is a relatively low gait speed for community-dwelling older adults with a relatively good level of physical activity. Please address this issue in the discussion, based on the literature.

Line 204: The authors stated, “The association between an early decline in gait speed and an abnormal EEG is not surprising.” So what was the additional motivation for this study if this result was already expected? Also, what do the authors consider an “early decline in gait speed”? Older adults with not very advanced ages or individuals with a walking speed that is not very compromised, i.e., above 1 m/s?

Lines 225-227: What do the authors consider “preclinical GS deterioration”? I don't consider a GS below 0.8 m/s as a preclinical characteristic. This is a very considerable and evident gait impairment. Also, “hidden changes in GS”. What do you attribute this term to? GS has been objectively evaluated and has nothing hidden chance. The GS, for my understanding, is very evident. Perhaps hidden changes in electroencephalographic activity and not in GS itself.

Lines 227-229: The authors stated “Different studies have reported, however, that MMSE is not a sensitive tool for detecting minor cognitive impairment [28,29].” Given that, why did the authors choose to use the MMSE instead of MoCA, for example? So, from what I understand, the authors wanted to verify the ability of the MMSE to identify any “preclinical GS deterioration”. If the authors already knew from the literature that the MMSE is not a sensitive tool for detecting minor cognitive impairment, why, even so, did they use this instrument in the study?

Lines 230-231: The authors stated “Another possibility to consider is that our participants were in an early stage where cognitive changes had not yet occurred.” Was it the MMSE test that failed to identify the participants' minor cognitive impairment, or were they actually in this stage of the condition? Perhaps the authors would have had a more accurate tool for identifying mild cognitive impairment if they had employed MoCA, for instance. Due to the potential for a false negative generated by the instrument employed to detect mild cognitive impairment, the authors should take another look at this lack of relationship.

Line 242: “Preclinical GS decline was present in 70% of the sample”. I continue to believe that a gait speed of less than or equal to 0.8 m/s should not be regarded as a preclinical characteristic. According to the research, this is already a significantly reduced walking speed.

Please provide and discuss the study's strengths and limitations.

**********

7. PLOS authors have the option to publish the peer review history of their article (what does this mean?). If published, this will include your full peer review and any attached files.

If you choose “no”, your identity will remain anonymous but your review may still be made public.

Do you want your identity to be public for this peer review? For information about this choice, including consent withdrawal, please see our Privacy Policy.

Reviewer #1: No

Reviewer #2: No

Reviewer #3: No

**********

[NOTE: If reviewer comments were submitted as an attachment file, they will be attached to this email and accessible via the submission site. Please log into your account, locate the manuscript record, and check for the action link "View Attachments". If this link does not appear, there are no attachment files.]

While revising your submission, please upload your figure files to the Preflight Analysis and Conversion Engine (PACE) digital diagnostic tool, https://pacev2.apexcovantage.com/. PACE helps ensure that figures meet PLOS requirements. To use PACE, you must first register as a user. Registration is free. Then, login and navigate to the UPLOAD tab, where you will find detailed instructions on how to use the tool. If you encounter any issues or have any questions when using PACE, please email PLOS at figures@plos.org. Please note that Supporting Information files do not need this step.

Attachment

Submitted filename: comments.docx

pone.0305074.s002.docx (14.9KB, docx)
PLoS One. 2024 Jun 4;19(6):e0305074. doi: 10.1371/journal.pone.0305074.r004

Author response to Decision Letter 1


7 Jan 2024

Reply to Reviewer #2:

We are very grateful for your comments and suggestions as they have helped us improve our manuscript. Please find below a point-to-point reply to your comments.

1. The introduction may benefit by highlighting the relevance of using EEG modality.

2. Please cite the previous literature in the introduction which proved that resting state EEG can predict the changes in brain functions while executing the task.

R/ We added the following text in the introduction:

“Given its high sensitivity, EEG is a valuable tool for assessing alterations in cerebral activity associated with functional states and for capturing the dynamic fluctuations linked to cognitive processes, emotions, and neurological conditions (12,13). EEG measurements taken during resting states hold predictive value for cognitive task performance (14,15), as the signal mirrors the functioning of underlying networks.”

3. Please add a picture of the representative participant while conducting the experiments in the method section. This will improve readability.

R/ Gait speed (GS) assessment was not experimental, but we used a method commonly employed by physiotherapists and geriatricians in the clinical practice. Participants were instructed to stand still behind a starting line marked on the floor (that was the beginning of the acceleration zone; see diagram below) and then walk at their usual pace for 6 meters. The first and last meters were used as acceleration and deceleration zones (represented as black rectangles in the diagram), while the middle four meters constituted the testing zone (represented as a white rectangle in the diagram). GS was quantified by the researcher with a stopwatch as the time spent to cover the testing zone (i.e., 4 meters) and was expressed in meters per second (m/sec).

We added a diagram (Fig. 1), as suggested by the reviewer, with a brief explanation that reads:

Fig 1. Diagram representing the gait speed assessment. Measurements were performed in a flat and unobstructed space by a trained researcher. Participants were instructed to stand at the beginning of the acceleration zone (first black rectangle covering 1 metre) and upon a command, to walk at their usual pace, passing the deceleration zone (second black rectangle also covering 1 metre). Gait speed was timed with a stopwatch in the middle 4 metres (time zone, the white rectangle in the diagram).

4. It would be better if the authors could add a flowchart describing the analysis and data processing of the study.

R/ The Fig1S -showing the analysis and data processing flow- is now available as supporting material.

5. Line 101-102- "Participants were asked to close and open their eyes at different moments to explore reactivity and avoid drowsiness". I believe that this might have affected the resting state EEG data. Additionally, the authors need to explain why they have not considered the data in eyes open condition. During the trials, the individuals were walking with their eyes open. The authors should consider this.

R/ The reviewer correctly assumes that the resting state EEG will differ under eyes closed (EC) and eyes open (EO) conditions. It is known that the frequency composition of the EEG is different under each of these states. Furthermore, Wei et al (2018) found that while brain activity during EC was higher in sensorimotor areas and temporal cortex, there was more activity in posterior areas, including the occipital and parietal cortex during EO. Therefore, the spontaneous fluctuation of brain activity is closely related to EC and EO resting state.

However, EO was only employed in our study as a procedure to guarantee the participant kept awake during the whole recording. Consequently, we did not acquire enough time under EO to perform a frequency analysis. We preferred to acquire the EEG under EC because it is an excellent condition to study brain activity without the influence of visual stimulus driving participants' internal state – as a consequence of internal thoughts triggered by visual analysis and attention. This was especially relevant in our study as we did not have an experimental task that required a baseline at rest with EO.

Another reason behind our decision is that clinical EEG, and most of the literature that have assessed changes in the EEG frequency composition in relation to cognitive status, have used segments during EC. This state enabled us to compare our results with previous findings.

Nevertheless, we will seriously consider the reviewer's concern and include EO as a state of interest in our future studies.

• Wei Jie et at. 2018. Eyes-Open and Eyes-Closed Resting States With Opposite Brain Activity in Sensorimotor and Occipital Regions: Multidimensional Evidences From Machine Learning Perspective. Frontiers in Human Neuroscience, 12. https://doi.org/10.3389/fnhum.2018.00422.

6. Topographical maps of Beta band are missing in figure 2. Please check.

R/ Since the main changes we described in our study comprise delta, theta and alpha bands, we initially presented topographical maps for those frequency bands. We also split the alpha band into lower and higher components to compare against the literature. However, for consistency, we now produced a figure with all frequency bands, including beta and alpha bands from 8-12Hz - as used in our study. We also modified the representation, and instead of surface maps, we are showing results on volumetric maps for better visualisation.

7. Line 112-113- "This transformation expresses the distance between an individual BBSP and the average BBSP of the normal population for the participant's age." When did the authors recruit age matched normal population? It is not mentioned in the document anywhere.

R/ We did not recruit age-matched controls. Instead, we use the normative database of the Cuban population to perform the comparison according to the participant's age. The database (Valdes-Sosa PA et al, 1990) contains quantitative EEG measures obtained from 211 healthy participants between 5 and 97 years old.

In the Methods section, we specify the following:

'… Absolute Power (AP) in the four classic frequency bands (delta, theta, alpha and beta) - here referred to as broad-band spectral parameters (BBSP) - were calculated and compared to the Cuban normative data of quantitative EEG (qEEG) [13].

The Z-transformed statistic was used to compare each participant's BBSP against the normative data.'

• Valdes-Sosa PA, Biscay R, Galan L, Bosch J, Szava S, Virues T. High resolution spectral EEG norms for topography. Brain Topography. 1990;3:281–2.

8. It will be good if the authors can discuss why they have not measured the participant's EEG while they were walking at a certain gait speed. Measuring simultaneous EEG and gait speed would be more beneficial. It can help scientists and clinicians to interpret the hidden changes in brain activity more precisely.

R/ We agree with the reviewer that recording the EEG while the participant is walking is essential to understand the brain dynamics related to the implementation and execution of gait and identify specific electrophysiological changes related to deterioration in waking. Unfortunately, we did not have the necessary technology (eg. portable amplifiers that the participant could carry while walking) to perform this measurement when we conducted this study.

9. Along with gait speed, it would be good if the authors could measure other gait parameters such as swing/ stance interval, toe-off and heel strikes, etc. and link these parameters with the changes in the cortical activity. This will add new insights into the study and help the future studies working on the rehabilitation of these individuals.

R/ We agree with the reviewer that measuring other gait parameters is also essential as they change with age, and their deterioration has been found to be associated with frailty. For instance, Montero-Odasso and co-workers (2011) found that frail older adults, besides a reduced gait speed, presented a high variability in the stride time. However, the assessment of stride time (ms), cadence (steps/min), step width (cm), and double support time (ms) require a technology (e.g. GAITRite) we did not have at the time we performed this study.

On the contrary, gait speed was a parameter easy to measure in our conditions. The latter it is also one of the points of our study: to support, beyond research, the inclusion of gait speed evaluation in the standard clinical -geriatric- assessment, given its simplicity, sensitivity and association with underlying abnormal brain function.

10. The authors can also consider finding the functional connectivity between highlighted brain regions.

R/ We sincerely appreciate the reviewer's suggestion. We will conduct a functional connectivity analysis with our data looking at the default mode regions and the sensorimotor regions. However, we wanted to include in this paper only measurements that can be performed in the clinical practice to reach a clinical audience while reserving more 'sophisticated' analysis for another type of paper.

11. The translation of the present findings into clinical applications is not clear. The article would benefit if the authors could explain this point in the conclusion of the study.

R/ We believe our findings can be translated into clinical practice by incorporating walking speed screening in all older adults, even the healthiest. This strategy would be beneficial to intervene in the deterioration of gait early enough and avoid falls or the slow evolution towards physical and cognitive decline. Furthermore, incorporating quantitative EEG into the specialised assessment of mobility function and rehabilitation pathways would allow risk stratification and objective evaluation of intervention success.

We have added a conclusion section were we state the following:

Our results support screening for and intervening in early decline in mobility to prevent or delay the onset of disability and dependence. Here, we showed that, despite being physically active, older people can present declines in GS (=<0.8 m/s). Slower GS was associated in this study with abnormally slow brain electrical activity for age, representing mild brain dysfunction. The latter poses an additional risk of developing further decline, including cognitive deterioration. Electrophysiological markers such as those used in this study are inexpensive and easy to implement, which makes it feasible to incorporate them in the functional assessment of older adults. With the challenge of prolonging years of functional life in ageing societies, it is essential to design strategies to restore early declines. A strategy that combines markers such as gait speed and quantitative EEG measures may be especially valuable in objectively assessing the success of intervention programs aimed at rehabilitating changes in mobility.

Reply to Reviewer #3

First, we sincerely appreciate your comments and suggestions as they have helped us improve our manuscript. Please find below a point-to-point reply to your comments.

1- Line 27: Please consider replacing "doctors" with "allied health professionals".

R/ We agree with the reviewer that allied health professionals should be also included as some of them evaluate older adults through different pathways. However, we want to stress that doctors (i.e., physicians such as GPs and Geriatricians) also overlooked early changes as they do not proactively assess older people function to detect subtle modifications. We feel that the term' health professional' includes all categories. Therefore, we changed the sentence, and now it reads:

These changes, frequently overlooked by patients and health professionals…

2- Lines 32-33: The information regarding gait speed was not clear in the abstract. "We measured their gait speed at the usual pace (0.8 m/s cut-off point)". In lines 35-36, the authors stated that 70% of the sample had a preclinical gait speed deterioration (i.e. lower than 0.8 m/s). After all, was 0.8 m/s seen as a sharp cut-off value for the usual pace or as an impaired gait speed? The abstract does not make this clear. Please make this information more understandable. I understand you, firstly, just measured walking speed. After, you consider the value of 0.8 m/s to differentiate the groups based on participants' gait speed.

R/ We agree with the reviewer that the sentence is not clear. We modified it, and now it reads:

We measured their gait speed at the usual pace and the cognitive status using the MMSE. A value of 0.8 m/s was used as a cut-off point to decide whether they presented a decline in gait speed.

3- Lines 62-63: Please provide at least a reference to this statement: "However, gait is a process that, besides musculoskeletal and sensorial components, also depends on significant contributions from high-order cerebral areas for planning, execution, and control."

R/ The following citations were added:

• Allali G et al (2019). Brain Structure Covariance Associated With Gait Control in Aging. J Gerontol A Biol Sci Med Sci . 74(5):705–13.

• Yogev-Seligmann G, Hausdorff JM, Giladi N. (2008). Movement Disorders. 28:329–42.

• Holtzer R, Verghese J, Xue X, Lipton RB (2006). Neuropsychology. 20(2):215–23.

4- Lines 63-66: Please provide at least a reference to this statement: "A preclinical deterioration of GS in older individuals without significant peripheral disorders or uncontrolled systemic disease is likely to be accompanied by subclinical changes in brain function as part of its underlying physiopathology."

R/ The following citations were added:

• Wilson J et al (2019). Neuroscience and Biobehavioral Reviews. Elsevier Ltd; p. 344–69.

• Verlinden VJA et al (2014). Alzheimer's and Dementia. 10(3):328–35.

• Holtzer R et al (2014). J Gerontol A Biol Sci Med Sci. 69(11):1375–88.

However, we also modified the sentence, and now it reads:

"deterioration of GS in older individuals that cannot be attributed to significant peripheral disorders or uncontrolled systemic disease is likely to be associated with abnormal brain function as part of its underlying physiopathology."

5- Methods

Lines 90, and 117: Please standardise the gait unit measure to m/s.

R/ Done

6- Why did the authors opt for dichotomous data (GS slower than 0.8 m/s: yes or no; normal or abnormal BBSP) and a Chi-square test, rather than continuous data for correlation analyses, for example, by a Pearson or Spearman correlation test?

R/ We chose a Chi-square test because while the GS data were continuous, the decision of whether the EEG was normal or not was dichotomous. That is, the participants' quantitative EEG data was classified as abnormal if the absolute Z value of the absolute power for any frequency band was above 1.96; otherwise it was consider as normal. Therefore, we also categorised the GS data using the study cut-off point to assess the association's presence.

Nevertheless, considering the reviewer's suggestion, we have now performed a logistic regression using the GS value as a continuous predictor of abnormality in the EEG. The results showed that GS predicts whether the EEG is abnormal or not (Wald test (1)=8.6, p=0.003; OR= 2.96, CI: 1.05,5.3). This additional test was added to the Method and Results section of the manuscript.

7- Results

Table 1 – Please replace "N" with "n".

R/ Done

8- Table 1 – Please delete the comma in "Mean (SD),".

R/ Done

9- Discussion

Were the study hypotheses confirmed or refuted?

R/ Our hypothesis was that a GS decline in our participants would be associated with a low MMSE score (<25 ) and EEG abnormal for the age. We found that 54 of 63 individuals with GS decline also had a significantly slower EEG. However, ONLY 10 of the 54 older adults with reduced GS and slow EEG had a MMSE < 25. Therefore, our hypothesis was partially confirmed.

10- Despite the participants age around 77 years old, living independently in the community, and practicing physical activity with moderate regularity, to what do the authors attribute the percentage of 70% of the sample to have presented walking speed below 0.8 m/s? This is a

Attachment

Submitted filename: Reply2Reviewers.docx

pone.0305074.s003.docx (80.9KB, docx)

Decision Letter 2

Ryota Sakurai

19 Mar 2024

PONE-D-22-18110R2Association between gait speed deterioration and EEG abnormalities.PLOS ONE

Dear Dr. Rodriguez-Rodriguez,

Thank you for submitting your manuscript to PLOS ONE. After careful consideration, we feel that it has merit but does not fully meet PLOS ONE’s publication criteria as it currently stands. Therefore, we invite you to submit a revised version of the manuscript that addresses the points raised during the review process.

Thank you for your effort to improve the manuscript. However, the reviewer still has several minor concerns on this paper. Please consider and respond to the comments from the reviewer.

Please submit your revised manuscript by May 03 2024 11:59PM. If you will need more time than this to complete your revisions, please reply to this message or contact the journal office at plosone@plos.org. When you're ready to submit your revision, log on to https://www.editorialmanager.com/pone/ and select the 'Submissions Needing Revision' folder to locate your manuscript file.

Please include the following items when submitting your revised manuscript:

  • A rebuttal letter that responds to each point raised by the academic editor and reviewer(s). You should upload this letter as a separate file labeled 'Response to Reviewers'.

  • A marked-up copy of your manuscript that highlights changes made to the original version. You should upload this as a separate file labeled 'Revised Manuscript with Track Changes'.

  • An unmarked version of your revised paper without tracked changes. You should upload this as a separate file labeled 'Manuscript'.

If you would like to make changes to your financial disclosure, please include your updated statement in your cover letter. Guidelines for resubmitting your figure files are available below the reviewer comments at the end of this letter.

If applicable, we recommend that you deposit your laboratory protocols in protocols.io to enhance the reproducibility of your results. Protocols.io assigns your protocol its own identifier (DOI) so that it can be cited independently in the future. For instructions see: https://journals.plos.org/plosone/s/submission-guidelines#loc-laboratory-protocols. Additionally, PLOS ONE offers an option for publishing peer-reviewed Lab Protocol articles, which describe protocols hosted on protocols.io. Read more information on sharing protocols at https://plos.org/protocols?utm_medium=editorial-email&utm_source=authorletters&utm_campaign=protocols.

We look forward to receiving your revised manuscript.

Kind regards,

Ryota Sakurai, Ph.D.

Academic Editor

PLOS ONE

Journal Requirements:

Please review your reference list to ensure that it is complete and correct. If you have cited papers that have been retracted, please include the rationale for doing so in the manuscript text, or remove these references and replace them with relevant current references. Any changes to the reference list should be mentioned in the rebuttal letter that accompanies your revised manuscript. If you need to cite a retracted article, indicate the article’s retracted status in the References list and also include a citation and full reference for the retraction notice.

Additional Editor Comments:

[Note: HTML markup is below. Please do not edit.]

Reviewers' comments:

Reviewer's Responses to Questions

Comments to the Author

1. If the authors have adequately addressed your comments raised in a previous round of review and you feel that this manuscript is now acceptable for publication, you may indicate that here to bypass the “Comments to the Author” section, enter your conflict of interest statement in the “Confidential to Editor” section, and submit your "Accept" recommendation.

Reviewer #1: All comments have been addressed

Reviewer #2: All comments have been addressed

**********

2. Is the manuscript technically sound, and do the data support the conclusions?

The manuscript must describe a technically sound piece of scientific research with data that supports the conclusions. Experiments must have been conducted rigorously, with appropriate controls, replication, and sample sizes. The conclusions must be drawn appropriately based on the data presented.

Reviewer #1: Yes

Reviewer #2: Yes

**********

3. Has the statistical analysis been performed appropriately and rigorously?

Reviewer #1: I Don't Know

Reviewer #2: Yes

**********

4. Have the authors made all data underlying the findings in their manuscript fully available?

The PLOS Data policy requires authors to make all data underlying the findings described in their manuscript fully available without restriction, with rare exception (please refer to the Data Availability Statement in the manuscript PDF file). The data should be provided as part of the manuscript or its supporting information, or deposited to a public repository. For example, in addition to summary statistics, the data points behind means, medians and variance measures should be available. If there are restrictions on publicly sharing data—e.g. participant privacy or use of data from a third party—those must be specified.

Reviewer #1: No

Reviewer #2: Yes

**********

5. Is the manuscript presented in an intelligible fashion and written in standard English?

PLOS ONE does not copyedit accepted manuscripts, so the language in submitted articles must be clear, correct, and unambiguous. Any typographical or grammatical errors should be corrected at revision, so please note any specific errors here.

Reviewer #1: Yes

Reviewer #2: Yes

**********

6. Review Comments to the Author

Please use the space provided to explain your answers to the questions above. You may also include additional comments for the author, including concerns about dual publication, research ethics, or publication ethics. (Please upload your review as an attachment if it exceeds 20,000 characters)

Reviewer #1: Although authors states that the dataset is available from the Aston Data Explorer, I was unable to locate it. Sharing a link or some guidance on how to access it would be helpful. I don't have any additional comments regarding the manuscript.

Reviewer #2: (No Response)

**********

7. PLOS authors have the option to publish the peer review history of their article (what does this mean?). If published, this will include your full peer review and any attached files.

If you choose “no”, your identity will remain anonymous but your review may still be made public.

Do you want your identity to be public for this peer review? For information about this choice, including consent withdrawal, please see our Privacy Policy.

Reviewer #1: No

Reviewer #2: No

**********

[NOTE: If reviewer comments were submitted as an attachment file, they will be attached to this email and accessible via the submission site. Please log into your account, locate the manuscript record, and check for the action link "View Attachments". If this link does not appear, there are no attachment files.]

While revising your submission, please upload your figure files to the Preflight Analysis and Conversion Engine (PACE) digital diagnostic tool, https://pacev2.apexcovantage.com/. PACE helps ensure that figures meet PLOS requirements. To use PACE, you must first register as a user. Registration is free. Then, login and navigate to the UPLOAD tab, where you will find detailed instructions on how to use the tool. If you encounter any issues or have any questions when using PACE, please email PLOS at figures@plos.org. Please note that Supporting Information files do not need this step.

Attachment

Submitted filename: Comments R2.docx

pone.0305074.s004.docx (13.2KB, docx)
PLoS One. 2024 Jun 4;19(6):e0305074. doi: 10.1371/journal.pone.0305074.r006

Author response to Decision Letter 2


5 Apr 2024

Reviewer 1

Reviewer #1: Although authors states that the dataset is available from the Aston Data Explorer, I was unable to locate it. Sharing a link or some guidance on how to access it would be helpful. I don't have any additional comments regarding the manuscript.

Reply: Some information was lacking in the dataset metadata and as a consequence, it was not properly shared. This is now fixed, and the dataset is available here:

https://doi.org/10.17036/researchdata.aston.ac.uk.00000557.

Reviewer 2

1. Flowchart describing the analysis and data processing of the study should be included in the article, not as a supporting information.

Reply: The flowchart is now included as Figure 2. The rest of the figures were re-numbered.

2. Measuring simultaneous EEG and gait parameters can help scientists and clinicians to interpret the hidden changes in brain activity more precisely. Also, the association between the two can be done more accurately when the data is recorded in synchronization.

I am not really satisfied with the author response on this. I believe the study's protocols has limitations. If the authors can discuss this limitation in detail, it will be good for future research in this field.

Reply: The following paragraph was added acknowledging the benefits of simultaneous acquisition of EEG and gait:

In this study we assessed the association between gait speed decline and the presence of brain dysfunction by analysing the EEG at rest. However, we aim to incorporate in future research studies, the simultaneous acquisition of brain electrical activity during walking tasks which was not possible in this investigation. By simultaneously acquiring the EEG and gait, it is possible to elucidate specific changes in brain dynamics related to the different phases of gait. Furthermore, the high temporal resolution of EEG allows us to closely follow the coupling between movement planning, implementation and control and the brain's electrical activity. This strategy is essential to better understand the nature of the gait deterioration and design specific rehabilitation.

Attachment

Submitted filename: Reply to reviewers.docx

pone.0305074.s005.docx (16.6KB, docx)

Decision Letter 3

Ryota Sakurai

12 Apr 2024

Association between gait speed deterioration and EEG abnormalities.

PONE-D-22-18110R3

Dear Dr. Rodriguez-Rodriguez,

We’re pleased to inform you that your manuscript has been judged scientifically suitable for publication and will be formally accepted for publication once it meets all outstanding technical requirements.

Within one week, you’ll receive an e-mail detailing the required amendments. When these have been addressed, you’ll receive a formal acceptance letter and your manuscript will be scheduled for publication.

An invoice will be generated when your article is formally accepted. Please note, if your institution has a publishing partnership with PLOS and your article meets the relevant criteria, all or part of your publication costs will be covered. Please make sure your user information is up-to-date by logging into Editorial Manager at Editorial Manager® and clicking the ‘Update My Information' link at the top of the page. If you have any questions relating to publication charges, please contact our Author Billing department directly at authorbilling@plos.org.

If your institution or institutions have a press office, please notify them about your upcoming paper to help maximize its impact. If they’ll be preparing press materials, please inform our press team as soon as possible -- no later than 48 hours after receiving the formal acceptance. Your manuscript will remain under strict press embargo until 2 pm Eastern Time on the date of publication. For more information, please contact onepress@plos.org.

Kind regards,

Ryota Sakurai, Ph.D.

Academic Editor

PLOS ONE

Additional Editor Comments (optional):

Reviewers' comments:

Reviewer's Responses to Questions

Comments to the Author

1. If the authors have adequately addressed your comments raised in a previous round of review and you feel that this manuscript is now acceptable for publication, you may indicate that here to bypass the “Comments to the Author” section, enter your conflict of interest statement in the “Confidential to Editor” section, and submit your "Accept" recommendation.

Reviewer #2: All comments have been addressed

**********

2. Is the manuscript technically sound, and do the data support the conclusions?

The manuscript must describe a technically sound piece of scientific research with data that supports the conclusions. Experiments must have been conducted rigorously, with appropriate controls, replication, and sample sizes. The conclusions must be drawn appropriately based on the data presented.

Reviewer #2: Yes

**********

3. Has the statistical analysis been performed appropriately and rigorously?

Reviewer #2: Yes

**********

4. Have the authors made all data underlying the findings in their manuscript fully available?

The PLOS Data policy requires authors to make all data underlying the findings described in their manuscript fully available without restriction, with rare exception (please refer to the Data Availability Statement in the manuscript PDF file). The data should be provided as part of the manuscript or its supporting information, or deposited to a public repository. For example, in addition to summary statistics, the data points behind means, medians and variance measures should be available. If there are restrictions on publicly sharing data—e.g. participant privacy or use of data from a third party—those must be specified.

Reviewer #2: Yes

**********

5. Is the manuscript presented in an intelligible fashion and written in standard English?

PLOS ONE does not copyedit accepted manuscripts, so the language in submitted articles must be clear, correct, and unambiguous. Any typographical or grammatical errors should be corrected at revision, so please note any specific errors here.

Reviewer #2: Yes

**********

6. Review Comments to the Author

Please use the space provided to explain your answers to the questions above. You may also include additional comments for the author, including concerns about dual publication, research ethics, or publication ethics. (Please upload your review as an attachment if it exceeds 20,000 characters)

Reviewer #2: All the comments have been addressed. I accept the manuscript in its current form. I wish the authors all the best for their future endeavors.

**********

7. PLOS authors have the option to publish the peer review history of their article (what does this mean?). If published, this will include your full peer review and any attached files.

If you choose “no”, your identity will remain anonymous but your review may still be made public.

Do you want your identity to be public for this peer review? For information about this choice, including consent withdrawal, please see our Privacy Policy.

Reviewer #2: No

**********

Acceptance letter

Ryota Sakurai

24 May 2024

PONE-D-22-18110R3

PLOS ONE

Dear Dr. Rodriguez-Rodriguez,

I'm pleased to inform you that your manuscript has been deemed suitable for publication in PLOS ONE. Congratulations! Your manuscript is now being handed over to our production team.

At this stage, our production department will prepare your paper for publication. This includes ensuring the following:

* All references, tables, and figures are properly cited

* All relevant supporting information is included in the manuscript submission,

* There are no issues that prevent the paper from being properly typeset

If revisions are needed, the production department will contact you directly to resolve them. If no revisions are needed, you will receive an email when the publication date has been set. At this time, we do not offer pre-publication proofs to authors during production of the accepted work. Please keep in mind that we are working through a large volume of accepted articles, so please give us a few weeks to review your paper and let you know the next and final steps.

Lastly, if your institution or institutions have a press office, please let them know about your upcoming paper now to help maximize its impact. If they'll be preparing press materials, please inform our press team within the next 48 hours. Your manuscript will remain under strict press embargo until 2 pm Eastern Time on the date of publication. For more information, please contact onepress@plos.org.

If we can help with anything else, please email us at customercare@plos.org.

Thank you for submitting your work to PLOS ONE and supporting open access.

Kind regards,

PLOS ONE Editorial Office Staff

on behalf of

Dr. Ryota Sakurai

Academic Editor

PLOS ONE

Associated Data

    This section collects any data citations, data availability statements, or supplementary materials included in this article.

    Supplementary Materials

    Attachment

    Submitted filename: Reply2Reviewer1.pdf

    pone.0305074.s001.pdf (115.5KB, pdf)
    Attachment

    Submitted filename: comments.docx

    pone.0305074.s002.docx (14.9KB, docx)
    Attachment

    Submitted filename: Reply2Reviewers.docx

    pone.0305074.s003.docx (80.9KB, docx)
    Attachment

    Submitted filename: Comments R2.docx

    pone.0305074.s004.docx (13.2KB, docx)
    Attachment

    Submitted filename: Reply to reviewers.docx

    pone.0305074.s005.docx (16.6KB, docx)

    Data Availability Statement

    Data is available from the Aston Data Explorer database (accession number: https://doi.org/10.17036/researchdata.aston.ac.uk.00000557).


    Articles from PLOS ONE are provided here courtesy of PLOS

    RESOURCES