

Abstract
Background.
Human immunodeficiency virus (HIV) viral load (VL) monitoring is critical for antiretroviral therapy (ART) management. Point-of-care (POC) VL testing has been reported to be feasible and preferred over standard-of-care (SOC) testing in many low- and middle-income country settings where rapid results could improve patient outcomes.
Methods.
The timeliness of receipt of VL results was evaluated in an open-label, randomized, controlled trial among patients newly initiating ART. Clinical outcomes with POC VL monitoring using Cepheid Xpert vs SOC VL at Jos University Teaching Hospital and Comprehensive Health Centre Zamko in Nigeria were assessed. We determined time between specimen collection and recording of VL in patient charts, receipt of results, and ART switch for those who met virologic failure criteria.
Results.
Between April 2018 and October 2019, we screened 696 ART-naive individuals; 273 were randomized to POC and 268 to SOC HIV-1 VL testing. Participants in the POC arm received VL results significantly faster than those in the SOC arm (0.1 median days, interquartile range [IQR], 0.1–0.2 vs 143.1 days, IQR, 56.0–177.1, respectively; P < .0001). Participants in the POC arm with confirmed virologic failure vs those in the SOC arm were switched more rapidly to a second-line regimen (0 median days, IQR, 0–28 vs 66 days, IQR, 63–123, respectively; P = .03).
Conclusions.
POC VL testing resulted in significant improvement in the timeliness of VL result receipt by patients and use for effective HIV clinical management. In patients experiencing VL failure, POC monitoring enabled prompt switching to second-line ART regimens.
Clinical Trials Registration.
Keywords: point-of-care, viral load, monitoring, HIV, Africa
UNAIDS established ambitious 2025 goals to end the AIDS epidemic including viral suppression among 95% of antiretroviral therapy (ART) recipients. While viral load (VL) testing, the gold standard for ART monitoring, is central to realizing these aims, only 38% of people with human immunodeficiency virus (HIV; PWH) are estimated to have access globally [1]. Where available, required infrastructure and laboratory expertise often necessitate transport and batch testing at central laboratories, resulting in long turnaround times (TATs). Point-of-care (POC) VL assays with rapid results and minimal laboratory requirements have the potential to optimize ART management in low- and middle-income country (LMIC) settings [2].
Ultimately, implementation in real-world settings will determine their impact on ART provision. By promptly identifying ART failures, POC VL monitoring may limit ART drug resistance that could emerge in nonadherent and failing patients awaiting results while also immediately improving viral suppression through same-day adherence counseling or switch to suppressive regimens. It is therefore important to evaluate the timeliness of VL results for ART management decisions [3].
The Cepheid GeneXpert HIV-1 VL assay with a 90-minute test process is feasible in many LMIC settings [4–12]. Characterized as a “near-POC” assay, it requires laboratory processing of venous blood samples [10] and is highly sensitive (92.5%–98.6%) compared with conventional VL testing [4, 9, 10]. However, the impact of POC VL monitoring on timeliness and HIV clinical management remains less well studied.
Nigeria is home to 1.7 million PWH [13]. Since 2004, the Harvard/AIDS Prevention Initiative in Nigeria (APIN) President’s Emergency Plan for AIDS Relief (PEPFAR) Program has provided ART across the country. We implemented Cepheid GeneXpert at a large university teaching hospital and a secondary rural ART clinic in north central Nigeria to evaluate the impact of POC VL testing compared with standard of care (SOC) using a 2-arm, randomized, controlled trial, as described [14]. The primary outcome of the 12-month trial was that POC viral monitoring significantly improved viral suppression compared with standard monitoring, as previously reported [15]. Here, we report on the effectiveness of POC VL testing relative to SOC for improving TATs of VL results and resultant clinical decision-making during the first year of ART.
METHODS
Study Design and Participants
We conducted an open-label, randomized, implementation trial among ART-naive patients at 2 clinics. The APIN PEPFAR-supported HIV clinic at Jos University Teaching Hospital (JUTH) is a large tertiary urban hospital serving the greater Jos region in north central Nigeria. The JUTH laboratory provides centralized VL quantification to surrounding HIV clinics, including Comprehensive Health Centre Zamko (CHCZ), a secondary rural hospital 200 km southeast of Jos. The 2 distinct clinical settings were chosen to evaluate differences in implementation, with CHCZ representing the typical healthcare setting appropriate for POC VL testing. The JUTH laboratory supports VL testing for 168 health facilities, where samples are run in batches and backlogs are frequent, with result TATs ranging from weeks to months.
Trial inclusion criteria were all PWH initiating ART between April 2018 and October 2019. Exclusion criteria were previous ART experience or current pregnancy, as pregnant women with HIV require a different VL monitoring schedule by Nigerian national ART guidelines. Patients with tuberculosis (TB) were eligible once initiated on ART. All demographic, clinical, and laboratory data were captured in the APIN PEPFAR electronic medical record system [16].
Procedures
We randomized patients using a permuted block process to create assignment lists for each clinic; block size was based on average weekly enrollment rates. Clinic staff used these lists to sequentially assign patients to the next allocation. All patients were tested with SOC VL assays at baseline and randomized (1:1) to receive follow-up POC VL testing with the Cepheid GeneXpert assay or SOC VL testing using the Roche COBAS AmpliPrep/TaqMan (CAP/CTM)HIV-1Test, v2.0(Roche, Indianapolis, IN). The lower limit of detection for the GeneXpert assay is 10 copies/mL; for the Roche assay, it is 20 copies/mL.
All enrolled patients followed Nigerian National ART guidelines with scheduled clinic visits at 6 months and 12 months post-ART initiation [16]. Patients returned monthly to collect ART at pharmacies. At study start, most ART-naive adult patients began tenofovir/lamivudine/efavirenz regimens. In 2019, dolutegravir (DTG) became the preferred first-line regimen, in accordance with updated World Health Organization (WHO) guidance [17]. Thus, most ART-naive patients and those with a suppressed VL on alternate first-line regimens were transitioned to a DTG-based regimen during the trial.
At 6-month and 12-month study visits, we collected venous blood samples, from which plasma was obtained for VL and other routine laboratory evaluations. Whole blood was collected into 10-mL EDTA purple Vacutainer tubes, mixed by gentle inversion, and centrifuged at 3500 rpm for 10 minutes. For the GeneXpert instrument, approximately 1.2 mL plasma was transferred to a labeled cartridge and inserted into the GeneXpert module for testing. We asked patients in the POC arm to wait approximately 2–3 hours for results. If unable to wait, the study coordinator called them with results once available. If virally unsuppressed (≥1000 copies/mL), patients received enhanced adherence counseling (EAC) and follow-up VL tests after 3 months. If patients remained virally unsuppressed, regimens were switched the same day to a second-line regimen. In the SOC arm, patients received VL results at their next clinical visit if virally suppressed. If virally unsuppressed, charts were flagged, and patients were referred for EAC during monthly pharmacy pickups and scheduled for follow-up VL 3 months later. If still unsuppressed, patients returned to clinic for second-line switch [15].
Study-specific databases used at clinics recorded trial enrollment and clinical visit information. All date times for VL sampling, analysis, and result delivery were recorded, including VL sample collection, receipt at the laboratory, sample testing, retesting if invalid, result entry in patient chart, and result delivery to patient.
Training Quality Control and Laboratory Requirements
At both sites, medical laboratory scientists and technicians performed HIV VL testing using Cepheid GeneXpert instruments. Prior to study initiation, Cepheid provided on-line training on installation and use of the GeneXpert machine. Prior experience and training with the GeneXpert platform for TB diagnosis was available at JUTH. The US Centers for Disease Control and Prevention (CDC) provided daily internal quality control panels as part of routine quality checks. In addition, study laboratories were enrolled in the biannual Afriqualab HIV-1 Viral Load (VL) External Quality Assurance/Proficiency Test Program provided by Cheikh Anta Diop Dakar University with outstanding performance.
Study laboratories were equipped with a small dead air box workstation with ultraviolet light, a small centrifuge, an air conditioner, a backup power generator, and running water supply.
Over the 2-year study period, the GeneXpert instrument performed smoothly, although 1 replacement was needed. Both laboratories had robust capacity for electronic data management and storage.
Outcomes
We assessed time from confirmed virologic failure to second-line ART switch between study arms. To understand the role of laboratory delays, we computed time from sample collection to result entry in patient charts. We also compared time from specimen collection to delivery of results to patients by study arm at 6 months and 12 months.
Statistical Methods
We performed Pearson χ2 and Fisher exact tests to assess proportions, the Student t test to compare means, and the Wilcoxon Mann–Whitney test to assess medians. We generated Kaplan–Meier curves to illustrate differences in TATs for 6-month and 12-month VL result delivery to patients by study arm. We also fit Cox proportional hazards models to estimate hazard ratios (HRs). Adjusted models accounted for patient age (adult vs pediatric) and sex, clinic (JUTH vs CHCZ), and viral suppression status. We performed all analyses using R version 4.1.1 (R Foundation, Vienna, Austria) or Stata/SE version 13.1 (Stata Corporation, College Station, TX).
Proxy dates were determined if the date patients received results were not recorded for SOC VL testing, using the patient’s next clinic visit occurring >14 days after the VL test date, in accordance with standard clinic procedures for returning results.
We also conducted sensitivity analyses to assess the impact of incorporating proxy dates.
Ethics
All participants provided written informed consent. We obtained written parental permission for children aged <18 years and assent for those aged 7–17 years. The JUTH and Harvard T. H. Chan School of Public Health institutional review boards approved the study. The study protocol was approved by the CDC as research in which CDC staff were not directly engaged with human participants.
RESULTS
Between April 2018 and October 2019, we screened 649 adult and 47 pediatric patients for trial eligibility, enrolled 541 patients, and randomized 273 to the POC arm and 268 to the SOC arm (Figure 1). Baseline participant characteristics (Tables 1 and 2) were previously described [15]. Briefly, patients were 65% (349 of 541) female with a median age of 35 years (interquartile range [IQR], 28–43). Among adults, 119 (24%) were single, 264 (53%) married, 67 (14%) divorced or separated, and 46 (9%) widowed; 136 (27%) had no education, 119 (24%) had only primary education, and 241 (49%) had secondary or tertiary education.
Figure 1.

Flowchart (or CONSORT diagram). Abbreviations: POC, point of care; SOC, standard of care; VL, viral load.
Table 1.
Baseline Demographic and Clinical Characteristics of Adult Trial Patients: Jos University Teaching Hospital and Comprehensive Health Centre Zamko
| Characteristic | JUTH Adult |
CHCZ Adult |
Total Adult |
P Value,b JUTH vs CHCZ | |||
|---|---|---|---|---|---|---|---|
| POC (N = 148), n (%)a | SOC (N = 145), n (%) | POC (N = 102), n (%) | SOC (N = 101), n (%) | POC (N = 250), n (%) | SOC (N = 246), n (%) | ||
| Age, median (IQR), years | 38 (31–45) | 37 (30–42) | 33 (29–40) | 35 (30–43) | 36 (30–43) | 36 (30– 42) | |
| 18–29 | 28 (18.9) | 31 (21.4) | 28 (27.5) | 24 (23.8) | 56 (22.4) | 55 (22.4) | .079 |
| 30–35 | 35 (23.6) | 35 (24.1) | 30 (29.4) | 31 (30.7) | 65 (26.0) | 66 (26.8) | |
| 36–42 | 34 (23.0) | 44 (30.3) | 26 (25.5) | 20 (19.8) | 60 (24.0) | 64 (26.0) | |
| >42 | 51 (34.5) | 35 (24.1) | 18 (17.6) | 26 (25.7) | 69 (27.6) | 61 (24.8) | |
| Female sex (vs male) | 88 (59.5) | 92 (63.4) | 76 (74.5) | 70 (69.3) | 164 (65.6) | 162 (65.9) | .016 |
| Education | |||||||
| None | 14 (9.5) | 10 (6.9) | 55 (53.9) | 57 (56.4) | 69 (27.6) | 67 (27.2) | <.001* |
| Primary | 43 (29.1) | 33 (22.8) | 22 (21.6) | 21 (20.8) | 65 (26.0) | 54 (22.0) | |
| Secondary | 43 (29.1) | 43 (29.7) | 23 (22.5) | 20 (19.8) | 66 (26.4) | 63 (25.6) | |
| Tertiary | 48 (32.4) | 59 (40.7) | 2 (2.0) | 3 (3.0) | 50 (20.0) | 62 (25.2) | |
| Employment | |||||||
| Nonincome-generating | 34 (23.0) | 31 (21.4) | 12 (14.3) | 13 (15.1) | 46 (19.8) | 44 (19.1) | <.001* |
| Labor/service/trade | 87 (58.8) | 86 (59.3) | 69 (82.1) | 72 (83.7) | 156 (67.2) | 158 (68.4) | |
| Professional/manageria1 | 27 (18.2) | 28 (19.3) | 3 (3.6) | 1 (1.2) | 30 (12.9) | 29 (12.6) | |
| Marital status | |||||||
| Single | 44 (29.7) | 43 (29.7) | 18 (17.6) | 14 (13.9) | 62 (24.8) | 57 (23.2) | .001 |
| Married | 77 (52.0) | 69 (47.6) | 61 (59.8) | 57 (56.4) | 138 (55.2) | 126 (51.2) | |
| Divorced/separated | 13 (8.8) | 18 (12.4) | 16 (15.7) | 20 (19.8) | 29(11.6) | 38 (15.5) | |
| Widowed | 14 (9.5) | 15 (10.3) | 7 (6.9) | 10 (9.9) | 21 (8.4) | 25 (10.2) | |
| World Health Organization clinical stage | |||||||
| 1 | 91 (61.9) | 97 (67.4) | 73 (71.6) | 69 (68.3) | 164 (65.9) | 166 (67.8) | .017* |
| 2 | 28 (19.0) | 24 (16.7) | 19 (18.6) | 23 (22.8) | 47 (18.9) | 47 (19.2) | |
| 3 | 27 (18.4) | 21 (14.6) | 8 (7.8) | 7 (6.9) | 35 (14.1) | 28 (11.4) | |
| 4 | 1 (0.7) | 2 (1.4) | 2 (2.0) | 2 (2.0) | 3(1.2) | 4 (1.6) | |
| Tuberculosis coinfection | 14 (9.5) | 10 (6.9) | 3 (2.9) | 0 (0.0) | 17 (6.8) | 10 (4.1) | .001* |
| Body mass index, median (IQR), kg/m2 | 21.2 (19.3–24.2) | 21.0 (18.7–25.2) | 20.4 (18.3–23.2) | 20.4 (18.0–23.4) | 21.0 (18.8–23.7) | 20.9 (18.5–24.0) | |
| Underweight (<18.5) | 25 (17.7) | 31 (22.6) | 24 (27.3) | 23 (28.4) | 49 (21.4) | 54 (24.8) | .003* |
| Normal (18.5–24.9) | 92 (65.2) | 71 (51.8) | 58 (65.9) | 47 (58.0) | 150 (65.5) | 118 (54.1) | |
| Overweight (25.0–29.9) | 18 (12.8) | 26 (19.0) | 5 (5.7) | 11 (13.6) | 23 (10.0) | 37 (17.0) | |
| Obese (≥30.0) | 6 (4.3) | 9 (6.6) | 1 (1.1) | 0 (0.0) | 7(3.1) | 9 (4.1) | |
| Viral load, median (IQR), copies/mL | 95 922 (17 748–301 519) | 121 850 (20919–362 895) | 113 416 (17369–453 136) | 80 322 (22 839–417 132) | 106 347 (17 748–342 093) | 99 836 (21 810–394 839) | |
| <10 000 | 29 (19.6) | 26 (18.2) | 21 (21.0) | 17 (18.5) | 50 (20.2) | 43 (18.3) | .855 |
| 10 000–99 999 | 45 (30.4) | 42 (29.4) | 27 (27.0) | 33 (35.9) | 72 (29.0) | 75 (31.9) | |
| 100 000–999 999 | 64 (43.2) | 59 (41.3) | 41 (41.0) | 33 (35.9) | 105 (42.3) | 92 (39.2) | |
| ≥1 000000 | 10(6.8) | 16(11.2) | 11(11.0) | 9(9.8) | 21(8.5) | 25(10.6) | |
| Initial antiretroviral therapy regimen | |||||||
| ABC-3TC-DTG | 1 (0.7) | 1 (0.7) | 0 (0.0) | 0 (0.0) | 1 (0.4) | 1 (0.4) | .009* |
| ABC-3TC-EFV | 2 (1.4) | 4 (2.8) | 0 (0.0) | 0 (0.0) | 2 (0.8) | 4 (1.6) | |
| AZT-3TC-NVP | 0 (0.0) | 0 (0.0) | 1 (1.0) | 0 (0.0) | 1 (0.4) | 0 (0.0) | |
| TDF-3TC-DTG | 46 (31.1) | 47 (32.4) | 26 (25.5) | 22 (21.8) | 72 (28.8) | 69 (28.1) | |
| TDF-3TC-EFV | 99 (66.9) | 93 (64.1) | 75 (73.5) | 79 (78.2) | 174 (69.6) | 172 (69.9) | |
Abbreviations: 3TC, lamivudine; ABC, abacavir; AZT, zidovudine; CHCZ, Comprehensive Health Centre Zamko; DTG, dolutegravir; EFV, efavirenz; IQR, interquartile range; JUTH, Jos University Teaching Hospital; NVP, nevirapine; POC, point of care; SOC, standard of care; TDF, tenofovir.
Values shown are n (%) unless otherwise indicated; % is of those with recorded value.
The χ2 test or Fisher exact test was used for frequencies ≤5 (asterisked) to obtain P values for comparisons between the JUTH and CHCZ clinics.
Table 2.
Baseline Demographic and Clinical Characteristics of Pediatric Trial Patients: Jos University Teaching Hospital and Comprehensive Health Centre Zamko
| JUTH Pediatric |
CHCZ Pediatric |
All Pediatric |
|||||
|---|---|---|---|---|---|---|---|
| Characteristic | POC (N = 14), n (%)a | SOC (N = 14), n (%) | POC (N = 9), n (%) | SOC (N = 8), n (%) | POC (N = 23), n (%) | SOC (N = 22), n (%) | PValueb (JUTH vs CHCZ) |
| Age, years | |||||||
| <5 | 4 (28.6) | 4 (28.6) | 2 (22.2) | 6 (75.0) | 6 (26.1) | 10 (45.5) | .077 |
| 5–9 | 5 (35.7) | 5 (35.7) | 6 (66.7) | 2 (25.0) | 11 (47.8) | 7 (31.8) | |
| 10–17 | 5 (35.7) | 5 (35.7) | 1 (11.1) | 0 (0.0) | 6(26.1) | 5 (22.7) | |
| Female sex (vs male) | 8 (57.1) | 8 (57.1) | 6 (66.7) | 1 (12.5) | 14 (60.9) | 9 (40.9) | .365 |
| World Health Organization clinical stage | |||||||
| 1 | 7 (70.0) | 6 (54.5) | 4 (50.0) | 3 (37.5) | 11 (61.1) | 9 (47.4) | .545 |
| 2 | 3 (30.0) | 2 (18.2) | 4 (50.0) | 2 (25.0) | 7 (38.9) | 4 (21.1) | |
| 3 | 0 (0.0) | 3 (27.3) | 0 (0.0) | 2 (25.0) | 0 (0.0) | 5 (26.3) | |
| 4 | 0 (0.0) | 0 (0.0) | 0 (0.0) | 1 (12.5) | 0 (0.0) | 1 (5.3) | |
| Tuberculosis coinfection | 0 (0.0) | 2 (14.3) | 0 (0.0) | 0 (0.0) | 0 (0.0) | 2 (9.1) | .519 |
| Weight-for-age (z score) | |||||||
| Wasted: less than -2SD | 3 (21.4) | 1 (7.1) | 0 (0.0) | 0 (0.0) | 3 (20.0) | 1 (6.3) | 1 |
| Normal: −2SD to +2SD (<5 years); −2SD to +1SD (≥5 years) | 9 (64.3) | 12 (85.7) | 1 (100) | 2 (100) | 10 (66.7) | 14 (87.5) | |
| Overweight: greater than +2SD (<5 years); greater than +1SD (≥5 years) | 2 (14.3) | 1 (7.1) | 0 (0.0) | 0 (0.0) | 2 (13.3) | 1 (6.3) | |
| Viral load, copies/mL | |||||||
| <10 000 | 2 (14.3) | 2 (14.3) | 2 (33.3) | 2 (28.6) | 4 (20.0) | 4 (19.1) | .039 |
| 10 001–99 999 | 6 (42.9) | 4 (28.6) | 2 (33.3) | 3 (42.9) | 8 (40.0) | 7 (33.3) | |
| 100 000–999 999 | 6 (42.9) | 8 (57.1) | 1 (16.7) | 1 (14.3) | 7 (35.0) | 9 (42.9) | |
| ≥1 000 000 | 0 (0.0) | 0 (0.0) | 1 (16.7) | 1 (14.3) | 1 (5.0) | 1 (4.8) | |
| Initial antiretroviral therapy regimen | |||||||
| ABC-3TC-EFV | 0 (0.0) | 1 (7.1) | 0 (0.0) | 0 (0.0) | 0 (0.0) | 1 (4.6) | <.001 |
| ABC-3TC-LPV/r | 2 (14.3) | 3 (21.4) | 2 (22.2) | 0 (0.0) | 4 (17.4) | 3 (13.6) | |
| AZT-3TC-EFV | 5 (35.7) | 7 (50.0) | 0 (0.0) | 1 (12.5) | 5(21.7) | 8 (36.4) | |
| AZT-3TC-LPV/r | 0 (0.0) | 0 (0.0) | 3 (33.3) | 2 (25.0) | 3 (13.0) | 2 (9.1) | |
| AZT-3TC-NVP | 3 (21.4) | 1 (7.1) | 4 (44.4) | 5 (62.5) | 7 (30.4) | 6 (27.3) | |
| TDF-3TC-DTG | 2 (14.3) | 2 (14.3) | 0 (0.0) | 0 (0.0) | 2 (8.7) | 2 (9.1) | |
| TDF-3TC-EFV | 2 (14.3) | 0 (0.0) | 0 (0.0) | 0 (0.0) | 2 (8.7) | 0 (0.0) | |
Abbreviations: 3TC, lamivudine; ABC, abacavir; AZT, zidovudine; CHCZ, Comprehensive Health Centre Zamko; DTG, dolutegravir; EFV, efavirenz; IQR, interquartile range;JUTH, Jos University Teaching Hospital; LPV/r, lopinavir/ritonavir; NVP, nevirapine; POC, point of care; SD, standard deviation; SOC, standard of care; TDF, tenofovir.
Values shown are n (%) unless otherwise indicated; % is of those with recorded value.
The Fisher exact test was used to obtain P values for comparisons between the JUTH and CHCZ clinics.
Virologic Suppression and Time to Second-Line ART Switch
Among adult patients with confirmed virologic failure, 8 of 9 in the POC arm (88.9%) were switched to second-line ART, while 5 of 8 (62.5%) were switched in the SOC arm (Table 3). Median time between confirmed virologic failure and second-line ART switch was 0 days (IQR, 0–18) in the POC arm and 66 days (IQR, 63–123) in the SOC arm (P = .007). Some patients experiencing confirmed virologic failure were not switched because they were lost to follow-up (n = 1) or prescribed DTG in compliance with the current policy of transitioning eligible patients to DTG-based regimens (n = 3).
Table 3.
Timing of Switch to Second-Line Antiretroviral Treatment Among Patients With Human Immunodeficiency Virus Virologic Failure by Type of Viral Load Test
| VL Test | ID | Initial Regimen | 6-Month VL (Copies/mL) | Timing of 6-Month VL (Months) | Confirmatory VL (Copies/mL) | Timing of Confirmatory VL (Months) | Antiretroviral Treatment Regimen at Switch or Second VL | Patient Switched to Second-Line Regimen? | Time to Switch (Days) |
|---|---|---|---|---|---|---|---|---|---|
|
| |||||||||
| POC | 1 | TDF-3TC-EFV | 175 598 | 5.6 | 74 228 | 9.3 | TDF-3TC-ATV/r | Yes | 28 |
| 2 | TDF-3TC-EFV | 79 462 | 5.7 | 229 000 | 8.5 | TDF-3TC-ATV/r | Yes | 0 | |
| 3 | TDF-3TC-EFV | 1 170 000 | 5.8 | 866 000 | 8.5 | TDF-3TC-ATV/r | Yes | 0 | |
| 4 | TDF-3TC-EFV | 218 000 | 6.7 | 139 000 | 10.3 | TDF-3TC-ATV/r | Yes | 0 | |
| 5 | TDF-3TC-EFV | 3180 | 5.8 | 8280 | 11.6 | TDF-3TC-ATV/r | Yes | 0 | |
| 6 | TDF-3TC-EFV | 170 000 | 5.5 | 209 000 | 14.5 | AZT-3TC-ATV/r | Yes | 0 | |
| 7 | TDF-3TC-EFV | 5050 | 5.5 | 12 900 | 8.3 | TDF-3TC-LPV/r | Yes | 56 | |
| 8 | TDF-3TC-EFV | 9900 | 6.7 | 9009 | 9.4 | TDF-3TC-LPV/r | Yes | 7 | |
| POC | 9 | TDF-3TC-EFV | 166 000 | 6.7 | 1450 | 11.3 | TDF-3TC-DTG | No | … |
| SOC | 10 | TDF-3TC-EFV | 686 778 | 5.7 | 848 030 | 10.3 | TDF-3TC-ATV/r | Yes | 63 |
| 11 | TDF-3TC-EFV | 161 592 | 5.5 | 521 449 | 11.3 | TDF-3TC-ATV/r | Yes | 140 | |
| 12 | TDF-3TC-EFV | 289 463 | 5.5 | 173 728 | 12.0 | TDF-3TC-ATV/r | Yes | 123 | |
| 13 | TDF-3TC-EFV | 80 850 | 6.0 | 3 567 568 | 12.9 | TDF-3TC-LPV/r | Yes | 66 | |
| 14 | TDF-3TC-EFV | 2042 | 5.8 | 161 124 | 13.8 | TDF-3TC-ATV/r | Yes | 0 | |
| SOC | 15 | TDF-3TC-EFV | 284 597 | 6.0 | 445 503 | 8.8 | TDF-3TC-EFV | No | … |
| 16 | TDF-3TC-EFV | 2841 | 6.5 | 24 039 | 11.8 | TDF-3TC-EFV | No | … | |
| 17 | TDF-3TC-EFV | 670 742 | 6.7 | 121 164 | 11.8 | TDF-3TC-EFV | No | … | |
Median days from confirmed failure to switch to second-line antiretroviral treatment for POC patients 1–8 was 0 (interquartile range [IQR], 0–18), while median days to switch for SOC patients 10–14 was 66 (IQR, 63–123). By using the Wilcoxon Mann-Whitney test, there was a significant difference between POC and SOC arms (P = .0256).
Abbreviations: 3TC, lamivudine; ATV-r, AZT, zidovudine; DTG, dolutegravir; EFV, efavirenz; LPV/r, lopinavir/ritonavir; POC, point of care (testing by Cepheid GeneXpert human immunodeficiency virus type 1 (HIV-1) viral load assay); SOC, standard of care (testing by Roche COBAS AmpliPrep/TaqMan [CAP/CTM] HIV-1 Test, v2.0); TDF, tenofovir; VL, viral load.
TATs: Sample Collection to Placement in Patient Chart
In the POC arm, median 6-month and 12-month VL TATs in charts were 0 days (IQR, 0–0) for all patients. In the SOC arm, median JUTH 6-month TATs were 21 days (IQR, 13–32) for adults and 38 days (IQR, 25–57) for children; 12-month TATs were 25 days (IQR, 14–44) for adults and 50 days (IQR, 28–61) for children. Median CHCZ 6-month TATs were 49 days (IQR, 29–63) for adults and 117 days (IQR, 57–154) for children; 12-month TATs were 48.5 days (IQR, 29–73) for adults and 50 days (IQR, 28–61) for children (Table 4, Supplementary Figure 1 and 2).
Table 4.
Median Time to Placing Viral Load Results in Patient Charts After 6- and 12-Month Visits
| Patient-Visit Grouping | Clinic | Standard-of-Care ARM |
Point-Of-Care ARM |
P Value | ||
|---|---|---|---|---|---|---|
| N | Median, Days (IQR) | N | Median, Days (IQR) | |||
|
| ||||||
| Adult | JUTH | 105 | 21.0 (13.0–32.0) | 115 | 0 (0–0) | < .0001 |
| 6 months | CHCZ | 75 | 49.0 (29.0–63.0) | 70 | 0 (0–0) | < .0001 |
| Pediatric | JUTH | 13 | 38.0 (25.0–57.0) | 14 | 0 (0–1.0) | < .0001 |
| 6 months | CHCZ | 6 | 116.5 (57.0–154.0) | 6 | 0 (0–0) | .0028 |
| Adult | JUTH | 63 | 25.0 (14.0–44.0) | 88 | 0 (0–0) | < .0001 |
| 12 months | CHCZ | 38 | 48.5 (29.0–73.0) | 63 | 0 (0–0) | < .0001 |
| Pediatric | JUTH | 9 | 50.0 (28.0–61.0) | 11 | 0 (0–3.0) | .0002 |
| 12 months | CHCZ | 4 | 53.0 (17.5–214.5) | 3 | 0 (0–1.0) | .0323 |
Abbreviations: IQR, interquartile range; JUTH, Jos University Teaching Hospital; CHCZ, Comprehensive Health Centre Zamko.
TATs: Sample Collection to Patient Receipt of Results
At 6-month visits, 71% (148 of 209) of adult patients in the POC arm received results the same day and 79% (166 of 209) within 1 week, while 57% (122 of 213) of SOC patients received results between 1 and 6 months post-visit (Supplementary Figure 1). Patients received POC results within 0.1 median days (IQR, 0.1–0.2) compared with 143.1 median days (IQR, 56.0–177.1) for SOC results (P < .0001). TATs remained significantly different at 6 months and 12 months when comparing only unsuppressed patients (P < .0001 for both time points).
The percentage of patients provided same-day results in the POC arm was higher at CHCZ vs JUTH at both 6-month (86%, 65 of 76 vs 62%, 83 of 133) and 12-month visits (72%, 50 of 69 vs 54%, 60 of 112). Median time to delivery of VL results for 6-month and 12-month visits was significantly shorter in all subgroups in the POC arm vs SOC arm (Table 5). However, among JUTH pediatric patients, IQR for the POC arm was wider (0.1–28.0 days, 6-month visit; 0.1–53.0 days, 12-month visit) than the IQR for adult or pediatric patients in the POC arm at CHCZ (0.1–0.2 days for all).
Table 5.
Median Time to Informing Patients of Viral Load Results After 6- and 12-Month Visits
| PATIENT-VISIT GROUPING | CLINIC | Standard-of-Care Arm | Point-of-Care Arm | PVALUE | ||
|---|---|---|---|---|---|---|
| N | MEDIAN, DAYS (IQR) | N | MEDIAN, DAYS (IQR) | |||
|
| ||||||
| Adult | JUTH | 107 | 169.1 (156.0–196.0) | 103 | 0.1 (0.1–0.2) | < .0001 |
| 6 months | CHCZ | 61 | 56.0 (48.0–63.1) | 69 | 0.1 (0.1–0.2) | < .0001 |
| Pediatric | JUTH | 13 | 55.0 (30.0–86.0) | 10 | 0.5 (0.1–28.0) | .0009 |
| 6 months | CHCZ | 6 | 70.0 (28.0–84.9) | 4 | 0.1 (0.1–0.2) | .0103 |
| Adult | JUTH | 73 | 169.0 (140.0–189.0) | 83 | 0.1 (0.1–1.1) | < .0001 |
| 12 months | CHCZ | 48 | 84.0 (50.0–181.5) | 59 | 0.1 (0.1–0.2) | < .0001 |
| Pediatric | JUTH | 8 | 175.0 (46.0–195.5) | 7 | 0.8 (0.1–53.0) | .0055 |
| 12 months | CHCZ | 4 | 91.0 (49.0–133.0) | 3 | 0.3 (0.1–1.0) | .0339 |
P values generated using the Wilcoxon Mann-Whitney test.
Abbreviations: IQR, interquartile range; JUTH, Jos University Teaching Hospital; CHCZ, Comprehensive Health Centre Zamko.
Overall, patients in the POC arm experienced shorter TATs compared with patients in the SOC arm (P < .001 for both comparisons; Figure 2). At the 6-month visit, the POC arm was associated with significantly shorter TATs compared with the SOC arm (HR, 12.1; 95% confidence interval [CI], 9.18–15.9; P < .001). Similarly, patients in the POC arm received 12-month visit results relatively sooner (HR, 9.05; 95% CI, 6.77–12.1; P <.001;Figures 2 and 3). In adjusted models controlling for patient age, sex, clinic, and VL suppression status, POC use at 6-month and 12-month visits was associated with faster TATs (aHR, 14.2; 95% CI, 10.6–19.0; P < .001 and aHR, 10.3; 95% CI, 7.55–14.0; P < .001, respectively). CHCZ was associated with faster TATs compared with JUTH (aHR, 2.38; 95% CI, 1.88–3.01; P < .001 at 6 months; aHR, 1.59; 95% CI, 1.25–2.04; P < .001 at 12 months). Unsuppressed VL at time of testing (>1000 copies/mL) was also associated with faster TATs compared with suppressed VL at 6-month visits (aHR, 1.56; 95% CI, 1.14–2.12; P = .005) but not 12-month visits (aHR, 1.09; 95% CI, 0.70–1.71; P = .70). Within the SOC arm, median 6-month TATs in patients with suppressed viral loads was 155.0 days (IQR, 56.0–181.5) compared with 56.0 days (IQR, 29.0–155.0) among unsuppressed patients (P = .0019). Median 12-month TATs were not significantly different, 167.0 days (IQR, 84.0–189.0) vs 96.5 days (IQR, 56.0–247.5), respectively.
Figure 2.

Kaplan–Meier estimates of time to delivery in days of viral load results from 6-month clinical visits. Abbreviations: CI, confidence interval; cp, copies; HR, hazard ratio; JUTH, Jos University Teaching Hospital; Peds, pediatric patients; POC, point of care; SOC, standard of care.
Figure 3.
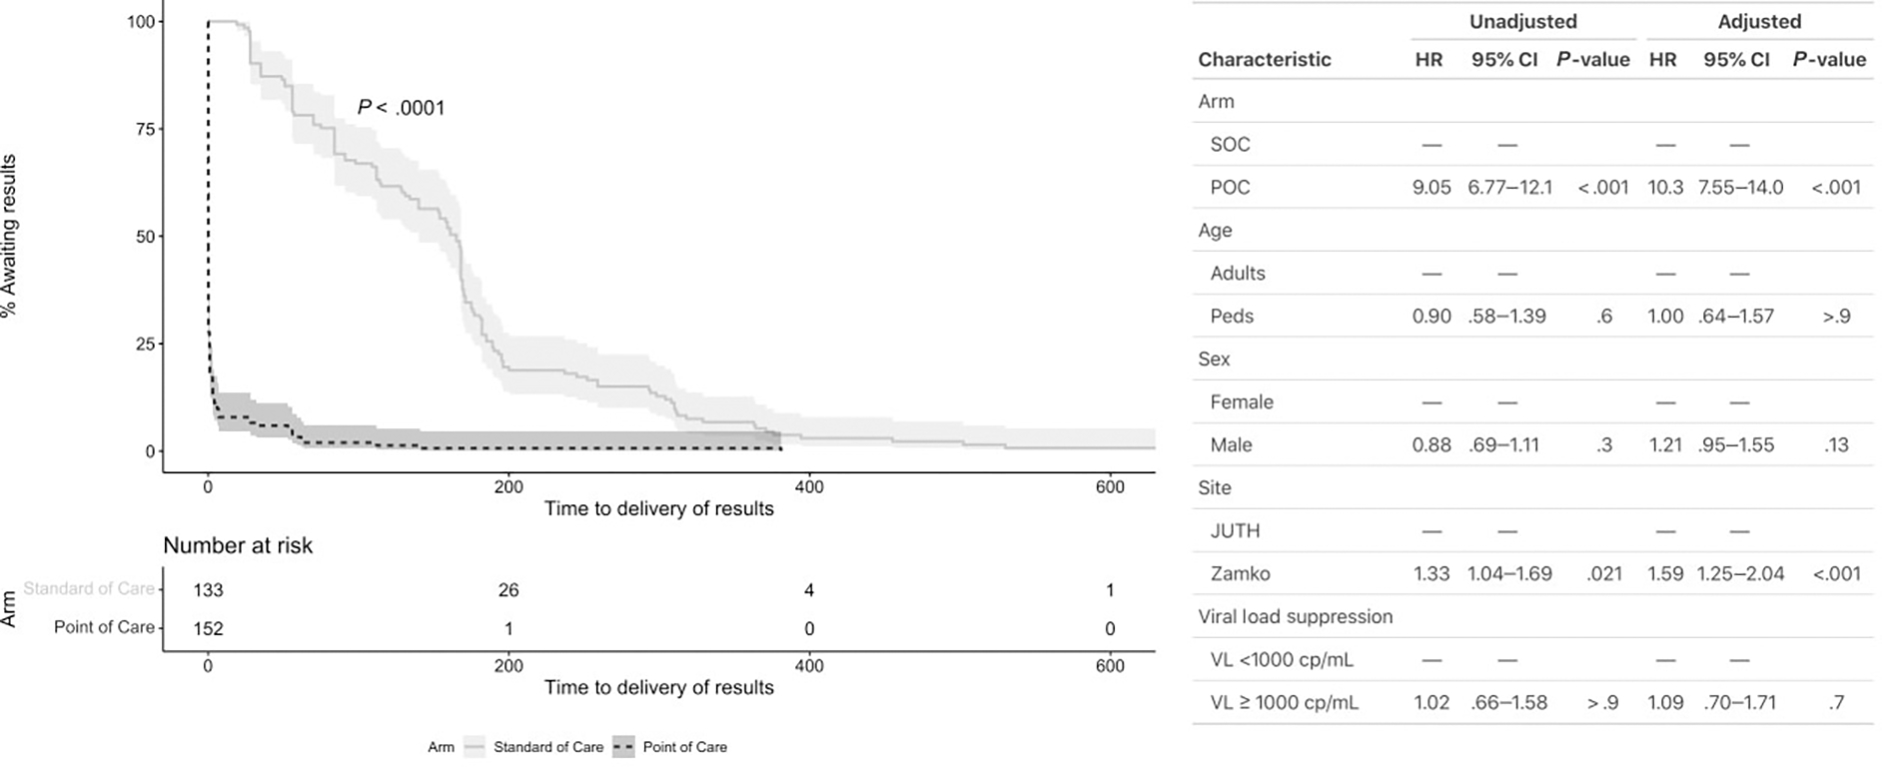
Kaplan–Meier estimates of time to delivery in days of viral load results from 12-month clinical visits. Abbreviations: CI, confidence interval; cp, copies; HR, hazard ratio; JUTH, Jos University Teaching Hospital; Peds, pediatric patients; POC, point of care; SOC, standard of care.
DISCUSSION
Our study demonstrates that POC VL is feasible for ART monitoring and improved timeliness of VL results to optimize clinical management. Compared with SOC, POC VL testing resulted in quicker TATs from specimen collection to results placed in charts (by 0.1 days) and to patients’ being given their results (by 143 days). Further, the time to switch to a second-line regimen among patients who had virologic failure was significantly faster.
Similar to our findings, 2 studies in Africa, including an analysis of POC VL testing outcomes in 7 sub-Saharan countries, documented faster median TATs for patients (by approximately 28–60 days) and clinical action for elevated VL (by 46–76 days) among patients with POC vs conventional testing [2, 18]. The early diagnosis of virologic failure and swift clinical action, including switching failing ART regimens, perhaps represents the most substantial clinical benefit of POC testing. In our study, 8 of 9 patients in the POC arm were switched to more effective ART regimens with a median of 0 days compared with 5 of 8 in the SOC arm with a median of 66 days. As drug resistance mutations may accumulate rapidly among patients maintained on failing regimens [19, 20], timely switch is critical to preserving antiretroviral drug susceptibility.
POC patients received results the same day the results were placed in charts. For SOC patients, median time for results to be placed in patient charts was longer at CHCZ vs JUTH, perhaps due to lag time in specimen transporting or differences in clinic procedures. However, once placed in the chart, the time to provide both 6-month and 12-month results to patients was shorter at CHCZ, highlighting provider and systems barriers in timely result delivery to patients, a barrier overcome in the POC arm.
Based in a rural setting with lower patient volume and reliant on networked VL testing at JUTH, CHCZ may be an optimal setting for POC monitoring. Compared with JUTH, larger proportions of CHCZ patients received 6-month and 12-month VL results the same day as testing (24 and 16 percentage points, respectively). Further, when surveyed, JUTH patients were less willing than CHCZ patients to wait for results [15]. Differences were particularly noticeable in pediatric patients, where 100% of CHCZ patients received POC results in ≤1 day at 6-month and 67% in ≤1 day at 12-month visits, while many pediatric JUTH patients received results later, as caregivers were unwilling to wait. In addition, CHCZ’s reliance on networked testing resulted in a higher proportion of missing SOC results.
This pragmatic implementation study highlighted long TATs for SOC VL results in a setting with centralized testing. JUTH serves 168 ART sites in the region, with frequent backlogs and occasional stock-out of centrally supplied reagents causing delays. Samples are collected, processed, frozen, and shipped in batches to the central testing facility from smaller laboratories. While results are electronically generated and uploaded directly to JUTH patient charts, surrounding sites receive paper results entered manually, potentially causing further delays. POC testing involves manual data entry, but results are generated locally in smaller numbers.
In July 2021, the WHO prioritized and encouraged POC VL testing for certain populations [21]. Our results of reduced time to receipt of results for pediatric patients and to second-line ART switch among patients with elevated VL support the WHO recommendations. Longer median times to result entry in charts for pediatric vs adult SOC patients highlights programmatic issues but also demonstrates an opportunity for POC monitoring to benefit this higher-risk population. In addition, successful trial implementation in a high-volume tertiary teaching hospital clinic demonstrated that POC VL testing can be operationalized alongside centralized, batched SOC VL tests.
Our clinical trial results provide new insights into POC testing implementation for ART management in real-life settings. Limitations to our study included low patient enrollment due to decreasing HIV prevalence and decentralization of HIV care. Patient follow-up was impacted by coronavirus disease 2019 lockdowns and changes in clinic hours, resulting in more missed visits, especially at the urban clinic. Based on revised Nigerian ART guidelines, patients were programmatically started on or changed to a DTG-based regimen, and high overall viral suppression limited discernment of differences between VL testing arms. Nevertheless, the aOR for retention with suppressed VL was 1.95 (1.19–3.19, P = .008) in the POC arm compared with the SOC arm, controlling for clinic, age, occupation, VL at enrollment, and ART adherence [15].
Strengths of our clinical trial included evaluation of adult and pediatric patients, randomization for unbiased comparisons, and evaluation in clinics representing different levels of healthcare infrastructure. JUTH performed SOC testing in their laboratory, enabling evaluation of POC testing alongside SOC laboratory batch testing. CHCZ typically sent samples for VL testing to JUTH weekly, a situation common among many ART providers in LMIC settings. Therefore, CHCZ represented a clinic setting most appropriate for POC testing, where timeliness of VL results at CHCZ reflected the potential for improved ART management. In contrast to other studies, ours assessed POC VL testing as a single intervention and was conducted by staff at both clinics rather than research investigators. Also, incentives were not provided to study participants. This suggests that future use of POC VL monitoring may proceed seamlessly from this clinical trial to routine ART care in Nigeria.
CONCLUSIONS
We demonstrated POC VL testing can be operationalized alongside centralized, batched VL tests at a high-volume tertiary teaching hospital and dramatically improve TATs for clinics currently reliant on networked SOC VL conducted by a distant central laboratory. Importantly, POC VL testing also significantly reduced the time to second-line ART switch as a critical metric of optimal ART management. Further implementation studies will inform the utilization of POC testing to improve ART management in many LMIC settings that are critical to achieving the UNAIDS goals to end the AIDS epidemic.
Supplementary Material
Acknowledgments.
The authors are grateful to all the patients who participated in this trial to advance knowledge and to the clinical, laboratory, and data staff in the Jos University Teaching Hospital APIN Public Health Initiatives (APIN) President’s Emergency Plan for AIDS Relief Program whose efforts enabled this work.
Financial support.
This work was supported by the US Centers for Disease Control and Prevention (CDC) [grant GH-16–005]. The APIN clinical program is supported by the CDC through cooperative agreement NU2GGH002098.
Footnotes
Supplementary Data
Supplementary materials are available at Clinical Infectious Diseases online. Consisting of data provided by the authors to benefit the reader, the posted materials are not copyedited and are the sole responsibility of the authors, so questions or comments should be addressed to the corresponding author.
Disclaimer. The funders participated in study design, oversight, monitoring of study activities and data analyses, and manuscript preparation. The findings and conclusions presented here are those of the authors and do not necessarily represent the official position of the respective funding agencies.
Potential conflicts of interest. All remaining authors: No reported conflicts of interest. All authors have submitted the ICMJE Form for Disclosure of Potential Conflicts of Interest. Conflicts that the editors consider relevant to the content of the manuscript have been disclosed.
References
- 1.UNITAID. Improving access to viral-load testing for people living with HIV. Available at: https://unitaid.org/project/improving-access-viral-load-testing-people-living-hiv-opp-era-phase-2/-en. Accessed 1 October 2022. [Google Scholar]
- 2.Boeke CE, Joseph J, Atem C, et al. Evaluation of near point-of-care viral load implementation in public health facilities across seven countries in sub-Saharan Africa. J Int AIDS Soc 2021; 24:e25663. [DOI] [PMC free article] [PubMed] [Google Scholar]
- 3.Pai NP, Vadnais C, Denkinger C, Engel N, Pai M. Point-of-care testing for infectious diseases: diversity, complexity, and barriers in low- and middle-income countries. PLoS Med 2012; 9:e1001306. [DOI] [PMC free article] [PubMed] [Google Scholar]
- 4.Bwana P, Ageng’o J, Mwau M. Performance and usability of Cepheid GeneXpert HIV-1 qualitative and quantitative assay in Kenya. PLoS One 2019; 14:e0213865. [DOI] [PMC free article] [PubMed] [Google Scholar]
- 5.Ceffa S, Luhanga R, Andreotti M, et al. Comparison of the Cepheid GeneXpert and Abbott M2000 HIV-1 real time molecular assays for monitoring HIV-1 viral load and detecting HIV-1 infection. J Virol Methods 2016; 229(Mar):35–39. [DOI] [PubMed] [Google Scholar]
- 6.Garrett NJ, Drain PK, Werner L, Samsunder N, Abdool Karim SS. Diagnostic accuracy of the point-of-care Xpert HIV-1 viral load assay in a South African HIV clinic. J Acquir Immune Defic Syndr 2016; 72:e45–8. [DOI] [PMC free article] [PubMed] [Google Scholar]
- 7.Gous N, Scott L, Berrie L, Stevens W. Options to expand HIV viral load testing in South Africa: evaluation of the GeneXpert® HIV-1 viral load assay. PLoS One 2016; 11:e0168244. [DOI] [PMC free article] [PubMed] [Google Scholar]
- 8.Gueudin M, Baron A, Alessandri-Gradt E, et al. Performance evaluation of the new HIV-1 quantification assay, Xpert HIV-1 viral load, on a wide panel of HIV-1 variants. J Acquir Immune Defic Syndr 2016; 72:521–6. [DOI] [PubMed] [Google Scholar]
- 9.Kone B, Goita D, Dolo O, et al. Performance comparison of Xpert HIV-1 viral load assay and Roche Taqman and Abbott M2000 RT in Bamako, Mali. J AIDS Clin Res 2020; 11:46953. [PMC free article] [PubMed] [Google Scholar]
- 10.Moyo S, Mohammed T, Wirth KE, et al. Point-of-care cepheid Xpert HIV-1 viral-load test in rural African communities is feasible and reliable. J Clin Microbiol 2016; 54:3050–5. [DOI] [PMC free article] [PubMed] [Google Scholar]
- 11.Swathirajan CR, Vignesh R, Boobalan J, Solomon SS, Saravanan S, BalakrishnanP. Performance of point-of-care Xpert HIV-1 plasma viral load assay at a tertiary HIV care centre in southern India. J Med Microbiol 2017; 66:1379–82. [DOI] [PubMed] [Google Scholar]
- 12.Avidor B, Matus N, Girshengorn S, et al. Comparison between Roche and Xpert inHIV-1 RNA quantitation: a high concordance between the two techniques except for a CRF02_AG subtype variant with high viral load titers detected by Roche but undetected by Xpert. J Clin Virol 2017; 93:15–9. [DOI] [PubMed] [Google Scholar]
- 13.UNAIDS. Nigeria: situation report, November 2021. Available at: https://www.unaids.org/en/regionscountries/countries/nigeria. Accessed December 2021. [Google Scholar]
- 14.Meloni ST, Agbaji O, Chang CA, et al. The role of point-of-care viral load monitoring in achieving the target of 90% suppression in HIV-infected patients in Nigeria: study protocol for a randomized controlled trial. BMC Infect Dis 2019; 19:368. [DOI] [PMC free article] [PubMed] [Google Scholar]
- 15.Chang C, Agbaji O, Mitruka K, et al. Clinical outcomes in a randomized controlled trial comparing point-of-care versus standard HIV viral load monitoring in Nigeria. Clin Infect Dis 2022. [Preprint]. ciac605. [DOI] [PMC free article] [PubMed] [Google Scholar]
- 16.Chaplin B, Meloni S, Eisen G, et al. Scale-up of networked HIV treatment in Nigeria: creation of an integrated electronic medical records system. Int J Med Inf 2015; 84:58–68. [DOI] [PubMed] [Google Scholar]
- 17.National AIDs and STIs Control Programme Federal Ministry of Health Nigeria. Abuja, Nigeria: National Guidelines for HIV Prevention, Treatment and Care, 2020. [Google Scholar]
- 18.Drain PK, Dorward J, Violette LR, et al. Point-of-care HIV viral load testing combined with task shifting to improve treatment outcomes (STREAM): findings from an open-label, non-inferiority, randomised controlled trial. Lancet HIV 2020; 7:e229–37. [DOI] [PMC free article] [PubMed] [Google Scholar]
- 19.Rawizza HE, Chaplin B, Meloni ST, et al. Accumulation of protease mutations among patients failing second-line antiretroviral therapy and response to salvage therapy in Nigeria. PLoS One 2013; 8:e73582. [DOI] [PMC free article] [PubMed] [Google Scholar]
- 20.Cozzi-Lepri A, Paredes N, Phillips AN, et al. The rate of accumulation of nonnucleoside reverse transcriptase inhibitor (NNRTI) resistance in patients kept on a virologically failing regimen containing an NNRTI. HIV Med 2012; 13:62–72. [DOI] [PubMed] [Google Scholar]
- 21.World Health Organization. Consolidated guidelines on HIV prevention, testing, treatment, service delivery and monitoring: recommendations for a public health approach. Geneva, Switzerland: WHO, 2021. [PubMed] [Google Scholar]
Associated Data
This section collects any data citations, data availability statements, or supplementary materials included in this article.