Abstract
Salinity stress significantly impacts crops, disrupting their water balance and nutrient uptake, reducing growth, yield, and overall plant health. High salinity in soil can adversely affect plants by disrupting their water balance. Excessive salt levels can lead to dehydration, hinder nutrient absorption, and damage plant cells, ultimately impairing growth and reducing crop yields. Gallic acid (GA) and zinc ferrite (ZnFNP) can effectively overcome this problem. GA can promote root growth, boost photosynthesis, and help plants absorb nutrients efficiently. However, their combined application as an amendment against drought still needs scientific justification. Zinc ferrite nanoparticles possess many beneficial properties for soil remediation and medical applications. That’s why the current study used a combination of GA and ZnFNP as amendments to wheat. There were 4 treatments, i.e., 0, 10 µM GA, 15 μM GA, and 20 µM GA, without and with 5 μM ZnFNP applied in 4 replications following a completely randomized design. Results exhibited that 20 µM GA + 5 μM ZnFNP caused significant improvement in wheat shoot length (28.62%), shoot fresh weight (16.52%), shoot dry weight (11.38%), root length (3.64%), root fresh weight (14.72%), and root dry weight (9.71%) in contrast to the control. Significant enrichment in wheat chlorophyll a (19.76%), chlorophyll b (25.16%), total chlorophyll (21.35%), photosynthetic rate (12.72%), transpiration rate (10.09%), and stomatal conductance (15.25%) over the control validate the potential of 20 µM GA + 5 μM ZnFNP. Furthermore, improvement in N, P, and K concentration in grain and shoot verified the effective functioning of 20 µM GA + 5 μM ZnFNP compared to control. In conclusion, 20 µM GA + 5 μM ZnFNP can potentially improve the growth, chlorophyll contents and gas exchange attributes of wheat cultivated in salinity stress. More investigations are suggested to declare 20 µM GA + 5 μM ZnFNP as the best amendment for alleviating salinity stress in different cereal crops.
Keywords: Gallic acid, Chlorophyll content, Zinc ferrite nanoparticles, Antioxidant, Growth attributes
Subject terms: Plant sciences, Plant stress responses, Abiotic, Salt
Introduction
A major global issue to agriculture is soil salinity, which is the second most important factor contributing to land degradation after soil erosion1–5. Approximately 1 billion hectares of salinity, or 7% of the Earth's surface, results in the daily loss of 2000 hectares of arable land, greatly lowering agricultural production. Its impact includes a 10–25% crop yield reduction and, in severe cases, desertification6. Salinity affects plant growth by inducing osmotic stress, ionic toxicity, and nutrient deficiencies, impacting various cellular processes and photosynthesis1,7–9. This stress generates reactive oxygen species (ROS), causing significant damage to plant membranes10–12. Although plants have developed internal defense mechanisms, such as antioxidant enzymes, some species, like wheat, remain vulnerable to salinity stress due to limitations in their defense systems13,14.
Gallic acid (GA), a powerful phenolic compound, benefits plants by acting as an antioxidant, protecting against oxidative stress. It promotes root growth, boosts photosynthesis, and helps plants absorb nutrients efficiently15. Its allelopathic properties aid in weed control, improving plant growth and health16. On other hand. zinc ferrite nanoparticles (ZnFNP) possess a wide range of properties beneficial for soil remediation and medical applications17. These nanoparticles and other ferrite variations have demonstrated potential benefits for plants by enhancing nutrient uptake efficiency18.
Wheat (Triticum aestivum L.) is the earliest domesticated cereal crop globally, cultivated by approximately 80 million farmers and contributing to the sustenance of 2.5 billion individuals worldwide19. Salinity stress poses a significant challenge to wheat cultivation, detrimentally impacting various physiological and biochemical processes20. As sodium and chloride ions accumulate in the soil, they disrupt the plant's osmotic balance, reducing water uptake and causing dehydration21. This environmental stress triggers a force of responses within the wheat plant, including altered ion uptake, inhibition of essential metabolic pathways, and oxidative stress due to the accumulation of reactive oxygen species (ROS)22.
The current study aims to investigate the potential of GA and ZnFNP to alleviate the negative effect of salinity stress on the growth of wheat plants. To mitigate salt stress on wheat, the current study covers the knowledge gap about the optimal application rate of GA in combination with ZnFNP. We hypothesized that using ZnFNP and GA would improve wheat growth and production while mitigating the negative effects of salt stress. The study's primary objective was to determine the optimal rate of GA and ZnFNP treatment for improved wheat growth in soils affected by salt.
Material and methods
Experimental site
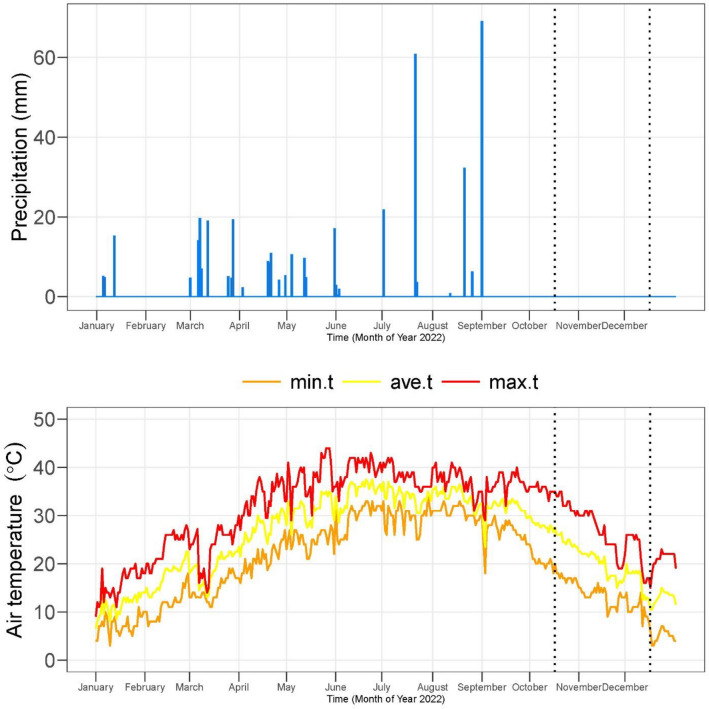
In 2022, an experiment was conducted at the Research Solution experimental area (30° 09′ 41.6″ N 71° 36′ 38.0″ E). Random soil sampling was done to obtain a composite sample. These samples underwent air-drying and were sieved through a 2-mm mesh to evaluate their physicochemical properties. The physiochemical characteristics of soil and irrigation water are provided in Table 1. The climatic data of the experiment is provided in Fig. 1.
Table 1.
Pre-experimental soil and irrigation characteristics.
| Soil | Values | References | Irrigation | Values | References |
|---|---|---|---|---|---|
| pH | 8.17 | 23 | pH | 7.20 | 24 |
| ECe (dS/m) | 6.40 | 25 | EC (µS/cm) | 381 | |
| SOM (%) | 0.55 | 26 | Carbonates (meq./L) | 0.02 | |
| Extractable potassium (µg/g) | 130 | 27 | Sodium (mg/L) | 109 | |
| Extractable sodium (µg/g) | 117 | 28 | Bicarbonates (meq./L) | 4.71 | |
| Texture | Clay Loam | 29 | Ca + Mg (meq./L) | 2.72 | |
| Total nitrogen (%) | 0.03 | 30 | Chloride (meq./L) | 0.01 | |
| Available phosphorus (µg/g) | 6.21 | 31 | |||
Figure 1.
Climatic data of experiment.
Synthesis of ZnFNP
Initially, a solution containing 0.2 M Zn(NO3)2.6H2O and Fe(NO3)3 was prepared by dissolving them separately in deionized water under continuous stirring. Extract derived from Fenugreek (Trigonella foenum-graecum L.) seeds, locally referred to as Methi Dana, was obtained by washing, grinding into a paste, and subsequent filtration. The biosynthesis entailed combining the metal solution and plant extract in equal proportions (1:1 ratio) with stirring while adjusting the pH to 10 using NaOH. A noticeable color change to a dark brown or black hue indicated the emergence of ZnFe2O4 nanoparticles (NPs). Following the stirring process, the NPs were separated by centrifugation at 5000 rpm for 10–15 min. Further purification was achieved by rinsing the nanoparticles with deionized water to eliminate contaminants. The resulting ZnFe2O4 nanoparticles pellets were dried at 80 °C for 4–5 h in an oven.
Treatments
The treatments included a control group without any treatment; levels of gallic acid (GA) include (10 µM, 15 µM, and 20 µM). All the treatments were applied under no nanoparticles (No NP) and 5 μM zinc ferrite nanoparticles (ZnFNP)17. A total of 2 foliar applications were made after two weeks of germination following the gap of 15 days in each foliar. The study followed a completely randomized design (CRD) with four replications for every treatment.
Collecting, sterilization, and sowing of seeds
The Millat-2011 variety of wheat seeds was obtained from a licensed seed dealer in the local area. After manual screening, 10 seeds were planted in each pot with 5 kg of soil. To ensure that each pot included two healthy seedlings, thinning was carried out after germination.
Fertilizer
To address the nutritional requirements of wheat, nitrogen (N) was administered at a rate of 52 kg per acre (approximately 0.31 g/10 kg soil), derived from urea, while phosphorus (P) was applied at 46 kg per acre (about 0.15 g/10 kg soil) sourced from single superphosphate, aligning with suggested application guidelines. To improve potassium (K) levels, potassium sulfate was supplemented at 25 kg per acre (around 0.15 g/10 kg soil).
Irrigation
The regulation of irrigation for each pot was carefully managed by utilizing a moisture gauge (ADVANCED™; 4 in 1 Soil Meter; China). Daily supervision was conducted to guarantee the maintenance of moisture levels within the defined threshold, aligned with the device's scale, where the designation 'wet' represented roughly 69% of the soil's field capacity.
Harvesting and data collection
Wheat harvesting commenced 55 days after sowing. The data collection encompassed multiple parameters such as shoot and root length, along with both fresh and dry weights of shoots and roots, conducted immediately post-harvest. The drying process for the dry weight analysis involved 48 h of oven drying at 65 °C. Chlorophyll content, electrolyte leakage, and antioxidant levels were assessed in freshly collected leaves obtained 27 days after germination. On the other hand, the concentration of N, P, and K was determined in leaves collected 55 days post-germination.
Estimation of chlorophyll
In this study, freshly harvested wheat leaf samples weighing 0.5 mg were prepared by grinding in a mortar and pestle using 20 ml of 80% acetone. The resulting mixture was centrifuged at 3000 rpm for 15 min to obtain a supernatant. Subsequently, the residue underwent further extraction with 5 ml of 80% acetone until complete color extraction was achieved. For spectrophotometric analysis, the absorbance of specific wavelengths was measured: 663, 645, and 470 nm32. The determination of chlorophyll and carotenoid content was carried out using established formulae:
Gas exchange attributes
Leaf gas exchange parameters were evaluated using the CI-340 Photosynthesis system, an infrared gas Analyzer manufactured by CID, Inc. USA. These assessments were conducted during the peak sunlight hours from 10:30 to 11:30 a.m., ensuring an optimal and saturating light intensity for efficient photosynthesis33.
Antioxidants
We evaluated superoxide dismutase (SOD) activity by using nitro blue tetrazolium and taking absorbance at 560 nm34. Catalase (CAT) activity was measured by observing the decomposition of hydrogen peroxide (H2O2) at 240 nm35. Ascorbate peroxidase (APX) activity was determined via ascorbate oxidation in the presence of H2O2 at 290 nm wavelength36.
Determination of nonenzymatic antioxidants
M-phosphoric acid, Na EDTA, and sulfosalicylic acid (w/v) were used to analyze the GST content. After centrifuging the mixture at 12,000 × g for 10 min, the supernatant was mixed with 100 mM phosphate buffer (pH 7.0) and 5.5-dithiobis (2-nitrobenzoic acid). At 412 nm, the last absorption was measured37.
Electrolyte leakage
Fresh leaf discs of 1 cm diameter were taken in 20 ml of deionized water and left to incubate at a constant temperature of 25 °C for 24 h in test tubes. After incubation, 1st electrical conductivity was measured. After that, test tubes underwent a 20-min heat treatment in a water bath at 120 °C, and the 2nd electrical conductivity measurement was recorded38.
Free proline determination
The procedure used to extract and analyze free proline from leaf tissues was adapted from the methodology39. The final absorbance was taken at 520 nm using a UV–VIS spectrophotometer, with l-proline as the calibration standard.
Shoot and grain N, P, K
The nitrogen concentration was evaluated using a modified micro-Kjeldahl method24. Potassium concentrations were measured utilizing a flame photometer27,40. Phosphorus levels were determined at 420 nm using the yellow colorimetric technique with a spectrophotometer24.
Statistical analysis
Standard statistical analysis was applied to collected data41. The study utilized OriginPro software for two-way ANOVA, paired comparisons, graph generation, and principal component analysis42.
Ethics approval and consent to participate
We all declare that manuscript reporting studies do not involve any human participants, human data, or human tissue. So, it is not applicable.
Experimental research and field studies on plants (either cultivated or wild), including the collection of plant material, must comply with relevant institutional, national, and international guidelines and legislation
We confirmed that all methods were performed in accordance with the relevant guidelines/regulations/legislation.
Results
Shoot attributes
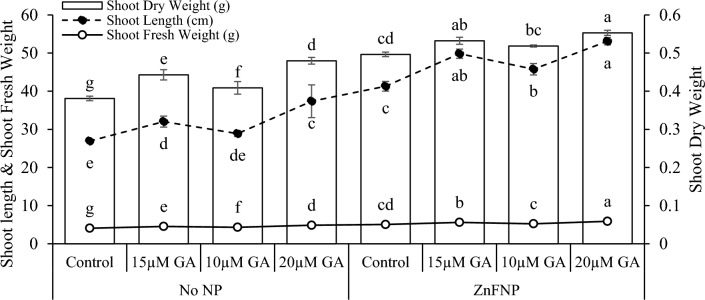
In no NP, applying 15 µM GA resulted in an 18.92% increase, while 10 µM GA showed a 7.27% increase, and 20 µM GA exhibited 38.77% rise in shoot length over control. With ZnFNP, 15 µM GA treatment showed a 20.68% increase in shoot length than the ZnFNP control. Treatment 10 µM GA demonstrated a 10.85% enhance, while 20 µM GA showed the highest increase of 28.62% in shoot length from ZnFNP control (Fig. 2).
Figure 2.
Effect of different gallic acid (GA) levels with and without ZnFNP on shoot length, shoot fresh and dry weight of wheat grown with no NP and ZnFNP. The bars showed the mean of 4 replicates with ± SD. Significant changes, denoted by distinct letters on the bars, were identified through the Tukey test at a significance level of p < 0.05.
At no NP, treatment 15 µM GA resulted in an 11.60% increase, while 10 µM GA showed a 6.08% increase, and 20 µM GA exhibited the most significant rise at 19.34% in shoot fresh weight then the control. Under ZnFNP applying 15 µM GA led to a 10.98%, 10 µM GA showed a 3.66%, and 20 µM GA showed a 16.52% increase in shoot fresh weight in comparison to control (Fig. 2).
Results showed that 15 µM GA treatment showed a 16.27%, while the 10 µM GA displayed a 7.28% rise in shoot dry weight above the control. Over the control, adding 20 µM GA treatment resulted in an increase of 25.92% in shoot dry weight. Treatment 15 µM GA + ZnFNP showed a 7.20%, 10 µM GA displayed a 4.43%, and 20 µM GA caused in an 11.38% improve shoot dry weight related to the control (Fig. 2).
Root attributes
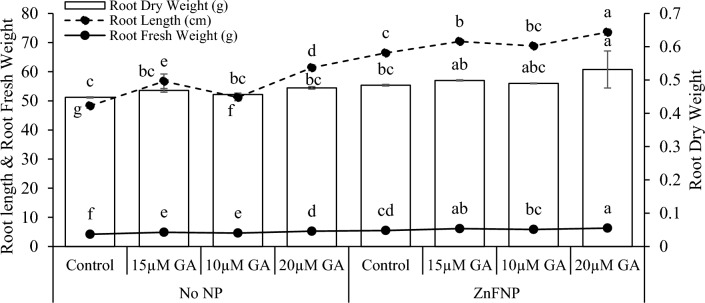
Adding 15 µM GA, 10µ GA, and 20 µM GA with no NP resulted in an increase in root length (17.46%, 27.15%, and 6.04%), root fresh weight (16.04%, 9.84%, and 25.04%), and root dry weight (4.66%, 1.91%, and 6.38%) from the control. When 15 µM GA, 10µ GA, and 20 µM GA treatments applied with ZnFNP resulted a significant increase in root length (5.97%, 10.76%, and 3.64%), root fresh weight (11.48%, 6.42%, and 14.72%), and root dry weight (2.94%, 1.10%, and 9.71%) over the control (Fig. 3).
Figure 3.
Effect of different gallic acid (GA) levels with and without ZnFNP on root length, root fresh and dry weight of wheat grown with no NP and ZnFNP. The bars showed the mean of 4 replicates with ± SD. Significant changes, denoted by distinct letters on the bars, were identified through the Tukey test at a significance level of p < 0.05.
Chlorophyll and carotenoid content
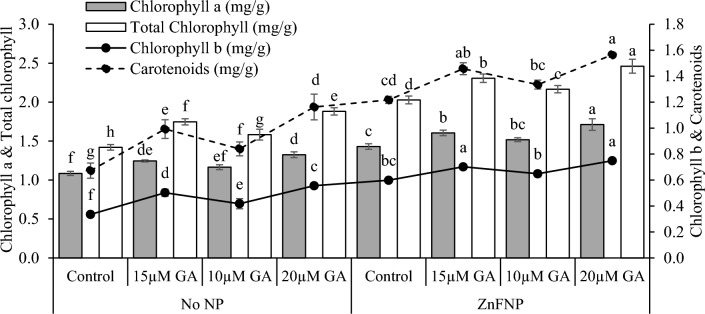
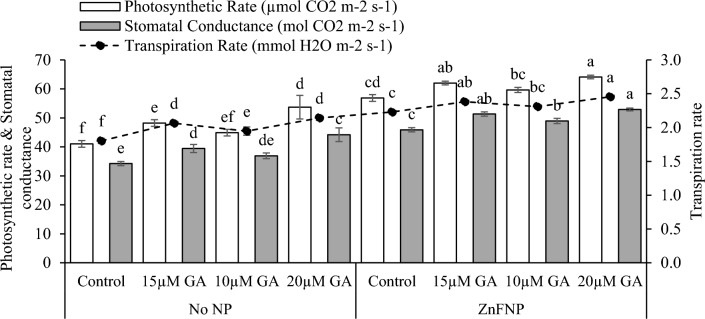
In the no NP, the application of 15 µM GA, 10µ GA, and 20 µM GA resulted in an increase in photosynthetic rate (17.56%, 9.44%, and 30.87%), transpiration rate (14.56%, 8.04% and 18.86%), and stomatal conductance (15.19%, 7.81%, and 29.07%) than the control. Applying 15 µM GA, 10µ GA, and 20 µM GA treatments with ZnFNP resulted in a significant increase in photosynthetic rate (9.07%, 4.89%, and 12.72%), transpiration rate (6.84%, 3.59%, and 10.09%), and stomatal conductance (11.84%, 6.62%, and 15.25%) in comparison to the control (Fig. 4).
Figure 4.
Effect of different gallic acid (GA) levels with and without ZnFNP on chlorophyll, chlorophyll b, total chlorophyll, and carotenoids of wheat grown with no NP and ZnFNP. The bars showed the mean of 4 replicates with ± SD. Significant changes, denoted by distinct letters on the bars, were identified through the Tukey test at a significance level of p < 0.05.
Gass exchange attributes
In the no NP, the application of 15 µM GA, 10µ GA, and 20 µM GA showed in rise in photosynthetic rate (17.56%, 9.44%, and 30.87%), transpiration rate (14.56%, 8.04% and 18.86%), and stomatal conductance (15.19%, 7.81%, and 29.07%) than the control. Applying 15 µM GA, 10µ GA, and 20 µM GA treatments with ZnFNP resulted in a significant increase in photosynthetic rate (9.07%, 4.89%, and 12.72%), transpiration rate (6.84%, 3.59%, and 10.09%), and stomatal conductance (11.84%, 6.62%, and 15.25%) in comparison to the control (Fig. 5).
Figure 5.
Effect of different gallic acid (GA) levels with and without ZnFNP on photosynthetic rate, transpiration rate, and stomatal conductance of wheat grown with no NP and ZnFNP. The bars showed the mean of 4 replicates with ± SD. Significant changes, denoted by distinct letters on the bars, were identified through the Tukey test at a significance level of p < 0.05.
Electrolyte leakage, proline, SOD, and CAT activity
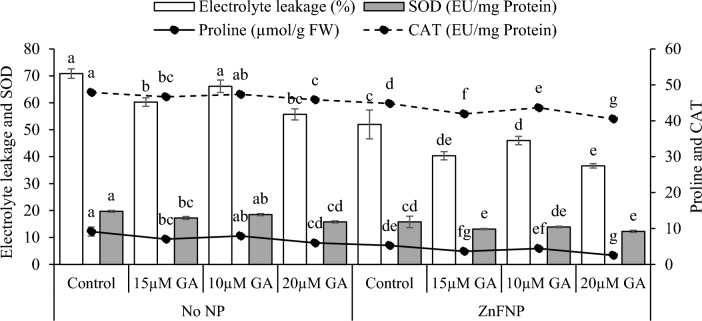
Adding 15 µM GA, 10µ GA, and 20 µM GA showed a significant decrease in electrolyte leakage (17.55%, 7.11%, and 27.13%), proline (29.95%, 15.36%, and 52.86%), SOD (14.31%, 6.61%, and 24.94%), and CAT (2.63%, 1.14%, and 4.45%) than the control under no NP. Adding 15 µM GA, 10 µ GA, and 20 µM GA treatments resulted a significant decrease in electrolyte leakage (28.85%, 13.01%, and 42.07%), proline (45.06%, 19.29%, and 108.79%), SOD (20.11%, 13.44%, and 28.63%), and CAT (6.91%, 2.66%, and 10.58%) over the control under ZnFNP (Fig. 6).
Figure 6.
Effect of different gallic acid (GA) levels with and without ZnFNP on electrolyte leakage, proline, SOD, and CAT of wheat grown with no NP and ZnFNP. The bars showed the mean of 4 replicates with ± SD. Significant changes, denoted by distinct letters on the bars, were identified through the Tukey test at a significance level of p < 0.05.
APX, GPX, GR, and GST activity
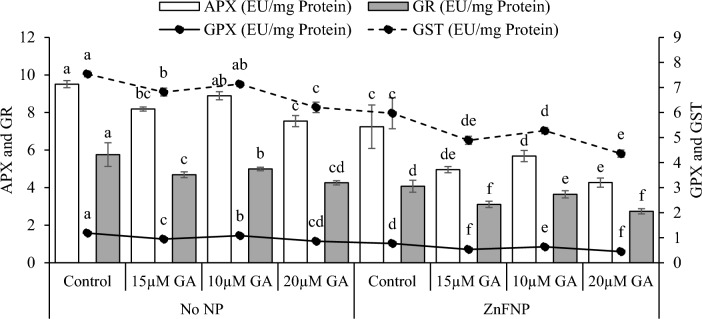
In comparison to the control, applying 15 µM GA, 10µ GA, and 20 µM GA showed a significant decrease in APX (16.15%, 6.94%, and 26.09%), GPX (25.40%, 9.47%, and 38.19%), GR (22.88%, 15.32%, and 35.29%), and GST (10.56%, 5.64%, and 21.47%) under no NP. Applying 15 µM GA, 10µ GA, and 20 µM GA treatments exhibited a significant decrease in APX (46.09%, 27.45%, and 69.71%), GPX (44.60%, 21.26%, and 73.03%), GR (31.13%, 11.80%, and 48.72%), and GST (22.09%, 13.18%, and 37.01%) from the control under ZnFNP (Fig. 7).
Figure 7.
Effect of different gallic acid (GA) levels with and without ZnFNP on APX, GPX, GR, and GST of wheat grown with No NP and ZnFNP. The bars showed the mean of 4 replicates with ± SD. Significant changes, denoted by distinct letters on the bars, were identified through the Tukey test at a significance level of p < 0.05.
Shoot N, P, and K
Adding 15 µM GA, 10µ GA, and 20 µM GA with no NP increased shoot N (54.93%, 25.35%, and 83.10%), shoot P (55.58%, 22.51%, and 76.49%), and shoot K (85.23%, 34.23%, and 99.40%) than the control. When 15 µM GA, 10µ GA, and 20 µM GA treatments were applied with ZnFNP exhibit a significant rise in shoot N (25.41%, 12.54%, and 45.21%), shoot P (21.45%, 12.41%, and 28.70%), and shoot K (25.56%, 12.92%, and 40.45%) over the control (Table 2).
Table 2.
Effect of different gallic acid (GA) levels with and without ZnFNP on wheat shoot N, P and K concentration.
| Treatment | Shoot N (%) | Shoot P (%) | Shoot K (%) |
|---|---|---|---|
| No NP | |||
| Control | 0.36g | 0.13f | 0.37g |
| 15 µM GA | 0.55ef | 0.20d | 0.69e |
| 10 µM GA | 0.45fg | 0.15e | 0.50f |
| 20 µM GA | 0.65de | 0.22d | 0.78de |
| ZnFNP | |||
| Control | 0.76cd | 0.25c | 0.89cd |
| 15 µM GA | 0.95b | 0.31ab | 1.12b |
| 10 µM GA | 0.85bc | 0.28b | 1.01bc |
| 20 µM GA | 1.10a | 0.32a | 1.25a |
Values are the mean of 4 replicates. Different letters showed significant changes at p ≤ 0.05; Tukey Test. No NP (No Nanoparticle); ZnFNP (Zinc ferrite Nanoparticle).
Grain N, P, and K
Over control, adding 15 µM GA, 10µ GA, and 20 µM GA with no NP, exhibits an increase in grain N (1.77%, 3.53%, and 1.69%), grain P (13.91%, 6.20%, and 23.40%), and grain K (10.87%, 5.63%, and 15.95%) in comparison to the control. When 15 µM GA, 10µ GA, and 20 µM GA treatments were applied with ZnFNP, showed a significant increase in grain N (5.08%, 3.44%, and 1.85%), grain P (9.77%, 6.70%, and 19.68%), and grain K (10.87%, 6.11%, 17.23%) over the control (Table 3).
Table 3.
Effect of different gallic acid (GA) levels with and without ZnFNP on wheat grains N, P and K concertation.
| Treatment | Grain N (%) | Grain P (%) | Grain K (%) |
|---|---|---|---|
| No NP | |||
| Control | 1.77e | 0.27f | 0.46f |
| 15 µM GA | 1.84de | 0.30de | 0.51de |
| 10 µM GA | 1.80de | 0.28ef | 0.48ef |
| 20 µM GA | 1.86cd | 0.33cd | 0.53d |
| ZnFNP | |||
| Control | 1.89bcd | 0.36bc | 0.54cd |
| 15 µM GA | 1.96ab | 0.39b | 0.60b |
| 10 µM GA | 1.93bc | 0.38b | 0.58bc |
| 20 µM GA | 2.03a | 0.43a | 0.64a |
Values are the mean of 4 replicates. Different letters showed significant changes at p ≤ 0.05; Tukey Test. No NP (No Nanoparticle); ZnFNP (Zinc ferrite Nanoparticle).
Convex hull and Hierarchical cluster analysis
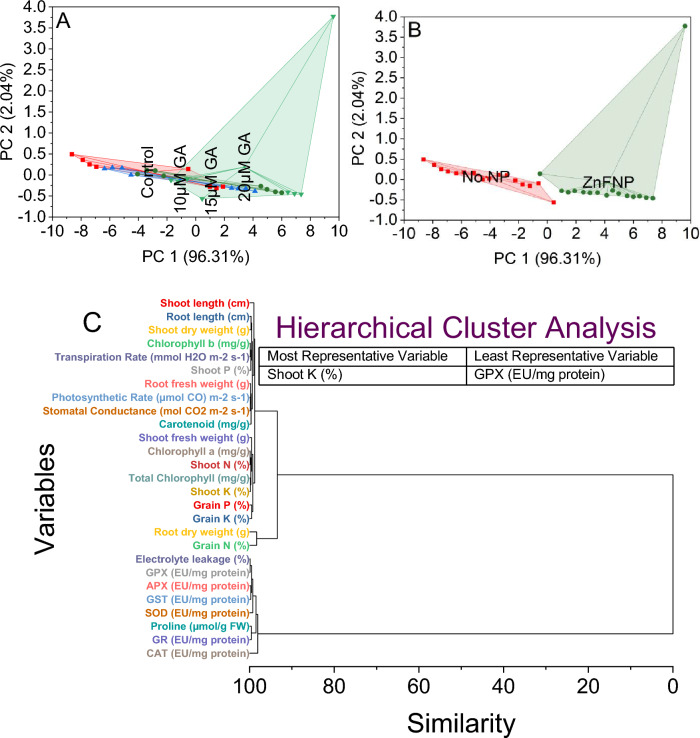
The analysis was based on PC1 and PC2 scores corresponding to different treatments. In the control group, PC1 scored between − 8.63927 and 1.90773, while PC2 ranged from − 0.56659 to 0.49291. Treatment with 15 µM GA showed a shift in the convex hull with PC1 scores ranging from − 4.0616 to 5.99969 and PC2 from − 0.42279 to 0.11149. Similarly, the 10 µM GA treatment displayed a distinct pattern, with PC1 scores varying between − 6.36301 and 4.13899 and PC2 between − 0.41066 and 0.17451. The highest variation was observed with the 20 µM GA treatment, spanning from − 1.7232 to 9.60124 for PC1 and − 0.56659 to 3.77421 for PC2 (Fig. 8A).
Figure 8.
Cluster plot convex hull for treatments (A), NP levels (B), and hierarchical cluster plot (C) for studied attributes.
For the stress condition without nanoparticles (No NP), the convex hull covered a cluster of points with PC1 scores ranging from − 8.63927 to 0.45056 and PC2 scores between − 0.56659 and 0.49291. Within this grouping, the stress condition labeled as ZnFNP exhibited a distinct set of points forming another convex hull, ranging from − 0.52107 to 9.60124 in PC1 and from − 0.4586 to 3.77421 in PC2. The convex hull analysis outlines the spatial distribution of data points, showing a clear separation between stress conditions, particularly the differentiation between No NP and ZnFNP based on their PC1 and PC2 scores (Fig. 8B).
For instance, electrolyte leakage and GPX shared a similarity score of 0.12434, indicating their proximity in response patterns. Chlorophyll a and shoot N displayed a similarity score of 0.13838, suggesting a close relationship between these parameters. Variables like chlorophyll b and transpiration rate, photosynthetic rate, and stomatal conductance exhibited a slightly higher similarity score of 0.18045 and 0.18059, respectively, indicating their comparable responses. As the similarity scores increased, the clustering showed relationships between root length and shoot dry weight with a score of 0.34492, denoting their closer association. Variables such as shoot length and shoot fresh weight had a similarity score of 1.01124, indicating their stronger association than other variables. Variables like SOD and CAT displayed higher similarity scores of 0.76518 and 1.9309, respectively, potentially indicating a distinct response pattern from other variables within this analysis. Variables such as grain N and root dry weight exhibited a much higher similarity score of 1.66212 (Fig. 8C).
Pearson correlation analysis
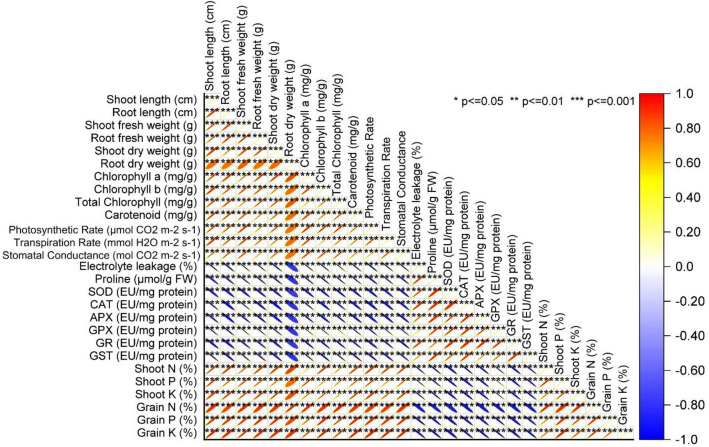
Plant growth-related metrics, such as shoot length demonstrated a strong positive correlation with root length at 0.9751, while biomass indicators, like shoot fresh weight and root fresh weight, exhibited a robust correlation of 0.98674. Similarly, parameters reflecting pigment content, including chlorophyll a and chlorophyll b, displayed a highly correlated relationship of 0.98658. Notably, physiological traits connected to photosynthesis and transpiration, such as photosynthetic and transpiration rates, also depicted strong positive correlations around 0.98628. However, stress-related markers, notably electrolyte leakage, exhibited a negative correlation ranging from − 0.95411 to − 0.99533 with key antioxidant enzyme activities (SOD, CAT, APX, GPX, GR, GST). Conversely, parameters linked to nutrient content, like shoot N, shoot P, shoot K, grain N, grain P, and grain K, demonstrated consistent positive correlations between 0.8984 and 0.99729, suggesting interdependence among these nutritional factors (Fig. 9).
Figure 9.
Pearson correlation analysis of the studied attributes.
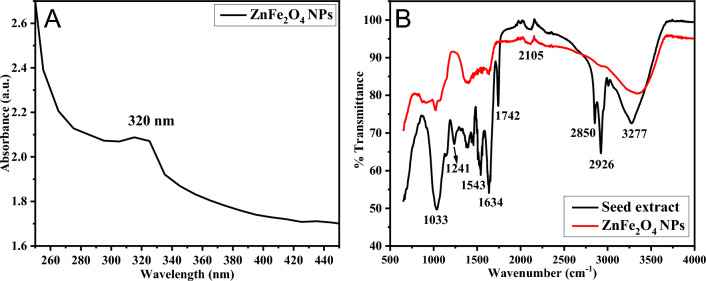
Figure 10A displays an absorption band centered around 320 nm in the Fenugreek seed extract stabilized ZnFe2O4 NPs. Within the spectrum, the 1033 cm−1 absorption band suggests the presence of C–O (alcohols, ethers, carboxylic acid, etc.), C–N (amines), and C–F vibrations from the extract. This band appears to facilitate the reduction of metal ions to zero valent NPs while simultaneously stabilizing them to prevent environmental oxidation. Another significant 1241 cm−1 absorption band, attributed to C–N amine, was evident in the Fenugreek seed extract but absent in the ZnFe2O4 NPs spectrum. Weak signals in the 1387–1460 cm−1 range were identified as bending vibrations of C–H alkanes, while sharper bands around 1543 cm−1 were linked to N–H bending in amide II. These IR vibrations were discernible, albeit with weak signals, in the functionalized NPs sample. The 1634 cm−1 absorption band, recognized as amide I, confirms the presence of amide linkages in proteins within the NPs sample, indicating the presence of carbonyl functional groups. Additionally, a moderate intensity C=O stretching bond observed at 1742 cm−1 suggests the presence of lipids, such as esters, in the extract but was absent in the Fenugreek seed extract stabilized NPs sample. An IR peak around 2105 cm−1 indicates the C≡C alkyne vibration observed in both samples (Fig. 10B). Furthermore, the absence of absorption bands at 2850 and 2926 cm−1, attributed to the stretching vibrations of symmetric and asymmetric SP3 C–H, in the NPs surface-bound Fenugreek seed ligand might suggest a non-covalent C-H binding to the NPs surfaces. In the FTIR analysis of Trigonella foenum-graecum L. extract, an absorption band at 3277 cm−1 was identified, indicating N–H stretching vibrations and O–H bonds formed from essential amides and starch in the green ligand.
Figure 10.
UV–Vis absorption spectrum of Trigonella foenum-graecum L. seeds extract-stabilized ZnFe2O4 NPs NPs (A). FTIR spectra of pure Trigonella foenum-graecum L. seeds powder and the ligand-stabilized ZnFe2O4 NPs (B).
Discussion
Salinity stress significantly impacts crops, disrupting their water balance and nutrient uptake, reducing growth, yield, and overall plant health43. It increases osmotic stress, hindering the plant's ability to absorb water, and ultimately affecting crop productivity and quality44. Salinity-induced stress induces oxidative stress in plants. Elevated salt concentrations prompt the production of reactive oxygen species (ROS) within plant cells. These ROS, including hydrogen peroxide (H2O2) and superoxide radicals (O2), inflict oxidative harm on cellular structures like lipids, proteins, and DNA. Consequently, this oxidative stress disturbs typical cellular processes and may ultimately result in cellular demise45,46. A significant decline in the growth of wheat also validated above arguments especially in control when wheat was cultivated in salinity stress.
Gallic acid (GA) enhances plant growth by stimulating cell elongation, aiding in photosynthesis and nutrient absorption, and acting as a potent growth regulator with antioxidant properties47. It also remediates the growth via improvement in water absorption capability which minimize the salinity induced osmotic stress48,49. Furthermore, in salt-treated plants, there was an increase in phenolic compounds, such as total phenols and flavonoids, due to GA. These compounds could potentially aid in scavenging excess reactive oxygen species (ROS) produced under such conditions50,51. GA exhibits potential antioxidant properties by mitigating lipid peroxidation and oxidative damage within plants. It achieves this by scavenging ROS and enhancing the antioxidant defense system and metabolic processes. This action helps to maintain cellular integrity and protect the plant against oxidative stress-induced harm52. Application of 20 µM GA + 5 µM ZnFNP demonstrated similar improvements in minimization of oxidative stress due to modulation in the antioxidants i.e., POD, SOD, APX etc.
Furthermore, ZnFe2O4 NPs have antioxidant qualities that help plants stressed by salt by efficiently scavenging reactive oxygen species (ROS) and boosting the activity of antioxidant enzymes as superoxide dismutase (SOD), catalase (CAT), and peroxidase (POD)17. Furthermore, the application of ZnFe2O4 NPs stimulates the synthesis of non-enzymatic antioxidants, including phenolic compounds and flavonoids, thereby bolstering the overall antioxidant defense system of plants. Collectively, these mechanisms contribute to the alleviation of oxidative damage and enhancement of plant resilience to salinity stress, ultimately promoting growth and productivity in affected crops17. In addition to above, it also has potential to enhance the uptake of nutrients in the plants that play an integral part in improvement of plant growth under stress conditions18. Similar kind of results were also noted, in current study where grains and shoot N, P and K were significantly enhanced over control where 20 µM GA + 5 µM ZnFNP was applied as treatment.
Conclusion
In conclusion, 20 µM GA + 5 µM ZnFNP can enhance wheat growth under salinity stress. Applying 20 µM GA + 5 µM ZnFNP also can also potentially improve N, P, and K in both grain and shoot of wheat grown in salinity stress. Moreover, the 20 µM GA + 5 µM ZnFNP treatment can regulate antioxidant levels in salinity, which might decrease the negative impacts of salinity on wheat. Further field studies are suggested for the declaration of 20 µM GA + 5 µM ZnFNP as a potential amendment for alleviating salinity stress in wheat.
Acknowledgements
This work was supported by the Key Nature Science Research Project of Anhui Science and Technology University (2021zrzd09). This project was supported by Researchers Supporting Project number (RSP2024R283), King Saud University, Riyadh, Saudi Arabia.
Author contributions
Conceptualization; M.B.H.; A.E.; M.R.; Conducted experiment; A.E.; M.B.H.; M.R.; Formal analysis; A.E.; R.D.; Methodology; Q.S.; L.R.; M.R.; R.D.; Writing—original draft; M.J.A.; H.S.A.; Q.S.; L.R.; Writing—review & editing; M.J.A.; H.S.A.; Q.S.; L.R.;
Funding
This work was supported by the Key Nature Science Research Project of Anhui Science and Technology University (2021zrzd09). This project was supported by Researchers Supporting Project number (RSP2024R283), King Saud University, Riyadh, Saudi Arabia.
Data availability
All data generated or analyzed during this study are included in this published article.
Competing interests
The authors declare no competing interests.
Footnotes
Publisher's note
Springer Nature remains neutral with regard to jurisdictional claims in published maps and institutional affiliations.
Contributor Information
Qingqin Shao, Email: Shaoqq@ahstu.edu.cn.
Rahul Datta, Email: rahulmedcure@gmail.com.
Abdullah Ehsan, Email: abdullahehsanbzu1@gmail.com.
References
- 1.Huang S, et al. Evaluating the hidden potential of deashed biochar in mitigating salinity stress for cultivation of fenugreek. Sci. Rep. 2024;14:141. doi: 10.1038/s41598-023-49063-8. [DOI] [PMC free article] [PubMed] [Google Scholar]
- 2.Ma Y, et al. γ-Aminobutyric acid (GABA) and ectoine (ECT) impacts with and without AMF on antioxidants, gas exchange attributes and nutrients of cotton cultivated in salt affected soil. BMC Plant Biol. 2023;23:476. doi: 10.1186/s12870-023-04486-3. [DOI] [PMC free article] [PubMed] [Google Scholar]
- 3.Irshad K, et al. Bio-priming with salt tolerant endophytes improved crop tolerance to salt stress via modulating photosystem II and antioxidant activities in a sub-optimal environment. Front. Plant Sci. 2023;14:1082480. doi: 10.3389/fpls.2023.1082480. [DOI] [PMC free article] [PubMed] [Google Scholar]
- 4.Huang S, et al. Uncovering the impact of AM fungi on wheat nutrient uptake, ion homeostasis, oxidative stress, and antioxidant defense under salinity stress. Sci. Rep. 2023;13:8249. doi: 10.1038/s41598-023-35148-x. [DOI] [PMC free article] [PubMed] [Google Scholar]
- 5.Farooq F, et al. Impact of varying levels of soil salinity on emergence, growth and biochemical attributes of four Moringa oleifera landraces. PLoS One. 2022;17:e0263978. doi: 10.1371/journal.pone.0263978. [DOI] [PMC free article] [PubMed] [Google Scholar] [Retracted]
- 6.Ashraf F, Chen Y. Synergistic effects of biochar and arbuscular mycorrhizal fungi on enhancing Elymus elymoides growth in saline coastal soil. Pak. J. Bot. 2023;55:119–126. doi: 10.30848/PJB2023-SI(14). [DOI] [Google Scholar]
- 7.Gill S, et al. Effect of silicon nanoparticle-based biochar on wheat growth, antioxidants and nutrients concentration under salinity stress. Sci. Rep. 2024;14:6380. doi: 10.1038/s41598-024-55924-7. [DOI] [PMC free article] [PubMed] [Google Scholar]
- 8.Danish S, et al. The role of strigolactone in alleviating salinity stress in chili pepper. BMC Plant Biol. 2024;24:209. doi: 10.1186/s12870-024-04900-4. [DOI] [PMC free article] [PubMed] [Google Scholar]
- 9.Zafar S, et al. Modulations of wheat growth by selenium nanoparticles under salinity stress. BMC Plant Biol. 2024;24:35. doi: 10.1186/s12870-024-04720-6. [DOI] [PMC free article] [PubMed] [Google Scholar]
- 10.Kaya C, Ugurlar F, Ashraf M, Alam P, Ahmad P. Nitric oxide and hydrogen sulfide work together to improve tolerance to salinity stress in wheat plants by upraising the AsA-GSH cycle. Plant Physiol. Biochem. 2023;194:651–663. doi: 10.1016/j.plaphy.2022.11.041. [DOI] [PubMed] [Google Scholar]
- 11.Zahid A, et al. Exogenous application of sulfur-rich thiourea (STU) to alleviate the adverse effects of cobalt stress in wheat. BMC Plant Biol. 2024;24:126. doi: 10.1186/s12870-024-04795-1. [DOI] [PMC free article] [PubMed] [Google Scholar]
- 12.Shen X, Min X, Zhang S, Song C, Xiong K. Effect of heavy metal contamination in the environment on antioxidant function in wumeng semi-fine wool sheep in Southwest China. Biol. Trace Elem. Res. 2020;198:505–514. doi: 10.1007/s12011-020-02081-3. [DOI] [PubMed] [Google Scholar]
- 13.Saeed S, et al. Salicylic acid and α-tocopherol ameliorate salinity impact on wheat. ACS Omega. 2023;8:26122–26135. doi: 10.1021/acsomega.3c02166. [DOI] [PMC free article] [PubMed] [Google Scholar]
- 14.Younis U, Danish S, Datta R, Alahmadi TA, Ansari MJ. Sustainable remediation of chromium-contaminated soils: Boosting radish growth with deashed biochar and strigolactone. BMC Plant Biol. 2024;24:115. doi: 10.1186/s12870-024-04791-5. [DOI] [PMC free article] [PubMed] [Google Scholar]
- 15.Babaei M, Shabani L, Hashemi-Shahraki S. Improving the effects of salt stress by β-carotene and gallic acid using increasing antioxidant activity and regulating ion uptake in Lepidium sativum L. Bot. Stud. 2022;63:22. doi: 10.1186/s40529-022-00352-x. [DOI] [PMC free article] [PubMed] [Google Scholar]
- 16.Liu Y, Li F, Huang Q. Allelopathic effects of gallic acid from Aegiceras corniculatum on Cyclotella caspia. J. Environ. Sci. 2013;25:776–784. doi: 10.1016/S1001-0742(12)60112-0. [DOI] [PubMed] [Google Scholar]
- 17.Abdelhameed R, Abu-Elsaad N, Abdel Latef A, Metwally R. Tracking of zinc ferrite nanoparticle effects on pea (Pisum sativum L.) plant growth, pigments, mineral content and arbuscular mycorrhizal colonization. Plants. 2021;10:583. doi: 10.3390/plants10030583. [DOI] [PMC free article] [PubMed] [Google Scholar]
- 18.Saleem I, et al. Potassium ferrite nanoparticles on DAP to formulate slow release fertilizer with auxiliary nutrients. Ecotoxicol. Environ. Saf. 2021;215:112148. doi: 10.1016/j.ecoenv.2021.112148. [DOI] [PubMed] [Google Scholar]
- 19.Tayade, R., Kabange, R., Ali, M. W., Yun, B.-W. & Nabi, R. B. S. Biofortification of wheat using current resources and future challenges. in Biofortification in Cereals: Progress and Prospects 173–208 (Springer, 2023).
- 20.EL Sabagh A, et al. Salinity stress in Wheat (Triticum aestivum L.) in the changing climate: Adaptation and management strategies. Front. Agron. 2021;3:661932. doi: 10.3389/fagro.2021.661932. [DOI] [Google Scholar]
- 21.Hasanuzzaman, M., Nahar, K. & Fujita, M. Plant response to salt stress and role of exogenous protectants to mitigate salt-induced damages. in Ecophysiology and Responses of Plants under Salt Stress (eds. Ahmad, P., Azooz, M. M. & Prasad, M. N. V.) 25–87 (Springer, 2013). 10.1007/978-1-4614-4747-4_2.
- 22.Hossain A, et al. Consequences and mitigation strategies of abiotic stresses in wheat (Triticum aestivum L.) under the changing climate. Agronomy. 2021;11:241. doi: 10.3390/agronomy11020241. [DOI] [Google Scholar]
- 23.Page, A. L., Miller, R. H. & Keeny, D. R. Soil pH and lime requirement. in Methods of Soil Analysis: Part 2 Chemical and Microbiological Properties, 9.2.2/Agronomy Monographs (ed. Page, A. L.) 199–208 (American Society of Agronomy, Inc. and Soil Science Society of America, Inc., 1983). 10.2134/agronmonogr9.2.2ed.
- 24.Estefan, G., Sommer, R. & Ryan, J. Methods of Soil , Plant , and Water Analysis : A Manual for the West Asia and North Africa Region. (International Center for Agricultural Research in the Dry Areas (ICARDA), Beirut, Lebanon, 2013).
- 25.Rhoades, J. D. Salinity: Electrical conductivity and total dissolved solids. in Methods of Soil Analysis, Part 3, Chemical Methods (eds. D.L. Sparks et al.) vol. 5 417–435 (Soil Science Society of America, 1996).
- 26.Nelson, D. W. & Sommers, L. E. Total Carbon, Organic Carbon, and Organic Matter. in Methods of Soil Analysis: Part 2 Chemical and Microbiological Properties (ed. Page, A. L.) vol. sssabookse 539–579 (American Society of Agronomy, Crop Science Society of America, and Soil Science Society of America, 1982).
- 27.Pratt, P. F. Potassium. in Methods of Soil Analysis, Part 2: Chemical and Microbiological Properties (ed. Norman, A. G.) 1022–1030 (Wiley, 2016). 10.2134/agronmonogr9.2.c20.
- 28.Donald, A. H. & Hanson, D. Determination of potassium and sodium by flame emmision spectrophotometery. in Handbook of Reference Methods for Plant Analysis (ed. Kalra, Y.) 153–155 (CRC Press, 1998).
- 29.Gee, G. W. & Bauder, J. W. Particle-size Analysis. in Methods of soil analysis. Part 1. Physical and mineralogical methods (ed. Klute, A.) 383–411 (Wiley, 2018). 10.2136/sssabookser5.1.2ed.c15.
- 30.Bremner, M. Nitrogen-total. in Methods of Soil Analysis Part 3. Chemical Methods-SSSA Book Series 5 (eds. Sumner, D. L. et al.) 1085–1121 (Wiley, 1996).
- 31.Kuo, S. Phosphorus. in Methods of Soil Analysis Part 3: Chemical Methods (eds. Sparks, D. L. et al.) 869–919 (Wiley, 2018). 10.2136/sssabookser5.3.c32.
- 32.Arnon DI. Copper enzymes in isolated chloroplasts. Polyphenoloxidase in beta vulgaris. Plant Physiol. 1949;24:1–15. doi: 10.1104/pp.24.1.1. [DOI] [PMC free article] [PubMed] [Google Scholar]
- 33.Nazar R, Khan MIR, Iqbal N, Masood A, Khan NA. Involvement of ethylene in reversal of salt-inhibited photosynthesis by sulfur in mustard. Physiol. Plant. 2014;152:331–344. doi: 10.1111/ppl.12173. [DOI] [PubMed] [Google Scholar]
- 34.Dhindsa RS, Plumb-Dhindsa PL, Reid DM. Leaf senescence and lipid peroxidation: Effects of some phytohormones, and scavengers of free radicals and singlet oxygen. Physiol. Plant. 1982;56:453–457. doi: 10.1111/j.1399-3054.1982.tb04539.x. [DOI] [Google Scholar]
- 35.Aebi, H. Catalase in Vitro. in 121–126 (1984). 10.1016/S0076-6879(84)05016-3.
- 36.Nakano Y, Asada K. Hydrogen peroxide is scavenged by ascorbate-specific peroxidase in spinach chloroplasts. Plant Cell Physiol. 1981;22:867–880. [Google Scholar]
- 37.Anderson ME. Determination of glutathione and glutathione disulfide in biological samples. Methods Enzymol. 1985;113:548–555. doi: 10.1016/S0076-6879(85)13073-9. [DOI] [PubMed] [Google Scholar]
- 38.Lutts S, Kinet JM, Bouharmont J. NaCl-induced senescence in leaves of rice (Oryza sativa L.) cultivars differing in salinity resistance. Ann. Bot. 1996;78:389–398. doi: 10.1006/anbo.1996.0134. [DOI] [Google Scholar]
- 39.Bates LS, Waldren RP, Teare ID. Rapid determination of free proline for water-stress studies. Plant Soil. 1973;39:205–207. doi: 10.1007/BF00018060. [DOI] [Google Scholar]
- 40.Banerjee P, Prasad B. Determination of concentration of total sodium and potassium in surface and ground water using a flame photometer. Appl. Water Sci. 2020;10:1–7. doi: 10.1007/s13201-020-01188-1. [DOI] [Google Scholar]
- 41.Steel RG, Torrie JH, Dickey DA. Principles and Procedures of Statistics: A Biometrical Approach. McGraw Hill Book International Co.; 1997. [Google Scholar]
- 42.OriginLab Corporation. OriginPro. (OriginLab, 2021).
- 43.Sharaya R, et al. Plant-microbe interaction mediated salinity stress tolerance for sustainable crop production. S. Afr. J. Bot. 2023;161:454–471. doi: 10.1016/j.sajb.2023.08.043. [DOI] [Google Scholar]
- 44.Zhang D, Zhang Y, Sun L, Dai J, Dong H. Mitigating salinity stress and improving cotton productivity with agronomic practices. Agronomy. 2023;13:2486. doi: 10.3390/agronomy13102486. [DOI] [Google Scholar]
- 45.Hossen MS, et al. Comparative physiology of indica and japonica rice under salinity and drought stress: An intrinsic study on osmotic adjustment, oxidative stress, antioxidant defense and methylglyoxal detoxification. Stresses. 2022;2:156–178. doi: 10.3390/stresses2020012. [DOI] [Google Scholar]
- 46.Hasanuzzaman M, et al. Biostimulants for the regulation of reactive oxygen species metabolism in plants under abiotic stress. Cells. 2021;10:2537. doi: 10.3390/cells10102537. [DOI] [PMC free article] [PubMed] [Google Scholar]
- 47.Likhanov A, Klyuvadenko A, Subin O, Shevchuk M, Dubchak M. Gallic acid as a non-specific regulator of phenol synthesis and growth of regenerate plants of Corylus avellana (L.) H. Karst. and Salix alba L. in vitro. Sci. J. Ukr. J. For. Wood Sci. 2021;13:52–63. [Google Scholar]
- 48.Ozfidan-Konakci C, Yildiztugay E, Kucukoduk M. Protective roles of exogenously applied gallic acid in Oryza sativa subjected to salt and osmotic stresses: Effects on the total antioxidant capacity. Plant Growth Regul. 2015;75:219–234. doi: 10.1007/s10725-014-9946-4. [DOI] [Google Scholar]
- 49.Ozfidan-Konakci C, Yildiztugay E, Kucukoduk M. Upregulation of antioxidant enzymes by exogenous gallic acid contributes to the amelioration in Oryza sativa roots exposed to salt and osmotic stress. Environ. Sci. Pollut. Res. 2015;22:1487–1498. doi: 10.1007/s11356-014-3472-9. [DOI] [PubMed] [Google Scholar]
- 50.Yildiztugay E, Ozfidan-Konakci C, Kucukoduk M. Improvement of cold stress resistance via free radical scavenging ability and promoted water status and photosynthetic capacity of gallic acid in soybean leaves. J. Soil Sci. Plant Nutr. 2017;17:366–384. [Google Scholar]
- 51.Colak N, Kurt-Celebi A, Fauzan R, Torun H, Ayaz FA. The protective effect of exogenous salicylic and gallic acids ameliorates the adverse effects of ionizing radiation stress in wheat seedlings by modulating the antioxidant defence system. Plant Physiol. Biochem. 2021;168:526–545. doi: 10.1016/j.plaphy.2021.10.020. [DOI] [PubMed] [Google Scholar]
- 52.Rahman A, et al. Exogenous gallic acid confers salt tolerance in rice seedlings: Modulation of ion homeostasis, osmoregulation, antioxidant defense, and methylglyoxal detoxification systems. Agronomy. 2022;13:16. doi: 10.3390/agronomy13010016. [DOI] [Google Scholar]
Associated Data
This section collects any data citations, data availability statements, or supplementary materials included in this article.
Data Availability Statement
All data generated or analyzed during this study are included in this published article.


