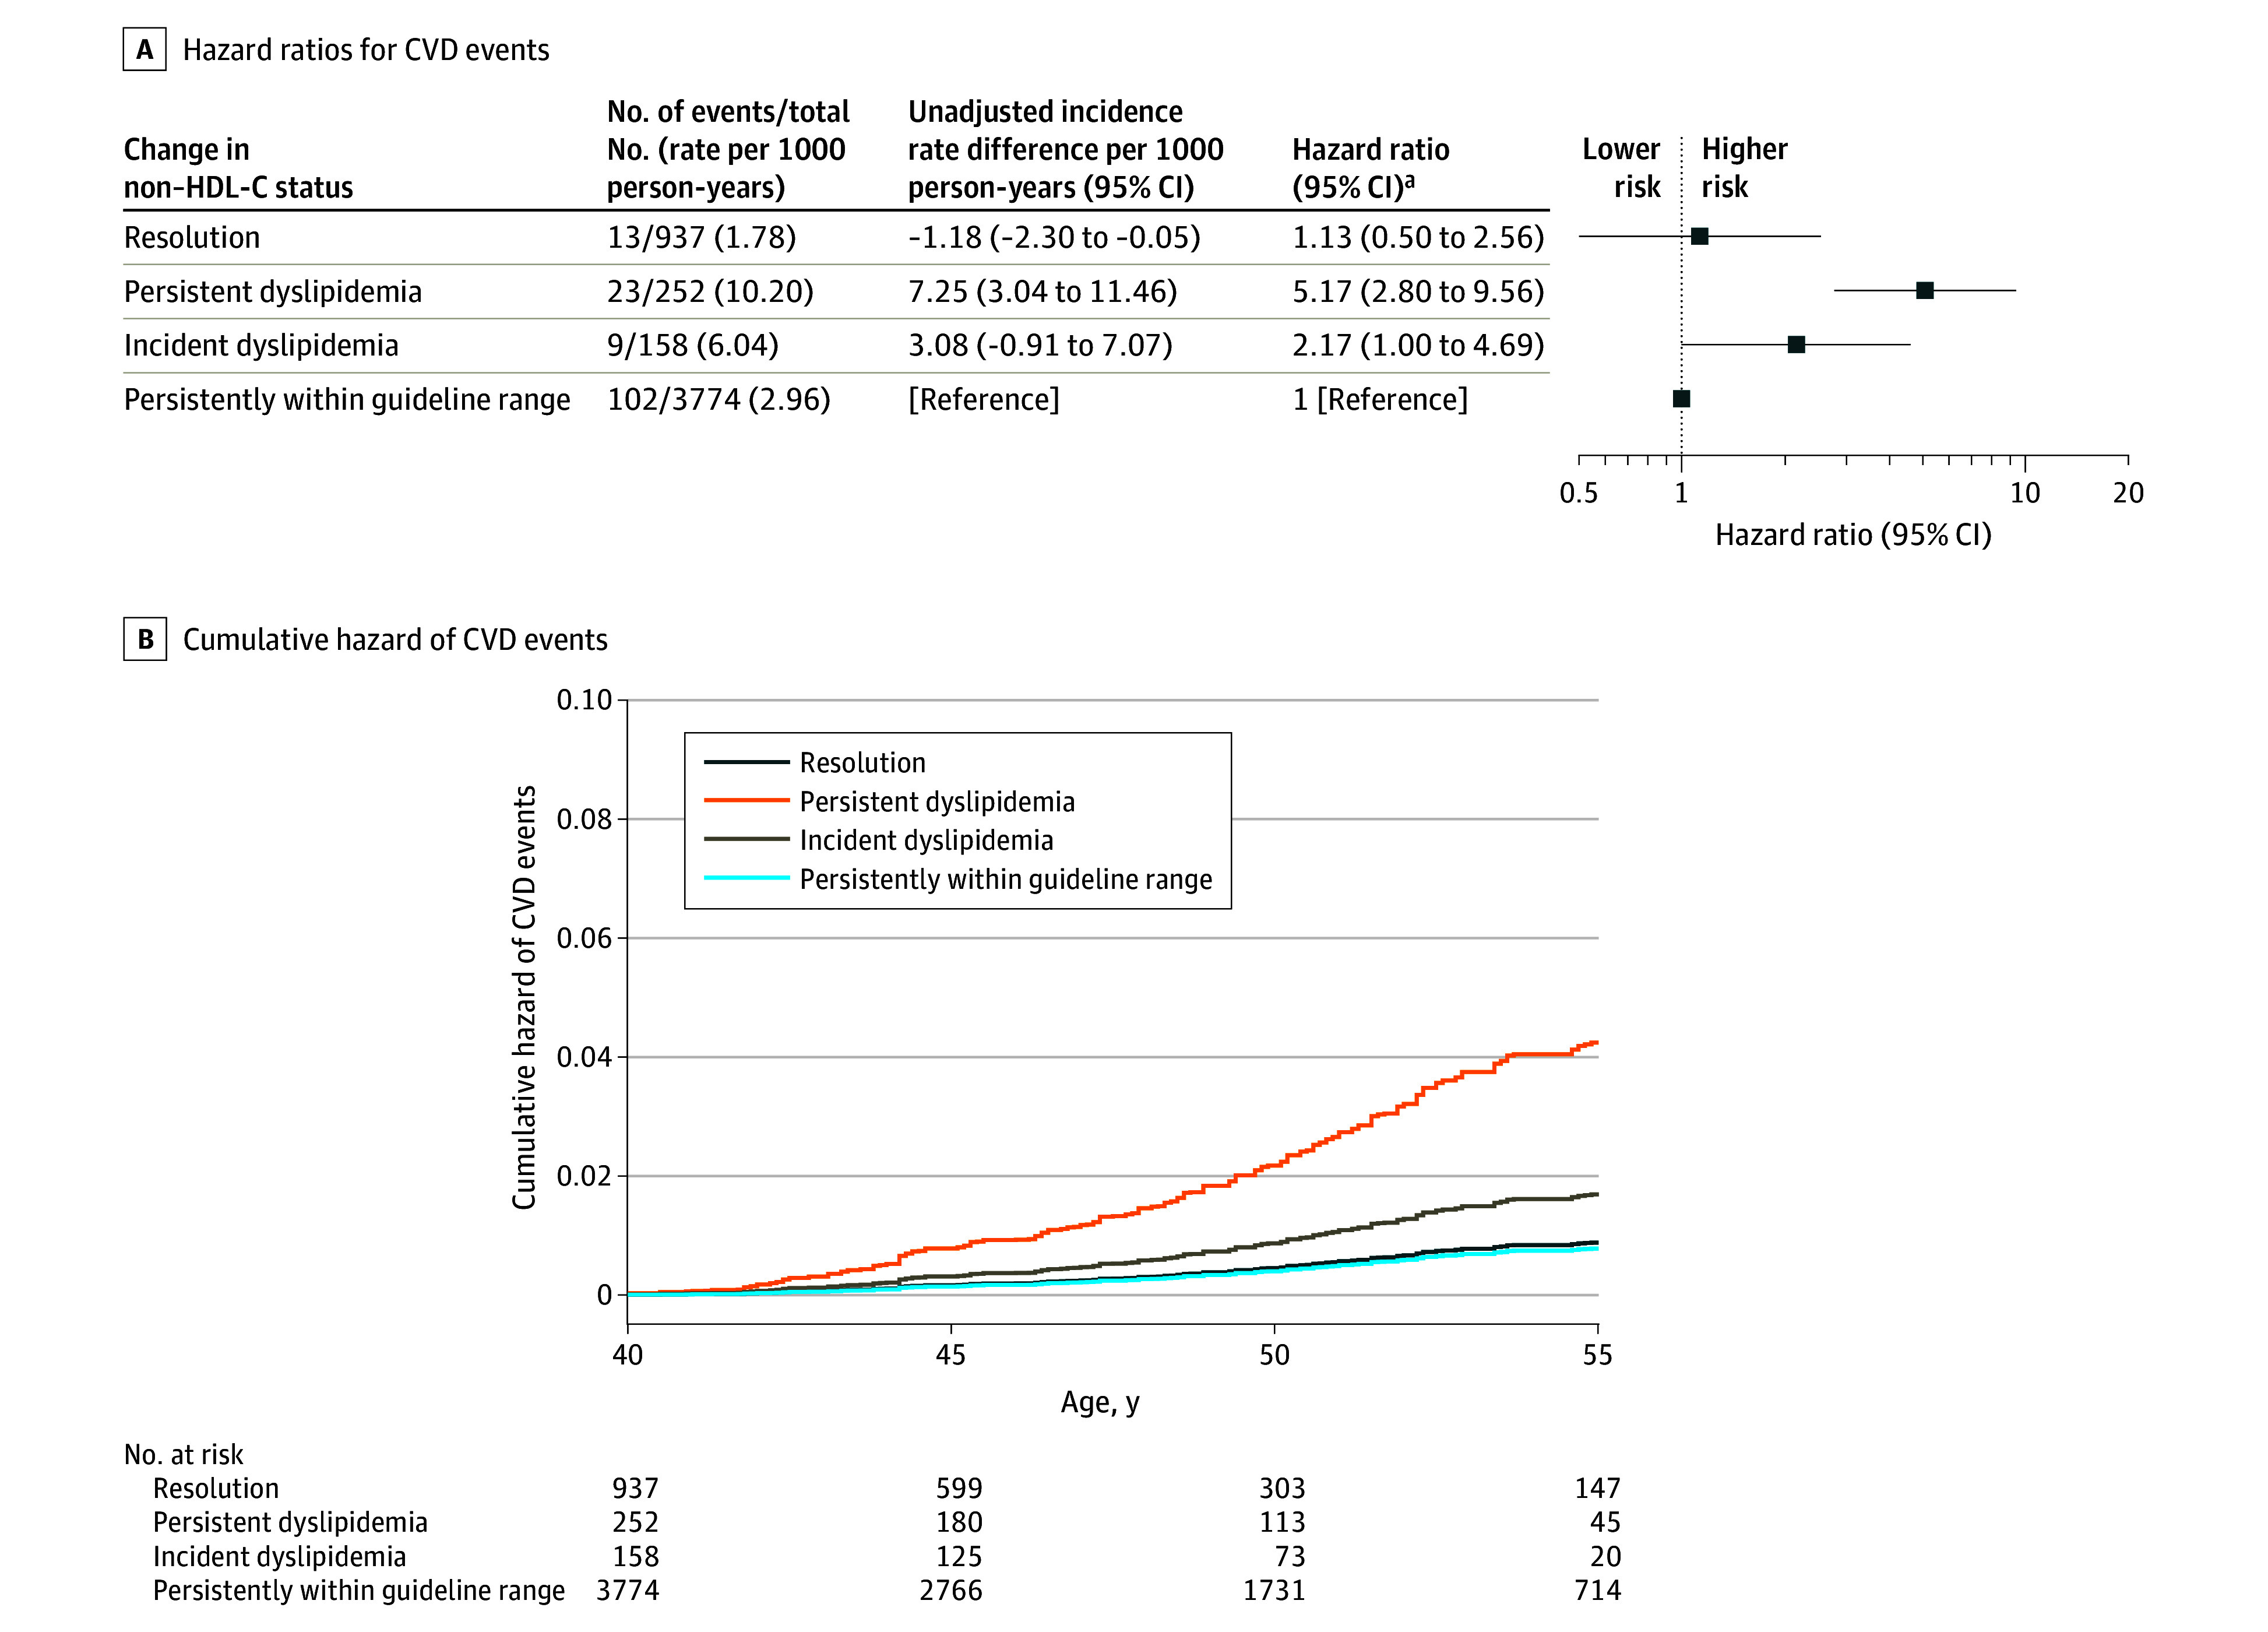
Figure 3. Hazard Ratios and Cumulative Hazard of CVD Events According to Change in Non–HDL-C Status Between Childhood and Adulthood.

CVD indicates cardiovascular disease; non–HDL-C, non–high-density lipoprotein cholesterol. See Figure 2 legend for conditions included in incident CVD events. There were 147 incident CVD events (5121 participants; incidence rate, 3.23 per 1000 person-years). The graph is truncated at age 55 years, after which only 5% of participants were followed up.
aCohort-stratified cause-specific hazard models were used and analyses were weighted by the inverse of probability of being included in analysis and were adjusted for sex, Black race, mean age at and calendar year of childhood measurement, childhood smoking, mean age- and sex-specific z scores for body mass index and systolic blood pressure, adult smoking, and change in z scores for body mass index and systolic blood pressure between childhood and adulthood. Childhood/adult individual means of non–HDL-C for each participant were used to classify risk status. Non–HDL-C cutoffs to define dyslipidemia were 145 mg/dL in childhood and 190 mg/dL in adulthood (to convert non–HDL-C from mg/dL to mmol/L, divide values by 38.67). The 4 groups were defined as resolution (dyslipidemia in childhood, nondyslipidemia in adulthood), persistent dyslipidemia (dyslipidemia in both childhood and adulthood), incident dyslipidemia (nondyslipidemia in childhood, dyslipidemia in adulthood), and persistent normal non–HDL-C levels (nondyslipidemia in both childhood and adulthood).
