Abstract
The request for both high catalytic selectivity and high catalytic activity is rather challenging, particularly for catalysis systems with the primary and side reactions having comparable energy barriers. Here in this study, we simultaneously optimized the selectivity and activity for acetylene semi-hydrogenation by rationally and continuously varying the doping ratio of Zn atoms on the surface of Pd particles in Pd/ZnO catalysts. In the reaction temperature range of 40–200 °C, the conversion of acetylene was close to ∼100%, and the selectivity for ethylene exceeded 90% (the highest ethylene selectivity, ∼98%). Experimental characterization and density functional theory calculations revealed that the Zn promoter could alter the catalyst's potential energy surface, resulting in a “confinement” effect, which effectively improves the selectivity yet without significantly impairing the catalytic activity. The mismatched impacts on activity and selectivity resulting from continuous and controllable alteration in the catalyst structure provide a promising parameter space within which the two aspects could both be optimized.
Inducing a potential barrier alters the potential energy surface of the flat Pd catalyst, resulting in a “confinement” effect that achieves a simultaneous optimization of the selectivity and activity of the catalyst in acetylene semi-hydrogenation.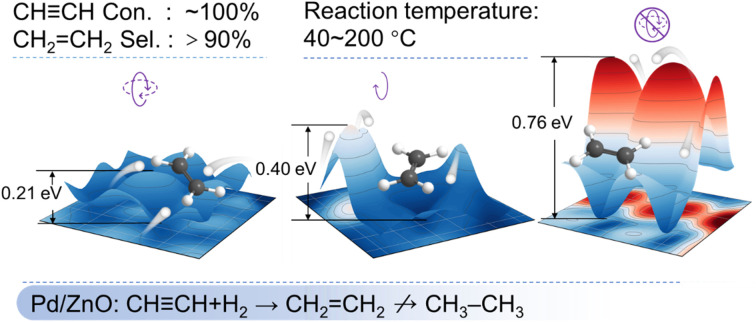
Introduction
Utilizing the techniques in nanomaterial synthesis to obtain model catalysts with well-defined and controllable active structures could help to establish a clearer picture on the structure–property relationships, which could provide guidance for solving the complex problems in catalytic systems, thus allowing for the optimization of catalytic performance in a targeted manner. One of the primary goals in catalysis is to develop catalysts with desired activity and selectivity customized for specific reactions.1–3 However, in practice it is often rather difficult to optimize the subtle balance between catalytic activity and selectivity.4,5 For instance, Pd-based catalysts, which have been widely used in selective semi-hydrogenation of alkynes,6–8 usually have excellent activity yet poor controllability over the issue of over-hydrogenation into alkanes,9,10 leading to an unsatisfactory selectivity for the corresponding olefins. As a result, it is common to resort to poisoning or inhibitory agents to passivate these excessively active centers in Pd catalysts,11–13 thus conferring an appropriate selectivity for semi-hydrogenation, as in Lindlar's catalyst.14,15
Transition metal promoters (such as Cu, Ag, Au, and Zn)7,16–18 have also been introduced to regulate the selectivity of Pd-based catalysts; it is generally believed that these transition metal atoms would occupy those low-coordinated and overly active Pd sites typically located at the edges and corners of the catalyst particles. In recent years, taking advantage of the structure of single-atom catalysts to adjust the adsorption configuration of the substrate molecules has also been used as a strategy to improve the selectivity.19–21 Yet, notably, these strategies for selectivity regulation often come at the expense of catalytic activity.
Therefore, it remains a central task to establish a balance between activity and selectivity for the catalysts required. Despite the regulation strategies that have been proposed and developed thus far, the mechanisms of selectivity control are often elusive, as regulation would usually further complicate the catalytic systems,22,23 which adds to the difficulties in probing the structure–performance relationship. In this regard, advanced techniques in material synthesis could be employed to construct model catalysts featuring well-defined structures,24–26 and these model catalysts could be used to investigate the structural alteration induced by regulation measures, and thus help establish the structure–performance relationship.
In this study, a series of Pd/ZnO model catalysts were rationally designed to investigate the efficacy of performance regulation and the catalytic mechanism in acetylene (C2H2) semi-hydrogenation. The ZnO support features preferential exposure of inert oxygen-rich facets, whereupon Pd particles are loaded. After the catalyst was subjected to a reductive H2 atmosphere at different temperatures, the promoter Zn could diffuse to the Pd particle surface, with the Zn ratio being continuously tunable, yet without introducing other complications such as the burial of the Pd sites. When applied in C2H2 semi-hydrogenation, the obtained model catalyst series display catalytic performances that vary consistently with the Zn ratio, and the selectivity for ethylene (C2H4) could be increased from a minimum of 16% to almost 100%. Most notably, by fine-tuning the ratio of the Zn promoter in the catalyst, the conversion could approach ∼100% over a wide range of reaction temperatures (40–200 °C), with a selectivity above 90%.
We conducted in situ/ex situ spectroscopies, chemical adsorption–desorption tests and density functional theory (DFT) calculations, and revealed that the introduction of Zn would suppress the activity of electrons at the catalyst surface and modulate the potential energy surface, which would in turn alter the adsorption, activation and migration steps of the substrate molecules. Specifically, the Zn atoms on the Pd particle surface could induce a local potential energy barrier that is unfavorable for the adsorption of substrate molecules, and the resulting “confinement” effect would constrain the adsorption configuration, thereby lowering the probability of effective collision between C2H2 and active *H species, substantially alleviating over-hydrogenation. The desired product, C2H4, has a larger molecular size (with a longer C–C bond and more C–H bonds), and thus would be more prone to the “confinement” effect, and become more prone to desorption, leading to a higher selectivity for semi-hydrogenation. As the ratio of surface Zn increases, the areal density of the barriers on the potential energy surface becomes higher, and the barrier heights also increase nonlinearly; this would further constrain the space for optimal adsorption, and hinder the migration of active *H, collectively leading to a higher selectivity, and an activity only slightly impaired. Nevertheless, the resulting decline in activity lags behind the increase in selectivity, and could be compensated for by simply increasing the reaction temperature. Therefore, it could be seen that as the Zn ratio increases, the resulting alteration in activity and selectivity is rather mismatched, and the conventional issue of the activity–selectivity trade-off is thus circumvented.
Results and discussion
Morphological and structural characterization
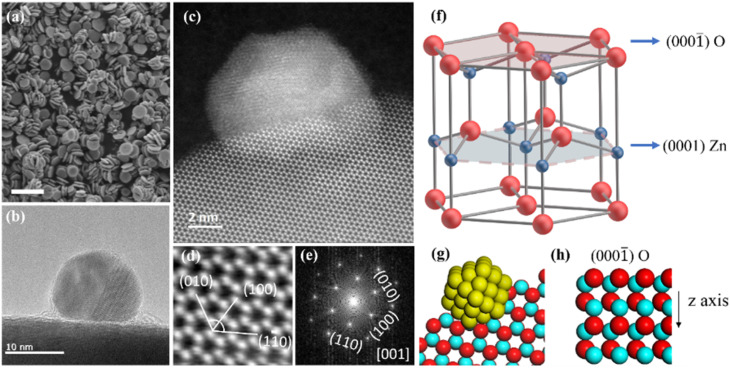
The bi-plate shape ZnO nanocrystals which have a dorayaki-like morphology were synthesized as the support (Fig. 1a and S1†),27 and PdO particles were deposited on the preferentially exposed oxygen-rich facets (0001̄), with a mass loading of ∼0.1 wt% (Fig. 1b). This structural relationship was further demonstrated by high angle angular dark field-scanning transmission electron microscopy (HAADF-STEM). In the HAADF-STEM image (Fig. 1c), the Pd particle is loaded on the ZnO hexagonal ring surface. Combined with the locally magnified image (Fig. 1d) and its FFT pattern (Fig. 1e), analysis shows that the electron beam is incident along the ZnO (001̄) or (0001̄) zone axis. Fig. 1d presents three crystal planes, (010), (100), and (11̄0), with an angle of 60°, which is consistent with the corresponding diffraction spots in FFT images. Therefore, the hexagonal ring surface is the (0001̄) surface, that is, the nanocrystals are loaded on the ZnO (0001̄) surface. Fig. 1g illustrates this arrangement. Further exploration of the ZnO (0001̄) surface reveals that when observed perpendicular to the surface, the crystal structure presents a well-ordered hexagonal ring structure (Fig. 1f and g), and when observed parallel to the surface, the surface is an oxygen-rich surface (Fig. 1h). Therefore, the Pd particle is loaded on this oxygen-rich surface.
Fig. 1. Morphological and structural characterization of the catalyst. (a) SEM image of the ZnO crystals with a dorayaki-like morphology. (b) TEM image and (c) HAADF-STEM image of a Pd particle deposited on the oxygen-rich (000 1̄ ) surface of ZnO. (d) High-magnification image of the lower part in (c). (e) The corresponding FFT pattern of (c). (f) Scheme of wurtzite ZnO with the (000 1̄ ) oxygen-rich surface. (g) Model of the PdO/ZnO atomic structure. (h) The atomic arrangement at different ZnO facets. Pd (yellow), Zn (blue), and O (red).
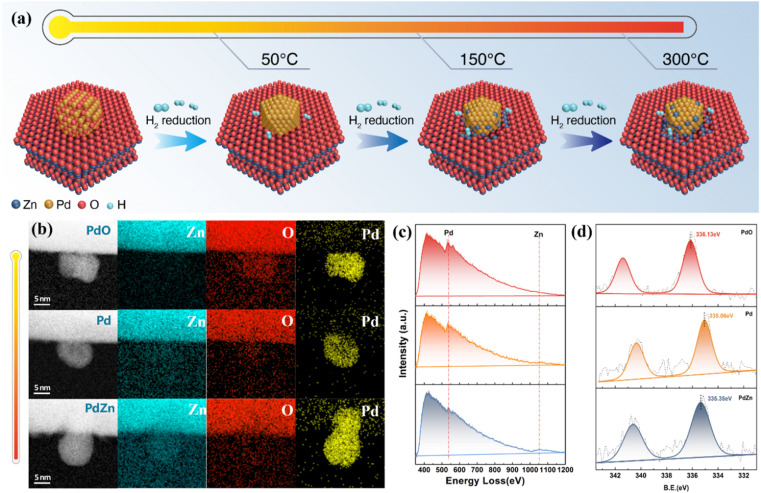
In situ aberration-corrected scanning transmission electron microscopy (AC-STEM) was conducted to monitor the structural evolution of the catalyst under a reductive H2 atmosphere. As shown in Fig. 2a–c and S2,† the supported PdO particle was first reduced into metallic Pd; as the temperature increased, some Zn atoms diffused into the Pd particle. Electron energy loss spectroscopy (EELS) and quantitative simulation of the elements of Pd, O and Zn revealed that for the catalyst in a reductive atmosphere, the Zn atoms diffused into the Pd particle from the Pd/support interface (Fig. S3 and Tables S1, S2†). This is because the high temperature could facilitate the activation of H2 on the Pd surface, and the Zn(ii) ions at the interface would be reduced by the active H species.28,29 Then the subsurface Zn(ii) would come into contact with the Pd particle, and also be reduced by the active H absorbed in the Pd lattice, leading to the gradual diffusion of Zn atoms from the interior to the surface of the Pd particle.
Fig. 2. Continuous structural evolution of Pd/ZnO model catalysts. (a) Schematic illustration of the preparation procedures of the Pd/ZnO catalyst series. (b) In situ AC-STEM images and elemental mapping of Pd/ZnO catalysts. (c) In situ EELS profiles of Pd and Zn corresponding to (b). (d) Quasi in situ XPS profiles of Pd 3d.
The surface composition and chemical environment of the catalysts were probed via quasi in situ X-ray photoelectron spectroscopy (XPS). Fig. 2d shows that as the reduction temperature increased from 50 °C to 300 °C, the Pd 3d peak shifted from 336.13 eV (corresponding to PdO) to 334.95 eV (metallic Pd).30,31 A further increase in temperature led to a shift to a higher binding energy (335.35 eV, ascribed to the formation of the PdZn alloy).32 These data confirm that a higher temperature would result in a higher Zn ratio on the Pd particle surface.
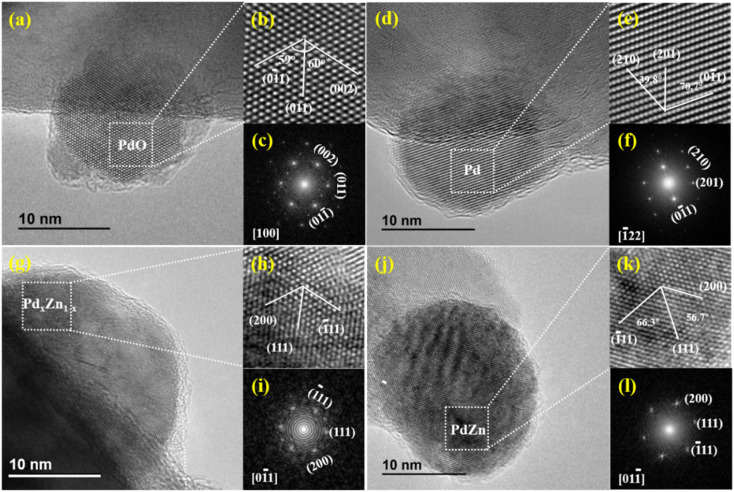
In order to obtain further details on the catalyst structures, the samples prepared at different reduction temperatures, hereafter denoted as y-Pd/ZnO (in which y stands for the temperature), were examined via high-resolution transmission electron microscopy (HRTEM). Fig. 3 summarizes the results corresponding to the sample before reduction and the samples after reduction at 50 °C, 150 °C and 300 °C. For the sample before reduction (Fig. 3a and b), the interplanar spacings for the particle deposited on ZnO were measured to be 2.6 Å/2.6 Å and 2.7 Å, with interplanar angles of 59°/60°, which could be assigned to the (011̄), (011), and (002) crystal planes of tetragonal PdO (JCPDS no. 41-1107),29,33 respectively. These inferences were further confirmed by the fast Fourier transform (FFT) patterns (Fig. 3c). In contrast, the sample after reduction at 50 °C (50-Pd/ZnO) showed a face-centered cubic structure characteristic of metallic Pd (no. 46-1043, Fig. 3d–f). For 150-Pd/ZnO, two crystal structures were observed (Fig. 3g–i). The phase in the dotted box in Fig. 3g was indexed as the tetragonal PdZn1−x intermetallic alloy, with the characteristic crystal planes (111) (spacing, 2.2 Å) and (1̄11) forming a lattice angle of 64°, significantly different from that for metallic Pd (70°). After reduction at 300 °C, the particle had evolved into a highly crystalline phase of a tetragonal PdZn single crystal (JCPDS no. 06-0620, Fig. 3j–l). The data above suggest that the supported PdO particles could be converted into metallic Pd under H2 reduction at merely 50 °C, and a further increase in temperature could result in continuous alteration in the particle composition and structure, eventually leading to formation of intermetallic PdZn particles.
Fig. 3. Structural details of the Pd/ZnO catalyst series. HRTEM images (a, b, d, e, g, h, j, and k) and FFT patterns (c, f, i, and l) of unreduced PdO/ZnO (a–c), 50-Pd/ZnO (d–f), 150-Pd/ZnO (g–i), and 300-Pd/ZnO (j–l).
XPS was also conducted to probe the structural evolution described above. As shown in Fig. S4,† with the increase in temperature, the Pd 3d peaks shifted to higher energy as a result of the enrichment of surface Zn atoms.34,35 Therefore, the Pd ratio in the intermetallic PdZn is directly related to the Zn ratio at the particle surface. Table S3† summarizes the data of deconvolution of the XPS peaks. It could be noted that as the temperature increases, the Zn ratio at the particle surface increases accordingly. After 300 °C reduction, the Zn/Pd atomic ratio was approximately 1 : 1. These results further confirm that by varying the reduction temperature, the surface composition and the crystal structure of the Pd-based catalyst particles could be tuned continuously.
Selective hydrogenation of C2H2 into C2H4
The catalyst series were tested in C2H2 semi-hydrogenation, and their performances are summarized in Table S4.† It could be seen that after the introduction of the promoter Zn, the selectivity for C2H4 was improved dramatically (from ∼16% to ∼100%).
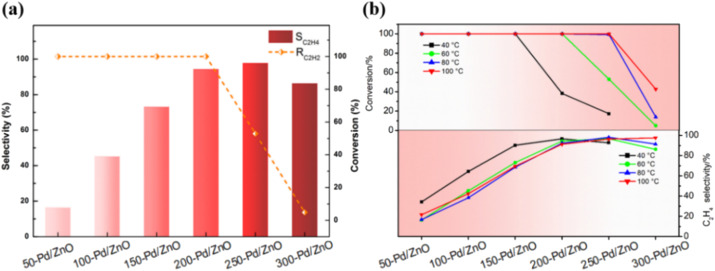
Fig. 4a shows the results obtained for catalytic reactions conducted at 60 °C; as the Zn ratio increases, the selectivity for C2H4 increases from 16% (for 50-Pd/ZnO) to ∼95% (for 200-Pd/ZnO), with the conversion of C2H2 retained at almost ∼100%. As the Zn ratio further increases, the conversion is initially maintained at a relatively high level before eventually declining. Then, to explore the intrinsic activity of the series catalysts, we increased the reaction space velocity from 18 000 mL gcat−1 h−1 to 36 000 mL gcat−1 h−1, and lowered the reaction temperature (<20 °C) by air-cooling, at which time the reaction was dominated by the reaction kinetics. Based on the above reaction conditions, the effect of reduction temperature on catalyst activity was investigated. As shown from the experimental results (Fig. S5†), we found that the activity of the catalyst was almost unaffected by the reduction temperature when the reduction temperature was lower than 200 °C; whereas a decrease in the activity of the catalyst occurred only when the reduction temperature was higher than 200 °C. Nonetheless, the conventional issue of the trade-off between catalyst activity and selectivity is not prominent here. Fig. 4b shows that for reactions conducted at all temperatures, the selectivity for C2H4 increases consistently with the Zn ratio, and the decline in conversion lags behind the improvement in selectivity. Notably, the decline in catalyst activity caused by the higher reduction temperature could be compensated for by increasing the reaction temperature. Therefore, for catalysts with different surface Zn ratios, the optimum conversion and selectivity are achieved at different reaction temperatures. As shown in Table S4,† 250-Pd/ZnO achieves ∼98% C2H4 selectivity while maintaining ∼100% C2H2 conversion at 80 °C. The performance of these catalysts reached or even outperformed some of those in the published literature reports (Table S5†).7,36–42 Interestingly, by modulating the surface zinc ratio, we achieved a change in the optimal reaction temperature, which could enable the catalysts to adapt to the individual requirements of different application situations. And more importantly, these data suggest that for each catalyst, there exists a certain temperature range within which the primary effect of the structural alteration would be an improvement in selectivity rather than a decline in conversion. This offers the possibility to deconvolute the effects of the multiple factors causing structural change on catalytic selectivity and activity.
Fig. 4. Catalytic performances in C2H2 hydrogenation for Pd/ZnO catalysts with varying surface Zn ratios. (a) Selectivity for C2H4 and conversion of C2H2 over different Pd/ZnO catalysts; data obtained at 60 °C. (b) Conversion of C2H2 and selectivity for C2H4 over different Pd/ZnO catalysts; data obtained at various reaction temperatures. Reaction conditions: 2% C2H2, 20% H2, Ar balance gas; 0.1 g catalyst; 2 hours; 18 000 mL gcat−1 h−1.
Reaction mechanism of C2H2 hydrogenation
DFT calculations were performed to further unveil the relationship between the surface structures and the catalytic performances of the catalyst series. First, on the basis of the structural characterization results above, we constructed three theoretical models for 50-Pd/ZnO, 150-Pd/ZnO and 300-Pd/ZnO. In heterogeneous catalysis, the adsorption of substrate molecules, the migration of reaction intermediates and the desorption of product molecules are all closely related to the surface microenvironment of the catalyst.1,43 In order to investigate the distribution of optimal adsorption sites on the catalyst surface, we simulated the potential energy surface by employing an H atom as the detector (see the ESI†).44 The potential energy surface was used as the descriptor here, rather than the adsorption energy, as the latter could only reflect the average adsorption strength of substrate molecules on the catalyst surface, whereas the potential energy surface could reflect the alteration in the adsorption configuration of the substrate molecules and the energy barrier for the migration of the active *H intermediates.
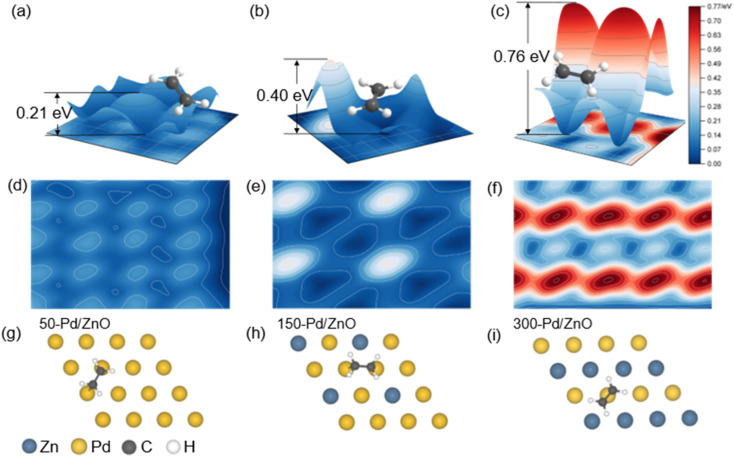
The potential energy surfaces for the catalyst series are shown in Fig. 5. The “peaks” and “troughs” represent the sites of weak and strong adsorption, respectively. The potential energy surface for 50-Pd/ZnO is relatively flat, with a small peak-to-trough difference (0.21 eV, Fig. 5a), and thus C2H2 and C2H4 molecules are adsorbed in a bridge-shaped configuration, with a high degree of freedom. With further introduction of surface Zn atoms, the peak-to-trough difference becomes more pronounced (0.76 eV, Fig. 5c), which results in a decrease in optimal adsorption sites. Therefore, the adsorption configurations of the gas molecules become more “confined”, with a lower degree of freedom.44 This would lead to a lower probability of effective collision between *H and adsorbed C2H2 molecules during the hydrogenation process, thus suppressing over-hydrogenation.21,45,46 More importantly, the regulated potential energy surface displays a “confinement” effect, which alters the adsorption configuration of the substrate molecules.
Fig. 5. The change in the potential energy surface of Pd/ZnO catalysts with varying surface Zn ratios. (a–c) Three-dimensional model of the potential energy surface (g–i). (d–f) Two-dimensional model of potential energy surface (g–i). The adsorption configuration of C2H4 molecules on 50-Pd/ZnO (g), 150-Pd/ZnO (h), and 300-Pd/ZnO (i) catalysts.
As shown in Fig. S6,† C2H2 molecules tend to be adsorbed in a bridged configuration, which is consistent with the results obtained via in situ diffuse reflectance infrared Fourier transform spectroscopy (DRIFTS, Fig. S7†). Such a configuration could allow the C2H2 molecule to form sp3-hybridized C–C bonds with multiple active metal centers.47–49 On the surface of 50-Pd/ZnO, C2H2 would adopt a C2H2Pd3 adsorption configuration, with the C–C bond stretched to 1.363 Å (in contrast to 1.2 Å for gaseous C2H2). However, benefiting from the regulation effect of Zn atoms, the higher peaks in the potential energy surface would hinder the adsorption of C2H2, eventually resulting in a C2H2Pd2 adsorption configuration on the surface of 300-Pd/ZnO, featuring a weakened adsorption, consistent with the DRIFTS data. Also owing to the Zn regulation, the troughs in the potential energy surface of 300-Pd/ZnO become almost “isolated”, and thus cannot support a stable sp3 C2H4Pd2 configuration for the C2H4 molecule (which has a longer C–C bond and a larger size).40,50 As a result, the C2H4 molecule is forced to adopt a C2H4Pd adsorption configuration; the “confinement” effect would destabilize the C2H4 molecule, facilitating its desorption, and thereby effectively improving the selectivity for semi-hydrogenation.
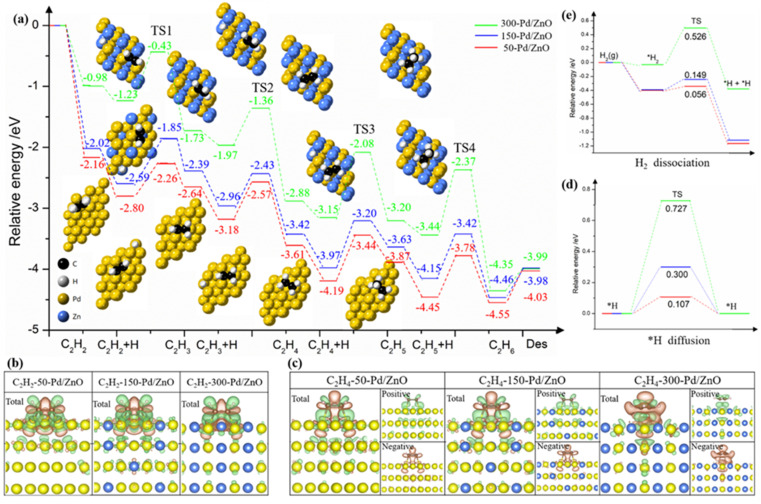
We further performed DFT calculations on the processes of C2H2 semi-hydrogenation (into C2H4) and over-hydrogenation (into C2H6). Fig. 6a shows the energy diagrams and the adsorption configurations of reaction intermediates for 50-Pd/ZnO, 150-Pd/ZnO and 300-Pd/ZnO. The C2H2 hydrogenation proceeds in two consecutive steps. The first step (i.e., from C2H2 to C2H4) is only marginally affected by the above change in the potential energy surface, because the sp-hybridized carbon atoms in C2H2 confer a higher activity to the π bond.1,51 For all three catalysts, the combinations of active *H and *C2H2 or *C2H3 are all exergonic, and the activation energies for the three catalysts only exhibit minor differences. In addition, the results of differential charge analysis directly reveal that with the increase in the surface Zn ratio, the electron transfer to the antibonding orbitals of C2H4 decreased (Fig. 6b and c), thus hampering the activation of C2H4 molecules. The step from C2H4 to C2H5 is the rate-determining step here. For 300-Pd/ZnO, the energy barriers are 1.07 eV (for TS3) and 1.07 eV (for TS4), whereas for 50-Pd/ZnO, the energy barriers are 0.75 eV (for TS3) and 0.68 eV (for TS4). This suggests that for catalysts with higher surface Zn ratios, over-hydrogenation into C2H6 becomes more difficult. In addition, the adsorption of C2H4 on the catalyst surface becomes weakened with the increase in Zn ratio (Fig. S8†). Moreover, for the last step, we calculated the desorption energy of C2H6 for the three catalysts: 0.36 eV for 300-Pd/ZnO, 0.49 eV for 200-Pd/ZnO, and 0.52 eV for 150-Pd/ZnO. These values align with the calculated trend in this study, indicating that the surface potential energy of the 300-Pd/ZnO catalyst exhibits weak adsorption of C2H6, making it more favourable for C2H6 desorption compared to the 150-Pd/ZnO catalyst. All these factors would facilitate the desorption of C2H4 from the catalyst surface into the gaseous phase, and suppress the further activation of C2H4 on Pd active sites and further hydrogenation into C2H5 intermediates, which is consistent with the experimental results described above. In other words, the DFT calculations in Fig. 6a demonstrate that the 300-Pd/ZnO catalyst exhibits superior performance in achieving the highest C2H4 selectivity, surpassing its counterparts of 150-Pd/ZnO and 200-Pd/ZnO catalysts. Moreover, as C2H2 has a high reactivity and a high adsorption energy, it would prevail over C2H4 in competitive adsorption even in the presence of excessive C2H4. To sum up, the energy barrier mismatch between the adsorption–activation step and the hydrogenation step for C2H4 directly suppresses the side reaction of over-hydrogenation. Notably, the results of performance tests (Fig. 4) have revealed that the variation trends for catalytic activity and selectivity are not necessarily “in phase”. Specifically, in our case here, the decline in activity lags behind the increase in selectivity. By further analyzing the potential energy surface (Fig. 5), we found that at a relatively low Zn ratio, the catalyst could retain a significant amount of adsorption sites on the surface, and the negative impact on catalytic activity is only marginal. As the Zn ratio further increases, the areal density of barriers on the potential energy surface becomes higher, with the barrier heights increasing non-linearly. This is because the d band center of the surface Pd atom would shift farther away from the Fermi level as more Zn promoter is introduced (Fig. S9a–c†), and the electron activity of surface Pd atoms would be significantly suppressed. As a result, the potential energy surface would be substantially altered, and the former sites for optimal adsorption would be “squeezed” into isolated troughs (Fig. 5c). This impairs the adsorption and activation of substrate molecules on the catalyst surface (Fig. S8d–f†); more importantly, the elevated peaks in the potential energy surface would constrain the migration of active *H on the catalyst surface. Since *H could facilitate the activation of adsorbed substrate molecules, the energy barrier for *H migration is expected to have a direct impact on the catalytic activity. For 300-Pd/ZnO, the high peaks in the potential energy surface would constrain *H migration, resulting in the highest diffusion barrier (0.727 eV, Fig. 6d). In contrast, the diffusion barrier for 50-Pd/ZnO is 0.107 eV. These aforementioned effects are experimentally reflected in the lower catalytic activity observed for the 300-Pd/ZnO catalyst.
Fig. 6. DFT calculations on Pd/ZnO catalysts. (a) Energy diagrams for the semi-hydrogenation of C2H2 into C2H4 and the further hydrogenation into byproduct C2H6 on the surfaces of 50-Pd/ZnO, 150-Pd/ZnO, and 300-Pd/ZnO catalysts. The horizontal axis shows the reaction intermediates and transition states (TSs), and the vertical axis shows the relative energy of each state. (b and c) Isosurfaces (level 0.005) of charge density differences on Pd/ZnO catalysts with (b) C2H2 and (c) C2H4. (d) Dissociation of H2 and (e) migration of active *H on the surfaces of different Pd/ZnO catalysts.
Then we conducted hydrogen–deuterium (H–D) exchange experiments on the model catalyst series.52,53 As shown in Fig. S10,† with the Zn ratio increasing, the required temperature for H–D exchange increases accordingly, consistent with the theoretical prediction (Fig. 6e). The H–D exchange experiment could not only help assess the catalysts' capabilities of dissociating H2, but could also reveal the migration efficiency of *H over the catalyst surfaces (the effect of the latter has often been overlooked in previous related studies). These results here suggest that the active *H species has to overcome a higher energy barrier so as to migrate over an inert Zn (or Zn-modulated Pd) atom to access an intermediate for hydrogenation. Increasing the reaction temperature could compensate for the negative effect of the high energy barrier for migration, and this could explain the fact that the optimum reaction temperature for different model catalysts increases with the ratio of Zn promoters. In addition, the introduction of Zn promoters alters the potential energy surface, resulting in a unique “confinement” effect, which could negate the effect of increased temperature on facilitating the undesired over-hydrogenation. As a result, the 300-Pd/ZnO catalyst achieved a selectivity for C2H4 that approaches 100% and a C2H2 conversion of ∼100% at reaction temperatures up to 200 °C (Table S4†).
Conclusions
In this paper, by varying the reduction temperature during catalyst preparation, we can control the diffusion of Zn atoms to the Pd particle surface with high precision, and thus continuously regulate their catalytic performances for C2H2 semi-hydrogenation. Combining multiple experimental characterization studies and DFT calculations, we found that the introduction of Zn on the Pd-based catalyst surface could significantly alter the potential energy surface, leading to a “confinement” effect that not only suppresses the over-hydrogenation of C2H2 into C2H6, but also facilitates the desorption of C2H4, thereby optimizing the selectivity for semi-hydrogenation. Moreover, the resulting decline in activity significantly lags behind the improvement in selectivity, and could be compensated for by simply increasing the reaction temperature. Thereby, we confirmed that there are the certain parameter spaces within which the selectivity and activity could be optimized simultaneously, thus avoiding the trade-off between the two aspects (which is often encountered for conventional catalysts). The structure–performance relationship established here, and the potential energy surface as a new descriptor for performance optimization, could offer new perspectives to specifically tune the catalytic performance.
Data availability
Data will be made available on request.
Author contributions
JM: conceptualization, data curation, formal analysis, investigation, methodology, writing – original draft. CY: data curation, investigation, validation, visualization, writing – review & editing. XY: data curation, formal analysis, visualization, writing – review & editing. XP: investigation, resources. SN: data curation, formal analysis, resources. XC: visualization. HL: investigation, resources. HM: investigation, resources. LW: resources, software. CC: conceptualization, funding acquisition, project administration, supervision, writing – review & editing.
Conflicts of interest
There are no conflicts to declare.
Supplementary Material
Acknowledgments
This work was supported by the National Key R&D Program of China (2021YFF0500503), National Natural Science Foundation of China (21925202, U22B2071, and 22208283), Yunnan Provincial Science and Technology Project at Southwest United Graduate School (202302AO370017), and International Joint Mission On Climate Change and Carbon Neutrality. We acknowledge Senior Engineer Wenqing Yao (Analysis Center of Tsinghua University) for technical assistance with the in situ XPS measurements. We thank Wenguan Yu and Peifang Yan (Dalian Institute of Chemical Physics) for chemisorption tests and analyses. And we also thank Chang Wang (Dalian Institute of Chemical Physics) for XRD measurements. We thank Dr Chao. Zhang for help in writing and revising the paper.
Electronic supplementary information (ESI) available. See DOI: https://doi.org/10.1039/d4sc00635f
References
- Takht Ravanchi M. Sahebdelfar S. Komeili S. Rev. Chem. Eng. 2017;34:215–237. doi: 10.1515/revce-2016-0036. [DOI] [Google Scholar]
- Wei S. Li A. Liu J. C. Li Z. Chen W. Gong Y. Zhang Q. Cheong W. C. Wang Y. Zheng L. Xiao H. Chen C. Wang D. Peng Q. Gu L. Han X. Li J. Li Y. Nat. Nanotechnol. 2018;13:856–861. doi: 10.1038/s41565-018-0197-9. [DOI] [PubMed] [Google Scholar]
- Jiao F. Bai B. Li G. Pan X. Ye Y. Qu S. Xu C. Xiao J. Jia Z. Liu W. Peng T. Ding Y. Liu C. Li J. Bao X. Science. 2023;380:727–730. doi: 10.1126/science.adg2491. [DOI] [PubMed] [Google Scholar]
- Zhang J. Sui Z. Zhu Y.-A. Chen D. Zhou X. Yuan W. Chem. Eng. Technol. 2016;39:865–873. doi: 10.1002/ceat.201600020. [DOI] [Google Scholar]
- Ye X. Yang C. Pan X. Ma J. Zhang Y. Ren Y. Liu X. Li L. Huang Y. J. Am. Chem. Soc. 2020;142:19001–19005. doi: 10.1021/jacs.0c08607. [DOI] [PubMed] [Google Scholar]
- Castillejos-López E. Agostini G. Di Michel M. Iglesias-Juez A. Bachiller-Baeza B. ACS Catal. 2016;7:796–811. doi: 10.1021/acscatal.6b03009. [DOI] [Google Scholar]
- Zhou H. R. Yang X. Li L. Liu X. Huang Y. Pan X. Wang A. Li J. Zhang T. ACS Catal. 2016;6:1054–1061. doi: 10.1021/acscatal.5b01933. [DOI] [Google Scholar]
- Hu M. Z. Zhao S. Liu S. Chen C. Chen W. Zhu W. Liang C. Cheong W. C. Wang Y. Yu Y. Peng Q. Zhou K. Li J. Li Y. Adv. Mater. 2018:e1801878. doi: 10.1002/adma.201801878. [DOI] [PubMed] [Google Scholar]
- Glyzdova D. V. Vedyagin A. A. Tsapina A. M. Kaichev V. V. Trigub A. L. Trenikhin M. V. Shlyapin D. A. Tsyrulnikov P. G. Lavrenov A. V. Appl. Catal., A. 2018;563:18–27. doi: 10.1016/j.apcata.2018.06.029. [DOI] [Google Scholar]
- Yang L. N. Guo Y. Long J. Xia L. Li D. Xiao J. Liu H. Chem. Commun. 2019;55:14693–14696. doi: 10.1039/C9CC06442G. [DOI] [PubMed] [Google Scholar]
- Borodziński A. Catal. Lett. 2001;71:169–175. doi: 10.1023/A:1009061916463. [DOI] [Google Scholar]
- Ngamsom B. Bogdanchikova N. Avalos Borja M. Praserthdam P. Chem. Commun. 2004;5:243–248. [Google Scholar]
- Kashiwaba Y. Abe T. Nakagawa A. Niikura I. Kashiwaba Y. Daibo M. Fujiwara T. Osada H. J. Appl. Phys. 2013;113:113501–113505. doi: 10.1063/1.4792941. [DOI] [Google Scholar]
- Yang F. Ding S. Song H. Yan N. Sci. China Mater. 2020;63:982–992. doi: 10.1007/s40843-020-1271-x. [DOI] [Google Scholar]
- Wang Z. Luo Q. Mao S. Wang C. Xiong J. Chen Z. Wang Y. Nano Res. 2022;15:10044–10062. doi: 10.1007/s12274-022-4590-1. [DOI] [Google Scholar]
- Pei G. X. Liu X. Y. Wang A. Lee A. F. Isaacs M. A. Li L. Pan X. Yang X. Wang X. Tai Z. Wilson K. Zhang T. ACS Catal. 2015;5:3717–3725. doi: 10.1021/acscatal.5b00700. [DOI] [Google Scholar]
- Feng J. T. Liu Y. Yin M. He Y. Zhao J. Sun J. Li D. J. Catal. 2016;344:854–864. doi: 10.1016/j.jcat.2016.08.003. [DOI] [Google Scholar]
- Pei G. X. Liu X. Y. Yang X. Zhang L. Wang A. Li L. Wang H. Wang X. Zhang T. ACS Catal. 2017;7:1491–1500. doi: 10.1021/acscatal.6b03293. [DOI] [Google Scholar]
- Xu J. Song Y. Wu H. Liu J. Chin. J. Catal. 2017;38:1549–1557. doi: 10.1016/S1872-2067(17)62899-7. [DOI] [Google Scholar]
- Gu J. Jian M. Huang L. Sun Z. Li A. Pan Y. Yang J. Wen W. Zhou W. Lin Y. Wang H. J. Liu X. Wang L. Shi X. Huang X. Cao L. Chen S. Zheng X. Pan H. Zhu J. Wei S. Li W. X. Lu J. Nat. Nanotechnol. 2021;16:1141–1149. doi: 10.1038/s41565-021-00951-y. [DOI] [PubMed] [Google Scholar]
- Wang S. H. Uwakwe K. Yu L. Ye J. Zhu Y. Hu J. Chen R. Zhang Z. Zhou Z. Li J. Xie Z. Deng D. Nat. Commun. 2021;12:7072. doi: 10.1038/s41467-021-27372-8. [DOI] [PMC free article] [PubMed] [Google Scholar]
- Liu Y. McCue A. J. Miao C. Feng J. Li D. Anderson J. A. J. Catal. 2018;364:406–414. doi: 10.1016/j.jcat.2018.06.001. [DOI] [Google Scholar]
- Ma R. He Y. Feng J. Hu Z.-Y. Van Tendeloo G. Li D. J. Catal. 2019;369:440–449. doi: 10.1016/j.jcat.2018.11.037. [DOI] [Google Scholar]
- Gong T. Huang Y. Qin L. Zhang W. Li J. Hui L. Feng H. Appl. Surf. Sci. 2019;495:143495. doi: 10.1016/j.apsusc.2019.07.237. [DOI] [Google Scholar]
- Gao R. J. Xu J. Wang J. Lim J. Peng C. Pan L. Zhang X. Yang H. Zou J. J. J. Am. Chem. Soc. 2022;144:573–581. doi: 10.1021/jacs.1c11740. [DOI] [PubMed] [Google Scholar]
- Ma J. Xing F. Nakaya Y. Shimizu K. I. Furukawa S. Angew. Chem., Int. Ed. 2022;61:e202200889. doi: 10.1002/anie.202200889. [DOI] [PubMed] [Google Scholar]
- Tseng Y.-H. Lin H.-Y. Liu M.-H. Chen Y.-F. Mou C.-Y. J. Phys. Chem. C. 2009;113:18053–18061. doi: 10.1021/jp905145y. [DOI] [Google Scholar]
- Denton A. R. Ashcroft N. W. Phys. Rev. A. 1991;43:3161–3164. doi: 10.1103/PhysRevA.43.3161. [DOI] [PubMed] [Google Scholar]
- Niu Y. M. Liu X. Wang Y. Zhou S. Lv Z. Zhang L. Shi W. Li Y. Zhang W. Su D. S. Zhang B. Angew. Chem., Int. Ed. 2019;58:4232–4237. doi: 10.1002/anie.201812292. [DOI] [PubMed] [Google Scholar]
- Rameshan C. Stadlmayr W. Weilach C. Penner S. Lorenz H. Havecker M. Blume R. Rocha T. Teschner D. Knop-Gericke A. Schlogl R. Memmel N. Zemlyanov D. Rupprechter G. Klotzer B. Angew. Chem., Int. Ed. 2010;49:3224–3227. doi: 10.1002/anie.200905815. [DOI] [PubMed] [Google Scholar]
- Rameshan C. Weilach C. Stadlmayr W. Penner S. Lorenz H. Hävecker M. Blume R. Rocha T. Teschner D. Knop-Gericke A. Schlögl R. Zemlyanov D. Memmel N. Rupprechter G. Klötzer B. J. Catal. 2010;276:101–113. doi: 10.1016/j.jcat.2010.09.006. [DOI] [PMC free article] [PubMed] [Google Scholar]
- Armbrüster M. Behrens M. Föttinger K. Friedrich M. Gaudry É. Matam S. K. Sharma H. R. Catal. Rev. 2013;55:289–367. doi: 10.1080/01614940.2013.796192. [DOI] [Google Scholar]
- Protasova L. N. Rebrov E. V. Choy K. L. Pung S. Y. Engels V. Cabaj M. Wheatley A. E. H. Schouten J. C. Catal. Sci. Technol. 2011;1:768–777. doi: 10.1039/C1CY00074H. [DOI] [Google Scholar]
- Wang Y. Zhang J. Xu H. Bai X. Chin. J. Catal. 2007;28:234–238. doi: 10.1016/S1872-2067(07)60021-7. [DOI] [Google Scholar]
- Dumbuya K. Denecke R. Steinrück H. P. Appl. Catal., A. 2008;348:209–213. doi: 10.1016/j.apcata.2008.06.037. [DOI] [Google Scholar]
- Armbrüster M. Kovnir K. Behrens M. Teschner D. Grin Y. Schlögl R. J. Am. Chem. Soc. 2010;132:14745–14747. doi: 10.1021/ja106568t. [DOI] [PubMed] [Google Scholar]
- Pei G. X. Liu X. Y. Wang A. Q. Lee A. F. Isaacs M. A. Li L. Pan X. L. Yang X. F. Wang X. D. Tai Z. J. Wilson K. Zhang T. ACS Catal. 2015;5:3717–3725. doi: 10.1021/acscatal.5b00700. [DOI] [Google Scholar]
- Feng Q. C. Zhao S. Wang Y. Dong J. C. Chen W. X. He D. S. Wang D. S. Yang J. Zhu Y. M. Zhu H. L. Gu L. Li Z. Liu Y. X. Yu R. Li J. Li Y. D. J. Am. Chem. Soc. 2017;139:7294–7301. doi: 10.1021/jacs.7b01471. [DOI] [PubMed] [Google Scholar]
- Guo Y. S. Long J. Xia L. X. Li D. Xiao J. P. Liu H. Y. Chem. Commun. 2019;55:14693–14696. doi: 10.1039/C9CC06442G. [DOI] [PubMed] [Google Scholar]
- Huang F. Peng M. Chen Y. L. Cai X. B. Qin X. T. Wang N. Xiao D. Q. Jin L. Wang G. Q. Wen X. D. Liu H. Y. Ma D. J. Am. Chem. Soc. 2022;144(40):18485–18493. doi: 10.1021/jacs.2c07208. [DOI] [PubMed] [Google Scholar]
- Verma R. Tyagi R. Voora V. K. Polshettiwar V. ACS Catal. 2023;13:7395–7406. doi: 10.1021/acscatal.3c00568. [DOI] [Google Scholar]
- Sharma G. Verma R. Masuda S. Badawy K. M. Singh N. Tsukuda T. Polshettiwar V. Nat. Commun. 2024;15(1):713. doi: 10.1038/s41467-024-44954-4. [DOI] [PMC free article] [PubMed] [Google Scholar]
- Liu Q. Yang X. Li L. Miao S. Li Y. Li Y. Wang X. Huang Y. Zhang T. Nat. Commun. 2017;8:1407. doi: 10.1038/s41467-017-01673-3. [DOI] [PMC free article] [PubMed] [Google Scholar]
- Jackle M. Gross A. J. Chem. Phys. 2014;141:174710. doi: 10.1063/1.4901055. [DOI] [PubMed] [Google Scholar]
- Wang Y. F. Huang J. Wang W. Du T. Xie Y. Ma Y. Xiao C. Zhang Z. Zhang D. H. Yang X. Science. 2023;379:191–195. doi: 10.1126/science.ade7471. [DOI] [PubMed] [Google Scholar]
- Shi R. Wang Z. Zhao Y. Waterhouse G. I. N. Li Z. Zhang B. Sun Z. Xia C. Wang H. Zhang T. Nat. Catal. 2021;4:565–574. doi: 10.1038/s41929-021-00640-y. [DOI] [Google Scholar]
- Shaikhutdinov S. Heemeier M. Bäumer M. Lear T. Lennon D. Oldman R. J. Jackson S. D. Freund H. J. J. Catal. 2001;200:330–339. doi: 10.1006/jcat.2001.3212. [DOI] [Google Scholar]
- Morkel M. Rupprechter G. Freund H.-J. Surf. Sci. 2005;588:L209–L219. doi: 10.1016/j.susc.2005.05.037. [DOI] [Google Scholar]
- Valero M. C. Raybaud P. Sautet P. J. Catal. 2007;247:339–355. doi: 10.1016/j.jcat.2007.02.014. [DOI] [Google Scholar]
- Zhou S. Q. Shang L. Zhao Y. Shi R. Waterhouse G. I. N. Huang Y. C. Zheng L. Zhang T. Adv. Mater. 2019;31:e1900509. doi: 10.1002/adma.201900509. [DOI] [PubMed] [Google Scholar]
- Liu Y. W. Wang B. Fu Q. Liu W. Wang Y. Gu L. Wang D. Li Y. Angew. Chem., Int. Ed. 2021;60:22522–22528. doi: 10.1002/anie.202109538. [DOI] [PubMed] [Google Scholar]
- Spanjers C. S. Sim R. S. Sturgis N. P. Kabius B. Rioux R. M. ACS Catal. 2015;5:3304–3315. doi: 10.1021/acscatal.5b00627. [DOI] [Google Scholar]
- Jia Z. Luo S. CCS Chem. 2023;5:1069–1076. doi: 10.31635/ccschem.022.202202476. [DOI] [Google Scholar]
Associated Data
This section collects any data citations, data availability statements, or supplementary materials included in this article.
Supplementary Materials
Data Availability Statement
Data will be made available on request.


