Abstract
In most eukaryotic cells fatty acid synthesis occurs in the cytoplasm as well as in mitochondria. However, the relative contribution of mitochondrial fatty acid synthesis (mtFAS) to the cellular lipidome is ill-defined. Here we show that loss of function of the Drosophila Mitochondria enoyl CoA reductase (Mecr), which is the enzyme required for the last step of mtFAS, causes lethality while neuronal loss leads of Mecr leads to progressive neurodegeneration. We observe a defect in Fe-S cluster biogenesis and increased iron levels in flies lacking mecr leading to elevated ceramide levels. Reducing the levels of either iron or ceramide suppresses the neurodegenerative phenotypes indicating an interplay between ceramide and iron metabolism. Mutations in human MECR cause pediatric-onset neurodegeneration and we show that patient-derived fibroblasts display similar elevated ceramide levels and impaired iron homeostasis. In summary, this study identifies a role of mecr/MECR in ceramide and iron metabolism, providing a mechanistic link between mtFAS and neurodegeneration.
Keywords: mtFAS, lipid metabolism, Fe-S, Drosophila, patient-derived fibroblast, MEPAN syndrome, neurodegeneration
Introduction:
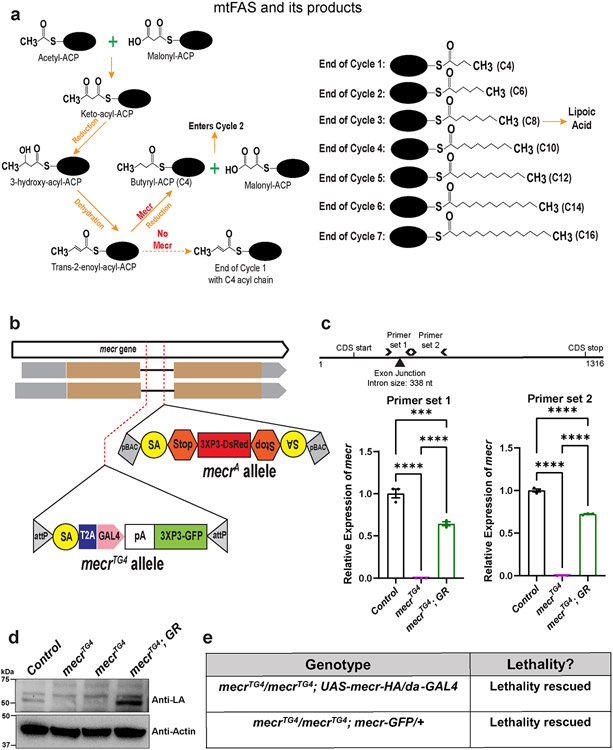
The synthesis of fatty acids in eukaryotic cells relies on two independent pathways. The first operates in the cytoplasm (FAS I) and relies on Fatty Acid Synthase, an enzyme that carries six enzymatic domains for fatty acid synthesis 1,2. The second pathway operates in mitochondria (FAS II/mtFAS) and involves six different enzymes. MECR (Mitochondrial Enoyl CoA Reductase) encodes one of these enzymes which is required for the final step of mitochondrial fatty acid synthesis in humans (Extended Data Fig. 1a).
Since the discovery of mtFAS, its role in cellular growth and differentiation has been documented 3-8. In yeast, loss of ETR, the homolog of human MECR, leads to mitochondrial dysfunction and respiratory growth arrest 7,8. In mice, loss of Mecr is embryonic lethal. However, a Purkinje cell-specific conditional knock-out leads to ataxia in nine months old mice 4,9. In murine C2C12 myoblasts, reduced mtFAS activity impairs their differentiation 6. Recently, bi-allelic mutations in MECR have been shown to cause a pediatric-onset neurodegenerative disorder called MEPAN (Mitochondrial Enoyl Reductase Protein Associated Neurodegeneration; OMIM # 617282) syndrome 10-12. Patients with MEPAN present in early childhood (1-6.5 years) with basal ganglia lesions leading to dystonia, chorea and other movement disorders, followed by progressive optic atrophy and occasional developmental delay. Finally, mtFAS dysfunction has also been implicated in Parkinson’s disease 13,14. Neurological symptoms in MEPAN indicate the importance of mtFAS in neuronal survival and maintenance, and raise an important question: how does mtFAS contribute to neuronal maintenance?
The cytoplasmic fatty acid synthesis pathway produces palmitate (C16) linked to the CoA cofactor, which is used for the synthesis of lipids including phospholipids and sphingolipids. In contrast, mtFAS produces acyl chains of varying carbon length (C4 to C18) linked to mitochondrial Acyl Carrier Protein (mtACP/ACP) 15-18. Lipoic acid, an essential cofactor for multiple mitochondrial enzymes 19 is derived from octanoyl (C8)-ACP 17,20. However, the role of the other Acyl-ACPs in lipid synthesis is not well defined. Indeed, the consequences of impaired mtFAS on the cellular lipidome have remained elusive based on studies in yeast, Neurospora, and mammalian cell lines 6,21-23. For example, loss of Mecr in murine C2C12 myoblast cells was reported to not affect any major cellular phospholipids 6. However, a reduction of mtACP caused decreased levels of lysophospholipids and sphingolipids in HeLa cells 23. In contrast, in Neurospora crassa, mtACP mutants displayed an increase in mitochondrial lysophospholipid levels 21. In Trypansosoma brucei, RNAi mediated knockdown of mtACP decreased the phosphoinositides and phosphoethanolamine levels but it did not alter sphingomyelin levels 22. Finally, upon loss of mtACP in yeast, no major difference in mitochondrial lipids and fatty acids was noted 21. Given that many enzymes and enzymatic products are involved in mtFAS, loss of any of the six genes in the pathway may cause different phenotypic signatures. Additionally, the phenotypic differences may arise because the above-mentioned studies were carried out using different model systems in different culture conditions, at different time points and with alleles of different strength.
To explore the molecular consequences of impaired mtFAS, we studied the effects of mecr/MECR loss in fruit flies and fibroblasts from MEPAN patients. Loss of mecr in flies causes larval lethality and the neuron specific loss/reduction of mecr progressively impairs locomotion, synaptic transmission, and phototransduction in adult flies. Surprisingly, mecr loss results in elevated ceramide levels in flies. Similarly, fibroblasts derived from individuals with MEPAN also display elevated levels of ceramide. This increase in ceramide in flies and in human cells is associated with a defect in iron-sulfur (Fe-S) cluster synthesis and iron metabolism. Importantly, these defects are rescued by lowering the levels of either ceramide or iron indicating an interrelationship between the two metabolic pathways. In summary, our study identifies an evolutionarily conserved role of Mecr/MECR/mtFAS in ceramide and iron metabolism that underlies the demise of neurons.
Results:
Human MECR can functionally replace fly mecr
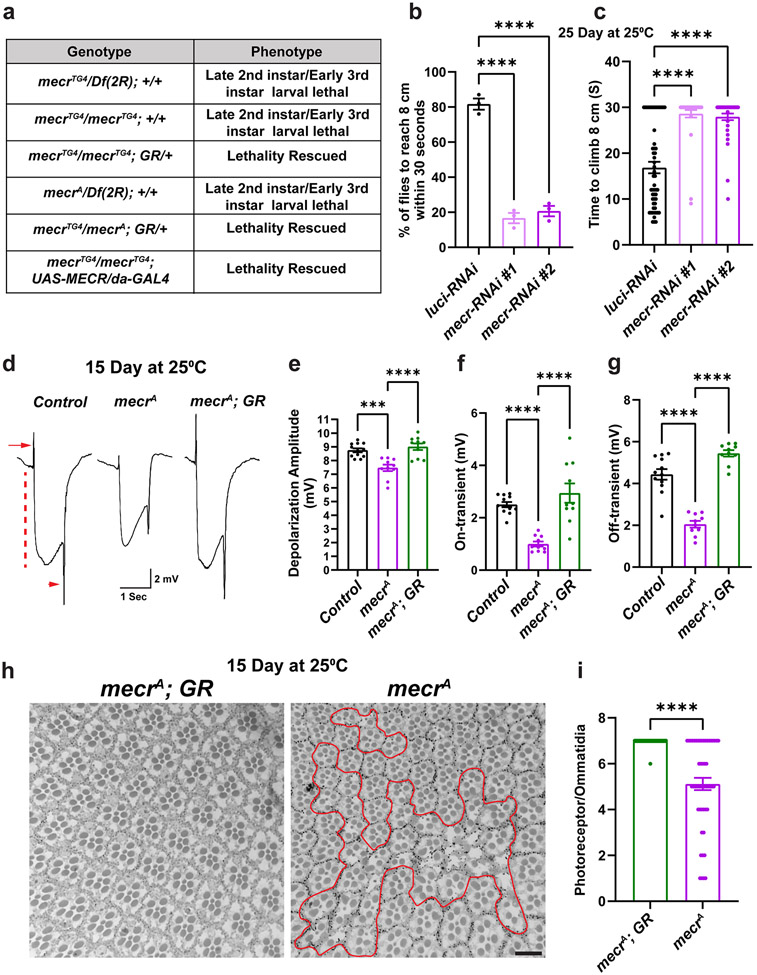
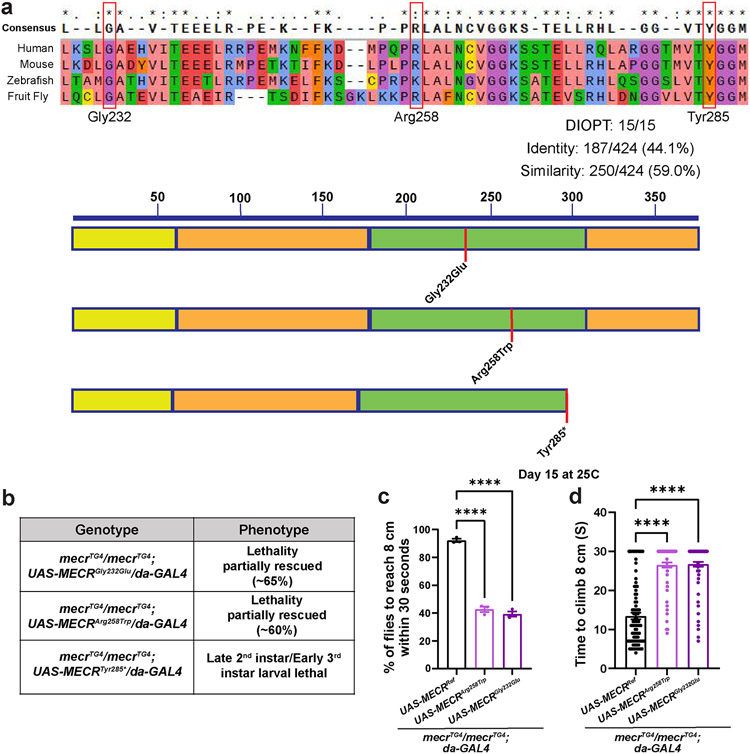
Since human MECR is required for the last step of mtFAS (Extended Data Fig. 1a), we evaluated the consequences of the loss of mtFAS in fruit flies by targeting CG16935/mecr, an as-yet uncharacterized gene in flies that encodes the Mecr protein. We used CRISPR mediated homologous recombination to generate a strong loss-of-function allele (mecrTG4). An artificial exon encoding a Splice-Acceptor-T2A-GAL4-polyA construct was introduced in the coding intron (an intron present between two exons that encode a portion of the protein) of the gene (Extended Data Fig. 1b) 24. The polyA signal arrests transcription causing the endogenous fly mRNA to be truncated. Hence, T2A-GAL4 alleles are typically strong loss-of-function mutations 25. Indeed, in our Real-time PCR data using two independent primer sets, we detected no mecr transcript in the mecrTG4 mutants (Extended Data Fig. 1c). We also used another insertion allele, mecrA, in which a PiggyBac transposon which contains an artificial exon that introduces a STOP codon is inserted in the coding intron (Extended Data Fig. 1b) 26. mecrA and mecrTG4 alleles are homozygous and transheterozygous lethal. Moreover, mecrTG4 or mecrA over a molecularly defined deficiency (Df(2R)BSC307/CyO) that uncovers mecr causes lethality (Fig. 1a), showing that the lethality is due to loss of mecr function. All homozygous and transheterozygous animals die as late 2nd instar/early 3rd instar larvae suggesting that mecrTG4 and mecrA are strong loss-of-function alleles. Consistent with previous findings in yeast and human cells, we noted an impaired lipoic acid production upon mecr loss (Extended Data Fig. 1d). A genomic duplication construct that harbors the mecr coding and regulatory region (Genomic rescue construct, GR) (P[acman] CH321-09M04) 27 as well as expression of the fly cDNA using the ubiquitous daughterless (da)-GAL4 fully rescue the lethality (Fig. 1a and Extended Data Fig. 1e), showing that the phenotypes associated with mecrTG4 are due to loss of mecr function. The fly Mecr protein is 44% identical to and shares 59% similarity with the human MECR protein with a 15/15 DIOPT score 28,29. Moreover, all the amino acids that have missense variants in MEPAN patients are conserved in the fly protein (Extended Data Fig. 2a). Importantly, the reference human MECR cDNA rescues the lethality of homozygous mecrTG4 mutants showing functional conservation (Fig. 1a). The previously reported human MECR nonsense variant, MECRTyr285*, failed to rescue lethality whereas two missense variants, MECRGly232Glu and MECRArg258Trp partially rescue lethality (Extended Data Fig. 2b). The flies rescued with these pathogenic variants show an age-related climbing defect indicative of neurodegeneration (Extended Data Fig. 2c-d). These and other data10 argue that MEPAN patients typically carry one strong and one weak hypomorphic alleles. In summary, mecr encodes an essential protein that is functionally conserved between flies and humans.
Figure 1: Loss of mecr causes an age-dependent locomotor impairment, ERG defects and photoreceptor loss.
(a) Phenotypes of mecr mutants and complementation with an 80 kb P[acman] rescue construct (GR)27 containing the mecr gene or ubiquitous expression of human MECR. (b-c) Climbing ability of 25-day-old flies upon neuronal knockdown (by elav-GAL4) of mecr with two independent RNAi lines. (b) Percentage of 25-day-old flies that are able to climb 8 cm within 30 seconds. Each dot represents the percentage of flies from three independent experiments. (c) Average time taken by 25-day-old flies to climb 8 cm. Each dot represents the time taken by one fly in each of the three independent experiments. Note that if the flies are unable to climb 8cm within the given time, we record them at the 30 sec, and these flies are poor performers. n = 54 (luci-RNAi), n = 35 (mecr-RNAi #1), n= 46 (mecr-RNAi#2) flies. (d) ERG traces of controls and mecrA mutant clones of 15-day-old flies. ERG recordings are induced by a light pulse and exhibit “on” and “off” transients (arrow and arrowhead), indicative of synaptic communication between the PR neurons and postsynaptic cells. They also exhibit a decreased amplitude which corresponds to the depolarization of PR neurons (dashed line). (e-g) Quantification of depolarization amplitude as well as “on” and “off” transients for the respective genotypes. Each dot represents the data from one fly. n = 12 (Control), n = 10 (mecrA and mecrA; GR) flies. (h) Retinal sections and (i) quantification of PRs per ommatidium from control and mecrA mutant clones in 15-day-old flies. The scale bar is 10 μm. The red line marks the mutant clone area. In i, each dot represents the data from the retinal sections of flies. n = 51 ommatidia from at least 5 independent samples. All the flies were maintained at 25°C. For statistical analyses between two samples, two-tailed Student’s t test, and for three samples, one-way ANOVA followed by a Tukey’s post-hoc test are carried out. Error bars represent SEM (***p < 0.001; ****p < 0.0001).
Neuronal knockdown of mecr induces age-dependent climbing defects
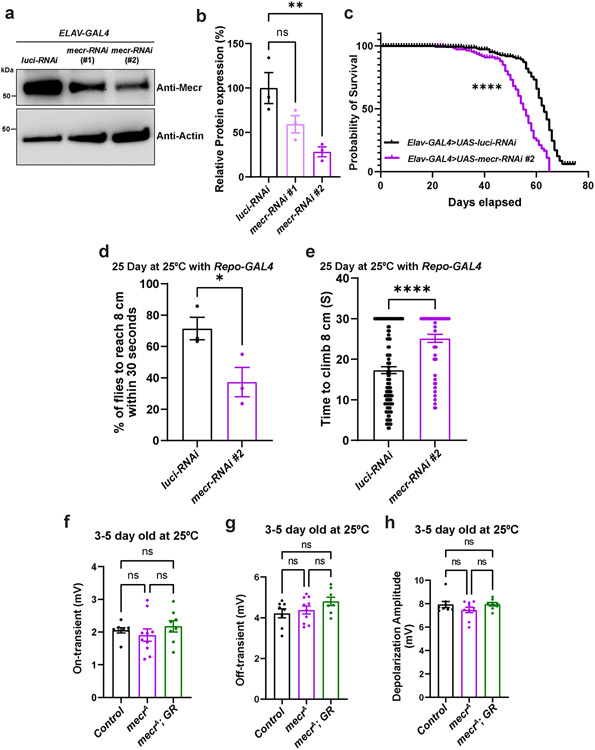
Given the lethality associated with the loss of mecr, we evaluated the effects of neuronal knockdown of mecr on locomotor ability of aged flies. We used the pan-neuronal driver, elav-GAL4 (GAL4 is a transcriptional activator that binds to Upstream Activation Sequence(s) (UAS) to drive expression of any gene downstream of the UAS sequence) to perform RNAi-mediated knockdown of mecr in neurons. We used two independent RNAi lines which reduce the levels of Mecr protein by ~45% (RNAi#1) and ~75% (RNAi#2) (Extended Data Fig. 3a-b) at 25°C. Although neuronal knock-down of mecr does not cause obvious climbing defects in young flies (3 days post-eclosion), a significant impairment in climbing was observed in aged flies (25-days post-eclosion) (Fig. 1b-c). Compared to control flies, where ~ 80% flies climb to 8 cm within 30 seconds, only ~20% of flies with neuronal mecr knock-down were able to climb to 8 cm at day 25 (Fig. 1b). The average climbing time was also significantly increased in these flies compared to age-matched control flies (Fig. 1c). Since the RNAi#2 was more efficient in the knockdown efficiency, we used RNAi#2 for the remaining experiments. We also noted a mild but significant lifespan reduction in these flies with neuronal mecr knock-down with RNAi #2 when compared to controls (Extended Data Fig. 3c). In addition, glial knock-down also resulted in an age-depending climbing defect (Extended data Fig. 3d-e), but the effects were comparatively less when compared to the neuronal knockdown of mecr (Fig. 1b and c). These results indicate an age-dependent loss of neuronal function when mecr levels are reduced. In summary, neuronal knockdown of mecr causes a progressive loss of motor function.
Loss of mecr causes the demise of photoreceptor neurons
To evaluate the impact of mecr loss on phototransduction and synaptic transmission, we performed electroretinograms (ERG). Given that mecr mutants are homozygous lethal, we generated mutant clones in the eye using the Flp-FRT system (FRT42B mecrA / FRT42B Ubi-GFPnls; ey-Flp/+) 30,31 and performed ERGs by placing the electrode in the mutant eye clones. In young flies (3-5 days old), we did not observe any difference in ERG traces between mutant and control tissue (Extended Data Fig. 3f-h). However, 15-day-old flies exhibit decreased phototransduction amplitudes indicating a reduced ability of photoreceptors (PRs) to sense light (Fig. 1d-e). Moreover, the ERG traces also exhibit reduced ON and OFF transients, suggesting a defect in synaptic communication between the photoreceptors and the postsynaptic neurons (Fig. 1f-g). To determine if PR morphology is affected in mecr mutant clones, we imaged 15-day old retinas. As shown in Fig. 1h-i, many ommatidia exhibit an aberrant morphology with fewer PR neurons in the mutant clones. Hence, there is a progressive loss of neuronal function and photoreceptors upon loss of mecr.
mecr encodes a mitochondria-localized protein in fruit fly
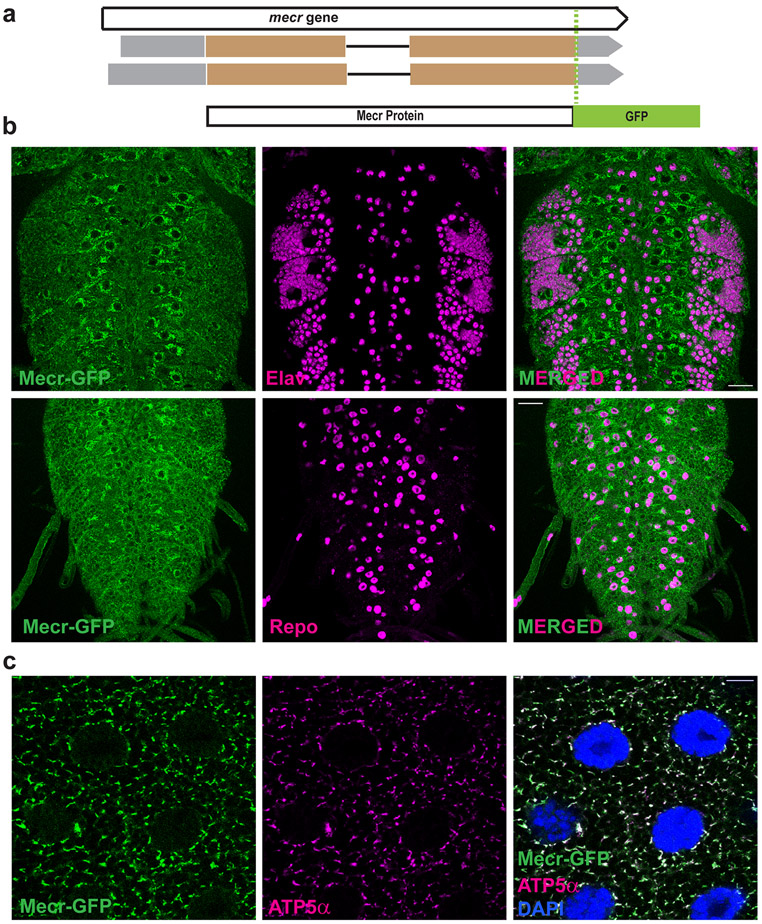
The expression of the gene and the subcellular localization of Mecr protein in vivo has not been determined previously in multicellular organisms. As shown in Extended Data Fig. 4a and b, mecr is broadly expressed on the larval and adult CNS. In yeast, the Etr protein was reported to be predominantly localized in the nucleus 32. However, upon overexpression of the gene, the protein was also shown to localize to mitochondria 8. Other overexpression studies in HeLa cells, indicated that Mecr was localized to mitochondria, cytoplasm, as well as nuclei 3,33-35. To determine the endogenous subcellular localization of Mecr protein in fruit fly, we used a genomic rescue construct of mecr that is tagged with a C-terminal GFP (CBGtg9060C0290D) 36 (Fig. 2a). Importantly, this tag does not disrupt the function of mecr as it rescues the lethality of mecr mutants, and the rescued flies appear healthy with no obvious phenotypes (Extended Data Fig. 1e). Interestingly, we observe a higher expression level of this protein in some glial subsets when compared to neurons in the larval brain (Fig. 2b). Staining with antibodies against GFP and ATP5α, an inner mitochondrial membrane protein 37,38 shows that Mecr localizes to mitochondria in multiple larval tissues (Fig. 2c & Extended Data Fig. 4c). To determine the localization of human MECR protein, we expressed the human gene with the actin-GAL4 driver in S2 cells, stained with an antibody against MECR (AB_1853714), and observed mitochondrial co-localization of MECR and ATP5α (Extended Data Fig. 4d). In summary, fly and human Mecr/MECR proteins are localized to mitochondria.
Figure 2: Mecr is enriched in a subset of glial cells in larval brain and is present in mitochondria in salivary glands.
(a) Schematic diagram showing the mecr-GFP transgene (Fosmid clone, CBGtg9060C0290D)36 used in this study. (b) Expression of Mecr-GFP in Elav-positive neuronal and Repo-positive glial cells of the 3rd instar larval brain. Scale bar: 25 μm. (c) Salivary gland cells from 3rd instar larva and colocalization of Mecr-GFP with ATP5α, an inner mitochondrial membrane protein, Scale bar: 10 μm. All experiments were carried out at least 2 times.
Loss of Mecr/ MECR leads to ceramide accumulation
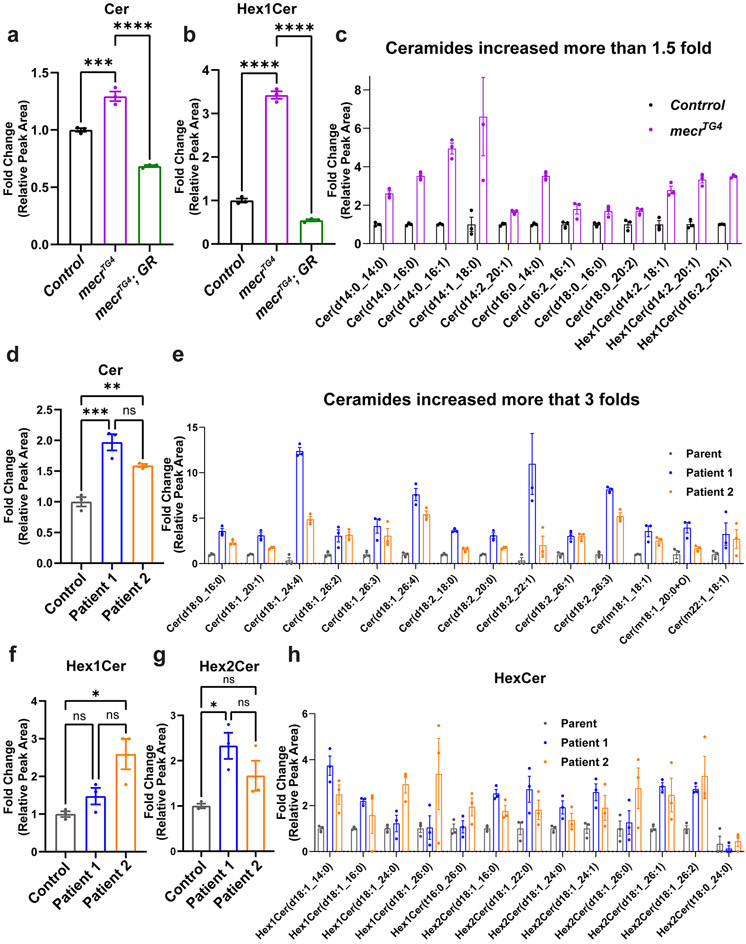
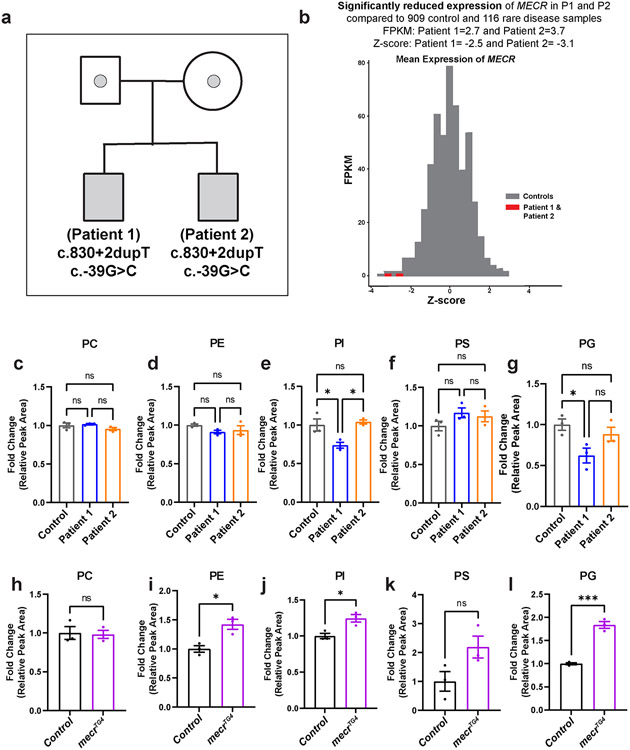
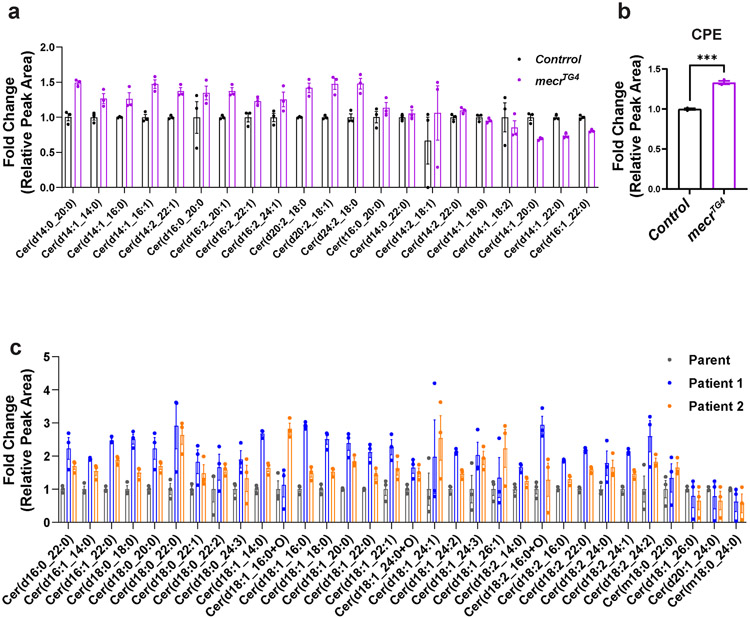
Given that loss of MECR affects mtFAS, we assumed that loss of mecr or MECR would reduce at least some of the lipids of the cell. We performed a comparative lipidomic analysis using mecrTG4 homozygous mutant larvae and human patient-derived fibroblasts. We used fibroblasts derived from two MEPAN patients (Patient 1 and Patient 2, Siblings) and their healthy parent (Extended Data Fig. 5a) identified through the Undiagnosed Diseases Network 39. Both individuals carry variants that lead to a significant reduction in MECR transcript levels (Extended Data Fig. 5b) and have developmental delay, movement disorders and hypotonia. An untargeted lipidomic approach was taken to measure the major phospholipid and sphingolipid species. In mecr fly mutants, we observed increased levels of some phospholipids including phosphatidylethanolamine (PE), phosphatidylinositol (PI) and phosphatidylglycerol (PG) but no significant change in phosphatidylcholine (PC) and phosphatidylserine (PS) levels (Extended Data Fig. 5h-l). However, we did not observe any significant alterations in the levels of PC, PE, PS and minor differences for PI and PG in patient-derived fibroblasts (Extended Data Fig. 5c-g) mostly consistent with the murine C2C12 cells with a known defect in mtFAS 6. In contrast, the levels of ceramides, a subclass of sphingolipids, were significantly elevated in the mecr mutants as well as in MEPAN patient-derived fibroblasts (Fig. 3a and d). In summary, none of the lipids based on lipidomics assays are decreased. Rather, we observe a systematic increase in ceramides.
Figure 3: Loss of mecr/MECR leads to an increase in ceramide levels.
(a-c) Relative amounts of ceramides and hexosylceramides in mecrTG4 mutants. The dots represent values of technical replicates from one set of biological replicates (n = 350 2nd instar larva). (d-e) Relative amounts of ceramides in fibroblasts from patients. (f-h) Relative amount of hexosylceramides in patient-derived fibroblasts. The dots represent values of technical replicates from one set of biological replicates. For statistical analyses, one-way ANOVA followed by a Tukey’s post-hoc test is carried out. Error bars represent SEM (*p < 0.05; **p < 0.01; ***p < 0.001; ****p < 0.0001).
Ceramides are a central hub for sphingolipid metabolism and are responsible for the production of glucosylceramide as well as galactosylceramide, collectively referred to as hexosylceramides (HexCer) 40,41. The levels of ceramides (including HexCer species) are significantly increased in the mecrTG4 mutants compared to animals carrying a genomic rescue construct or yw controls (Fig. 3a-b). 25 out of 33 ceramide species analyzed, including HexCer, as well as the CPE levels were increased in fly mutants (Fig. 3c and Extended Data Fig. 6a-b). In patient-derived fibroblasts, the total levels of ceramides are increased about two-fold when compared to control fibroblasts (Fig. 3d). Out of 46 ceramide species analyzed, 43 are increased in fibroblasts from both patients (Fig. 3e and Extended Data Fig. 6c). Interestingly, some of the ceramide species (d18:1_24:4, d18:1_26:4, d18:2_22:1, and d18:2_26:3) are increased ten-fold or more in patient 1. The levels of Hex1Cer (a Ceramide with one sugar) and Hex2Cer (a Ceramide with two sugars) are also elevated in cells from both patients. However, Hex1Cer reaches a statistical significance level in patient 1 while Hex2Cer reaches a statistical significance level in patient 2 (Fig. 3f-g). Indeed, 12 out of 13 HexCer species analyzed were increased in the patient fibroblasts when compared to the parent control (Fig. 3h). In summary, we observe a significant increase of ceramides upon loss of mecr/MECR in fly mutants and human patient cells, suggesting a conserved role for this protein in ceramide metabolism.
Reducing ceramide levels alleviate neurodegeneration in adult flies
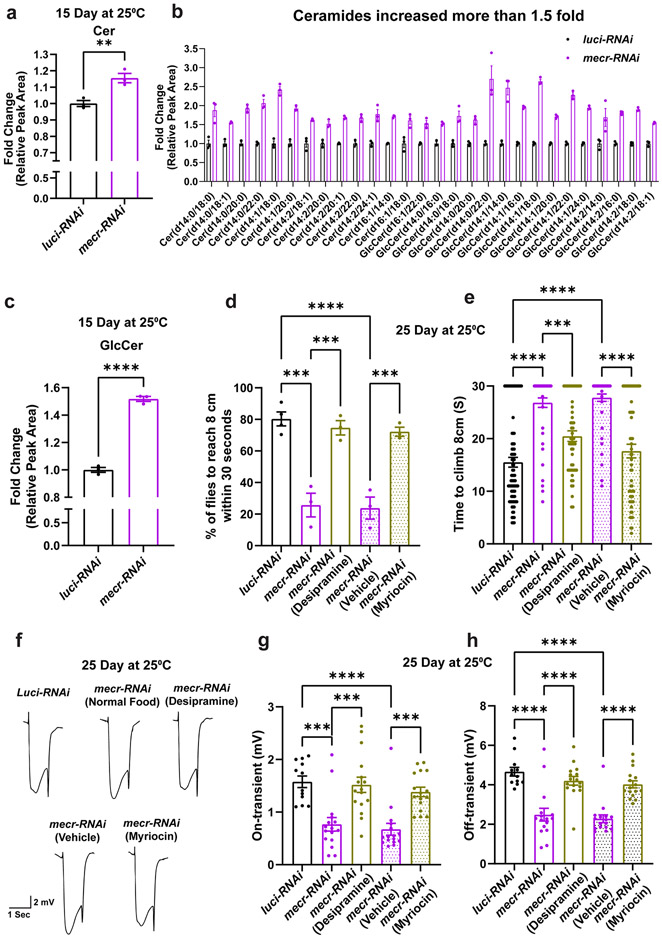
The availability of drugs that reduce ceramide levels provides an opportunity to lower ceramides and assess their effect on the neurodegenerative phenotypes in vivo. We first assessed ceramide levels by performing lipidomic analyses in 15-day-old (prior to the onset of neurodegeneration) adult fly heads upon neuronal knockdown of mecr. As shown in Fig. 4a-c, ceramides as well as HexCer/GlcCers (glucosylceramide) were significantly increased. Out of 63 ceramide species analyzed, 48 species were increased. We treated these flies with myriocin, to reduce the enzymatic activity of Serine Palmitoyl Transferase (SPT), which acts in the rate-limiting step of the de novo ceramide synthesis 43. Additionally, we treated the flies with desipramine, which reduces the enzymatic activity of the lysosomal sphingomyelinases and suppress the production of ceramides through the salvage pathway in lysosomes 44. Upon treatment with either of these drugs, the climbing ability was significantly improved in 25-day-old flies (>70% flies) (Fig. 4d-e). We observed a similar improvement in ERGs in 25-day-old flies. Treatment with either of these drugs also alleviates the synaptic transmission defects upon neuronal knockdown of mecr (Fig. 4f-h). In summary, decreasing ceramide levels is beneficial for neuronal function when mecr levels are reduced.
Figure 4: Reducing Ceramide levels alleviates the age dependent phenotypes in fruit fly.
(a-c) Relative amounts of ceramides and glucosylceramides in fly heads with neuronal knockdown of mecr. The dots represent values from technical replicates. n = 100 fly heads. (d-e) Average percentage of flies climbing 8 cm and climbing time of flies with and without Myriocin and Desipramine treatment. In d, each dot represents the percentage of flies from three independent experiments, and in e, each dot represents the time taken by one fly in three independent experiments. n = 84 (luci-RNAi), n = 51 (mecr-RNAi), n = 51 (mecr-RNAi with Desipramine), n = 51 (mecr-RNAi with Vehicle), n = 57 (mecr-RNAi with Myriocin) flies. (f-h) ERG traces and quantification showing the effects of Myriocin and Desipramine treatment on 25-day-old flies with neuronal knockdown of mecr. For g-h, each dot represents the data from one fly. n = 12 (luci-RNAi), n = 16 (mecr-RNAi, mecr-RNAi (Desipramine), mecr-RNAi (Vehicle), mecr-RNAi (Myriocin) flies. For statistical analyses between two samples, two-tailed Student’s t test, and for three samples, one-way ANOVA followed by a Tukey’s post-hoc test are carried out. Error bars represent SEM (**p < 0.01; ***p < 0.001; ****p < 0.0001).
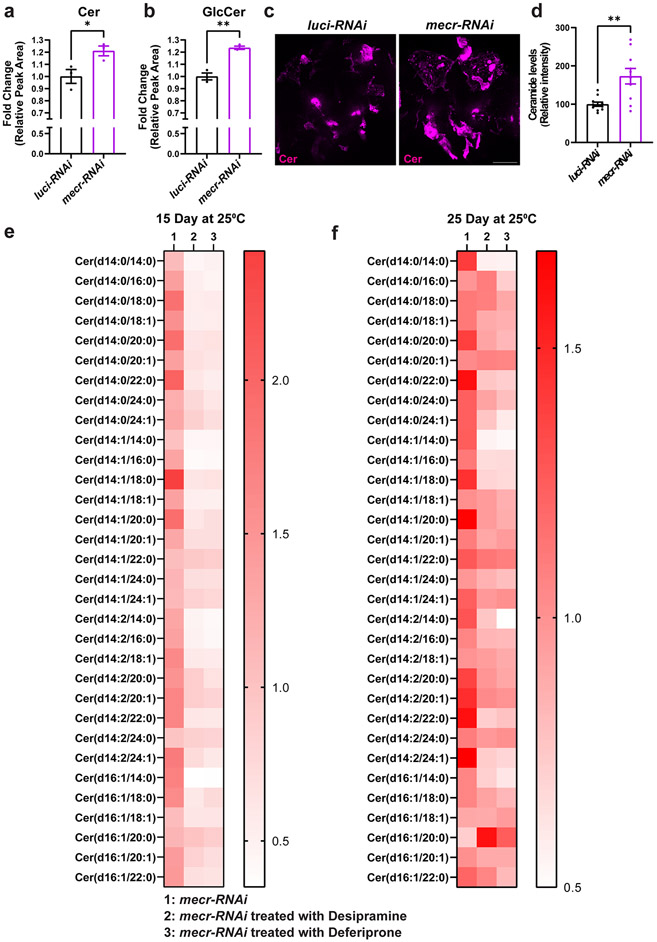
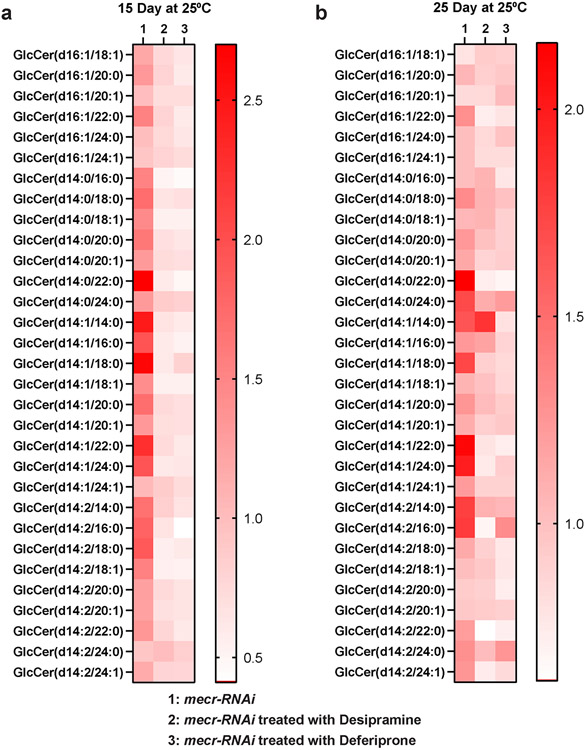
We also noted an increase in ceramides and GlcCer levels in 25 days old fly heads with mecr knockdown by lipidomic analyses (Fig. 5a-b) as well as by using an antibody against ceramides (MID 15B4)42 (Fig. 5c-d). To assess if Desipramine leads to a reduction in ceramides in fly heads upon neuronal knockdown of mecr we performed lipidomic analyses. As shown in Fig. 5e-f, and Extended Data Fig. 7a-b, this treatment effectively reduced the ceramide and glucosylceramide levels in 15 day-old as well as in 25 day-old fly heads. Hence, the phenotypic suppression of loss of mecr correlates with the observed reduction in ceramides.
Figure 5: RNAi-mediated knockdown of mecr elevates ceramide levels which are lowered upon treatments with Desipramine or Deferiprone.
(a-b) Graph showing relative levels of ceramide and glucosylceramide in 25-day-old brains upon neuronal knockdown (by elav-GAL4) of mecr. The dots represent values from technical replicates. n = 100 fly heads. (c) Ceramide levels in 25-day-old brains. Scale bar 100μm. (d) Quantification of relative ceramide intensity in 25-day-old brains upon neuronal knockdown (by elav-GAL4) of mecr. Each dot represents the data from one adult heads (n = 11 and 10 biologically independent samples from luci-RNAi and mecr-RNAi, respectively). (e-f) Graphs showing the relative changes in different ceramide species upon treatment with Desipramine (2) and Deferiprone (3). Each square indicates the average value from three technical replicates. For statistical analyses between two samples, two-tailed Student’s t test is carried out. Error bars represent SEM (*p < 0.05; **p < 0.01).
Loss of mecr/MECR affects mitochondrial function and morphology
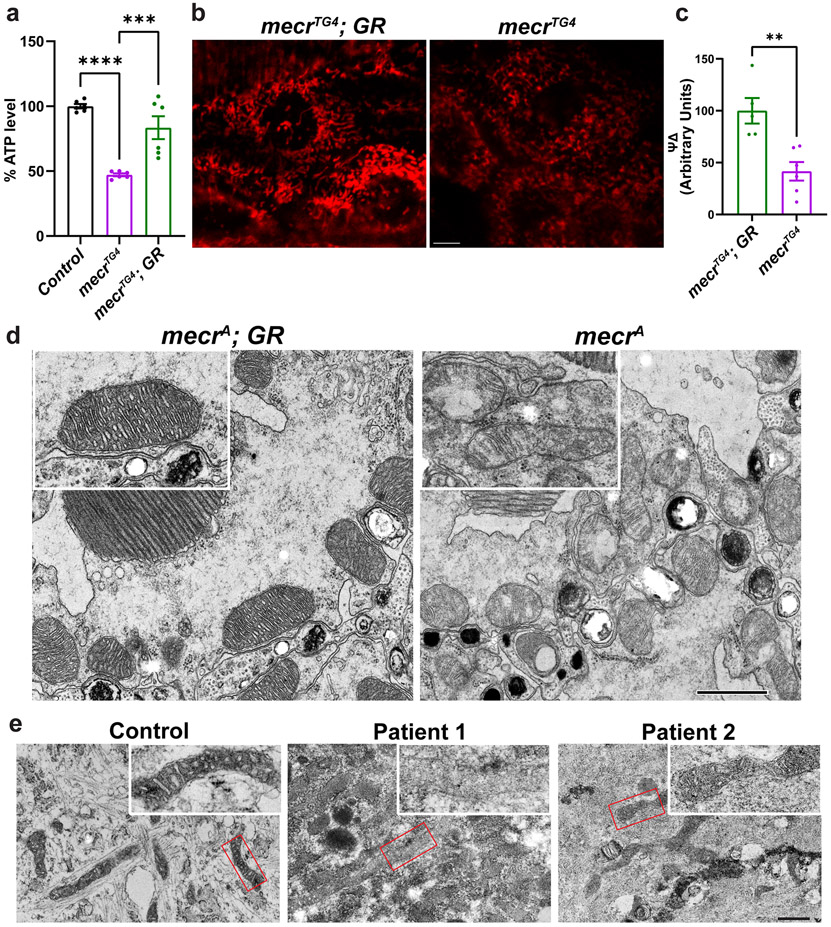
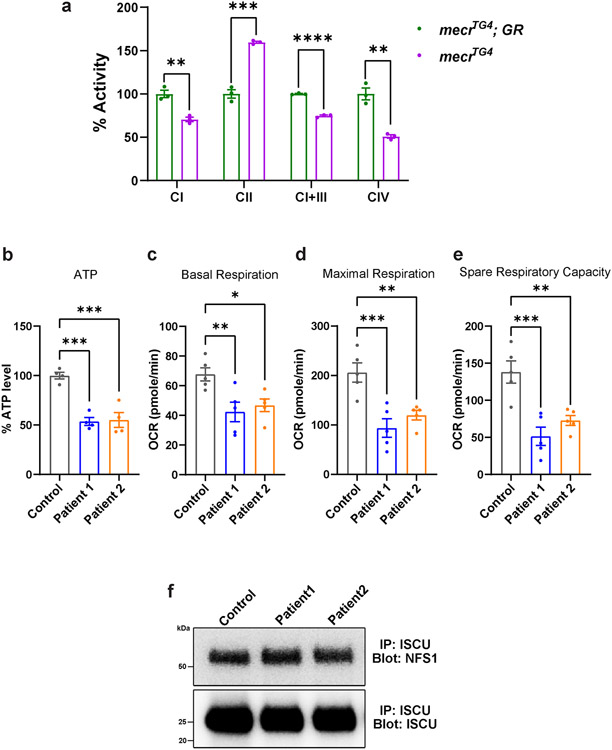
To evaluate the mitochondrial function in mecr mutant larvae, we measured ATP production 45-47. Loss of mecr reduces ATP production by ~50% when compared to controls (Fig. 6a). Given that impaired ATP production can be associated with loss of mitochondrial membrane potential 48, we assessed mitochondrial membrane potential in larval muscles by using tetramethylrhodamine ethyl ester (TMRE) 49. TMRE is a positively charge molecule which is targeted to the mitochondrial matrix, which is negatively charged. When the mitochondrial membrane potential is reduced, it leads to a reduction in the intensity of staining. Homozygous mecrTG4/TG4 larval mutant muscles show a significant decrease in mitochondrial membrane potential (Fig. 6b-c). Finally, we assessed the activity of the various electron transport chain (ETC) enzyme complexes in homozygous mecrTG4 second instar larvae and observed reduced activity of Complex-I, I+III and IV and increased activity of Complex-II (Extended Data Fig. 8a). Additionally, we assessed the mitochondrial morphology in photoreceptor neurons of mecr mutant clones through transmission electron microscopy (TEM). The mitochondria in these neurons are less electron-dense and display a severe disruption of cristae (Fig. 6d). In summary, these data show a severe dysfunction of mitochondria associated with loss of mecr and morphological impairment of neuronal mitochondria when mecr is lost in eye clones.
Figure 6: Loss of mecr/MECR impairs mitochondrial function and morphology.
(a) Relative levels of ATP in mecrTG4 mutants and controls. Each dot represents the values of replicates from two independent experiments using 25 2nd instar larva. (b) Levels of mitochondrial membrane potential as measured by TMRM in larval muscle. Scale bar is 5 μm. (c) Graph showing relative quantification of TMRE. Each dot represents the data from one larva (n = 5 and 6 biologically independent samples from mecrTG4; GR and mecrTG4, respectively). (d) Transmission Electron micrographs showing mitochondrial morphology in photoreceptor neurons of 15-day-old flies. Inset: Single mitochondrion showing the extent of severity in mitochondrial morphology in mecr mutant clones (right) compared to control (left). Scale bar is 0.8 μm. At least six flies from two independent experiments were used for TEM imaging. (e) Transmission Electron micrographs showing mitochondrial morphology in control and MEPAN patient derived fibroblasts. Inset: Enlarged area from the indicated regions shown in e. Scale bar 0.6 μm. Cells from two plates for each patient were used for TEM imaging. For statistical analyses between two samples, two-tailed Student’s t test, and for three samples, one-way ANOVA followed by a Tukey’s post-hoc test are carried out. Error bars represent SEM (**p < 0.01; ***p < 0.001; ****p < 0.0001).
We then assessed the mitochondrial activity in fibroblasts from MEPAN patients. The ATP levels are decreased in the fibroblasts of the affected patients by ~50% when compared to the parent control (Extended Data Fig. 8b). Previously, the oxygen consumption rate was measured in fibroblasts from three patients, and a mild and variable reduction in a subset of respiratory parameters was noted 10. We assessed basal respiration, maximal respiration and spare respiratory capacity using Seahorse assays 50 in fibroblasts from the patients and the parental control. As shown in Extended Data Fig. 8c-e, all were significantly reduced in both patients when compared to the parental fibroblasts. These data are consistent with Seahorse assays performed on mice C2C12 cells compromised in mtFAS 6. We also evaluated the mitochondrial morphology in patient-derived fibroblasts through transmission electron microscopy. The electron density of mitochondria is significantly reduced, and the morphology of mitochondria is impaired in fibroblasts from both patients (Fig. 6e). The fibroblasts from patient 1 are more severely affected than those of patient 2 (Fig. 6e). In summary, our data show that mecr/MECR is required for proper morphology and bioenergetic functions of mitochondria in fruit flies and human cells.
Loss of Mecr impairs iron metabolism
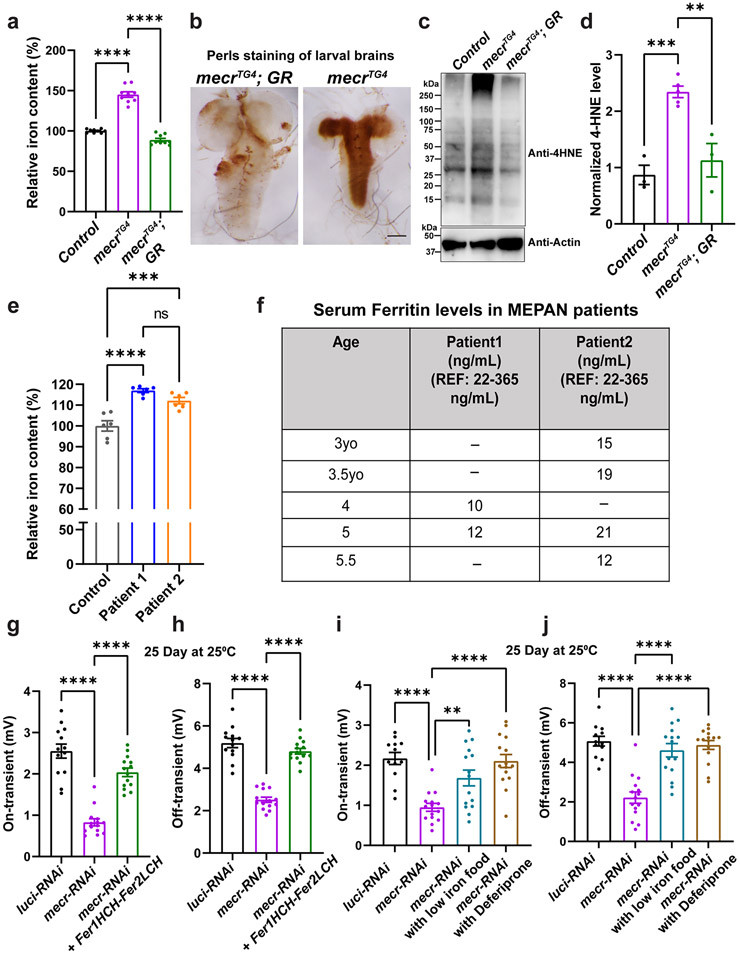
Next, we attempted to determine the molecular mechanism by which the loss of Mecr affects ceramide levels. An increase in ceramides levels can occur when: i) the de novo synthesis of ceramides is increased in the ER 51,52, ii) the salvage pathway is activated in lysosomes44, or iii) iron metabolism is impaired in mitochondria 53-55. Previously, we discovered that loss-of-function mutation in Frataxin, a mitochondrial protein required for Fe-S cluster assembly 56, leads to increased iron levels and accumulation of ceramides 53,54. This prompted us to test iron levels in the fly mecr mutants. A ferrozine-based colorimetric assay revealed an increased level of iron upon loss of mecr in flies when compared to controls (Fig. 7a). Additionally, DAB-enhanced Perls staining 53,54,57 revealed an iron accumulation in the brain neuropils in two-day old mutant larvae (Fig. 7b).
Figure 7: Loss of mecr/MECR impairs iron metabolism.
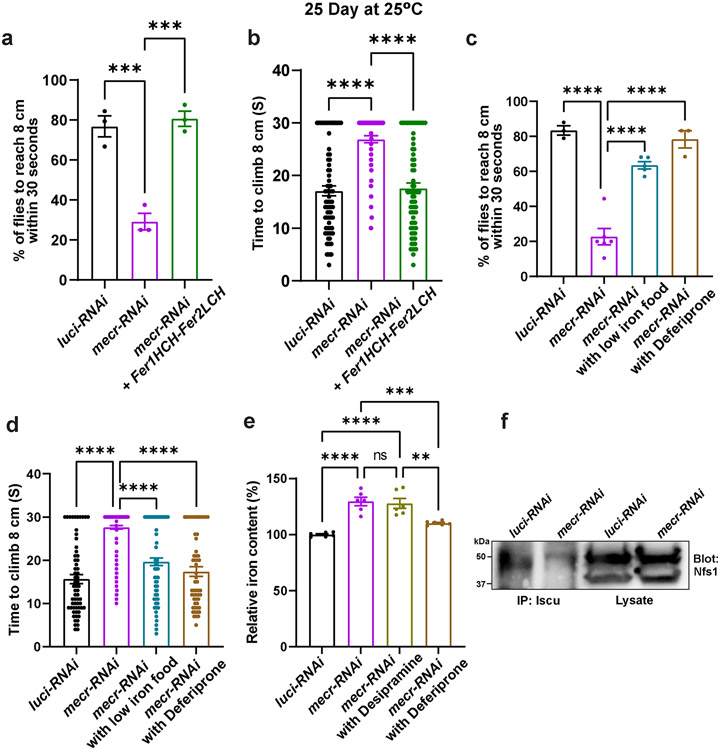
(a) Relative amount of iron in whole body of mecrTG4 mutants. Each dot represents the values from three experiments with two independent sets of biological replicates (n =50 2nd instar larva). (b) Iron staining in the larval brains of mecrTG4 mutants. Scale bar: 2.54 mm. (c-d) Western blot and quantification showing 4-HNE levels in control and mecrTG4 mutant. Each dot represents the values of replicates from at least three independent experiments. (e) Relative amount of iron in fibroblasts from patients and parental control. The dots represent the values of technical replicates from one set of biological replicates. (f) Table showing patients' serum ferritin levels. REF indicates the normal range of Ferritin levels in the control population. (g-h) Quantification of ERG traces showing the effects of ferritin overexpression in 25-day-old flies with neuronal knockdown (elav-GAL4) of mecr. n = 13 (luci-RNAi), n = 14 (mecr-RNAi and mecr-RNAi+Fer1HCH-Fer2LCH) flies. (i-j) ERG quantification showing the effects of low iron food and Deferiprone treatment on 25-day-old flies with neuronal knockdown (elav-GAL4) of mecr. n = 12 (luci-RNAi), n = 15 (mecr-RNAi and mecr-RNAi with low iron food, and mecr-RNAi with Deferiprone) flies. For statistical analyses between two samples, we performed two-tailed Student’s t-test, and for three samples, one-way ANOVA followed by a Tukey’s post-hoc test are performed. Error bars represent SEM (**p < 0.01; ***p < 0.001; ****p < 0.0001).
Iron is present in two interchangeable forms: ferric (Fe3+) and ferrous (Fe2+) forms. The conversion of (Fe3+) to (Fe2+) or (Fe2+) to (Fe3+) creates reactive oxygen species (ROS) via the Fenton reaction 58,59. Increased ROS triggers lipid peroxidation and the generation of toxic hydroxynonenal (HNE)-modified protein adducts 60-62. Hence, we measured the levels of ROS using an antibody against 4-HNE, a marker of lipid peroxidation and oxidative damage 58,62,63. Indeed, we noted a two-fold elevation of the 4-HNE level in mecrTG4 mutants (Fig. 7c-d). These data indicate that iron toxicity may lead to lipid peroxidation when mecr is lost. Alternatively, the impaired activity of Complex-I or Complex-III documented in Extended Data Fig. 8a may lead to increased ROS production.
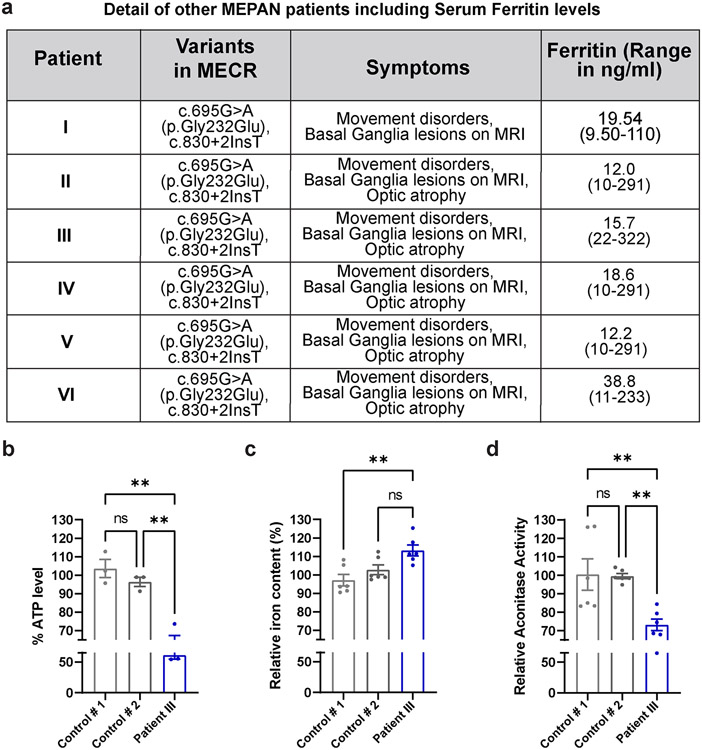
Next, we evaluated iron levels in patient-derived fibroblasts. Compared to the control cells, fibroblasts from both patients displayed an elevated level of iron (Fig. 7e). Levels of ferritins, iron-binding proteins in serum serve as another indicator of iron homeostasis in humans. Generally, low levels of serum ferritins indicate impaired iron metabolism and low iron storage 64. Interestingly, low levels of serum ferritin were noticed in both patients at different ages (Fig. 7f), and the levels of ferritins are also comparatively low in another cohort of MEPAN patients (Extended Data Fig. 9a). All patients exhibit low plasma levels of Ferritin, but most are still within a borderline normal range. Interestingly, Patient III, who exhibits the most severe phenotype, has iron levels above the normal range and Ferritin levels below the normal range. We also noted lower ATP levels and impaired iron levels in the fibroblasts of Patient III when compared to the unrelated control fibroblasts (Extended Data Fig. 9b-c). The data indicate that loss of mecr/MECR impairs iron metabolism.
Since we noticed high iron levels in patient-derived fibroblasts and mecr mutants as well as low serum ferritin levels in MEPAN patients, we assessed if reducing iron levels can alleviate the neurodegenerative phenotypes in aged flies when mecr is reduced in neurons. First, we expressed Ferritin heavy chain (Fer1HCH) and Ferritin light chain (Fer2LCH), which form heteropolymeric complexes that chelate iron and reduce iron toxicity 54,65. Increasing Ferritin levels rescued the ERG synaptic transmission defects and restored the climbing ability when mecr levels are reduced in neurons (Fig. 7g-h and Extended Data Fig. 10a-b). Second, we fed the flies an iron chelator, deferiprone 66,67 or raised the flies on low iron food by replacing the iron-rich molasses with sucrose 54. Both treatments significantly improved the ERG and climbing defects (Fig. 7i-j and Extended Data Fig. 10c-d). Importantly, treatment with deferiprone reduces total iron levels whereas treatment with desipramine did not affect the iron levels in the brains of 25 day-old flies with neuronal knockdown of mecr (Extended Data Fig. 10e). These data argue that elevated iron play a role in the demise of neurons when mecr levels are reduced.
Loss of Mecr affects Fe-S biogenesis
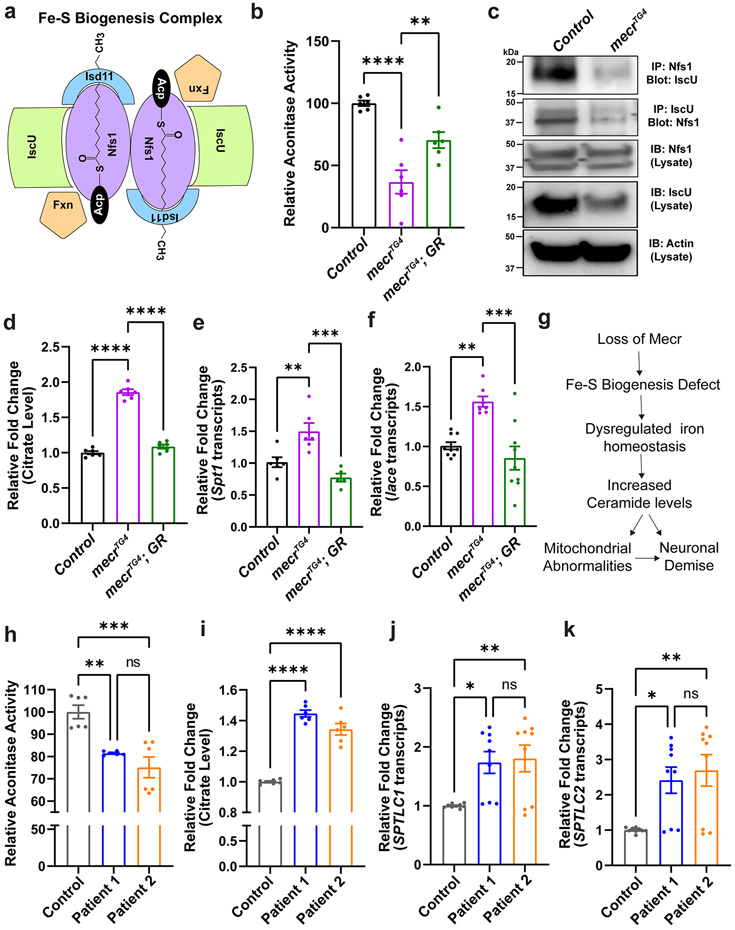
Impaired Fe-S cluster biogenesis in mitochondria have been reported to cause iron accumulation 68,69. The Fe-S cluster biogenesis complex is composed of five proteins (Fig. 8a) including Iron-Sulfur Cluster Assembly Enzyme (ISCU), NFS1 Cysteine Desulfurase (NFS1), LYR Motif Containing 4 (LYRM4), Frataxin (FXN) and Acyl-ACP 56. Given the role of Acyl-(C14-C18)-ACP in Fe-S cluster biogenesis 15,70,71, we hypothesized that loss of mecr affects the length of the acyl chain and impairs iron-sulfur cluster biogenesis. We first assayed the activity of mitochondrial aconitase, which requires 4Fe-4S clusters for proper function and serves as a read-out for Fe-S cluster biogenesis defects 72. We find that the enzymatic activity of aconitase is significantly reduced in mecr mutants (>50%) (Fig. 8b) suggesting a defect in Fe-S cluster biogenesis. We then performed co-immunoprecipitation experiments to evaluate the integrity of the Fe-S cluster biogenesis complex upon loss of mecr. We immunoprecipitated either Nfs1 or Iscu and immunoblotted against Iscu or Nfs1 respectively using protein lysate from mecr null mutants. We observed that the interaction between Nfs1 and Iscu is impaired in the null mutants (Fig. 8c). No obvious difference in the levels of Nfs1 and a moderate reduction in the levels of Iscu protein was noted in the inputs (Fig. 8c). An impaired interaction between Nfs1 and Iscu was also observed upon neuronal knockdown of mecr (Extended Data Fig. 10f). Hence, loss of mecr affects the assembly of Fe-S biogenesis protein complex and reduces Fe-S biosynthesis. We therefore assessed aconitase activity in patient-derived fibroblasts. Aconitase activity was also reduced in fibroblasts of the three patients when compared to that of the control fibroblasts (Fig. 8h and Extended Data Fig. 9d). Although the decrease in aconitase activity is clearly less severe than in flies (20% reduction versus 60%), this is not unanticipated as patient cells have residual MECR activity. Next, we performed co-immunoprecipitation to assess the interaction between ISCU and NFS1 using fibroblasts derived from the UDN patients and parent control. However, we did not detect an impaired interaction between these two proteins (Extended Data Fig. 8f), possibly because of residual MECR protein activity. Alternatively, the interaction between these two proteins is not significantly impaired but the complex is not fully functional. Based on our observations, we propose that loss of mecr/MECR affects the Fe-S biogenesis.
Figure 8: Loss of mecr/MECR reduces aconitase activity and promotes ceramide synthesis.
(a) Diagram of the proteins of Fe-S biogenesis complex. (b) Relative aconitase activity in mecrTG4 mutants. Each dot represents the values from three experiments with two independent sets of biological replicates (n = 50 2nd instar larva). (c) The interaction between Nfs1 and Iscu in mecrTG4 mutants is reduced. (d) Relative citrate levels in the mecrTG4 mutants. Each dot represents the values from three independent experiments (n = 50 2nd instar larva). (e-f) Relative fold changes in the transcript levels of Spt1 and lace in mecrTG4 mutants. Each dot represents the values from two (for Spt1) or three (for lace) independent experiments. (g) Proposed mechanism of neurodegeneration upon loss of mecr. (h) Relative aconitase activity in the fibroblasts from patients and parental control. Each dot represents the values from two independent experiments. (i) Relative citrate levels in patient-derived fibroblasts. Each dot represents the values from three independent experiments. (j-k) Relative fold changes in the transcript levels of SPTLC1 and SPTLC2 in patient-derived fibroblasts. Each dot represents the values of replicates from three independent experiments. For statistical analyses between two samples, two-tailed Student’s t test, and for three samples, one-way ANOVA followed by a Tukey’s post-hoc test are carried out. Error bars represent SEM (*p < 0.05; **p < 0.01; ***p < 0.001; ****p < 0.0001).
Dyshomeostasis of iron metabolism leads to elevated ceramide levels
A reduction in aconitase activity has been reported to elevate citrate levels 73-75. We therefore assessed citrate levels and found that they are indeed significantly increased in mecr mutants (Fig. 8d). Elevated citrate levels have previously been shown to cause an increase in palmitate and ceramides 76,77. As we observe an upregulation of dihydroceramides (d18:0-16:0) (Fig. 3c and e), an increase in de novo synthesis of ceramides seems likely. We therefore assessed the transcript levels of the key rate limiting enzymes in the de novo synthesis of ceramides. As shown in Fig. 8e-f, there is a significant increase in transcript levels of Spt1 and lace in mecr mutants. Importantly, as shown in Figure 5e and f and Extended Data Fig. 7, fly heads with neuronal knockdown of mecr have elevated levels of ceramides that are reduced upon treatment with Deferiprone. Hence, loss of mecr leads to dysregulated iron homeostasis, which in turn upregulates palmitate and ceramide levels (Fig. 8g). We also noticed increased citrate levels (Fig. 8i) as well as upregulated transcript levels of SPTLC1 and SPTLC2 in patient-derived fibroblasts similar to what is observed in flies (Fig. 8j-k). Overall, these data indicate that iron metabolism dyshomeostasis impairs aconitase activity to promote citrate levels and to upregulate ceramide synthesis.
Discussion
Despite the discovery of mtFAS in the late 1980s 78,79, its contribution to lipid homeostasis has not been systematically investigated in vivo in multicellular organisms. The recent identification of loss-of-function mutations in MECR as the cause of MEPAN syndrome, a pediatric-onset neurodegenerative disorder 10, highlights the importance of mtFAS in neuronal maintenance in humans. To investigate if and how impaired mtFAS affects lipid homeostasis and leads to neurodegeneration, we generated a fly mutant and characterized MEPAN patient-derived fibroblasts. In flies, severe loss-of-function alleles of mecr cause lethality, whereas neuronal knock-down of mecr leads to age-dependent locomotor defects, visual impairments, and progressive photoreceptor degeneration. Our comparative analyses between flies and patient fibroblasts revealed elevated ceramide levels and mitochondrial dysfunction when mecr/MECR is lost or reduced. We propose that loss of mecr/MECR affects the Fe-S biogenesis, possibly because the ACP-acyl carbon chain length is severely reduced, which leads to elevated cellular iron level. Reducing the levels of either iron or ceramide strongly suppresses the age-dependent phenotypes in flies. These data argue that low levels of Fe-S clusters, elevated iron and/or increase ceramide play an active role in the demise of neurons when mecr/MECR levels are reduced. Moreover, they also point to the functional relationship between these two metabolic pathways implicated in neuronal maintenance.
To our knowledge, mecr/MECR has not been previously implicated in ceramide or iron metabolism. The de novo synthesis of ceramides occurs in the endoplasmic reticulum (ER) whereas acidic and neutral sphingomyelinases break down sphingomyelin to produce ceramides in lysosomes and at the plasma membrane respectively 80. Our data suggest that the ceramides and iron metabolomic defects are connected and that MECR/Mecr plays a central role in maintaining homeostasis between these pathways by regulating mtFAS. Elevated ceramide levels impair membrane dynamics by reducing the fluidity of membranes and trafficking of membrane compartments in the cell 44,80-83. They also result in loss of mitochondrial membrane potential, impaired ETC activity, and formation of ceramide channels on the outer mitochondrial membrane, eventually causing cell death 84,85. In addition, mtFAS produces long-chain acyl-ACP that participate in the assembly of respiratory chain complexes, and in mammals acyl-ACP is a structural component of respiratory complex I as well as mitoribosomes17. Hence, a reduction in complex I function and ROS production, in combination with other metabolic issues, may also play a role in the disease process in MEPAN.
Membrane and mitochondrial defects have been shown to induce the demise of neurons in neurodegenerative disorders such as Parkinson’s disease (PD) and Friedreich ataxia (FRDA) 53,54,86,87. A partial loss of FXN, which encodes the Frataxin protein in humans, causes FRDA 67,88. The Frataxin protein is a key component of the Fe-S cluster biosynthesis complex which also contains acyl-ACP. Loss of mecr (this work) or loss of fh 89, the fruit fly ortholog of human FXN, affects the Fe-S cluster synthesis as evidenced by reduced activity of aconitase. We previously showed that loss of Frataxin in flies as well as in cardiomyocytes of FRDA patient causes increased levels of dihydrosphingosine, sphingosine, dihydroceramide, ceramide 53,54 and increased ceramide levels have also recently been documented in FRDA patient-derived fibroblasts 88. The loss of Fe-S cluster synthesis should lead to an elevation of iron, which is also observed upon loss of fh 53,54 and mecr (this work). Hence, elevated iron may play a role in the pathogenesis. Indeed, lowering the iron levels in both models is beneficial, suggesting that the Fe-S cluster defects may not account for all the observed phenotypes unless both insults, low Fe-S cluster synthesis and high iron, synergize to cause severe cellular defects. Restoring one insult may therefore be sufficient to partially suppress the observed phenotypes. Interestingly, a similar spectrum of phenotypes including iron metabolism defects and accumulation of ceramides have been observed in flies that lack pink1 (the fly ortholog of human PINK1)42,90 . Elevated levels of iron and ceramides have also been associated with PD 86,87,91-93 and iron deposition has been reported in the substantia nigra of the postmortem PD brain 94-96. Based on these data, we argue that the pathway studied here is relevant to at least some other neurodegenerative disorders including FRDA and parkinsonism97.
The elevated levels of iron may lead to the upregulation of ceramides through different mechanisms. We noted an elevation in citrate levels as well as an upregulation in the transcript levels for the proteins required for the de novo synthesis of ceramide. Previously another study reported citrate accumulation in HeLa cells upon knockdown of ACP 23. A significant increase in citrate due to reductive carboxylation was also observed in mtFAS deficient C2C12 cells 6. Elevated citrate levels inhibit fatty acid transport to mitochondria for beta-oxidation and increases palmitoyl-CoA availability for de novo ceramide synthesis 76,77. In addition, other mechanisms facilitating ceramide accumulation may also be operative due to iron metabolism impairments. For example, impaired iron metabolism produces ROS 58,59, which can enhance the activity of both neutral and acidic sphingomyelinases 98,99. However, given that we observe an elevation of dihydroceramides and de novo synthesis, the latter two hypothesis seem less likely or may only play a minor role.
It is worth noting that although the effects of mecr loss-of-function in flies are mostly consistent with the phenotypes we observe in patient-derived fibroblasts, the fly phenotypes are typically more pronounced. We argue that the main reason for this difference is the partial loss of MECR function in patients whereas flies carry null alleles. Indeed, expression of some MECR variants from MEPAN patients in a fly mutant background suggests that the variants that affect single amino acids are relatively weak hypomorphic alleles whereas the truncating variant is a strong loss-of-function allele. Indeed, 12 out of 13 patients including those reported in the previous studies 10,11 as well as those mentioned in Extended Data Fig. 9a of the current study carry at least one allele that is a weak hypomorph (Extended Data Fig. 2b-d). We argue that stronger allelic combinations in humans may result in embryonic lethality similar to complete loss of Mecr function results in embryonic lethality in mice 4 and larval lethality in flies (this study). Hence, the fly phenotypes associated with null alleles are likely more severe than the phenotypes of patient fibroblasts. When we assessed the rescue potential of these drugs (159 μM of Deferiprone and 20 μM of Desipramine treatment for 24 hours) in the patient fibroblasts by measuring aconitase activity, a significant rescue was not observed, but the fibroblasts from patient 2 responded to the treatments better than the fibroblasts from patient 1 (Supplementary Fig. 1). Since there are many variables including dosage, treatment time, genetic background, possible other/additional mechanisms it is difficult to derive any definitive conclusions from these data. In our assays in flies, we applied different treatments throughout development. The crosses were set up in food containing the drugs and the animals are kept on this food continuously. Hence, it is possible that a 24 hr treatment is insufficient or that the effects are already irreversible.
A role for mtFAS in Fe-S cluster biogenesis has been recently reported in yeast as well as in vertebrate cell culture studies 15,70,71. ACP with an acyl chain length of 14 to 18 carbons (Acyl-ACP) interacts with ISD11 and facilitates the assembly of the Fe-S cluster biogenesis complex 15,71. However, whether a reduction in acyl chain length affects Fe-S cluster biogenesis was not tested. Our data show that the five-protein complex is not properly assembled in mecr null mutants. In contrast, we did not detect an obvious defect in the complex assembly in patient fibroblasts, possibly because of the partial loss of MECR. Yet, other data derived from fibroblast are consistent with impaired Fe-S biogenesis. A defect in Fe-S biogenesis affects the activity of aconitase, a mitochondrial enzyme, which requires [4Fe-4S] clusters 72. A previous study in mice used a histochemical approach to measure aconitase in Mecr conditional KO Purkinje cells and did not detect a difference in aconitase activity 9. Our data show that there is a Fe-S biogenesis defect in the fly mecr mutants as well as the patient-derived fibroblasts based on aconitase activity. Moreover, our data show that mecr mutants and patient-derived fibroblasts have elevated iron levels. Dysregulated iron metabolism has not yet been reported in patients with MEPAN syndrome. However, in the patients reported in this paper, we noticed low plasma Ferritin levels, as well as high cellular iron levels and impaired aconitase activity in fibroblasts of some patients. Interestingly, mRNAs encoding Ferritins contain an Iron Responsive Element (IRE) in the 5’ UTR of the mRNA. In the presence of low Fe-S clusters, the Iron Responsive Protein 1 binds to the 5’UTR IRE of the ferritin mRNA and reduces its translation leading to reduced plasma Ferritin levels 64,100. Hence, the low plasma Ferritin levels in patients provides further evidence for a defect in iron metabolism. Reduced Ferritin levels may also cause increased iron deposition in the cells leading to neurodegeneration as seen in Neuroferritinopathy 101-103. Finally, the data are also consistent with the observation that increasing Ferritin levels in flies alleviate neurodegenerative phenotypes associated with mecr knock-down. Hence, we propose that impaired Fe-S biogenesis results in increased iron and ceramide levels leading to age-dependent impairment of neuronal function in mecr mutant flies and MEPAN patients.
Methods
Fly Stocks maintenance and survival assay
Flies were maintained in a standard fly food at room temperature and the experiments were carried out in 25°C unless otherwise noted. The stocks used in this work were either generated in the lab or obtained from other labs and stock centers including Bloomington Drosophila Stock Center (BDSC) or Vienna Drosophila Resource Center (VDRC). yw was used as the ‘control’ for most of the experiments. For the lifespan assay, newly emerged flies were collected in fresh vials, and approximately, 10-15 flies were kept in each vial from each genotype at 25°C with 12h dark/12h light conditions. The flies were transferred into a new vial every 2-3 days followed by documenting the number of dead flies. The significance of survivability was calculated using Log-rank (Mantel-Cox) test and Gehan-Beslow-Wilcoxon test in GraphPad Prism software.
Generation of CRISPR mutant:
We generated mecrTG4 mutant flies as described previously 24. In brief, for the mecrT2AGAL4 line, we designed sgRNAs targeting the coding intron of CG16935/mecr (TATGCAGTTCATGCCGGTTATGG) as well as a homology donor construct that has the 200 bps left and right homology arms. A construct containing the homology arms and sgRNA sites to linearize the homology donor construct is synthesized in pUC57_Kan_gw_OK vector by Genewiz (South Plainfield/NJ). sgRNA targeting mecr is cloned in pCFD3 vector 104. The gRNAs, homology arms, and the cassette containing attP-FRT-SpliceAcceptor-T2A-GAL4-polyA-3XP3GFP-polyA-FRT-attP sequence was subcloned in the homology intermediate vector from pM37 vector, creating the homology donor vector 25. mecrKozak-GAL4 line was, we designed as described in Kanca et al. 2022105. A homology donor intermediate vector encoding sgRNAs targeting upstream and downstream of the coding sequence of the gene (CCGTCGCTACATTGCTGCCAACT and CCTCGAGTTACGCATCTAAATGC) and an sgRNA to linearize the homology donor as well as 200 bps left and right homology arms was synthesized in pUC57_Kan_gw_OK2 vector by Genewiz/Azenta (South Plainfield/ NJ). Kozak-GAL4-polyA-FRT-3XP3GFP-polyA-FRT cassette is subcloned in the homology donor intermediate vector. Homology donor vectors are injected in nosCas9 expressing embryos as described in Kanca et al. 201924. Eclosed flies are crossed with yw flies, and the 3XP3-GFP positive progeny were selected on the basis of GFP expression in the adult eyes.
Cloning and transgenics
The MECR (NM_016011.2) human cDNA was cloned into the destination vector, pGW-attB-HA as previously described 106. Briefly, cDNA in the pDONR221 vector was shuttled to the pGW-attB-HA using Gateway cloning (LR clonase II, Thermo Fisher Scientific). For generating the variants, the Q5 site-directed mutagenesis (NEB) in the pDONR221 vector was performed using the following primers MECRGly232Glu, For 5’-AAGAGTCTGGAGGCTGAGCAT-3’, Rev 5’-CAGTCTGTCACTCAGCTTC-3’; MECRArg258Trp, For 5’-GCCCCAGCCATGGCTTGCTCT-3’; Rev 5’-ATGTCCTTAAAGAAGTTTTTCATTTCGGGCC-3’; MECRTrp285* For 5’-TGGTAACCTAGGGGGGGATGG-3’, Rev 5’-TGGTTCCTCCACGCGCTA-3’. All variant sequences were Sanger verified after LR reaction to the destination vector.
For, the fly UAS-mecr-HA line, the clone from DGRC (Cat – 1660183) was obtained. As previously described 107, flanking Gateway compatible attB sites were inserted by PCR to the mecr template and shuttled to the pDONR223 by BP clonase II (Thermo Fisher Scientific) using the following PAGE purified primers: mecr_attB_For 5’-GGGGACAAGTTTGTACAAAAAAGCAGGCTTCACCATGTTGCGCAGAGGCTTTTTATCTC-3’ and mecr_attB_Rev 5’-GGGGACCACTTTGTACAAGAAAGCTGGGTCCTAAATGCTCATATCCAGTATGTAC-3’. yw ΦC31 integrase; VK33 (PBac{y[+]-attP}VK00033) flies were used for injecting the UAS constructs. For the mecr-GFP line, we obtained the FlyFos construct (CBGtg9060C0290D) from the SourceBiosciences and prepared the DNA for injection into the y1 w*, P{nos-phiC31\int.NLS}X; PBac{y+-attP-3B}VK00033 flies.
Quantitative Real-Time PCR
Real time PCR was performed as described previously 108. In short, RNA was isolated from 2nd larva of the indicated genotypes using the RNeasy Plus Mini Kit (Qiagen) followed by preparation of cDNA using 5× All-In-One RT MasterMix (Applied Biological Materials Inc.) as per the manufacturer’s protocol. Master Mix for the quantitative polymerase chain reaction was prepared using 2X Fast SYBR Green Master Mix (Thermo). Following primers were used for mecr: 5’-ATTCTGGCAGCTCCCATTAAC-3’ (Forward, primer set 1), 5’-CGGCTGGAAACTTGGGCTT-3’ (Reverse, primer set 1), 5’-CGTGGGCGACAAAGTCAAAG-3’ (Forward, primer set 2), 5’-CAACCTTCTTGGACACGATCA-3’ (Reverse, primer set 2); Spt1: 5’-ACCCTACTGCTCATAACCGTG-3’(Forward primer), 5’-GCGATTATTCGGTCTTCCTCCTC-3’ (Reverse primer); lace: 5’-CCGCGTACACTGAAATTCGC-3’ (Forward primer), 5’-CCGGATGGTAGTTGATCGAGC-3’ (Reverse primer); SPTLC1: 5’-GGTGGAGATGGTACAGGCG-3’ (Forward primer), 5’-TGGTTGCCACTCTTCAATCAG-3’ (Reverse primer); SPTLC2: 5’-TGGGTTCCTACAACTATCTTGGA-3’ (Forward primer), 5’-CATACGCCATAGCAGCTTCTAC-3’ (Reverse primer). rps13 or tub was used as internal control for the fly genes and 18s rRNA was used as internal control for the human genes. Reactions for each genotype was set up in triplicate using Applied Biosystems QuantStudio 6 machine. Relative fold change of the mecr transcript was calculated using 2−ΔΔCq method, statistical outliers were removed from final calculations, and the graph was prepared using GraphPad Prism software.
Fibroblast culture
Fibroblasts derived from the parent (control) and both patients with MEPAN syndrome were obtained from Undiagnosed Diseases Network and cultured in Dulbecco’s Modified Eagle Medium (Gibco, USA) supplemented with 10% fetal bovine serum (Invitrogen, USA) and 1% Antibiotic-Antimycotic (Gibco, USA). All cells were grown in 5% CO2 at 37°C. Harvested cells were washed with phosphate-buffered saline and stored as pellets at −80°C until further analysis. All experiments were performed using the same passage number.
S2 cell culture and transfection and immunostaining
S2 cells were cultured on polyD-Lysine coated coverslips in 24 well plates at room temperature (23°C) using Schneider’s Drosophila medium (Life Technologies) supplemented with 10% fetal bovine serum (FBS) and Penicillin-Streptomycin (Sigma). Transfection of S2 cells were carried out with 0.2ug DNA using Qiagen Effectene Transfection Reagent as per the manufacturer’s recommendation. After 48 hours of transfection, the cells were used for immunostaining. Briefly, the media was replaced with 500 μL of 4% PFA (paraformaldehyde) for 30 min at room temperature. Then, the coverslips were rinsed with 1X PBS for three to four times followed by treatment with 200 μL of 0.2% PBT for 15 min and blocking with 1% NGS for 1 hour. Subsequently, primary antibody incubation was performed at 4°C overnight. The next day, cells were washed with PBS 4 times, 5 min each, and incubated with respective secondary antibodies and DAPI for 60-90 min at room temperature. Finally, the coverslip with cells was briefly washed with 1X PBS and mounted using vectashield (Vector Labs, Burlingame, CA). The slides were either imaged immediately using a Leica sp8 (Leica) confocal microscope. The images were processed using ImageJ and Adobe Photoshop.
Immunostaining of fly tissues
Immunostaining was performed as described previously 106,108. Larvae were dissected in cold PBS followed by fixation in 4% PFA for either 20 min (salivary gland and fat body) or overnight (brain). Next, the tissues were washed briefly in PBST 3-4 times for 10-15 min each, blocked in 5% NGS and kept in primary antibody for overnight at 4°C. The following dilutions of primary antibodies were used: Rat Anti-Elav (1:500), Mouse Anti-Repo (1:50), Rabbit Anti-MECR (1:100), Mouse Anti-ATP5α (1:500), Mouse Anti-Cer (1:15). The next day, after washing with PBST 3-4 times for 15 min each, the tissues were incubated in secondary antibody in 5% NGS and PBT for 90 min at room temperature. All the secondary antibodies were used at a 1:200 dilution. The secondary antibody was removed followed by three washes with PBST 3-4 times for 15 min each. Finally, the tissues were mounted in vectashield (Vector Labs, Burlingame, CA) or RapiClear mounting medium. For the adult brains, 2% PBT was used for all the washes and the antibody incubations were performed for 48 hours. Imaging was performed by using either LSM880 (Zeiss) or Leica sp8 (Leica) confocal microscopes. The images were processed using Zen Blue (Zeiss LSM Image Browser), ImageJ and Adobe Photoshop.
Electroretinogram
Electroretinograms were performed as described by 106. The flies were glued to the glass side and kept in complete darkness for at least one minute followed by inserting two glass electrodes: the ground electrode was placed onto the thorax and the recording electrode was placed onto the eye. The eyes were exposed to a pulse of light for 1 sec. The electroretinogram traces were recorded and data analyses were performed using LabChart8 Reader software.
Climbing assay
Climbing assay was performed as described previously 108. Briefly, 3-5 flies were taken in a plastic food vial and tapped 2-3 times onto the bottom. Next, two parameters were measured: first, the percentage of flies, who were able to climb ~8 cm in 30 sec. Second, the average time taken by the flies to reach ~8 cm distance within 30 sec. If the flies are unable to climb 8cm within the given time, we record them at 30 sec. However, if the flies can climb prior to the 30 sec timespan, we note that specific time as the climbing time. The flies that are listed at the 30 sec timepoint are really poor performers.
Transmission Electron Microscopy
Transmission electron microscopy was performed using retina from the adult fly eye as well as fibroblasts from patients and parental control. The samples were fixed using 4% PFA, 2% glutaraldehyde, and 0.1 M sodium cacodylate (pH 7.2) at 4°C for 48 hours followed by a secondary fixation in 1% OsO4. Subsequently, the samples were dehydrated by treating them with ethanol grades and propylene oxide. For this, a Ted Pella Bio-Wave microwave oven with vacuum attachment was used. Next, the samples were embedded in Embed-812 resin (Electron Microscopy Science, PA) for 72 hours. Then, ultra-thin sectioning was performed using a Leica UC7 microtome followed by staining with 1% uranyl acetate and 2.5% lead citrate. Finally, imaging was performed using a JEOL JEM 1010 transmission electron microscope with an AMT XR-16 mid-mount 16-megapixel camera.
Lipidomic analyses
Lipidomic analyses were performed using the mecrTG4 mutant larva, adult fly heads and human fibroblasts.
Lipid extraction
Lipids were extracted from wild-type, mutant and rescue larva, as well as control and patient fibroblast pellets using a neutral and acidic lipid extraction as described previously 109-111. Briefly, deuterated internal standard mixture, described in the previous method 111 was added with chloroform:methanol (1:2, v/v) to all samples equally. After the addition of internal standards, the samples were tip-sonicated to disrupt the cells and extraction solvent was added to extract lipids while removing proteins and polar metabolites. Extracted lipids were stored at −80°C until mass spectrometry analysis. For lipid extraction from fly heads, deuterated ceramide LIPIDOMIX standard containing d18:1-d7/16:0-, d18:1-d7/18:0-, d18:1-d7/24:0- and d18:1-d7/24:1-Cer (Avanti Polar Lipids, Alabastor, AL) was added to 100 fly heads as an internal standard with 500 μl 1-butanol:methanol (1:1, v/v). Followed by tip-sonication, all samples were sonicated for 60 min at room temperature and centrifuged at 13,000 × g for 10 min. The supernatant was dried using vacuum centrifuge, reconstituted in 40 μl chloroform:methanol (1:4, v/v) and centrifuged at 13,000 × g for 5 min to remove any insoluble salt. The supernatant was collected and kept at −80°C until further analysis by liquid chromatography-tandem mass spectrometry (LC-MS/MS) analysis.
Liquid chromatography-tandem mass spectrometry for lipidomics
The larva and human fibroblast lipid extracts were analyzed on a Hypersil GOLD Vanquish C18 UHPLC column (150 × 2.1 mm, C18 1.9 μm and 175 Å) using a Fourier transform Orbitrap Fusion Tribrid ID-X mass spectrometer (Thermo Fisher Scientific, USA) coupled to Vanquish Horizon UHPLC (Thermo Fisher Scientific, USA). Untargeted lipidomics was carried out as previously described, with modifications 110,111. Briefly, a binary gradient at a flow rate of 300 μL/min using aqueous phase (water:acetonitrile=6:4, v/v) and organic phase (isopropanol:methanol:acetonitrile=8:1:1, v/v/v) with 10 mM ammonium formate and 0.1% formic acid as modifiers was applied to separate the lipids. Organic phase was increased from 30% to 95% over 15 min, maintained at 95% for 3 min and equilibrated to 30% for 5 min for the next injection. The analytical column was maintained at 50°C. A full scan MS (250–1600 m/z in positive ion mode and 350-1700 m/z in negative ion mode) was acquired in the Orbitrap with a resolution of 60,000 at m/z 200. Injection time was set at 50 ms in MS and dynamic exclusion was enabled with an 8 s exclusion duration time. MS/MS spectra were obtained at a resolution of 15,000 at m/z 200 with injection time at 60 ms. MS/MS scans were acquired for 1.5 sec, followed by a MS scan. In positive ion mode, spray voltage of 3.5 kV and stepped collision energy of 30, 35 and 40% in higher-energy collisional dissociation (HCD) were applied. Collision-induced dissociation was triggered only for ions with detection of m/z 184 in HCD fragmentation. In negative mode, spray voltage of 3 kV and stepped collision energy of 28, 32 and 40% in HCD were used.
Mass Spectrometry data analysis for lipidomics
The acquired tandem-mass spectra were processed using LipidSearch 4.2 (Thermo Fisher Scientific, USA) to annotate lipids. Lipids were annotated by comparing precursor ion masses and corresponding MS/MS spectra against the database. Precursor ion mass tolerance was set to 5 ppm and fragment ion tolerance was set to 8 ppm. Annotated lipids were quantified by calculating peak areas using PyQuant, based on the precursor ion masses and retention times 112. All lipids were normalized by peak area of internal standard sharing the identical head group of lipids.
Targeted analysis of lipids using LC-MS/MS
Lipids were analyzed using an Altis triple quadrupole mass spectrometer (Thermo Fisher Scientific, Waltham, MA) coupled to Vanquish Horizon UHPLC (Thermo Fisher Scientific, Waltham, MA).
An Atlantis T3 column (1.0 × 50 mm) packed with C18 particles was used to separate the glucosylceramides and ceramides containing d14:0, d14:1, d14:2, and d16:1 as sphingoid backbones. Mobile phase A was consisted of water:acetonitrile (9:1, v/v) with 0.1% formic acid and mobile phase B was made up of isopropanol:methanol:acetonitrile (7:2:1, v/v/v) with 0.1% formic acid. At the flow rate of 150 μl/min, mobile phase B was increased from 30 to 40% over 1 min, 70% over 1.5 min, 72.5% over 3.5 min and 95% over 3.5 min. After maintaining the mobile phase B at 95% for 2.5 min, it was ramped down to 10% over 0.1 min and re-equilibrated at 30% mobile phase B for 2.9 min. Eight microliters of reconstituted samples were injected to LC-MS/MS and each sample was analyzed in triplicate. Scheduled multiple reaction monitoring (MRM) of targeted lipids were acquired with Q1 resolution at 0.4 FWHM, Q3 resolution at 0.7 FWHM, spray voltage 3.5 kV, sheath gas at 35, auxiliary gas at 5 and sweep gas at 1 in positive ion mode. Each MRM of lipid had one quantifier and one qualifier ion.
Peak areas of lipids were calculated using Skyline (MacCoss LabSoftware), normalized to peak area of deuterated internal standard and protein amount measured from BCA protein assay. Ceramides and glucosylceramide having d14:0, d14:1, d14:2, and d16:1 sphingoid bases were quantified using m/z 210.25, 208.25, 206.25, and 236.25 as quantifier ions, respectively. The total level of lipid for each class was calculated by adding the normalized peak areas of individual species.
ATP determination:
ATP determination was performed using ATP determination Kit from Thermo (A22066) as per the manufacturer’s instruction. 25 larvae were homogenized in 100 μL of homogenization buffer followed by boiling for 5 min and centrifugation at ~21000 x g for 3 min at 4°C. The supernatant was collected in a separate tube. For the fibroblasts, ~1×10⁴ cells were washed twice with PBS followed by centrifugation to make a cell pellet. The pellet was resuspended with ATP releasing agent from Sigma (FLSAR-1VL). 10 μL of the supernatant was diluted with 90 μL of homogenization buffer and used for further experiments. Finally, the diluted sample was added into Luciferase-luciferin mix (1:10) followed by measurement of luminescence. Total protein levels were determined and used to finally normalize the data.
Mitochondrial Membrane potential analyses:
Mitochondrial membrane potential was performed as described previously 37. Briefly, larvae were dissected in DSM and stained with 100 nM TMRE for 20-30 min followed by two brief washes in PBS. Samples were mounted in 1X PBS and immediately imaged using 63X objective of Zeiss880. The images were processed using Zen Blue (Zeiss LSM Image Browser) and Adobe Photoshop software.
ETC activity
Activities of ETC complexes were measured by kinetic spectrophotometric assays as previously described 113. Briefly, 150 second instar larva were homogenized in 500 μL of Mitochondria Isolation Buffer (225mM Manitol, 75mM Sucrose, 10mM MOPS, 1mM EDTA, 2.5mg/ml BSA in milli-Q water). After homogenization, protein concentration was determined by Bradford assay. Enzymatic activity of the individual OXPHOS complexes was measured using a Tecan Infinite M200 microplate plate reader. The assay is based on the measurement of oxidation/reduction of substrates or substrate analogues of individual complexes. The enzyme activity of individual complexes was normalized to the protein concentration.
Seahorse assay
The oxygen consumption rates of fibroblasts were measured using the XF24 extracellular flux analyzer from Seahorse Bioscience, Agilent as described previously 50. Briefly, the cells were plated in 4 replicates with ~60000 cells in each well and the XF24 cartridge was equilibrated using calibration solution at 37°C for overnight. The next day, the media was replaced with XF assay medium (5mM glucose/5mM glactose, 2mM pyruvate in DMEM media, pH 7.0) and different mitochondrial stressors, namely Oligomycin (500 nM), FCCP (500 nM), Rotenone and Antimycin A (100 nM each) were added to the wells containing the fibroblasts in a sequential manner. A protocol of 3 min mixing followed by 3 min measurement and 2 min incubation time was followed to measure the oxygen consumption rates. Different respiratory parameters were calculated by using Seahorse Wave software. Finally, the protein concentrations of each well were measured and used to normalize the readings.
Ferrozine assay
Ferrozine assay was performed following the slightly modified protocol from Missirlis et al., 2006; Schober et al., 2021114,115. Briefly, 10 larvae, 25 fly heads, or cell pellets were homogenized in lysis buffer followed by centrifugation at 16000xg for 10 min. Concentrated HCL was added to the supernatant followed by heating for 20 min at 95°C. Then, the tube was centrifuged at 16000xg for 2 min. 20 μL of 75 mM Ascorbate and 20 μL of 10 mM Ferrozine were added to 50 μL of supernatant and mixed. Finally, 40 μL of saturated ammonium acetate was added to the mixture followed by absorbance measurement at 560nm using FLUOstar OPTIMA microplate reader (BMG Labtech). Results were normalized with the protein concentrations.
Iron staining
Iron staining was performed as described previously 54. In short, larval brains were dissected in ice-cold PBS followed by fixation in 4% PFA for 20 min. Subsequently, the brains were washed quickly in 0.4% PBT and incubated in Perls solution (1% K4Fe(CN)6 and 1% HCL in PBT) for 10-15 min. After incubating with Perls solution, brains were again washed quickly with 0.4% PBD and incubated for 3-5 min with DAB solution (10 mg DAB in 0.07% H2O2 and 0.4% PBT) for enhancing the signal. Lastly, the brains were washed briefly in 0.4% PBT, mounted in (Vector Labs, Burlingame, CA) and imaged with a Zeiss SteREO Discovery.V20 microscope equipped with Omax 18.0 MP Camera. Images were processed using ImageJ and Adobe Photoshop software.
Aconitase assay
Aconitase assays were performed using Aconitase Activity Assay Kit from Sigma (MAK051) 116. Briefly, ~50 larva or fibroblast pellets were homogenized in 100 μL ice-cold assay buffer and the homogenate were centrifuged at 800xg for 10 min. 65 μL of supernatant taken in a fresh tube and centrifuged at 20000xg for 15 min. Pellets were resuspended in 100 μL assay buffer and used for the subsequent steps following manufacturer’s protocol. The absorbance was measured using FLUOstar OPTIMA microplate reader (BMG Labtech). Finally, the readings were normalized with protein concentrations.
Citrate Assay
Citrate assays were performed using Citrate Assay Kit from Sigma (MAK057). In brief, ~50 larva or fibroblast pellets were homogenized in 100 μL assay buffer followed by centrifugation at 15,000xg for 10 minutes at 4°C. Supernatant was used for the subsequent steps following manufacturer’s protocol with slight modifications. After 15 min incubation, absorbance was measured using FLUOstar OPTIMA microplate reader (BMG Labtech). Finally, the readings were normalized with protein concentrations.
Protein Isolation and Western Blot
Larvae or cell pellets were homogenized in ice-cold RIPA buffer with 1X liquid protease inhibitor (Gen DEPOT) followed by centrifugation for 10 min at ~16000 x g at 4°C. The supernatant was collected in a separate tube, where 4X Laemmli Buffer containing β-mercaptoethanol was added. After mixing well, the samples were heated at 95°C for 10 min followed by keeping them in ice until loaded. The proteins were separated using 4–20% gradient polyacrylamide gels (Bio-Rad Mini-PROTEAN® TGX™) at 90-100 volts. After electrophoresis, western blot was performed using a polyvinylidene difluoride membrane (Immobilon, Sigma) followed by blocking in either skimmed milk or 5% BSA for 60-90 mins. Finally, the membranes were incubated in the primary antibody overnight. The following dilutions were used for the primary antibodies: Anti-MECR (1:1000), Anti-4HNE (1:1000), Anti-Iscu (1:1000), Anti-NFS1 (1:1000), Anti-Lipoic Acid (1:1000), Anti-Actin (1:10,000). The next day, the membrane was washed briefly followed by incubation in horseradish peroxidase-conjugated secondary antibody in blocking solution (1:5000) for 90 min at room temperature. Next, the membrane was washed three times and Fixer-Developer (1:1) solution from Western Lightning Chemiluminescence Reagent Plus (PerkinElmer, NEL104001EA) enhanced chemiluminescence (ECL) was used to develop the signal, which was visualized using Bio-Rad ChemiDoc MP Imaging System.
Co-Immunoprecipitation
Co-immunoprecipitation was performed as described previously 117. Briefly, the protein samples from larvae, adult fly heads, or fibroblasts containing 1-2 mg proteins were mixed with Protein A/G beads (SCBT) and the respective antibodies in an end-over-end rotator at 4°C overnight. The next day, the samples were briefly centrifuged and washed in IP buffer three to four times followed by denaturation, PAGE separation and western blotting.
Preparation of low iron fly food and drug administration
For preparing the low iron food for flies, dry yeast (10% w/v), agar (0.6% w/v) and sugar (10% w/v) were mixed in mili-Q water, microwaved and aliquoted in vials. After the food was solidified, the vials were used immediately or stored at 4°C for future use. For testing the effects of reduced ceramide or iron levels, fly food with different drugs was prepared and administered along with corresponding control food. Myriocin (100 mM in ethanol), Desipramine (1.126 mM in milli-Q water) and Deferiprone (163 uM in milli-Q water) were mixed in regular food and used immediately or stored at 4°C for future use. The treatments were applied to the flies developmentally. The crosses were set up in the foods with different treatments so that the larva can fed upon the modified food. For all the experiments, the flies were transferred into a fresh vial in 2 to 3-day intervals.
Statistical analyses and data quantification
The data used for quantification were obtained in at least three biological replicates, and GraphPad Prism (GraphPad Software Inc., CA, U.S.) was used for the statistical analyses and quantification. For comparing two groups, unpaired t-test (two-tailed) and for comparing more than two groups, analysis of variance (ANOVA) was used. All the data are represented as bar plots and the error bar represents ± SEM. P-value less than 0.05 is considered significant (*P < 0.05, **P < 0.01, ***P < 0.001, and ****P < 0.0001) and less than 0.05 is considered nonsignificant (ns).
Ethics oversight Statement
Our research complies with all relevant ethical regulations. Consent of the MEPAN patients/their legal guardians were obtained, and the ethics oversight is carried out by the Undiagnosed Diseases Network with an IRB from the NIH that is accepted by BCM.
Extended Data
Extended Data Fig. 1: The mitochondrial fatty acid synthesis pathway and generation of mecr mutants.
(a) Mitochondrial fatty acid synthesis pathway and its products. Briefly, an acetyl and malonyl moiety are condensed to make a four carbon long keto-acyl species, which remains attached to the mitochondrial Acyl Carrier Protein (mtACP), a protein that holds the growing acyl chain during the fatty acid synthesis within the mitochondria. Subsequently, this four-carbon long keto-acyl ACP undergoes a reduction-dehydration-reduction cycle to produce a butyryl-ACP (C4). C4 enters into the cycle, and two carbons from the malonyl moiety are attached to the butyryl species to make an acyl chain of six carbon length. This cycle continues until the carbon length of the growing acyl chain reaches up to 16-18 carbon. (b) Schema showing the mecr mutants used in this study. (c) Schema showing the Primers used for quantitative real-time PCR and the graphs showing the relative levels of mecr transcripts in mecrTG4 mutants. Each dot represents data from three technical replicates. (d) Western blot showing lipoic acid (LA) levels linked to Muc (ortholog of yeast Lat1 and a component of PDH complex in fruit fly) and CG5214 (ortholog of yeast Kgd2 and a component of OGDH complex in fruit fly) in mecr mutants. (e) Effects of a transgene containing mecr-GFP (Fosmid clone, CBGtg9060C0290D) 36 or of ubiquitous expression of HA-tagged fly mecr on mecrTG4 homozygous mutants. One-way ANOVA followed by a Tukey’s post-hoc test was performed for the statistical analyses. Error bars represent SEM (****p < 0.0001).
Extended Data Fig. 2: The variants observed in patients are conserved in the fly Mecr protein and homozygous mecr mutants are not fully rescued by expressing these MECR variants.
(a) Protein alignments of Mecr proteins. Red boxes indicate the amino acid that are variant in MEPAN patients. Schema shows the relative position of the patient variants in MECR protein. (b) Effects of ubiquitous expression of human MECR variants when driven by da-GAL4 in mecr mutants. (c) Percentage of 15-day-old flies that are able to climb 8 cm within 30 seconds. Each dot represents the percentage of flies from three independent experiments. (d) Average time taken by 15-day-old flies to climb 8 cm. Each dot represents the time taken by one fly in each of the three experiments. n = 93 (MECRRef), n = 86 (MECRArg258Trp), n = 84 (MECRGly232Glu) flies. One-way ANOVA followed by a Tukey’s post-hoc test was performed for the statistical analyses. Error bars represent SEM (****p < 0.0001).
Extended Data Fig. 3: Loss of mecr causes a reduction in lifespan as well as in climbing ability.
(a-b) Western blot and quantification showing relative levels of Mecr protein upon neuronal knockdown (elav-GAL4) with two different RNAi lines at 25°C. Each dot represents the data from three independent experiments. For statistical analyses, one-way ANOVA followed by a Dunnett’s multiple comparison test is carried out. Error bars represent SEM (**p < 0.01). (c) Lifespan of flies with neuronal knockdown of mecr. (d) Percentage of 25-day-old flies that can climb 8 cm within 30 seconds. Each dot represents the percentage of flies from three independent experiments. (e) Average time taken by 25-day-old flies to climb 8 cm. n = 128 (luci-RNAi) and n = 55 (mecr-RNAi) flies. For statistical analyses, two-tailed Student’s t-test is carried out. Error bars represent SEM (*p<0.05; ****p < 0.0001). (f-h) Quantification of ERG traces from 3-5 day-old flies. Each dot represents the data from one fly. n = 8 (Control and mecrA; GR), n = 10 (mecrA) flies. For statistical analyses, one-way ANOVA followed by a Tukey’s post-hoc test is carried out. Error bars represent SEM.
Extended Data Fig. 4: mecr is expressed in neurons and glia, and Fly Mecr and Human MECR proteins are localized to mitochondria.
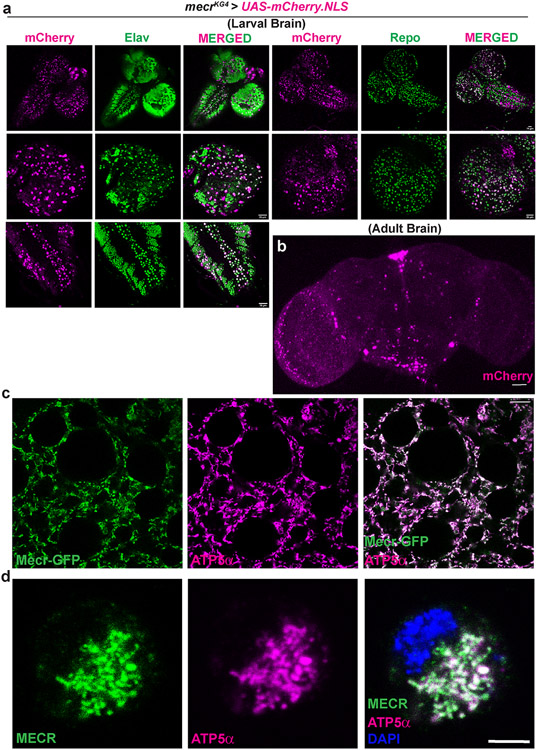
(a) Expression of mCherry driven by mecrKG4 (mecrKozak-GAL4, where we replaced the coding region of the gene with a Kozak sequence followed by a GAL4 gene) in larval brains. Elav-positive cells are neurons and Repo-positive cells are glia. (b) Expression of mCherry driven by mecrKozak-GAL4 in the adult brain. Note that mecr expression is sparse in the adult brains. However, a few cells including the prospective medial neurons, which typically produce insulin-like peptides express it abundantly. Scale bar 50 μm. (c) Colocalization of Mecr-GFP and ATP5α in 3rd instar larval fatbody tissue. Scale bar 10 μm. (d) Colocalization of human MECR and ATP5α in S2 cells. Scale bar 3.5 μm. Immunostaining was performed using an antibody against human MECR protein and an antibody against ATP5α. All experiments were carried out at least 2 times.
Extended Data Fig. 5: RNA levels of MECR are reduced in MEPAN patients and relative levels of phospholipids are differentially altered in patient-derived fibroblasts and mecr mutants.
(a) Pedigree of the two patients with MEPAN syndrome identified through UDN. (b) RNA-seq from blood showing reduced levels of MECR transcripts in both patients. (c-g) Relative phospholipids levels in MEPAN patient-derived fibroblasts compared to the parent-derived control fibroblasts: phosphatidylcholine (PC), phosphatidylethanolamine (PE), phosphatidylinositol (PI), phosphatidylserine (PS) and phosphatidylglycerol (PG). The dots represent values of technical replicates from one set of biological replicates. For statistical analyses one-way ANOVA followed by a Tukey’s post-hoc test are carried out. Error bars represent SEM (*p < 0.05) (h-l) Relative levels of different phospholipids in the mecrTG4 larvae compared to control. The dots represent values of technical replicates from one set of biological replicates (n = 350 2nd instar larva). For statistical analyses, two-tailed Student’s t-test are carried out. Error bars represent SEM (*p < 0.05; ***p < 0.001).
Extended Data Fig. 6: Altered ceramide levels in mecr mutants and human fibroblasts.
(a) Graph showing the ceramide species in the mecrTG4 fly mutant larvae. Data are presented as mean values +/− SEM (b) Graph showing the relative levels of ceramidephosphoethanolamine (CPE) in the mecrTG4 fly mutant larvae. For statistical analyses, two-tailed Student’s t-test are carried out. Error bars represent SEM (***p < 0.001). For a and b, the dots represent values of technical replicates from one set of biological replicates (n= 350 2nd instar larva). (c) Graph showing the ceramide species in both patient fibroblasts. The dots represent values of technical replicates from one set of biological replicates. Data are presented as mean values +/− SEM.
Extended Data Fig. 7: Desipramine and Deferiprone treatment lowers glucosylceramide levels in the fly heads in which mecr is reduced in neurons.
(a-b) Graphs showing the fold changes in different glucosylceramide species upon treatment with Desipramine and Deferiprone at 15- and 25-day timepoints. Each square indicates the average value of three technical replicates.
Extended Data Fig. 8: Loss of mecr/MECR leads to a respiratory deficit.
(a) Relative activity of ETC complexes (CI-IV) in mecrTG4 mutants and controls. mecrTG4 mutant larvae display reduced activity of Complex-I, I+III, and IV and increased activity of Complex-II. Each dot represents data from three technical replicates (n = 150 2nd instar larva). For statistical analyses, two-tailed Student’s t test are carried out. Error bars represent SEM (**p < 0.01; ***p < 0.001****p < 0.0001). (b) Relative levels of ATP in fibroblasts from patients and parental control. Each dot represents the values from four experiments. For statistical analyses, one-way ANOVA followed by a Tukey’s post-hoc test are carried out. Error bars represent SEM (***p < 0.001). (c-e) Relative oxygen consumption rates in control and patient derived fibroblasts as measured by Seahorse analyses. (c) Basal respiration, (d) maximal respiration, and (e) spare respiratory capacity are reduced in the patient-derived fibroblasts compared to fibroblasts derived from parent control. Each dot represents the values of replicates in each well from one set of biological replicates. For statistical analyses one-way ANOVA followed by a Dunnett’s multiple comparisons test are carried out. Error bars represent SEM (*p < 0.05; **p < 0.01; ***p < 0.001). (f) Co-IP from one set of biological replicates shows the interaction between NFS1 and ISCU in the fibroblasts. After performing immunoprecipitation using Mouse Anti-ISCU antibody, the blot was probed for NFS1, stripped, and reblotted for ISCU.
Extended Data Fig. 9: Ferritin levels are low in the additional MEPAN patients and the ATP levels, iron levels and aconitase activity are affected in the fibroblasts of Patient III.
(a) Table showing MEPAN patients including mutations, symptoms, and ferritin levels in blood. Out of these six patients described in the table, one patient (Patient III) was described earlier by Heimer et al., 2016. The other five patients are newly identified individuals who have not been reported elsewhere. (b) Graph showing relative ATP levels in fibroblasts from patient III compared to the fibroblasts from unrelated controls. Each dot represents the values of replicates from three experiments. (c) Graph showing the relative iron levels in the fibroblasts from patient III. Each dot represents the values of replicates from three experiments. (d) Graph showing the relative aconitase activity in the fibroblasts from patient III. Each dot represents the values of replicates from three experiments. For statistical analyses, one-way ANOVA followed by a Tukey’s post-hoc test are carried out. Error bars represent SEM (**p < 0.01).
Extended Data Fig. 10: Reducing iron levels alleviates age-dependent locomotor defects in flies with neuronal knockdown of mecr.
(a-b) Average percentage and climbing time to reach 8 cm of 25-day-old flies with neuronal knockdown of mecr (elav-GAL4>mecr-RNAi) and expressing ferritins. n = 81 (luci-RNAi), n = 76 (mecr-RNAi), n = 74 (mecr-RNAi and Fer1HCH-Fer2LCH) flies. (c-d) Average percentage and climbing time of 25-day-old flies upon neuronal (by elav-GAL4) knockdown of mecr treated with and without low iron food as well as deferiprone. n = 62 (luci-RNAi), n = 155 (mecr-RNAi), n = 105 (mecr-RNAi with low iron food), n = 55 (mecr-RNAi with deferiprone) flies. For a and c, each dot represents the percentage of flies from at least three independent experiments. For b and d, each dot represents the time taken by one fly in at least three independent experiments. (e) Relative amount of iron in the untreated, desipramine and deferiprone-treated fly heads with neuronal knockdown of mecr. Each dot represents the values of replicates from three experiments each using 25 fly heads. (f) Co-IP shows the interaction between Nfs1 and Iscu in the fly heads with neuronal knockdown of mecr. One-way ANOVA followed by a Tukey’s post-hoc test is carried out for statistical analyses. Error bars represent SEM (***p < 0.001; ****p < 0.0001).
Supplementary Material
Acknowledgments
We extend our thanks to the affected individuals and families who participated in this study. We thank the reviewers for their time and insightful comments. We thank Teresa M. Dunn, Danny Miller, Susan J. Hayflick, Alexander J. Kastaniotis, Maimuna S. Paul, and Hyunglok Chung for helpful discussion, Hongling Pan and Wen-Wen Lin for injections to create transgenic flies, and Jinyong Kim for Mass spectrometric analyses. We also thank Alexander J. Kastaniotis at University of Oulu for sharing patient fibroblasts and Norbert Perrimon at Harvard Medical School for sharing S2 cells. We thank Fanis Missirlis at the Center for Research and Advanced Studies of the National Polytechnic Institute for the UAS-Fer1HCH, UAS-Fer2LCH stock. We also thank the Bloomington Drosophila Stock Center, the Vienna Drosophila Resource Center, and the Kyoto Drosophila Genetic Resource Center and the Developmental Studies Hybridoma Bank from the University of Iowa for providing fly stocks and reagents. We acknowledge support from the Shan and Lee-Jun Wong fellowship of Baylor College of Medicine to D.D. We thank the BCM Intellectual and Developmental Disabilities Research Center (IDDRC) confocal microscopy core, supported by the National Institute of Child Health & Human Development (U54 HD083092). H.J.B. is supported by the NIH Common Fund, through the Office of Strategic Coordination/Office of the NIH Director and the NINDS (U54NS093793), NIH/ORIP (R24OD022005 and R24OD031447) and is a recipient of the Chair of the Neurological Research Institute of Texas Children’s Hospital and is supported by the Huffington foundation. The content is solely the responsibility of the authors and does not necessarily represent the official views of the National Institutes of Health.
Undiagnosed Diseases Network
Hugo J. Bellen1,2, Jennefer N. Kohler6, Matthew T. Wheeler6
1 Department of Molecular and Human Genetics, Baylor College of Medicine, Houston, TX, United States.
2 Jan and Dan Duncan Neurological Research Institute, Texas Children’s Hospital, Houston, TX, United States.
6 Division of Cardiovascular Medicine, Stanford University School of Medicine, Stanford, CA, United States.
Footnotes
Declaration of interest
The authors declare that they have no competing interest.
A list of UDN members and their affiliations appears at the supplementary information.
Data availability
All relevant data generated or analyzed in this study are included in this article. All other data supporting the findings of this study are available upon request.
Code availability
No custom code was used for this study.
References
- 1.Maier T, Jenni S & Ban N Architecture of mammalian fatty acid synthase at 4.5 å resolution. Science 311, 1258–1262 (2006). [DOI] [PubMed] [Google Scholar]
- 2.Fhu CW & Ali A Fatty Acid Synthase: An Emerging Target in Cancer. Molecules 25, 3935 (2020). [DOI] [PMC free article] [PubMed] [Google Scholar]
- 3.Miinalainen IJ et al. Characterization of 2-enoyl thioester reductase from mammals. An ortholog of YBR026p/MRF1’p of the yeast mitochondrial fatty acid synthesis type II. J. Biol. Chem 278, 20154–20161 (2003). [DOI] [PubMed] [Google Scholar]
- 4.Nair RR et al. Genetic modifications of Mecr reveal a role for mitochondrial 2-enoyl-CoA/ACP reductase in placental development in mice. Hum. Mol. Genet 26, 2104–2117 (2017). [DOI] [PubMed] [Google Scholar]
- 5.Venkatesan R. et al. Insights into mitochondrial fatty acid synthesis from the structure of heterotetrameric 3-ketoacyl-ACP reductase/3R-hydroxyacyl-CoA dehydrogenase. Nat. Commun 5, (2014). [DOI] [PubMed] [Google Scholar]
- 6.Nowinski SM et al. Mitochondrial fatty acid synthesis coordinates oxidative metabolism in mammalian mitochondria. Elife 9, 1–35 (2020). [DOI] [PMC free article] [PubMed] [Google Scholar]
- 7.Kursu VAS et al. Defects in mitochondrial fatty acid synthesis result in failure of multiple aspects of mitochondrial biogenesis in Saccharomyces cerevisiae. Mol. Microbiol 90, 824–840 (2013). [DOI] [PMC free article] [PubMed] [Google Scholar]
- 8.Torkko JM et al. Candida tropicalis Etr1p and Saccharomyces cerevisiae Ybr026p (Mrf1′p), 2-Enoyl Thioester Reductases Essential for Mitochondrial Respiratory Competence . Mol. Cell. Biol 21, 6243–6253 (2001). [DOI] [PMC free article] [PubMed] [Google Scholar]
- 9.Nair RR et al. Impaired mitochondrial fatty acid synthesis leads to neurodegeneration in mice. J. Neurosci 38, 9781–9800 (2018). [DOI] [PMC free article] [PubMed] [Google Scholar]
- 10.Heimer G. et al. MECR Mutations Cause Childhood-Onset Dystonia and Optic Atrophy, a Mitochondrial Fatty Acid Synthesis Disorder. Am. J. Hum. Genet 99, 1229–1244 (2016). [DOI] [PMC free article] [PubMed] [Google Scholar]
- 11.Gorukmez O, Gorukmez O & Havalı C Novel MECR Mutation in Childhood-Onset Dystonia, Optic Atrophy, and Basal Ganglia Signal Abnormalities. Neuropediatrics 50, 336–337 (2019). [DOI] [PubMed] [Google Scholar]
- 12.Liu Z. et al. Whole exome sequencing identifies a novel homozygous MECR mutation in a Chinese patient with childhood-onset dystonia and basal ganglia abnormalities, without optic atrophy. Mitochondrion 57, 222–229 (2021). [DOI] [PubMed] [Google Scholar]
- 13.Grassi D. et al. Identification of a highly neurotoxic α-synuclein species inducing mitochondrial damage and mitophagy in Parkinson’s disease. Proc. Natl. Acad. Sci. U. S. A 115, E2634–E2643 (2018). [DOI] [PMC free article] [PubMed] [Google Scholar]
- 14.Kastaniotis AJ, Autio KJ & Nair R, R. Mitochondrial Fatty Acids and Neurodegenerative Disorders. Neurosci. 27, 143–158 (2021). [DOI] [PubMed] [Google Scholar]
- 15.Majmudar JD et al. 4′-Phosphopantetheine and long acyl chain-dependent interactions are integral to human mitochondrial acyl carrier protein function. Medchemcomm 10, 209–220 (2019). [DOI] [PMC free article] [PubMed] [Google Scholar]
- 16.Zhang L, Joshi AK, Hofmann J, Schweizer E & Smith S Cloning, expression, and characterization of the human mitochondrial β-ketoacyl synthase: Complementation of the yeast cem1 knock-out strain. J. Biol. Chem 280, 12422–12429 (2005). [DOI] [PubMed] [Google Scholar]
- 17.Masud AJ, Kastaniotis AJ, Rahman MT, Autio KJ & Hiltunen JK Mitochondrial acyl carrier protein (ACP) at the interface of metabolic state sensing and mitochondrial function. Biochim. Biophys. Acta - Mol. Cell Res 1866, 118540 (2019). [DOI] [PubMed] [Google Scholar]
- 18.Kastaniotis AJ et al. Mitochondrial fatty acid synthesis, fatty acids and mitochondrial physiology. Biochim. Biophys. Acta - Mol. Cell Biol. Lipids 1862, 39–48 (2017). [DOI] [PubMed] [Google Scholar]
- 19.Solmonson A & DeBerardinis RJ Lipoic acid metabolism and mitochondrial redox regulation. J. Biol. Chem 293, 7522–7530 (2018). [DOI] [PMC free article] [PubMed] [Google Scholar]
- 20.Hiltunen JK et al. Mitochondrial fatty acid synthesis and respiration. Biochim. Biophys. Acta - Bioenerg 1797, 1195–1202 (2010). [DOI] [PubMed] [Google Scholar]
- 21.Schneider R, Massow M, Lisowsky T & Weiss H Different respiratory-defective phenotypes of Neurospora crassa and Saccharomyces cerevisiae after inactivation of the gene encoding the mitochondrial acyl carrier protein. Curr. Genet 29, 10–17 (1995). [DOI] [PubMed] [Google Scholar]
- 22.Guler JL, Kriegova E, Smith TK, Lukeš J & Englund PT Mitochondrial fatty acid synthesis is required for normal mitochondrial morphology and function in Trypanosoma brucei. Mol. Microbiol 67, 1125–1142 (2008). [DOI] [PMC free article] [PubMed] [Google Scholar]
- 23.Clay HB et al. Altering the mitochondrial fatty acid synthesis (mtFASII) pathway modulates cellular metabolic states and bioactive lipid profiles AS revealed by metabolomic profiling. PLoS One 11, 1–23 (2016). [DOI] [PMC free article] [PubMed] [Google Scholar]
- 24.Kanca O. et al. An efficient CRISPR-based strategy to insert small and large fragments of DNA using short homology arms. Elife 8, e51539 (2019). [DOI] [PMC free article] [PubMed] [Google Scholar]
- 25.Lee PT et al. A gene-specific T2A-GAL4 library for drosophila. Elife 7, e35574 (2018). [DOI] [PMC free article] [PubMed] [Google Scholar]
- 26.Schuldiner O. et al. piggyBac-Based Mosaic Screen Identifies a Postmitotic Function for Cohesin in Regulating Developmental Axon Pruning. Dev. Cell 14, 227–238 (2008). [DOI] [PMC free article] [PubMed] [Google Scholar]
- 27.Venken KJT et al. Versatile P[acman] BAC libraries for transgenesis studies in Drosophila melanogaster. Nat. Methods 6, 431–434 (2009). [DOI] [PMC free article] [PubMed] [Google Scholar]
- 28.Hu Y. et al. An integrative approach to ortholog prediction for disease-focused and other functional studies. BMC Bioinformatics 12, 357 (2011). [DOI] [PMC free article] [PubMed] [Google Scholar]
- 29.Wang J. et al. MARRVEL: Integration of Human and Model Organism Genetic Resources to Facilitate Functional Annotation of the Human Genome. Am. J. Hum. Genet 100, 843–853 (2017). [DOI] [PMC free article] [PubMed] [Google Scholar]
- 30.Golic KG & Lindquist S The FLP recombinase of yeast catalyzes site-specific recombination in the drosophila genome. Cell 59, 499–509 (1989). [DOI] [PubMed] [Google Scholar]
- 31.Xu T & Rubin GM Analysis of genetic mosaics in developing and adult Drosophila tissues. Development 117, 1223–1237 (1993). [DOI] [PubMed] [Google Scholar]
- 32.Yamazoe M. et al. A protein which binds preferentially to single-stranded core sequence of autonomously replicating sequence is essential for respiratory function in mitochondria of Saccharomyces cerevisiae. J. Biol. Chem 269, 15244–15252 (1994). [PubMed] [Google Scholar]
- 33.Kim DG et al. A novel cytosolic isoform of mitochondrial trans-2-enoyl-CoA reductase enhances peroxisome proliferator-activated receptor a activity. Endocrinol. Metab 29, 185–194 (2014). [DOI] [PMC free article] [PubMed] [Google Scholar]
- 34.Masuda N. et al. Nuclear receptor binding factor-1 (NRBF-1), a protein interacting with a wide spectrum of nuclear hormone receptors. Gene 221, 225–233 (1998). [DOI] [PubMed] [Google Scholar]
- 35.Parl A. et al. The mitochondrial fatty acid synthesis (mtFASII) pathway is capable of mediating nuclear-mitochondrial cross talk through the PPAR system of transcriptional activation. Biochem. Biophys. Res. Commun 441, 418–424 (2013). [DOI] [PMC free article] [PubMed] [Google Scholar]
- 36.Sarov M. et al. A genome-wide resource for the analysis of protein localisation in Drosophila. Elife 5, e12068 (2016). [DOI] [PMC free article] [PubMed] [Google Scholar]
- 37.Yoon WH et al. Loss of Nardilysin, a Mitochondrial Co-chaperone for α-Ketoglutarate Dehydrogenase, Promotes mTORC1 Activation and Neurodegeneration. Neuron 93, 115–131 (2017). [DOI] [PMC free article] [PubMed] [Google Scholar]
- 38.Baqri RM et al. Disruption of mitochondrial DNA replication in Drosophila increases mitochondrial fast axonal transport in vivo. PLoS One 4, e7874 (2009). [DOI] [PMC free article] [PubMed] [Google Scholar]
- 39.Splinter K. et al. Effect of Genetic Diagnosis on Patients with Previously Undiagnosed Disease. N. Engl. J. Med 379, 2131–2139 (2018). [DOI] [PMC free article] [PubMed] [Google Scholar]
- 40.Ishibashi Y, Kohyama-Koganeya A & Hirabayashi Y New insights on glucosylated lipids: Metabolism and functions. Biochim. Biophys. Acta - Mol. Cell Biol. Lipids 1831, 1475–1485 (2013). [DOI] [PubMed] [Google Scholar]
- 41.Checa A. et al. Hexosylceramides as intrathecal markers of worsening disability in multiple sclerosis. Mult. Scler 21, 1271–1279 (2015). [DOI] [PubMed] [Google Scholar]
- 42.Vos M. et al. Ceramide accumulation induces mitophagy and impairs β-oxidation in PINK1 deficiency. Proc. Natl. Acad. Sci. U. S. A 118, e2025347118 (2021). [DOI] [PMC free article] [PubMed] [Google Scholar]
- 43.Miyake Y, Kozutsumi Y, Nakamura S, Fujita T & Kawasaki T Serine palmitoyltransferase is the primary target of a sphingosine-like immunosuppressant, ISP-1/myriocin. Biochemical and Biophysical Research Communications 211, 396–403 (1995). [DOI] [PubMed] [Google Scholar]
- 44.Lin G. et al. Phospholipase PLA2G6, a Parkinsonism-Associated Gene, Affects Vps26 and Vps35, Retromer Function, and Ceramide Levels, Similar to α-Synuclein Gain. Cell Metab. 28, 605–618.e6 (2018). [DOI] [PubMed] [Google Scholar]
- 45.Jaiswal M. et al. Impaired mitochondrial energy production causes light-induced photoreceptor degeneration independent of oxidative stress. PLoS Biol. 13, (2015). [DOI] [PMC free article] [PubMed] [Google Scholar]
- 46.Ozaki M, Le TD & Inoue YH Downregulating Mitochondrial DNA Polymerase γ in the Muscle Stimulated Autophagy, Apoptosis, and Muscle Aging-Related Phenotypes in Drosophila Adults. Biomolecules 12, 1105 (2022). [DOI] [PMC free article] [PubMed] [Google Scholar]
- 47.Larsen SB, Hanss Z & Krüger R The genetic architecture of mitochondrial dysfunction in Parkinson’s disease. Cell Tissue Res. 373, 21–37 (2018). [DOI] [PMC free article] [PubMed] [Google Scholar]
- 48.Zorova LD et al. Mitochondrial membrane potential. Anal. Biochem 552, 50–59 (2018). [DOI] [PMC free article] [PubMed] [Google Scholar]
- 49.Scaduto RC & Grotyohann LW Measurement of mitochondrial membrane potential using fluorescent rhodamine derivatives. Biophys. J 76, 469–477 (1999). [DOI] [PMC free article] [PubMed] [Google Scholar]
- 50.Donti TR et al. Screen for abnormal mitochondrial phenotypes in mouse embryonic stem cells identifies a model for succinyl-CoA ligase deficiency and mtDNA depletion. DMM Dis. Model. Mech 7, 271–280 (2014). [DOI] [PMC free article] [PubMed] [Google Scholar]
- 51.Ji R. et al. Increased de novo ceramide synthesis and accumulation in failing myocardium. JCI insight 2, e82922 (2017). [DOI] [PMC free article] [PubMed] [Google Scholar]
- 52.Srivastava S. et al. SPTSSA Variants Alter Sphingolipid Synthesis and Cause a Complex Hereditary Spastic Paraplegia. Brain (Accepted Manuscript) (2022). [DOI] [PMC free article] [PubMed] [Google Scholar]
- 53.Chen K. et al. Loss of frataxin activates the iron/sphingolipid/PDK1/Mef2 pathway in mammals. Elife 5, 1–14 (2016). [DOI] [PMC free article] [PubMed] [Google Scholar]
- 54.Chen K. et al. Loss of frataxin induces iron toxicity, sphingolipid synthesis, and Pdk1/Mef2 activation, leading to neurodegeneration. Elife 5, 1–24 (2016). [DOI] [PMC free article] [PubMed] [Google Scholar]
- 55.Lee YJ et al. Sphingolipid signaling mediates iron toxicity. Cell Metab. 16, 90–96 (2012). [DOI] [PMC free article] [PubMed] [Google Scholar]
- 56.Maio N & Rouault TA Outlining the Complex Pathway of Mammalian Fe-S Cluster Biogenesis. Trends Biochem. Sci 45, 411–426 (2020). [DOI] [PMC free article] [PubMed] [Google Scholar]
- 57.Meguro R. et al. Nonheme-iron histochemistry for light end electorn microscopy: a historical, theoretical and technical review. Archives of Histology and Cytology 70, 1–19 (2007). [DOI] [PubMed] [Google Scholar]
- 58.Galaris D, Barbouti A & Pantopoulos K Iron homeostasis and oxidative stress: An intimate relationship. Biochim. Biophys. Acta - Mol. Cell Res 1866, 118535 (2019). [DOI] [PubMed] [Google Scholar]
- 59.Dixon SJ & Stockwell BR The role of iron and reactive oxygen species in cell death. Nat. Chem. Biol 10, 9–17 (2014). [DOI] [PubMed] [Google Scholar]
- 60.Houglum K, Filip M, Witztum JL & Chojkier M Malondialdehyde and 4-hydroxynonenal protein adducts in plasma and liver of rats with iron overload. J. Clin. Invest. 86, 1991–1998 (1990). [DOI] [PMC free article] [PubMed] [Google Scholar]
- 61.Csala M. et al. On the role of 4-hydroxynonenal in health and disease. Biochim. Biophys. Acta - Mol. Basis Dis 1852, 826–838 (2015). [DOI] [PubMed] [Google Scholar]
- 62.Kruman I, Bruce-Keller AJ, Bredesen D, Waeg G & Mattson MP Evidence that 4-hydroxynonenal mediates oxidative stress-induced neuronal apoptosis. J. Neurosci 17, 5089–5100 (1997). [DOI] [PMC free article] [PubMed] [Google Scholar]
- 63.Chung H. lok et al. Loss- or Gain-of-Function Mutations in ACOX1 Cause Axonal Loss via Different Mechanisms. Neuron 106, 589–606.e6 (2020). [DOI] [PMC free article] [PubMed] [Google Scholar]
- 64.Knovich MA, Storey JA, Coffman LG, Torti SV & Torti FM Ferritin for the clinician. Blood Rev. 23, 95–104 (2009). [DOI] [PMC free article] [PubMed] [Google Scholar]
- 65.Missirlis F. et al. Homeostatic mechanisms for iron storage revealed by genetic manipulations and live imaging of Drosophila ferritin. Genetics 177, 89–100 (2007). [DOI] [PMC free article] [PubMed] [Google Scholar]
- 66.Soriano S. et al. Deferiprone and idebenone rescue frataxin depletion phenotypes in a Drosophila model of Friedreich’s ataxia. Gene 521, 274–281 (2013). [DOI] [PubMed] [Google Scholar]
- 67.Elincx-Benizri S. et al. Clinical Experience with Deferiprone Treatment for Friedreich Ataxia. J. Child Neurol. 31, 1036–1040 (2016). [DOI] [PubMed] [Google Scholar]
- 68.Vanlander AV & Van Coster R Clinical and genetic aspects of defects in the mitochondrial iron–sulfur cluster synthesis pathway. J. Biol. Inorg. Chem 23, 495–506 (2018). [DOI] [PMC free article] [PubMed] [Google Scholar]
- 69.Isaya G. Mitochondrial iron-sulfur cluster dysfunction in neurodegenerative disease. Front. Pharmacol 5, 1–7 (2014). [DOI] [PMC free article] [PubMed] [Google Scholar]
- 70.Van Vranken JG et al. The mitochondrial acyl carrier protein (ACP) coordinates mitochondrial fatty acid synthesis with iron sulfur cluster biogenesis. Elife 5, 1–11 (2016). [DOI] [PMC free article] [PubMed] [Google Scholar]
- 71.Cory SA et al. Structure of human Fe-S assembly subcomplex reveals unexpected cysteine desulfurase architecture and acyl-ACP-ISD11 interactions. Proc. Natl. Acad. Sci. U. S. A 114, E5325–E5334 (2017). [DOI] [PMC free article] [PubMed] [Google Scholar]
- 72.Castro L, Tórtora V, Mansilla S & Radi R Aconitases: Non-redox Iron-Sulfur Proteins Sensitive to Reactive Species. Acc. Chem. Res 52, 2609–2619 (2019). [DOI] [PubMed] [Google Scholar]
- 73.Cheng Z, Tsuda M, Kishita Y, Sato Y & Aigaki T Impaired energy metabolism in a Drosophila model of mitochondrial aconitase deficiency. Biochem. Biophys. Res. Commun 433, 145–150 (2013). [DOI] [PubMed] [Google Scholar]
- 74.Crooks DR et al. Acute loss of iron–sulfur clusters results in metabolic reprogramming and generation of lipid droplets in mammalian cells. J. Biol. Chem 293, 8297–8311 (2018). [DOI] [PMC free article] [PubMed] [Google Scholar]
- 75.Cho YH, Kim GH & Park JJ Mitochondrial aconitase 1 regulates age-related memory impairment via autophagy/mitophagy-mediated neural plasticity in middle-aged flies. Aging Cell 20, e13520 (2021). [DOI] [PMC free article] [PubMed] [Google Scholar]
- 76.Olona A. et al. Sphingolipid metabolism during Toll-like receptor 4 (TLR4)-mediated macrophage activation. Br. J. Pharmacol 178, 4575–4587 (2021). [DOI] [PubMed] [Google Scholar]
- 77.Reginato A. et al. The role of fatty acids in ceramide pathways and their influence on hypothalamic regulation of energy balance: a systematic review. Int. J. Mol. Sci 22, 5357 (2021). [DOI] [PMC free article] [PubMed] [Google Scholar]
- 78.Nowinski SM, Van Vranken JG, Dove KK & Rutter J Impact of Mitochondrial Fatty Acid Synthesis on Mitochondrial Biogenesis. Curr. Biol 28, R1212–R1219 (2018). [DOI] [PMC free article] [PubMed] [Google Scholar]
- 79.Brody S & Mikolajczyk S Neurospora mitochondria contain an acyl-carrier protein. Eur. J. Biochem 173, 353–359 (1988). [DOI] [PubMed] [Google Scholar]
- 80.Stith JL, Velazquez FN & Obeid LM Advances in determining signaling mechanisms of ceramide and role in disease. J. Lipid Res 60, 913–918 (2019). [DOI] [PMC free article] [PubMed] [Google Scholar]
- 81.Pinto SN, Silva LC, Futerman AH & Prieto M Effect of ceramide structure on membrane biophysical properties: The role of acyl chain length and unsaturation. Biochim. Biophys. Acta - Biomembr 1808, 2753–2760 (2011). [DOI] [PubMed] [Google Scholar]
- 82.Alonso A & Goñi FM The Physical Properties of Ceramides in Membranes. Annu. Rev. Biophys 47, 633–654 (2018). [DOI] [PubMed] [Google Scholar]
- 83.Rao RP & Acharya JK Sphingolipids and membrane biology as determined from genetic models. Prostaglandins Other Lipid Mediat. 85, 1–16 (2008). [DOI] [PMC free article] [PubMed] [Google Scholar]
- 84.Hernández-Corbacho MJ, Salama MF, Canals D, Senkal CE & Obeid LM Sphingolipids in mitochondria. Biochim. Biophys. Acta - Mol. Cell Biol. Lipids 1862, 56–68 (2017). [DOI] [PMC free article] [PubMed] [Google Scholar]
- 85.Kogot-Levin A & Saada A Ceramide and the mitochondrial respiratory chain. Biochimie 100, 88–94 (2014). [DOI] [PubMed] [Google Scholar]
- 86.Alessenko AV & Albi E Exploring Sphingolipid Implications in Neurodegeneration. Front. Neurol 11, 437 (2020). [DOI] [PMC free article] [PubMed] [Google Scholar]
- 87.van Kruining D. et al. Sphingolipids as prognostic biomarkers of neurodegeneration, neuroinflammation, and psychiatric diseases and their emerging role in lipidomic investigation methods. Adv. Drug Deliv. Rev 159, 232–244 (2020). [DOI] [PMC free article] [PubMed] [Google Scholar]
- 88.Wang D. et al. Skin fibroblast metabolomic profiling reveals that lipid dysfunction predicts the severity of Friedreich ’ s ataxia. J. Lipid Res 63, 100255 (2022). [DOI] [PMC free article] [PubMed] [Google Scholar]
- 89.Anderson PR, Kirby K, Hilliker AJ & Phillips JP RNAi-mediated suppression of the mitochondrial iron chaperone, frataxin, in Drosophila. Hum. Mol. Genet 14, 3397–3405 (2005). [DOI] [PubMed] [Google Scholar]
- 90.Esposito G. et al. Aconitase Causes Iron Toxicity in Drosophila pink1 Mutants. PLoS Genet. 9, (2013). [DOI] [PMC free article] [PubMed] [Google Scholar]
- 91.Custodia A. et al. Ceramide Metabolism and Parkinson ’ s Disease — Therapeutic Targets. Biomolecules 11, 945 (2021). [DOI] [PMC free article] [PubMed] [Google Scholar]
- 92.Thomas GEC et al. Regional brain iron and gene expression provide insights into neurodegeneration in Parkinson’s disease. Brain 144, 1787–1798 (2021). [DOI] [PMC free article] [PubMed] [Google Scholar]
- 93.Foley PB, Hare DJ & Double KL A brief history of brain iron accumulation in Parkinson disease and related disorders. J. Neural Transm 129, 505–520 (2022). [DOI] [PMC free article] [PubMed] [Google Scholar]
- 94.Oakley AE et al. Individual dopaminergic neurons show raised iron levels in Parkinson disease. Neurology 68, 1820–1825 (2007). [DOI] [PubMed] [Google Scholar]
- 95.Wang JY et al. Meta-analysis of brain iron levels of Parkinson’s disease patients determined by postmortem and MRI measurements. Sci. Rep 6, 36669 (2016). [DOI] [PMC free article] [PubMed] [Google Scholar]
- 96.Schweitzer KJ et al. Transcranial ultrasound in different monogenetic subtypes of Parkinson’s disease. J. Neurol 254, 613–616 (2007). [DOI] [PubMed] [Google Scholar]
- 97.Pan X, Dutta D, Lu S & Bellen HJ Sphingolipids in neurodegenerative diseases. Front. Neurosci 17, 17:1137893 (2023). [DOI] [PMC free article] [PubMed] [Google Scholar]
- 98.Sawada M. et al. P53 Regulates Ceramide Formation By Neutral Sphingomyelinase Through Reactive Oxygen Species in Human Glioma Cells. Oncogene 20, 1368–1378 (2001). [DOI] [PubMed] [Google Scholar]
- 99.Li X, Gulbins E & Zhang Y Oxidative stress triggers Ca 2+ -dependent lysosome trafficking and activation of acid sphingomyelinase. Cell. Physiol. Biochem 30, 815–826 (2012). [DOI] [PMC free article] [PubMed] [Google Scholar]
- 100.Schalinske KL et al. The iron-sulfur cluster of iron regulatory protein 1 modulates the accessibility of RNA binding and phosphorylation sites. Biochemistry 36, 3950–3958 (1997). [DOI] [PubMed] [Google Scholar]
- 101.Levi S & Rovida E Neuroferritinopathy: From ferritin structure modification to pathogenetic mechanism. Neurobiol. Dis 81, 134–143 (2015). [DOI] [PMC free article] [PubMed] [Google Scholar]
- 102.Kumar N, Rizek P & Jog M Neuroferritinopathy: Pathophysiology, presentation, differential diagnoses and management. Tremor and Other Hyperkinetic Movements 2016, 1–10 (2016). [DOI] [PMC free article] [PubMed] [Google Scholar]
- 103.Muhoberac BB & Vidal R Iron, Ferritin, Hereditary Ferritinopathy, and Neurodegeneration. Front. Neurosci 13, 1195 (2019). [DOI] [PMC free article] [PubMed] [Google Scholar]
- 104.Port F, Chen HM, Lee T & Bullock SL Optimized CRISPR/Cas tools for efficient germline and somatic genome engineering in Drosophila. Proc. Natl. Acad. Sci. U. S. A 111, E2967–E2976 (2014). [DOI] [PMC free article] [PubMed] [Google Scholar]
- 105.Kanca O. et al. An expanded toolkit for Drosophila gene tagging using synthesized homology donor constructs for CRISPR-mediated homologous recombination. Elife 11, e76077 (2022). [DOI] [PMC free article] [PubMed] [Google Scholar]
- 106.Dutta D. et al. De novo mutations in TOMM70, a receptor of the mitochondrial import translocase, cause neurological impairment. Hum. Mol. Genet. 22, 1568–1579 (2020). [DOI] [PMC free article] [PubMed] [Google Scholar]
- 107.Marcogliese PC et al. IRF2BPL Is Associated with Neurological Phenotypes. Am. J. Hum. Genet 103, 245–260 (2018). [DOI] [PMC free article] [PubMed] [Google Scholar]
- 108.Marcogliese PC et al. Loss of IRF2BPL impairs neuronal maintenance through excess Wnt signaling. Sci. Adv 8, eabl5613 (2022). [DOI] [PMC free article] [PubMed] [Google Scholar]
- 109.Lee JW et al. UPLC-QqQ/MS-Based Lipidomics Approach to Characterize Lipid Alterations in Inflammatory Macrophages. J. Proteome Res 16, 1460–1469 (2017). [DOI] [PubMed] [Google Scholar]
- 110.Radenkovic S. et al. Expanding the clinical and metabolic phenotype of DPM2 deficient congenital disorders of glycosylation. Mol. Genet. Metab 132, 27–37 (2021). [DOI] [PMC free article] [PubMed] [Google Scholar]
- 111.Byeon SK, Madugundu AK & Pandey A Automated data-driven mass spectrometry for improved analysis of lipids with dual dissociation techniques. J. Mass Spectrom. Adv. Clin. Lab 22, 43–49 (2021). [DOI] [PMC free article] [PubMed] [Google Scholar]
- 112.Mitchell CJ, Kim MS, Na CH & Pandey A PyQuant: A versatile framework for analysis of quantitative mass spectrometry data. Mol. Cell. Proteomics 15, 2829–2838 (2016). [DOI] [PMC free article] [PubMed] [Google Scholar]
- 113.Frazier AE & Thorburn DR Biochemical Analyses of the Electron Transport Chain Complexes by Spectrophotometry. in Mitochondrial Disorders 837, 49–62 (2012). [DOI] [PubMed] [Google Scholar]
- 114.Missirlis F. et al. Characterization of mitochondrial ferritin in Drosophila. Proc. Natl. Acad. Sci. U. S. A 103, 5893–5898 (2006). [DOI] [PMC free article] [PubMed] [Google Scholar]
- 115.Schober FA et al. The one-carbon pool controls mitochondrial energy metabolism via complex i and iron-sulfur clusters. Sci. Adv 7, (2021). [DOI] [PMC free article] [PubMed] [Google Scholar]
- 116.Martelli F. et al. Low doses of the neonicotinoid insecticide imidacloprid induce ROS triggering neurological and metabolic impairments in Drosophila. Proc. Natl. Acad. Sci. U. S. A 117, 25840–25850 (2020). [DOI] [PMC free article] [PubMed] [Google Scholar]
- 117.Dutta D, Paul MS, Singh A, Mutsuddi M & Mukherjee A Regulation of Notch Signaling by the Heterogeneous Nuclear Ribonucleoprotein Hrp48 and Deltex in Drosophila melanogaster. Genetics 206, 905–918 (2017). [DOI] [PMC free article] [PubMed] [Google Scholar]
Associated Data
This section collects any data citations, data availability statements, or supplementary materials included in this article.
Supplementary Materials
Data Availability Statement
All relevant data generated or analyzed in this study are included in this article. All other data supporting the findings of this study are available upon request.
No custom code was used for this study.


