

Abstract
The basal ganglia are known to influence action selection and modulation of movement vigor, but whether and how they contribute to specifying the kinematics of learned motor skills is not understood. Here, we probe this question by recording and manipulating basal ganglia activity in rats trained to generate complex task-specific movement patterns with rich kinematic structure. We find that the sensorimotor arm of the basal ganglia circuit is crucial for generating the detailed movement patterns underlying the acquired motor skills. Furthermore, the neural representations in the striatum, and the control function they subserve, do not depend on inputs from the motor cortex. Taken together, these results extend our understanding of the basal ganglia by showing that they can specify and control the fine-grained details of learned motor skills through their interactions with lower-level motor circuits.
Much of what we do in our daily lives – be it tying our shoelaces or playing sports – relies on our brain’s ability to learn and execute stereotyped task-specific motor skills1. The basal ganglia (BG), a collection of phylogenetically conserved midbrain structures2, have been implicated in their acquisition and proper execution3,4. Yet, despite intense interest in deciphering BG function, whether and how they contribute to generating the complex movement patterns that underlie many motor skills remains unclear.
Most studies of BG function do not explicitly probe this realm of motor learning, focusing instead on how species-typical actions, i.e. ones natively part of the animal’s behavioral repertoire (e.g. locomotion, saccades or ballistic forelimb movements), become associated with a particular cue or context5–11. Acquiring a motor skill, such as a tennis serve, requires additional trial-and-error learning, an often lengthy process12 that transforms actions expressed by the naïve practitioner into highly specialized and kinematically distinct task-specific movement patterns13. Our study asks what contribution, if any, the BG make to the specification and generation of such learned skills.
BG’s contributions to learned behaviors can be intuitively parsed within the framework of reinforcement learning (RL)14. In this scheme, striatum, BG’s input zone, ‘learns’ to map information about the ‘state’ of the world/body onto ‘action’ variants that yield reward15–18. State information is thought to be conveyed to the striatum by cortex and thalamus15,17,18 while BG’s output, from Substantia Nigra pars reticulata (SNr) and Globus Pallidus internal segment (GPi), can influence control circuits in the midbrain, brainstem and motor cortex19,20 (Figs. 1A, 2A).
Figure 1:
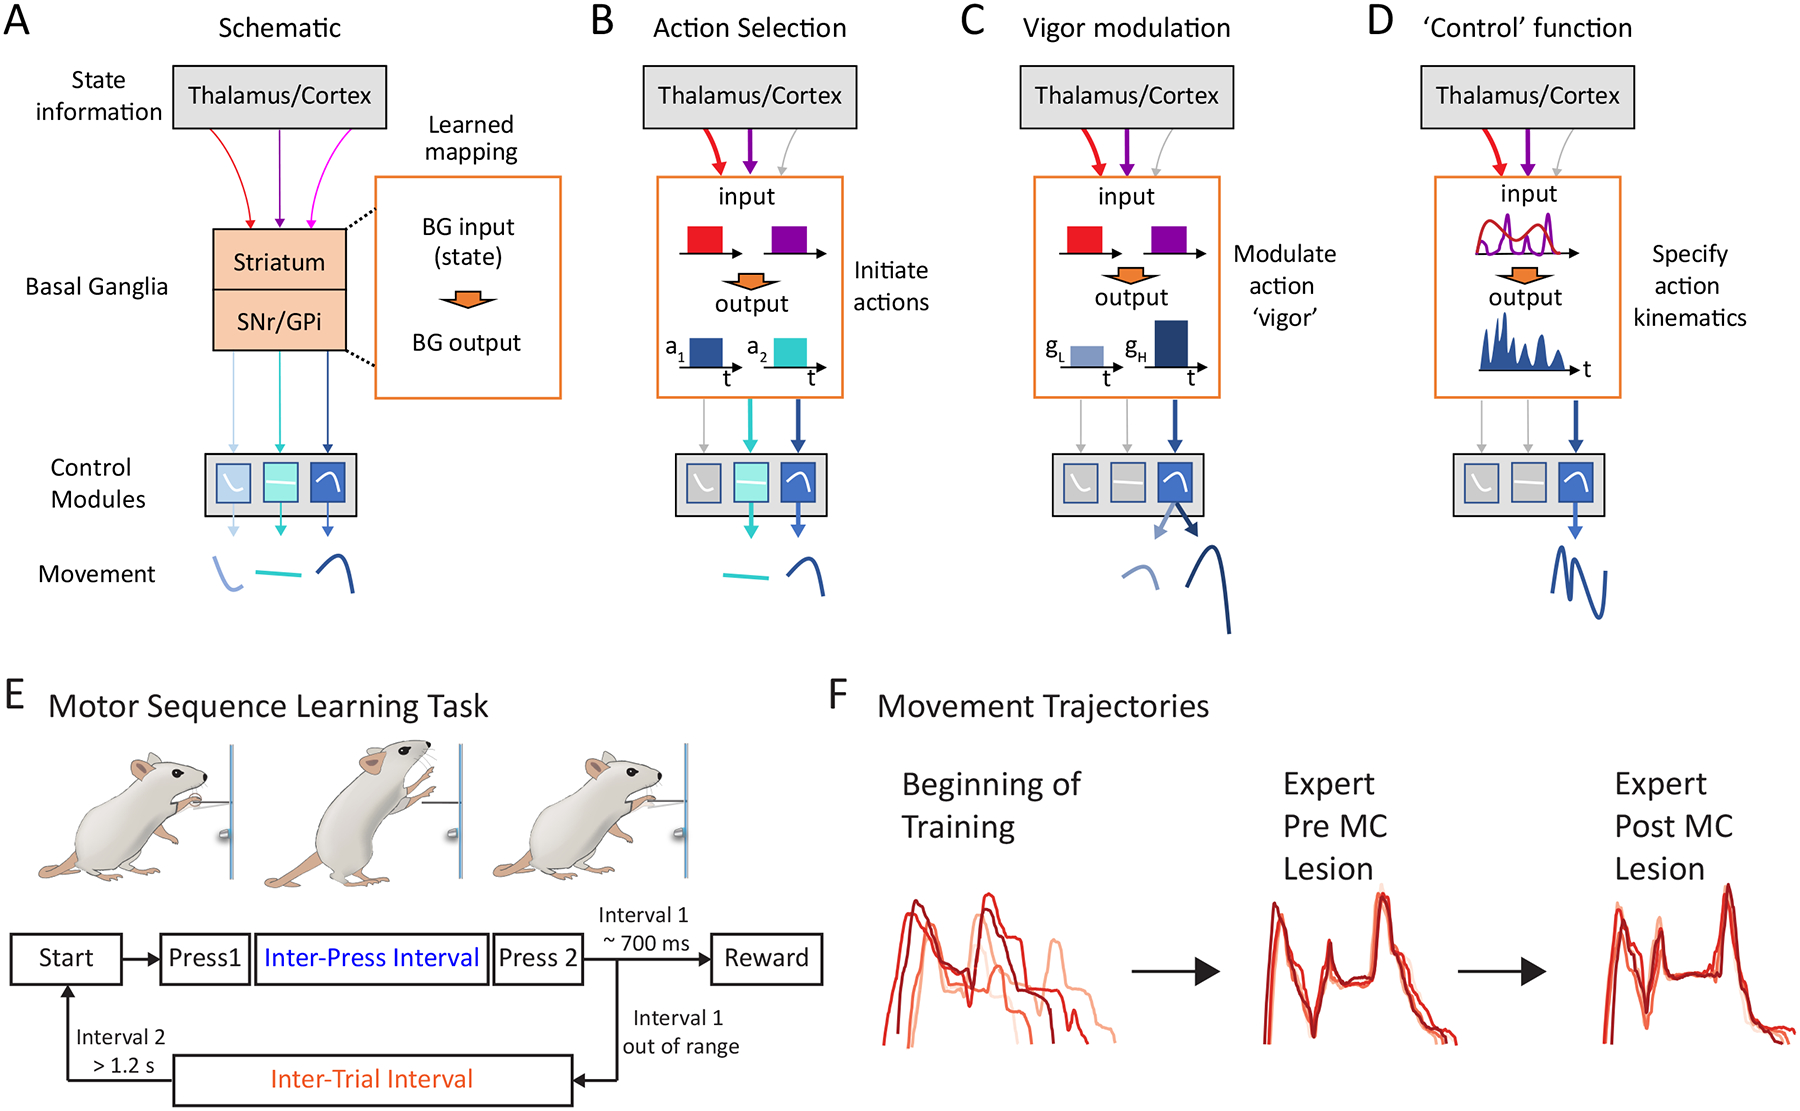
A hypothesized function for the BG in specifying the detailed kinematics of learned motor skills.
A. Simple schematic of the BG and how they influence motor output by modulating downstream control circuits. The BG receive state information about environment, ongoing actions and internal states from cortical and thalamic inputs. Whether and how BG influence motor output will depend on the learned mapping (orange box) between inputs carrying state information and outputs influencing control circuits in midbrain/brainstem and motor cortex (blue, cyan and light blue boxes represent actions specified in downstream control modules). These maps, or ‘policies’, are acquired through a process of reinforcement learning and encode relationships between states and actions that predict reward.
B. Action selection: BG learn to map states to actions and generate output patterns that help initiate a particular action (a1 or a2) (pre-specified in downstream circuits, blue boxes) in each state (red/purple arrows).
C. Vigor modulation: Similarly, BG can learn to generate output that alters the gain (g), or ‘vigor’, of an action specified in downstream circuits in a state-dependent manner. Two scenarios are sketched out for low (gL) and high (gH) gain respectively.
D. Kinematic control: A putative ‘control’ function for the BG tested in this study. This model assumes that BG output can influence motor output in spatiotemporally precise ways by interacting with downstream controllers, and that BG can learn and store ‘kinematic policies’ that specify novel adaptive movements and actions. This model requires the BG to associate incoming state information and outgoing activity patterns on a much finer timescale and with more specificity than assumed for prior models.
E. Behavioral paradigm to probe the BG’s role in motor skill execution13. Rats are rewarded for pressing a lever twice with a specific target interval (inter-press interval - IPI). After unsuccessful trials, animals can only initiate a new trial after refraining from pressing the lever for a given inter-trial interval (ITI).
F. Over the course of training, animals develop stereotyped movement patterns to solve the task. These learned behaviors are preserved in largely unaltered form after motor cortex lesions13. Shown are forelimb trajectories in the vertical dimension from four randomly selected trials in each condition.
Figure 2:
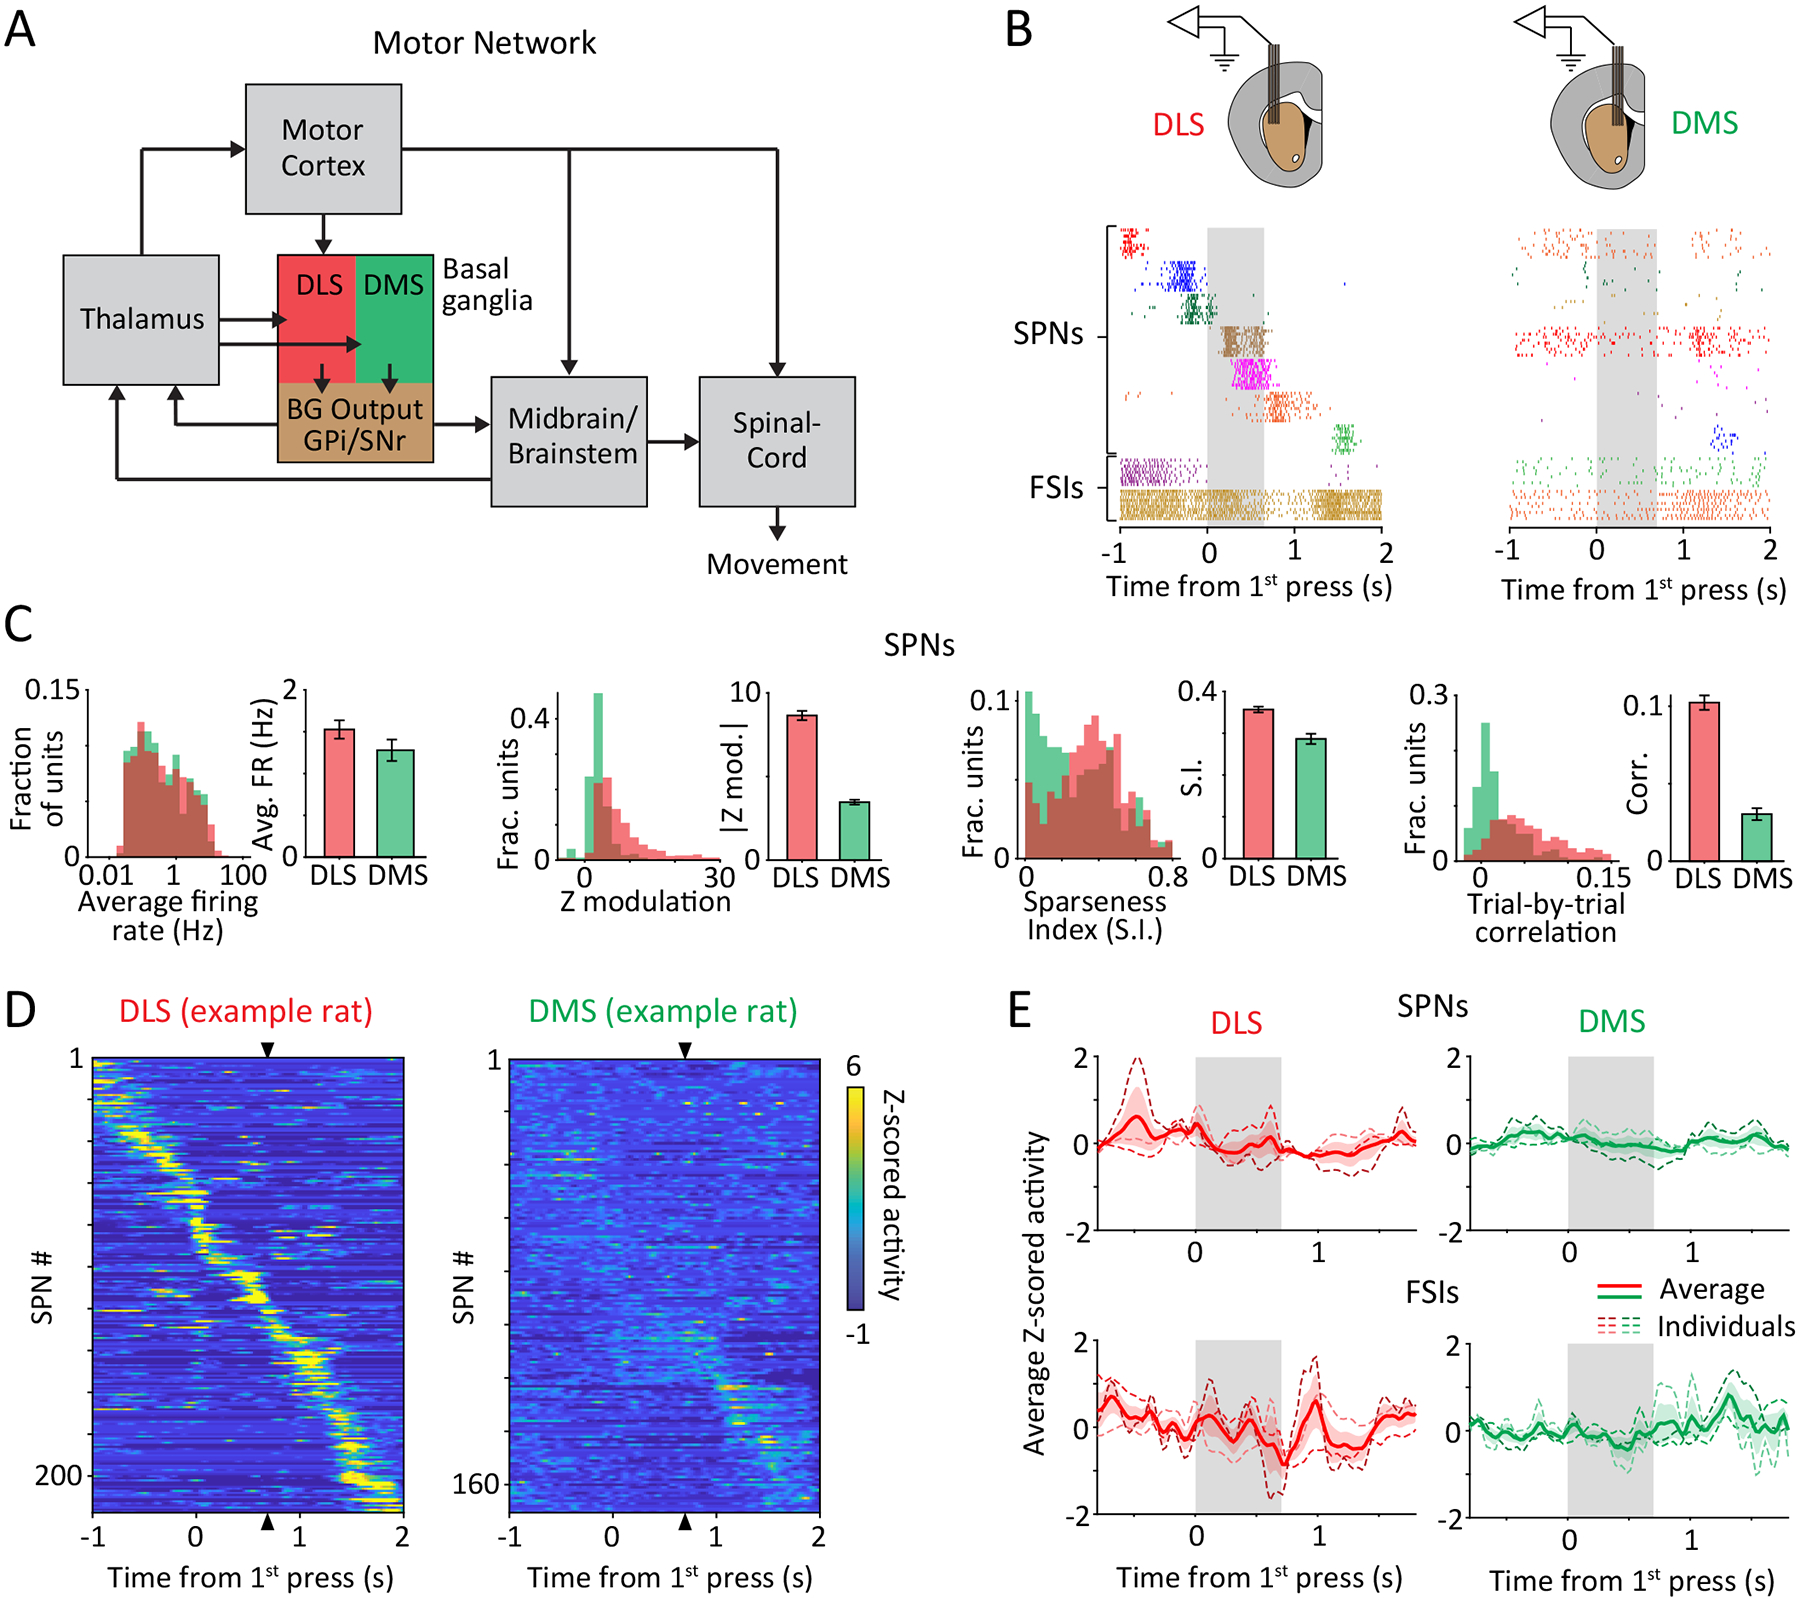
Units in DLS, but not DMS, are strongly modulated throughout the execution of a learned motor skill.
A. Simplified schematic of the motor circuits relevant to this study. The BG can affect the execution of learned behaviors by influencing motor cortex through the cortico-BG-thalamo-cortical loop, and/or via direct projections to brainstem and midbrain motor centers. The dorsolateral (DLS) and dorsomedial (DMS) striatum define the sensorimotor and associative arms of the BG, respectively.
B. (Top) Schematic of multi-tetrode array recordings from DLS (left) and DMS (right) in behaving animals. (Bottom) Spike rasters of 7 simultaneously recorded putative spiny projection neurons (SPNs) and 2 putative fast spiking interneurons (FSIs) from the DLS and DMS, shown over 10 trials, aligned to the 1st lever-press. Grey shaded region indicates mean inter-press period for the example session.
C. Comparing task-aligned activity statistics, including average firing rate during the trial-period (p=0.19), maximum modulation of Z-scored firing rate during the trial-period (p<1e-4), sparseness index (p<1e-4) and average trial-to-trial correlation of task-aligned spiking (p<1e-4), between putative SPNs recorded in the DLS (red, n=683) and DMS (green, n=283) of 3 rats. Bars and error-bars represent mean and SEM, respectively, across units. P-values measure the two-sided probability that two datasets have the same mean and are computed by bootstrapping difference in means (n=1e4).
D. Peri-event time histograms (PETHs) of Z-scored activity of SPNs recorded in DLS (left) and DMS (right) of example rats during execution of a representative sequence mode (see also Extended Data Fig. 4). Units have been sorted by the time of their peak activity, in a cross-validated manner. The sorting index, calculated from PETHs from half the trials for each unit, was used to sort PETHs from the remaining trials. Triangles indicate time of the second lever-press.
E. Z-scored firing rates averaged over populations of SPNs (top) and FSIs (bottom) recorded in DLS (left, red) and DMS (right, green). Thin, shaded dashed lines represent averages across sequence modes for individual rats, and thick, solid line indicates the grand average across rats (n=3 per group). Colored shading represents SEM across rats. Grey shaded region represents the target inter-press interval.
We posit that the nature of these BG state-action maps, or ‘policies’, likely depends on the specific challenges presented to the animal. For example, learning to express a simple species-typical action, like a saccade or a forelimb reach, in response to a particular stimulus or behavioral context8,11 (a ‘stimulus-response association’, Fig. 1B), would require neural activity patterns associated with the stimulus or context (‘state’) to be mapped to BG output activity that increases the likelihood of the rewarding action being expressed21,22. Because these simple actions can be generated autonomously by downstream control circuits6,23–25 (Fig. 1B), the BG are thought to provide a state-specific output signal that helps trigger the control module(s) that produce the rewarded action (the ‘action selection’ model)26,27.
Studies have also demonstrated that the BG can modulate the overall ‘vigor’ of ongoing actions, i.e. the speed with which they are executed and/or the amplitude of their constituent movements6,9,10,24 (Fig. 1C). This implies that the BG can associate state information not only with the selection of a particular action, but also produce a signal that adaptively controls the gain of that action3,28. Although the ‘vigor’ and ‘action selection’ models are often pitted against each other3,28, within a broader RL framework14,15,18 (Fig. 1A) they simply represent two different types of associations: one relating a given state to the selection of an action, the other relating it to the vigor with which an action is enacted (Fig. 1B–C).
If indeed the BG have a general capacity to associate input patterns conveying state information with output patterns leading to rewarding actions, how complex can these learned associations be? In the above two examples, the output signals were relatively low-dimensional, representing an action-specific go (binary) or gain (scalar) signal respectively (Fig. 1B–C). However, the BG circuits are capable of producing far more complex and dynamic output than what is minimally required for these functions29–32. Thus, they could - in theory at least - contribute to more fine-grained movement control (Fig. 1D) by associating continuously evolving state information (e.g. about the pose of the animal) with a time-varying output that, through actions on downstream controllers, improves performance16.
To probe whether the BG indeed function to specify the kinematic details of learned skills, we trained rats on a timed lever-pressing task that, over weeks of trial-and-error learning, results in highly stereotyped task-specific movement patterns with rich kinematic structure13 (Fig. 1E–F). Combining chronic neural recordings and high-resolution behavioral tracking, we found that activity in the sensorimotor region of the striatum reliably encodes the fine-grained kinematic structure of the learned movement patterns. Lesions to this arm of the striatum, as well as one of BG’s main outputs (GPi), completely erased the learned behavior from the rat’s repertoire. While lesioned animals still engaged with the task, their movements reverted to a species-typical behavior seen early in learning. Importantly, and contrary to the consensus view15,17,33, BG’s contribution to learned movements did not depend on motor cortical input to the striatum13. Taken together, our results show that BG circuits can store and specify continuous and rich kinematic ‘policies’ underlying learned skills and can do so in a motor cortex-independent manner.
Results
DLS, but not DMS, is modulated during skill execution
Probing whether and how the BG contribute to the specification of motor skills requires a paradigm that challenges subjects to learn novel movement patterns with complex task-specific kinematic structure. To this end, we took advantage of a task we had previously developed, in which rats are rewarded for pressing a lever twice within a specific time interval (inter-press interval or IPI; target: 700 ms, see Methods) (Fig. 1E)13. Over about a month of daily training, rats develop highly stereotyped and idiosyncratic movement patterns (Fig. 1F) that are then stably executed over long periods of time13.
If the BG do indeed contribute to specifying the fine-grained details of the learned skills, we would expect activity in this brain region to reflect time-varying kinematic variables. To probe this, we first sought to describe how neurons in the striatum represent the learned movement patterns our task trains. We implanted expert rats (n=3) with tetrode drives34 in the sensorimotor region of the striatum (dorsolateral striatum, DLS). This BG subregion receives input from sensorimotor cortex35,36 (Fig. 2A, Extended Data Fig. 1A–B), has been implicated in well-learned stimulus-response associations4,21,22, and is known to be preferentially activated during the expert execution of certain motor skills37,38.
In a separate cohort of expert rats (n=3), we recorded from a neighboring striatal region, the dorsomedial striatum (DMS), which receives input primarily from prefrontal cortex35,36 (Fig. 2A, Extended Data Fig. 1A–B). DMS has been implicated in early stages of learning37–40 but is generally considered dispensable for the execution of many well-learned behaviors38,39. A recent study recording from both DLS and DMS in rats performing simple repetitive lever-presses found very similar overall activity profiles in the two regions25. In contrast, our task trains animals to generate novel task-specific movement patterns, a process we hypothesize engages DLS to a greater degree than DMS. If so, we would expect to see distinct activity patterns and encoding schemes in the two striatal subregions.
We identified the DLS and DMS by anterograde viral tracing from motor and prefrontal cortices, respectively (Extended Data Fig. 1). We recorded from large populations of striatal neurons over several weeks of training34 (Extended Data Fig. 2A; in total, n=1336 units in DLS and n=846 units in DMS from n=3 rats per group; see Methods). To establish whether and how striatal activity reflects the kinematic structure of the learned skills, we used high-speed videography to track each subject’s forelimbs and head41,42 (Fig. 1F, Supplementary Videos 1–2).
Although we found DLS and DMS units to have similar average firing rates during the task, the firing patterns of DLS units were far more modulated and more reliable across trials (Fig. 2B–C, Extended Data Fig. 2B). Putative spiny projection neurons (SPNs; see Extended Data Fig. 2A and Methods for cell-type identification criteria) in the DLS also had much sparser activity patterns, often spiking only at one specific time-point during the learned behavior (Fig. 2B–C). In contrast, SPNs in the DMS as well as putative fast spiking interneurons (FSIs, Extended Data Fig. 2A) in both striatal regions showed more distributed activity (Fig. 2B–C, Extended Data Fig. 2B).
Average activity in DLS does not reflect action boundaries
The sharp difference in how DLS and DMS activity is modulated during our task (Fig. 2B–C, Extended Data Fig. 2B) contrasts with the very similar representations seen across these sub-regions in repetitive lever-pressing tasks25. This suggests that BG’s contribution to learned behaviors, and the striatal activity patterns reflecting it, may depend on the particulars of the task.
In instrumental conditioning tasks involving sequences of species-typical actions, DLS activity tends to preferentially mark the beginning and end of the rewarded action sequence5,7. This could be seen as reflecting a role for the BG in initiating or terminating a well-practiced behavior, the details of which are generated in downstream control circuits43,44. However, if BG output is, additionally, involved in specifying execution-level details of the learned behavior, such as its overall vigor6,9,24 (Fig. 1C) or detailed kinematics (our hypothesis, Fig. 1D), a more continuous representation in the DLS would be expected9,10.
To address the degree to which the neural representations of the continuous skilled movement patterns we train conform to either of these scenarios, we first examined how activity in DLS neurons is distributed over the length of the behavior (Fig. 2D–E). The activity patterns were qualitatively different from those reported in studies on repetitive lever-pressing, where pronounced SPN activity is seen around the first and final lever-press in a sequence, consistent with ‘start’/’stop’ activity7,25,45 (Fig. 2D–E). Across the population of animals, average striatal activity was elevated throughout the learned motor skill and did not consistently mark either the first or the last (2nd) lever-press in the sequence (Fig. 2D–E, Extended Data Fig. 3A). However, within an animal, average DLS activity was non-uniformly distributed (Fig. 2E, Extended Data Fig. 3D–E, see Methods) and this pattern was unique to each individual, raising the possibility that the stereotyped movement patterns animals learn in our task13 ‘start’ before and ‘stop’ after the 1st and 2nd lever-press respectively, and do so to different extents in different animals.
Since well-practiced motor skills are characterized by low trial-to-trial variability46, we defined the boundaries of the skilled behavior (i.e. its ‘start’ and ‘stop’) for each rat as the time points at which the trial-to-trial variability of its movement trajectories showed a marked decrease or increase, respectively (Extended Data Fig. 3B, Methods). However, even at these individual-specific ‘start’ and ‘stop’ times, we did not observe any consistent elevation in the activity of DLS SPNs (Extended Data Fig. 3C).
Thus, our recordings did not conform to a model of ‘action selection’ in which the main function of the BG is to initiate and terminate the execution of a well-practiced motor skill, or ‘chunk’5,7, elaborated in downstream control circuits. However, the non-uniform and idiosyncratic population activity in DLS could be consistent with a role for the BG in selecting specific action elements within a longer sequence, as has been proposed by recent studies of spontaneously expressed naturalistic47,48 and learned49 behaviors. According to this variant of the ‘action selection’ model, the DLS should over-represent transitions between the distinct, elemental movements in a motor sequence.
Testing this model requires identifying and segmenting the constituent elements of a continuous learned movement pattern. To this end, we took advantage of the rats’ tendency to converge on multiple closely related solutions to our task (Extended Data Figs. 4A–D, Supplementary Video 1, see Methods), which we term “modes”. These modes arise because our behavioral task imposes no kinematic constraints on the subjects’ behavior beyond the basic requirement to press the lever twice at the target inter-press interval of 700 ms. Thus, much like a tennis player converging on slightly different types of serves (e.g. a flat versus a slice serve) that aim to achieve the same performance goal (getting an ace), we find that individual rats learn and express multiple closely related but qualitatively distinct movement patterns, or motor sequences, that match the target IPI (Extended Data Fig. 4A–B).
Comparing pairs of such sequence ‘modes’, we observed that their associated movement trajectories systematically differed at particular phases of the behavior but were similar at all other times (Fig. 3A, Supplementary Video 1). This indicated that the modes shared some common motor elements and differed in others. We designated the times at which the trajectories of a pair of modes first became distinct (see Methods, Figs. 3A–C) as “choice-points”. These represent the time at which the motor sequences transitioned from a common movement to distinct movements particular to each mode. We found no evidence for enhanced SPN activity in the DLS at these choice-points (Extended Data Fig. 4E). Taken together, our results go beyond the predictions of traditional models of ‘action selection’, which posit that the DLS selects entire motor sequences5,7 or their constituent actions47–49.
Figure 3:
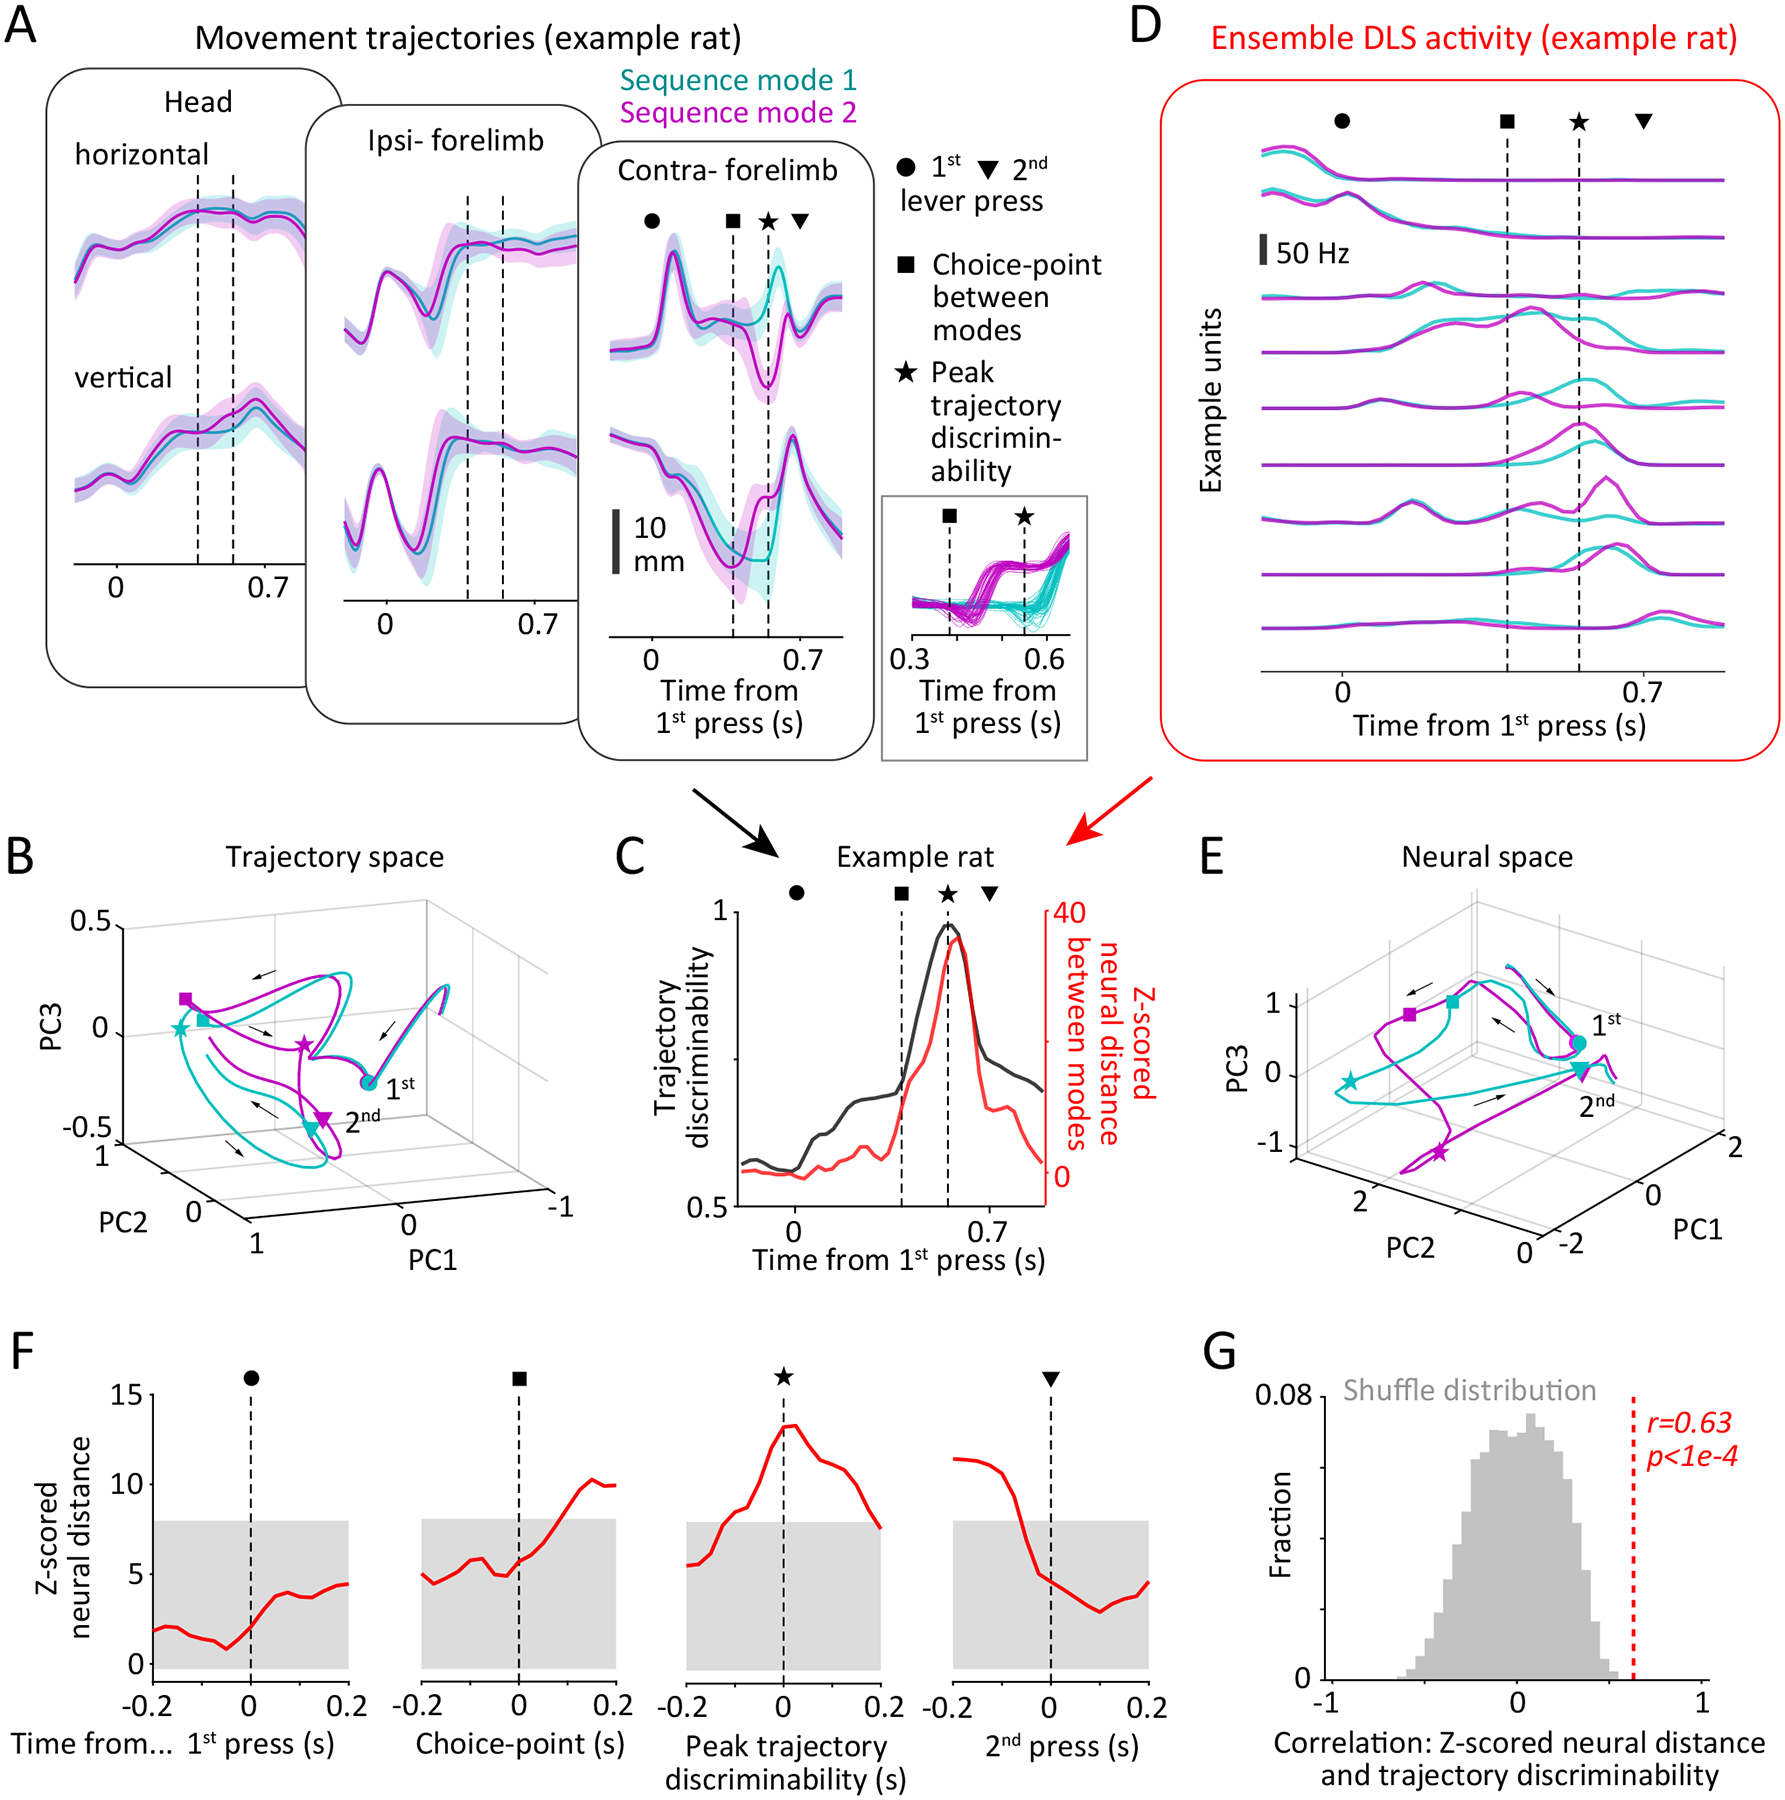
Ensemble unit activity in the DLS reflects continuous kinematics of the learned movement patterns.
A. Comparison between trial-aligned trajectories of the forelimbs (ipsi- and contra-lateral to the recording site) and head of an example rat when performing two distinct sequence modes (color-coded, see Methods and Extended Data Fig. 4). Data is presented as mean ± SD across trials. Symbols indicate time of the 1st (circle) and 2nd (triangle) lever-presses and times at which the trajectories of distinct modes are first (square, see panel C) and most (star) discriminable. Inset shows zoom-in of representative single-trial trajectories (contralateral forelimb, vertical component) around the time of the choice-point.
B. Mode-specific movement trajectories of the example rat projected into the subspace defined by the top three principal components of trajectories of both forelimbs and the head. Symbols as in A. Arrows indicate flow of time.
C. (Black line) Discriminability between the movement trajectories of the two modes shown in panels A-B by a quadratic classifier over time in the trial. (Red line) Distance between mode-specific neural trajectories over time in the trial, Z-scored by the time-varying distance between trajectories computed within the same mode (see Methods). Symbols as in A.
D. Trial-averaged activity patterns (PETHs) of 9 example DLS units during execution of the two sequence modes. Symbols as in A.
E. Mode-specific neural trajectories of ensemble unit activity in the DLS of an example rat plotted in the subspace defined by the top three principal components. Symbols as in A.
F. Average Z-scored distances between neural trajectories corresponding to pairs of modes at different points in the behavior. Lines indicate neural distances averaged across all mode-pairs within each rat and then across rats (n=3). Grey shading represents the 95% confidence interval, corrected for multiple comparisons, of the distribution of Z-scored distances expected by chance if these events occurred at random times within the learned behavior (n=1e4 permutations).
G. Correlation coefficient (indicated by red dashed line) between trajectory discriminability of pairs of sequence modes and the Z-scored neural distance between their ensemble representations in the DLS (see panel C), averaged across mode-pairs and then across rats (n=3). Grey histogram shows the statistic distribution under the null hypothesis (no relationship between the variables) computed by randomization (n=1e4 permutations), and p-value quantifies the two-sided probability that this explains the data.
Ensemble DLS activity encodes task-related movement kinematics
We argued that the continuous activity patterns in the DLS could instead reflect a role for the BG in specifying the detailed kinematics of ongoing movements (Fig. 1D). In support of this, we found moderate but significant correlations between average DLS activity and the time-varying speed profile of the forelimbs (Extended Data Figs. 3D,F), implying that non-uniformity in DLS activity is driven, in part at least, by fluctuations in levels of overall movement over the course of the skilled behavior.
To probe the relationship between DLS activity and kinematics in more detail, we revisited our mode analysis, comparing the distance between the trial-averaged DLS ensemble representations of pairs of modes as a function of time in the motor sequence (Figs. 3C–F, Methods). We found that the neural representations across the sequence modes were most distinct after the choice-point (Figs. 3C,F–G), with their peak divergence coinciding with the time at which the movements associated with each mode were most divergent.
These results indicate that DLS activity reflects kinematic aspects of the learned movement patterns we train, but they do not reveal which specific kinematic variables are represented or whether DLS activity is encoding trial-by-trial and moment-by-moment fluctuations in these variables. To address this, we examined whether and how time-varying movement kinematics explained fluctuations in DLS spiking activity (Fig. 4A–B). We used a generalized linear model framework (Fig. 4C) to probe which kinematic parameters were encoded in the activity of individual DLS units or – for comparison– in the far less task-modulated DMS units.
Figure 4:
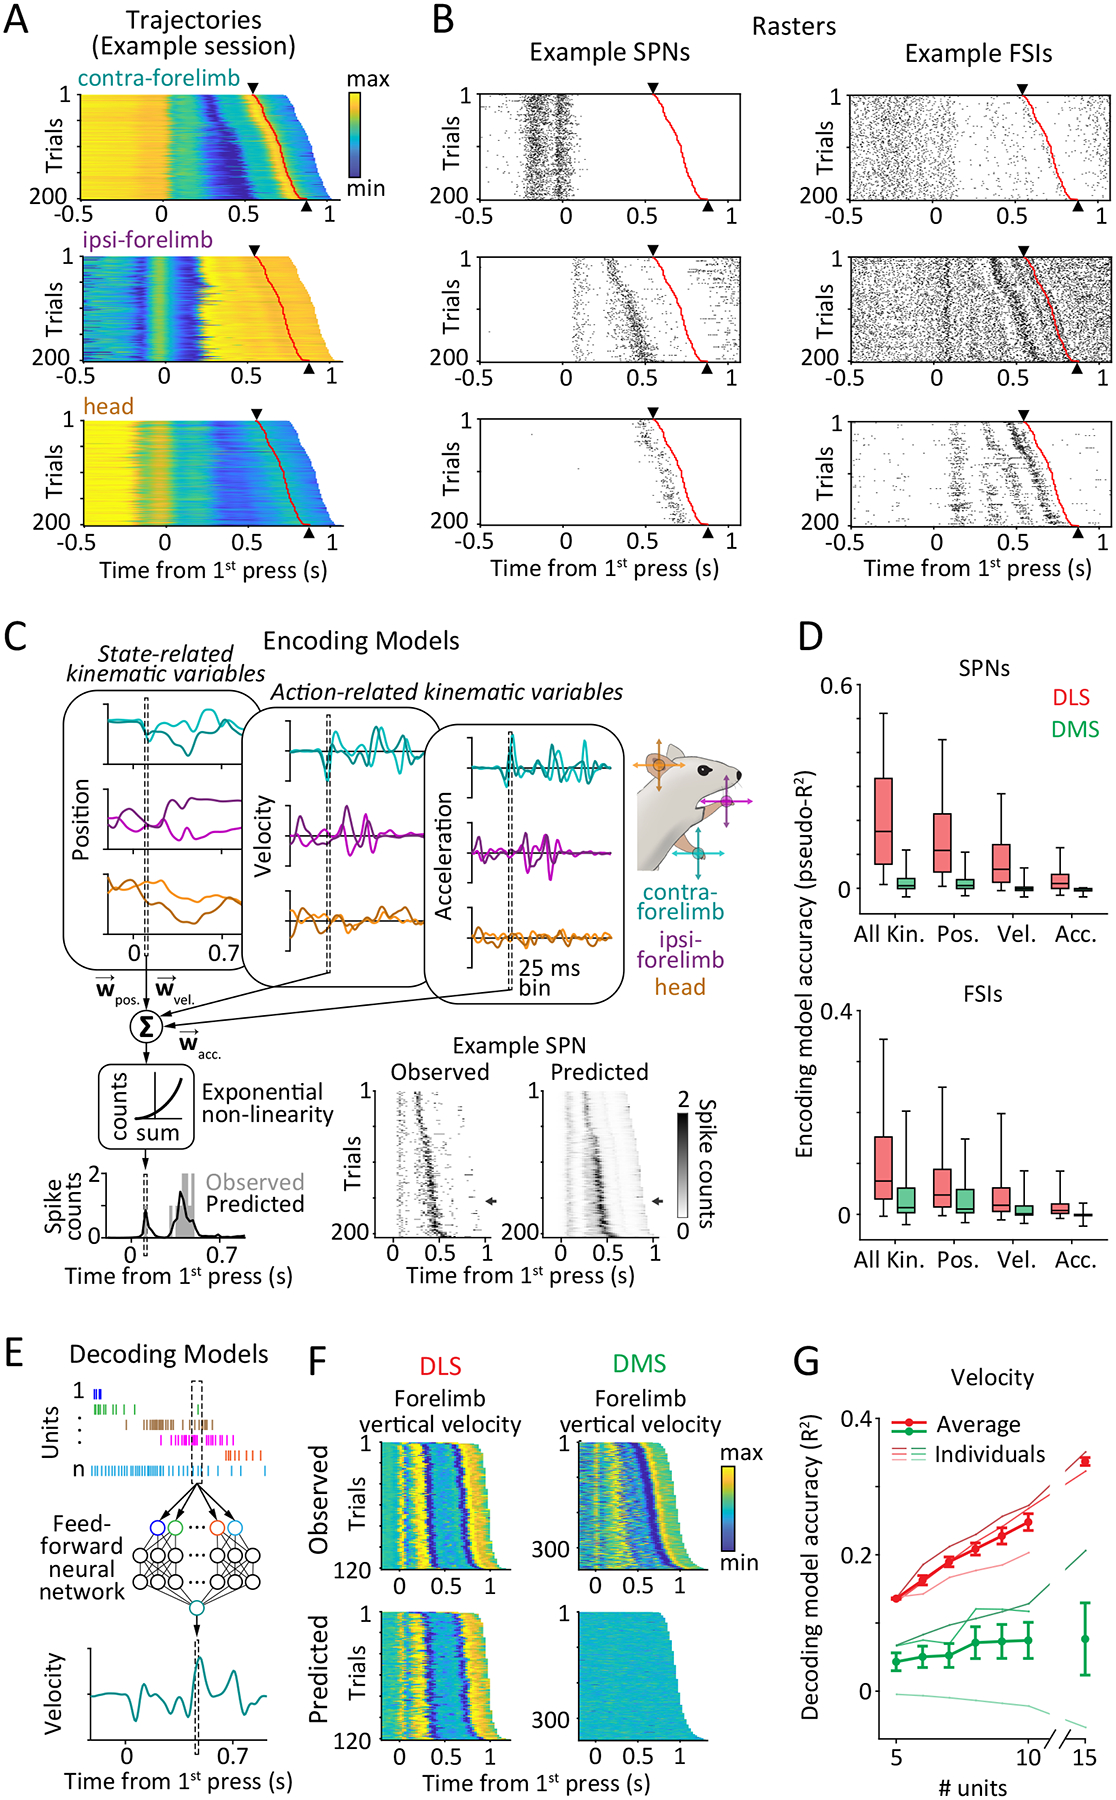
DLS, but not DMS, encodes detailed task-related movement kinematics.
A-B. Trial-by-trial covariation of movement kinematics and neural activity during a representative behavioral session for an example rat. Time of 2nd lever-press is indicated by black triangles and red lines.
A. Trajectories of the contralateral (top) and ipsilateral (middle) forelimbs and the head (bottom) on individual trials in the session. Trials are sorted by the inter-press interval and belong to the same sequence mode.
B. Raster plots showing spiking activity of 3 example SPNs (middle) and FSIs (right) on the same trials.
C-D. Encoding analyses.
C. Schematic of encoding analysis. Generalized linear models were used to measure the degree to which kinematic state-related (position) and action-related (velocity, acceleration) variables (top) predict spiking of individual striatal units (bottom left). Light and dark shades indicate horizontal and vertical components of movement, respectively. (Bottom right) Observed (left) and predicted (right) spike counts of an example SPN. Arrows indicate example trial shown on the bottom left.
D. Goodness of fit, measured by pseudo-R2 (see Methods), for encoding models that use detailed kinematic information about position (Pos.), velocity (Vel.) and acceleration (Acc.), or a combination of these (All Kin.), to predict the time-varying, trial-by-trial activity of putative SPNs (top) and FSIs (bottom) recorded in DLS (red, n=492 SPNs and 164 FSIs from 3 rats) and DMS (green, n=213 SPNs and 123 FSIs from 3 rats). Boxes denote 1st, 2nd (median) and 3rd quartiles, while whiskers show the 5th and 95th percentile of the pseudo-R2 distributions. p<1e-4 for all encoding comparisons between SPNs in DLS and DMS, and p=1e-4, 2.4e-3, 1.8e-3, 0.016 between FSI encoding in the DLS and DMS of all kinematic, position, velocity and acceleration variables, respectively. Pseudo-R2 is measured on trials (25%) not used for training the encoding models. p-values measure the probability that the two datasets have the same mean and are estimated by bootstrapping difference in means (n=1e4 bootstraps).
E-G. Decoding analyses.
E. Schematic of decoding analysis. A feedforward neural network predicted the velocity (horizontal and vertical components) of the forelimbs and head from the spiking activity of groups of simultaneously recorded striatal units.
F. (Top) Vertical component of velocity of the contralateral forelimb for all trials in a representative session for a DLS- (left) and DMS-implanted (right) rat. Trials are aligned to the first lever-press and sorted by the inter-press interval. (Bottom) Cross-validated velocity predictions of the neural network decoder.
G. Cross-validated accuracy with which instantaneous velocity can be decoded by a neural network decoder from spiking activity of groups of DLS (red) or DMS (green) units, quantified by the fraction of variance in the observed velocity explained by the predictions (R2). Decoding accuracy was averaged over all sessions within individual rats (thin lines) and then across rats in each group (thick lines; n=3 each). For a subset of rats with larger recording yields, we extended the analysis to groups of 15 units (n=2 each). Data is presented as mean ± SEM across rats. p=0.03 for comparison between decoding of velocity from 10 units in DLS and DMS rats by 2-sided Kolmogorov-Smirnov test.
If the DLS does indeed specify the kinematic policies (state-action mappings) that underlie skilled behavior, we would expect neural activity to encode both the continuously evolving state of the body, reflected in the time-varying position of multiple effectors like the forelimbs and head, as well as the actions performed by the animal, reflected in the velocity and acceleration of the effectors (Fig. 4C). Indeed, we found that the kinematic details of the learned movement patterns could predict the instantaneous activity of individual DLS units, sampled in 25 ms bins (Fig. 4D). Importantly, we found that encoding models employing a combination of state- (position) and action-related (velocity, acceleration) variables from multiple tracked body parts outperformed models that were restricted to specific kinematic variables or body parts (Fig. 4D, Extended Data Figs. 5A–B). Consistent with the low task-modulation in DMS, we found that all movement-related variables were encoded to a much lesser extent in the activity of DMS units (Fig. 4D, Extended Data Fig. 5B).
If the BG specify the learned kinematic structure of acquired skills, as we hypothesize, we should also be able to decode time-varying movement kinematics from populations of DLS or DMS units. To test this, we trained a multilayer neural network decoder (Fig. 4E) to predict the instantaneous velocity of the rats’ forelimbs and head during the task (see Methods). We could accurately predict the fine-grained details of the learned movement patterns from simultaneously recorded DLS units (Fig. 4F–G). In stark contrast, we could not decode kinematics to any meaningful extent from DMS units (Fig. 4F–G).
Movement encoding is independent of motor cortex
Most models of the DLS’s role in learned behaviors propose that information about ‘state’ is conveyed by cortex15,17,18. Yet, the motor cortex is not necessary for executing the skills we train13 (Fig. 1F). Therefore, if the kinematic representations we observe in the DLS reflect a control function, they ought to be independent of motor cortex.
To probe this, we recorded DLS activity in expert rats after lesions to motor cortex (Fig. 5A, n=914 units in total from n=3 rats). Consistent with our earlier report13, lesions did not affect execution of the learned skills (Extended Data Fig. 6A). DLS units in motor cortex-lesioned rats had similar firing rates to those in intact rats (Extended Data Fig. 6B) and were, as a population, active over the duration of learned behavior (Fig. 5B–C). However, there were subtle, but significant differences between the activity of DLS units in lesioned and intact rats, with the activity patterns of DLS units in lesioned rats being slightly less modulated, sparse, and precise (Extended Data Fig. 6B).
Figure 5:
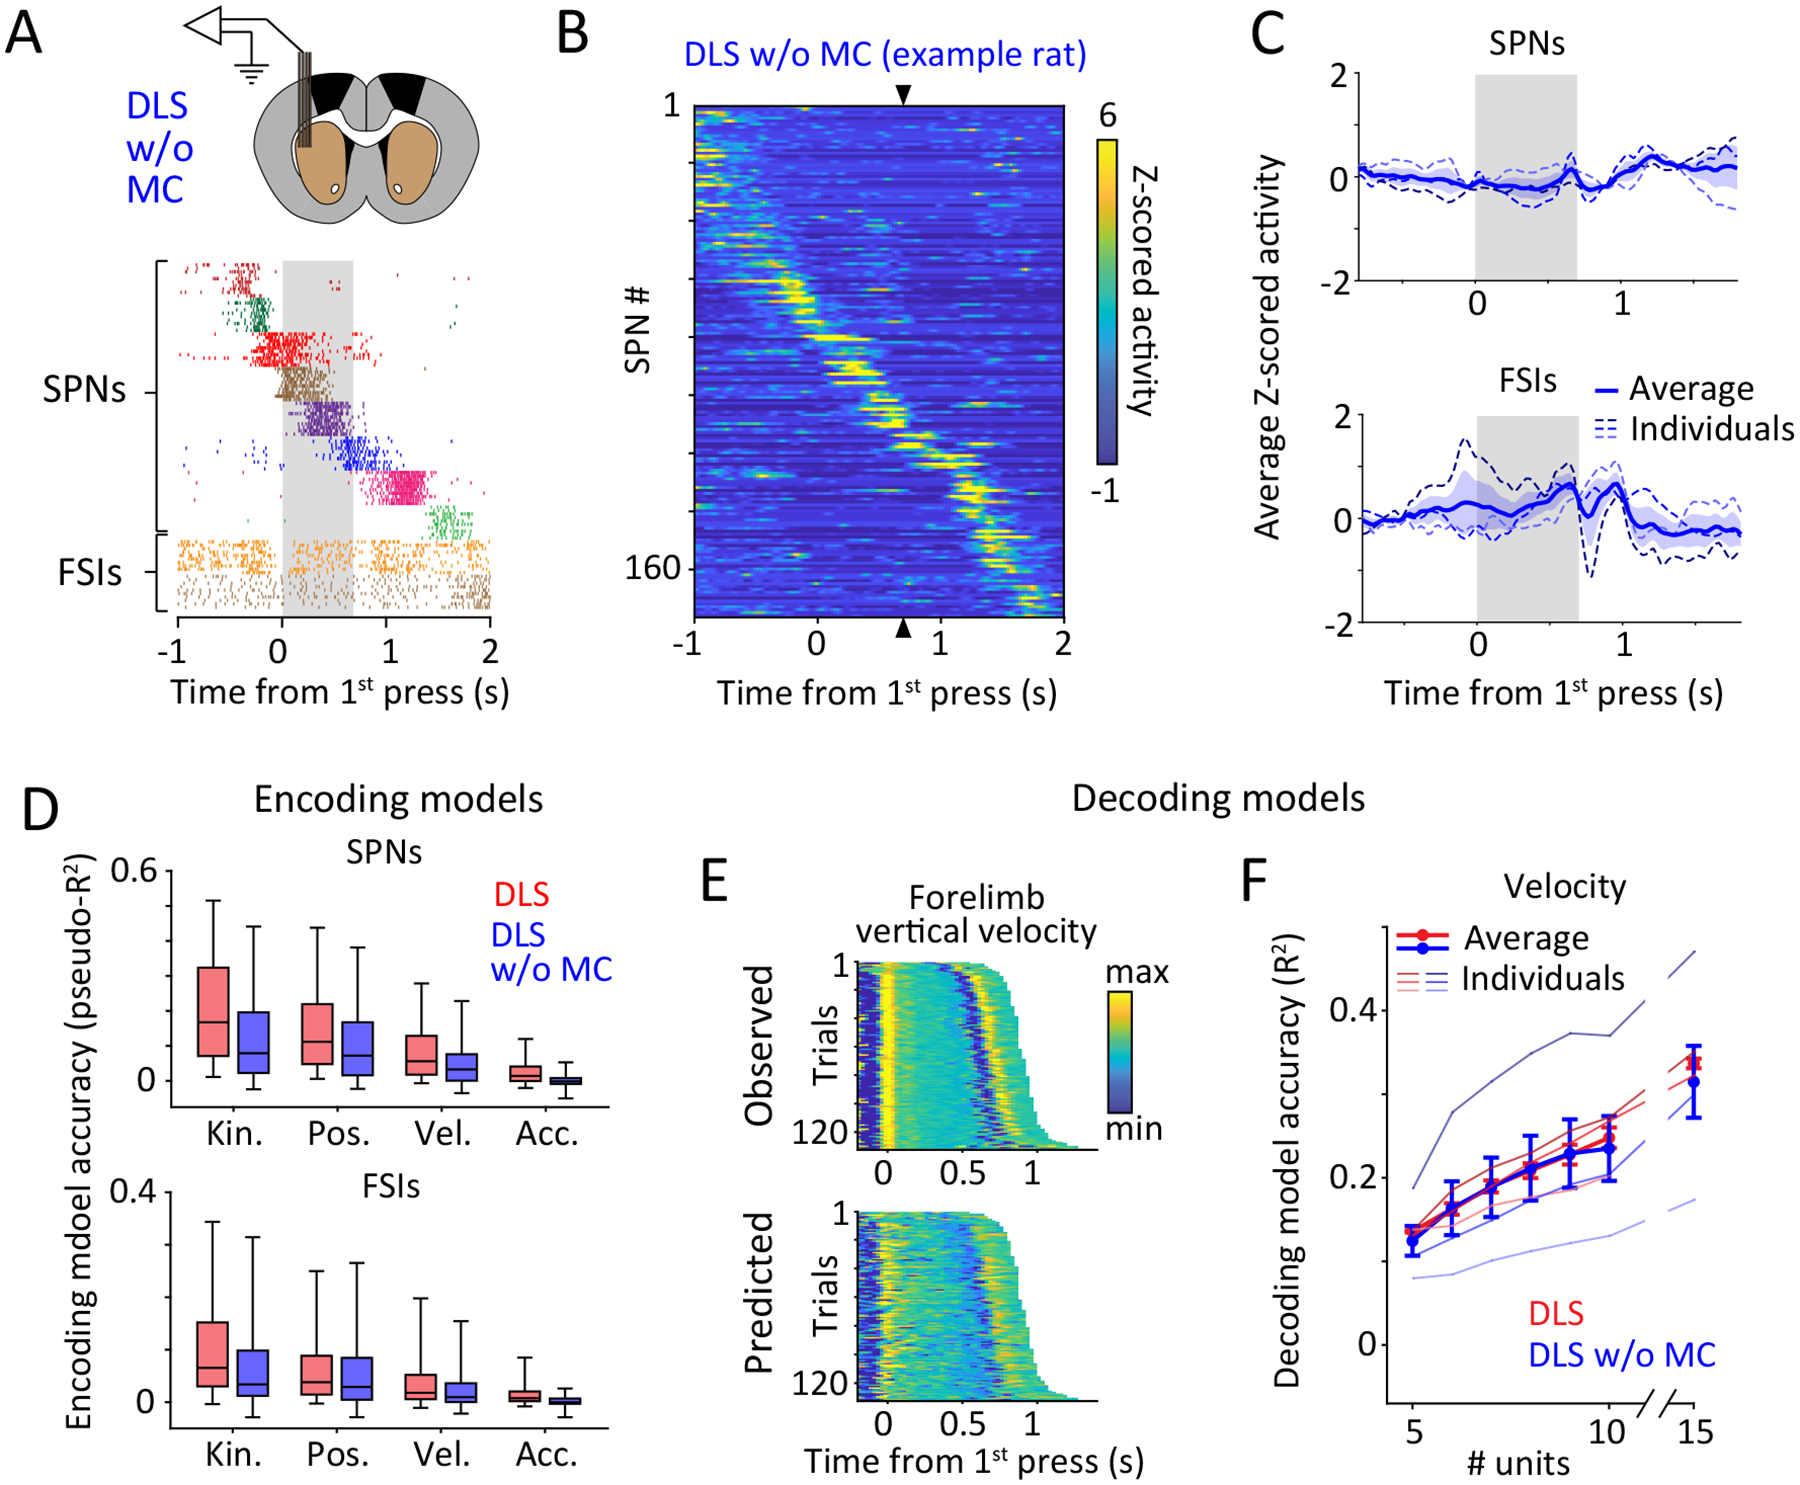
Kinematic encoding in DLS is independent of motor cortex.
A. (Top) Schematic shows recording targeting the DLS of a motor cortex (MC)-lesioned rat. (Bottom) Trial-aligned spike rasters for 7 simultaneously recorded putative SPNs and 2 putative FSIs over 10 trials. Grey shaded region indicates mean inter-press period for the example session.
B. Z-scored PETHs for SPNs recorded in the DLS of an example MC-lesioned rat. Units are sorted by the time of peak activity, in a cross-validated manner. Triangles indicate time of the 2nd lever-press.
C. Z-scored firing rates averaged over all SPNs (top) and FSIs (bottom) recorded in the DLS of MC-lesioned rats. Thin, shaded dashed lines represent averages across sequence modes for individual rats, and thick, solid line indicates the grand average across rats (n=3). Blue shading represents SEM across rats. Grey shaded region represents the target inter-press interval.
D. Accuracy of encoding models that use detailed kinematic information about position, velocity and acceleration, or a combination of all these, to predict the time-varying, trial-by-trial activity of putative SPNs (top) and FSIs (bottom) recorded from the DLS in intact (red, n=492 SPNs and 164 FSIs from 3 rats, replotted from Fig. 4D) and MC-lesioned rats (blue, n=279 SPNs and 169 FSIs from 3 rats). Boxes denote 1st, 2nd (median) and 3rd quartiles, while whiskers show the 5th and 95th percentile of the pseudo-R2 distributions. p<1e-4 for all encoding comparisons between SPNs in intact and MC-lesioned rats, and p=9e-4, 0.28, 0.09, 0.01 for comparisons between FSI encoding in intact and MC-lesioned DLS for all kinematic, position, velocity and acceleration variables, respectively. p-values measure the probability that the two datasets have the same mean and are estimated by bootstrapping difference in means (n=1e4 bootstraps).
E. (Top) Vertical component of velocity of the contralateral forelimb for all trials in a representative session for a DLS-implanted MC-lesioned rat. Trials are aligned to the 1st lever-press and sorted by the inter-press interval. (Bottom) Cross-validated predictions of instantaneous velocity by a neural network decoder from the co-incident activity of all simultaneously recorded units.
F. Cross-validated accuracy (fraction of explained variance: R2) with which instantaneous velocity can be decoded by a neural network decoder from groups of DLS units recorded in intact (red, replotted from Fig. 4G) and MC-lesioned (blue) rats. Decoding accuracy was averaged over all sessions within individual rats (thin lines) and then across rats in each group (thick lines; n=3 each). For a subset of rats with larger recording yields, we extended the analysis to groups of 15 units (n=2 intact and n=3 MC-lesioned rats). Data is presented as mean ± SEM across rats. p=0.97 for comparison between decoding of velocity from 10 DLS units in intact and MC-lesioned rats by 2-sided Kolmogorov-Smirnov test.
Furthermore, detailed time-varying kinematics were less effective at predicting the instantaneous activity of individual DLS units in motor cortex-lesioned animals (Fig. 5D). Note, however, that the relative contribution of both state- and action-related variables (Fig. 5D, Extended Data Fig. 6C) to the overall prediction was similar for DLS units in the two cohorts. This suggests an across-the-board reduction in encoding capacity rather than a qualitative change in the kinematic representation, consistent with removal of motor cortical inputs causing single neurons in DLS to become more variable.
Whatever the cause of this neural variability, if the DLS plays an essential role in controlling the details of the learned behavior, its population activity should reflect action-related kinematics as well with and without motor cortex. To probe this, we decoded instantaneous forelimb and head velocity from the spiking activity of DLS units in motor cortex-lesioned animals (Fig. 5E–F). Decoding accuracy was similar to intact animals across a range of ensemble sizes (Fig. 5F), consistent with DLS having similar amounts of information about the execution-level kinematic details of the behavior with and without motor cortex.
DLS is necessary for expert performance
While our neural recordings are highly suggestive of the DLS specifying execution-level details of the learned skills, the kinematic coding we observe could simply reflect sensorimotor input35,36 without contributing causally to the behavior. To directly test DLS’s causal contributions to the specification and execution of the learned skills, we lesioned it bilaterally in expert animals (Methods; Fig. 6A, Extended Data Fig. 1B, n=7 rats). For comparison, we lesioned the DMS (Fig. 6A, Extended Data Fig. 1B, n=5 rats), whose neurons are markedly less correlated with the animals’ movements (Fig. 4), in a separate cohort. To control for the surgery procedure, we also performed control injections into the DLS in another group of animals (Fig. 6A, n=5 rats).
Figure 6:
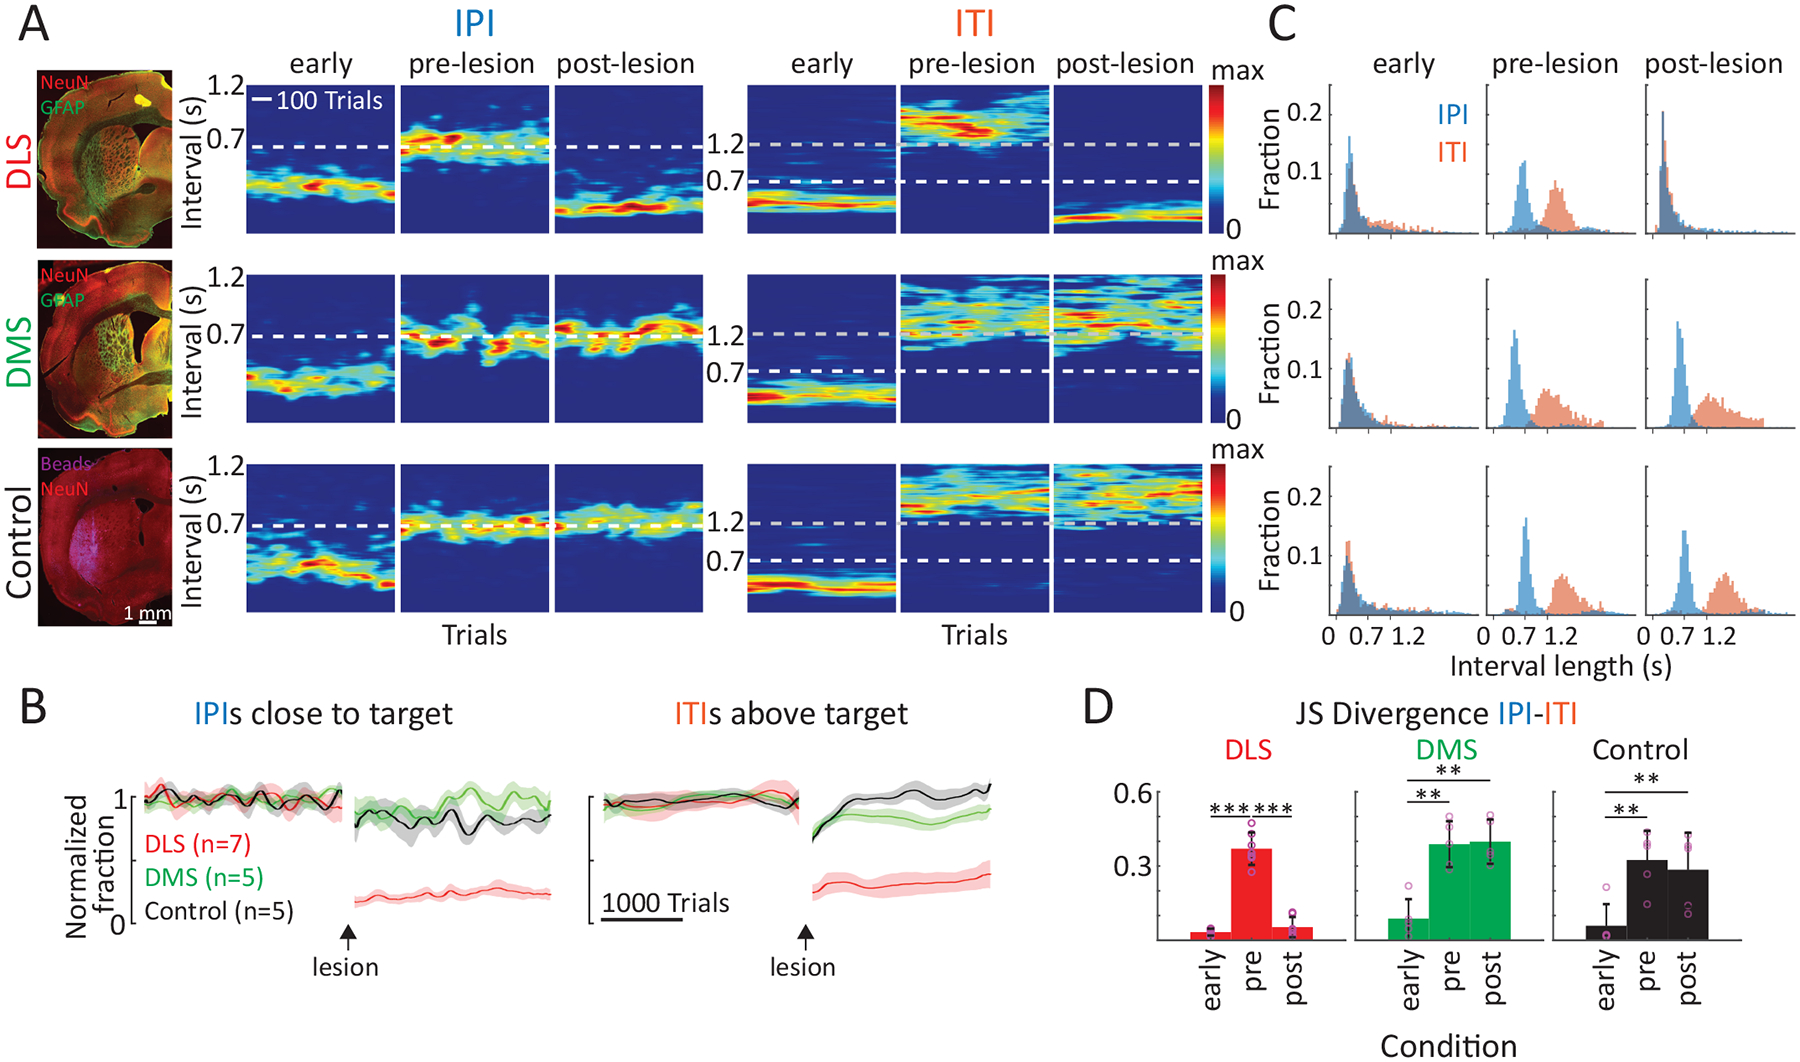
Lesions of DLS, but not DMS, degrade the performance in our timed lever-pressing task.
A. Representative examples of performance in the timed lever-pressing task (see Fig. 1E) in animals subjected to different manipulations (DLS lesion, DMS lesion, DLS control injection). (Left) Histological images of the manipulations. (Right) Heatmaps of the probability distributions of IPIs and ITIs for the example animals early in training, and before and after the manipulations. Population data shown in panel B.
B. Average performance across animals (DLS n=7 rats; DMS n=5, Control n=5) for manipulations as in A, normalized to performance before the manipulation. (Left) Fraction of trials with IPIs close to the target (700 ms ± 20%). (Right) Fraction of trials with ITIs above the threshold of 1.2 s. Shading represents SEM.
C. Distributions of interval lengths between lever-presses for the animals shown in A early in training, and before and after the manipulations.
D. Dissimilarity between the IPI and ITI distributions across animals early in training, and before and after the manipulations. Shown is the Jensen-Shannon (JS) divergence as a measure of dissimilarity, with lower values indicating higher overlap between the two interval distributions. Dots represent individual animals (DLS n=7, DMS n=5, Control n=5), bars represent mean ± SEM. For statistical details see Supplementary Table 4. **P < 0.01, ***P < 0.001.
We found that DLS lesions drastically impaired the animals’ performance. Although rats were still actively engaged in the task, they generated fewer lever-presses (Extended Data Fig. 7) and their IPIs decreased relative to pre-lesion and became, on average, far more variable (Fig. 6A, Extended Data Fig. 7). This, in turn, led to a significant drop in the fraction of ‘successful’ trials, defined here as the IPI being within 20% of the target (700 ms, Fig. 6B). Notably, post-lesion performance and engagement were indistinguishable from early stages of learning (Fig. 6A, Extended Data Fig. 7), and did not recover to pre-lesion levels even after extended additional training (Extended Data Fig. 7), suggesting that DLS is also essential for (re)learning the task. In contrast, lesions of the DMS did not affect performance beyond the surgery-related effects we saw after control injections (Figs. 6A–B, Extended Data Fig. 7).
In addition to mastering the prescribed IPI target (700 ms), animals in our task learn to not press the lever after unsuccessful trials for at least 1.2 seconds (the inter-trial interval, ITI) – a requirement for initiating a new trial (Fig. 1E). As animals learn the structure of the task, they develop separate strategies for timing the IPI and ITI intervals (Figs. 6A,C), as evidenced by distinct peaks in the overall distribution of times between lever-presses (Fig. 6C). After DLS lesions, however, the mean ITI duration was not only reduced (Figs. 6A–B, Extended Data Fig. 7), but the distinction between IPIs and ITIs was completely lost (Figs. 6C–D). Interestingly, the temporal structure of the animals’ lever-pressing behavior reverted to what is seen in early stages of training (Figs. 6C–D). Thus, in contrast to DMS lesioned and control animals, DLS lesioned animals could neither adhere to the previously acquired task structure nor relearn the distinction between the different task intervals (Fig. 6, Extended Data Fig. 7).
It has been proposed that motor deficits in striatum-related disorders, like Parkinson’s disease (PD), are not caused by loss of striatal function but rather by altered dynamics in striatum leading to aberrant BG output50,51. In support of this idea, lesions of the GPi, one of the main BG output nuclei, have proven an effective treatment for dyskinesias in PD50,51. This raises the question of whether impairments observed after DLS lesions are due to loss of instructive DLS activity, or, alternatively, to aberrant BG output that disrupts task-related activity in downstream control areas50,51. To distinguish between these possibilities, we lesioned the GPi (also called the entopeduncular nucleus), in an additional group of animals (Extended Data Fig. 8A, n=5 rats). This manipulation affected task performance in a similar way to DLS lesions (Extended Data Fig. 8A–D). Taken together, these results show that the sensorimotor BG are required for producing the motor skills we train.
DLS lesions disrupt execution of the learned skills
While performance impairments after DLS lesions suggest that its activity is indeed causal to the control of the behaviors we train, DLS’s specific function remains unclear. On the one hand, performance could suffer from changes to the speed or amplitude of the learned movement patterns – deficits consistent with the DLS controlling the overall ‘vigor’ of the actions3,51. On the other hand, it could be due to an inability to generate the learned movement patterns altogether, an outcome that would support our hypothesis that the BG specify the learned kinematic structure of acquired skills by acting on motor controllers in downstream circuits20,52,53. To arbitrate between these possibilities, we used video-based behavioral tracking41,42 to compare the detailed kinematics of task-associated movement patterns before and after bilateral DLS and DMS lesions (see Methods).
In line with our analyses of performance metrics, learned movement patterns were faithfully reproduced after DMS lesions, suggesting that the associative arm of the BG does not contribute meaningfully to the execution of the acquired motor skills. (Fig. 7B,D,F). In contrast, task-related movement patterns of DLS-lesioned rats changed dramatically (Fig. 7A, Supplementary Video 2). While still fairly stereotyped, none of the post-lesion trials resembled the pre-lesion behavior (Fig. 7A,E, Supplementary Video 2). Instead of the highly idiosyncratic task-specific movement patterns characteristic of expert animals, the behaviors expressed after DLS lesions were surprisingly similar across our cohort of rats and mostly consisted of repetitive lever-pressing (Fig. 7C, Supplementary Video 2).
Figure 7:
Lesions of DLS, but not DMS, lead to loss of idiosyncratic learned movement patterns and regression to lever-pressing behaviors common across animals.
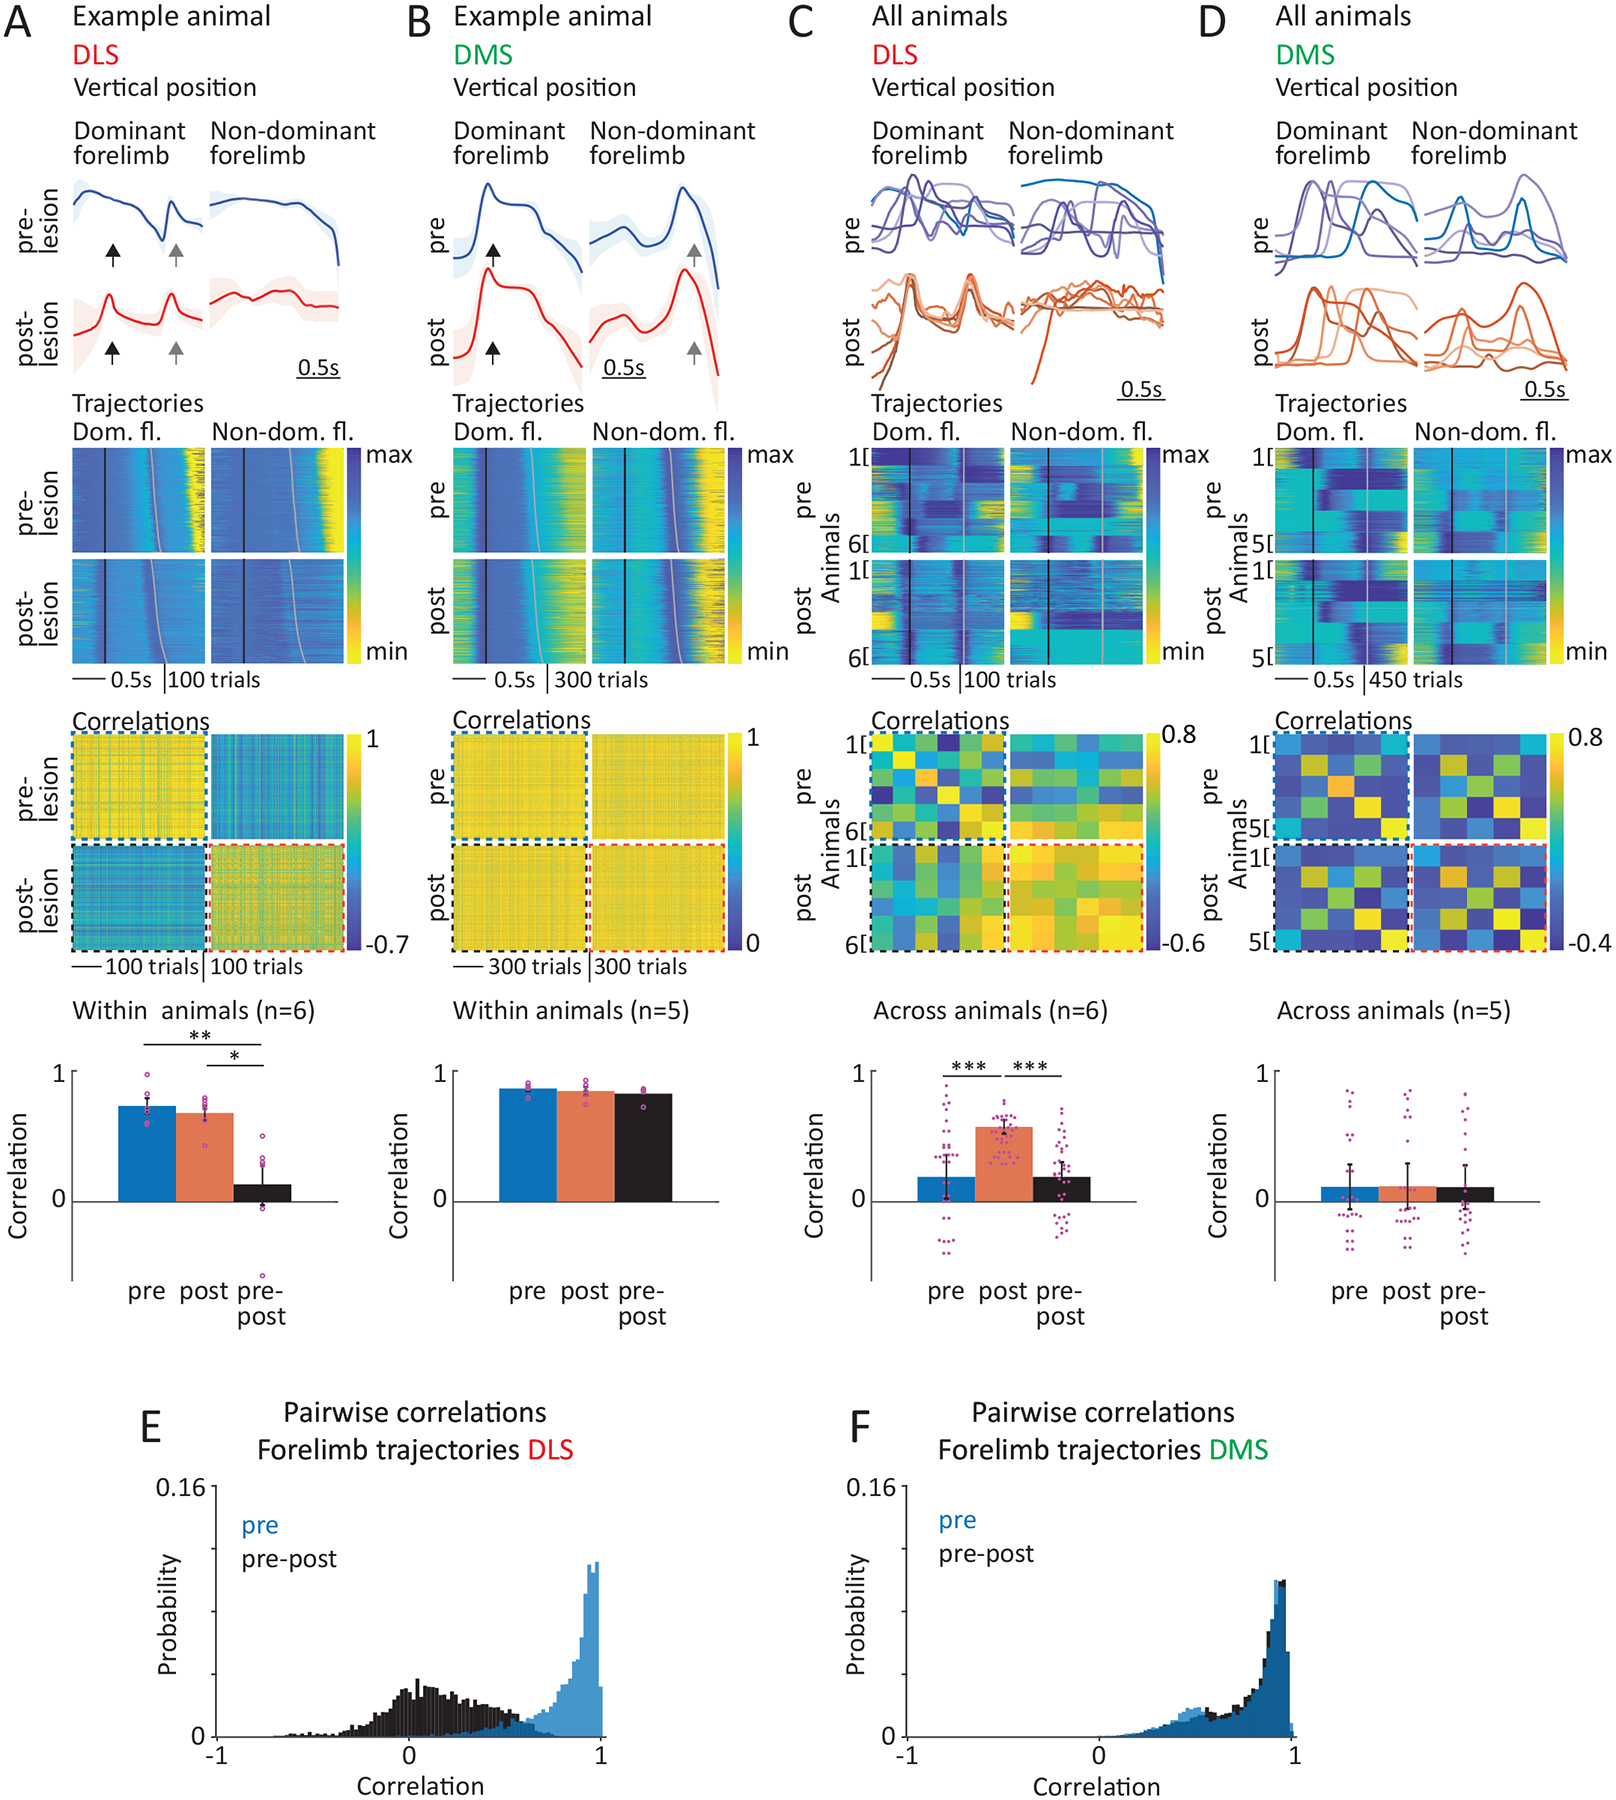
A. Within animal comparison of forelimb trajectories associated with the task before and after DLS lesions. (Row 1) Average forelimb trajectories (vertical position) of an example rat before and after DLS lesion (calculated from trials within a range of mean IPI ± 30 ms). Black arrows indicate the 1st press, grey arrows the 2nd press. The forelimb performing the 1st lever-press is regarded as dominant. (Row 2) Vertical forelimb displacement in individual trials before and after DLS lesion for both limbs, sorted by IPI and normalized to minimum and maximum displacement. Black lines mark the 1st, grey lines the 2nd press. (Row 3) Pairwise correlations of the forelimb trajectories in row 2 after linear time-warping of the trajectories to a common time-base (see Methods). (Row 4) Averages of within animal correlations as shown in row 3 across animals (n=6 rats) by condition (averages of all pre-to-pre, post-to-post and pre-to-post correlations). Dots indicate individual animals, bars show mean ± SEM. For statistical details for all panels see Supplementary Table 5. *P < 0.05, **P < 0.01.
B. Same as A, but for DMS lesions (n=5 rats).
C. Comparison of forelimb trajectories across animals before and after DLS lesion. (Row 1) Comparison of average trajectories (as in A) of all animals before and after DLS lesion (n=6 rats, blue and red shades indicate individual animals). (Row 2) Forelimb displacement in randomly selected trials (80 per animal) of all animals before and after DLS lesion for dominant and non-dominant forelimbs, sorted by IPI and normalized to minimum and maximum displacement for each animal. Black lines mark the 1st lever-press, grey lines the 2nd press. (Row 3) Pairwise correlations between the trials shown in row 2, averaged per animal. (Row 4) Averages of the correlations shown in row 3 by condition (averages of all pre-to-pre, post-to-post and pre-to-post correlations). Mean ± SEM. ***P < 0.001.
D. Similar to C, but for DMS lesions (n=5 rats).
E. Distributions of correlation coefficients between individual forelimb trajectories before (blue) and after (black) DLS lesion, and the animal’s pre-lesion modes (see Methods). Probability distributions were computed for each rat and then averaged (n=6). Fraction of trials with correlations >0.85 (Mean ± SEM): pre 0.58 ± 0.1, pre-post 0 ± 0.
F. Similar to E, but for DMS lesions (n=5 rats). Fraction of trials with correlations >0.85 (Mean ± SEM): pre 0.51 ± 0.08, pre-post 0.53 ± 0.14.
A possible explanation for this lesion-induced change could be that animals default to behaviors that are less vigorous and energetically demanding24. However, we did not observe a significant difference in movement vigor (average and peak speeds of lever-press movements) after DLS lesion (Extended Data Fig. 9A).
DLS lesions cause a reversion to a species-typical behavior
To better understand the nature of the post-lesion deficits, we analyzed the forelimb movement trajectories associated with individual lever-presses. In expert animals, these are highly idiosyncratic and distinct for the first and second lever-press in a sequence (Fig. 8A,B). Following DLS lesions, however, the forelimb trajectories of all lever-press movements, both across first and second presses (Fig. 8A, Supplementary Video 2) and across animals, were very similar (Fig. 8B, Supplementary Video 2) – a dramatic change from before the lesions (Fig. 8A,B).
Figure 8:
DLS lesions cause a loss of idiosyncratic learned lever-press movements and regression to movements common across animals and similar to presses early in learning.
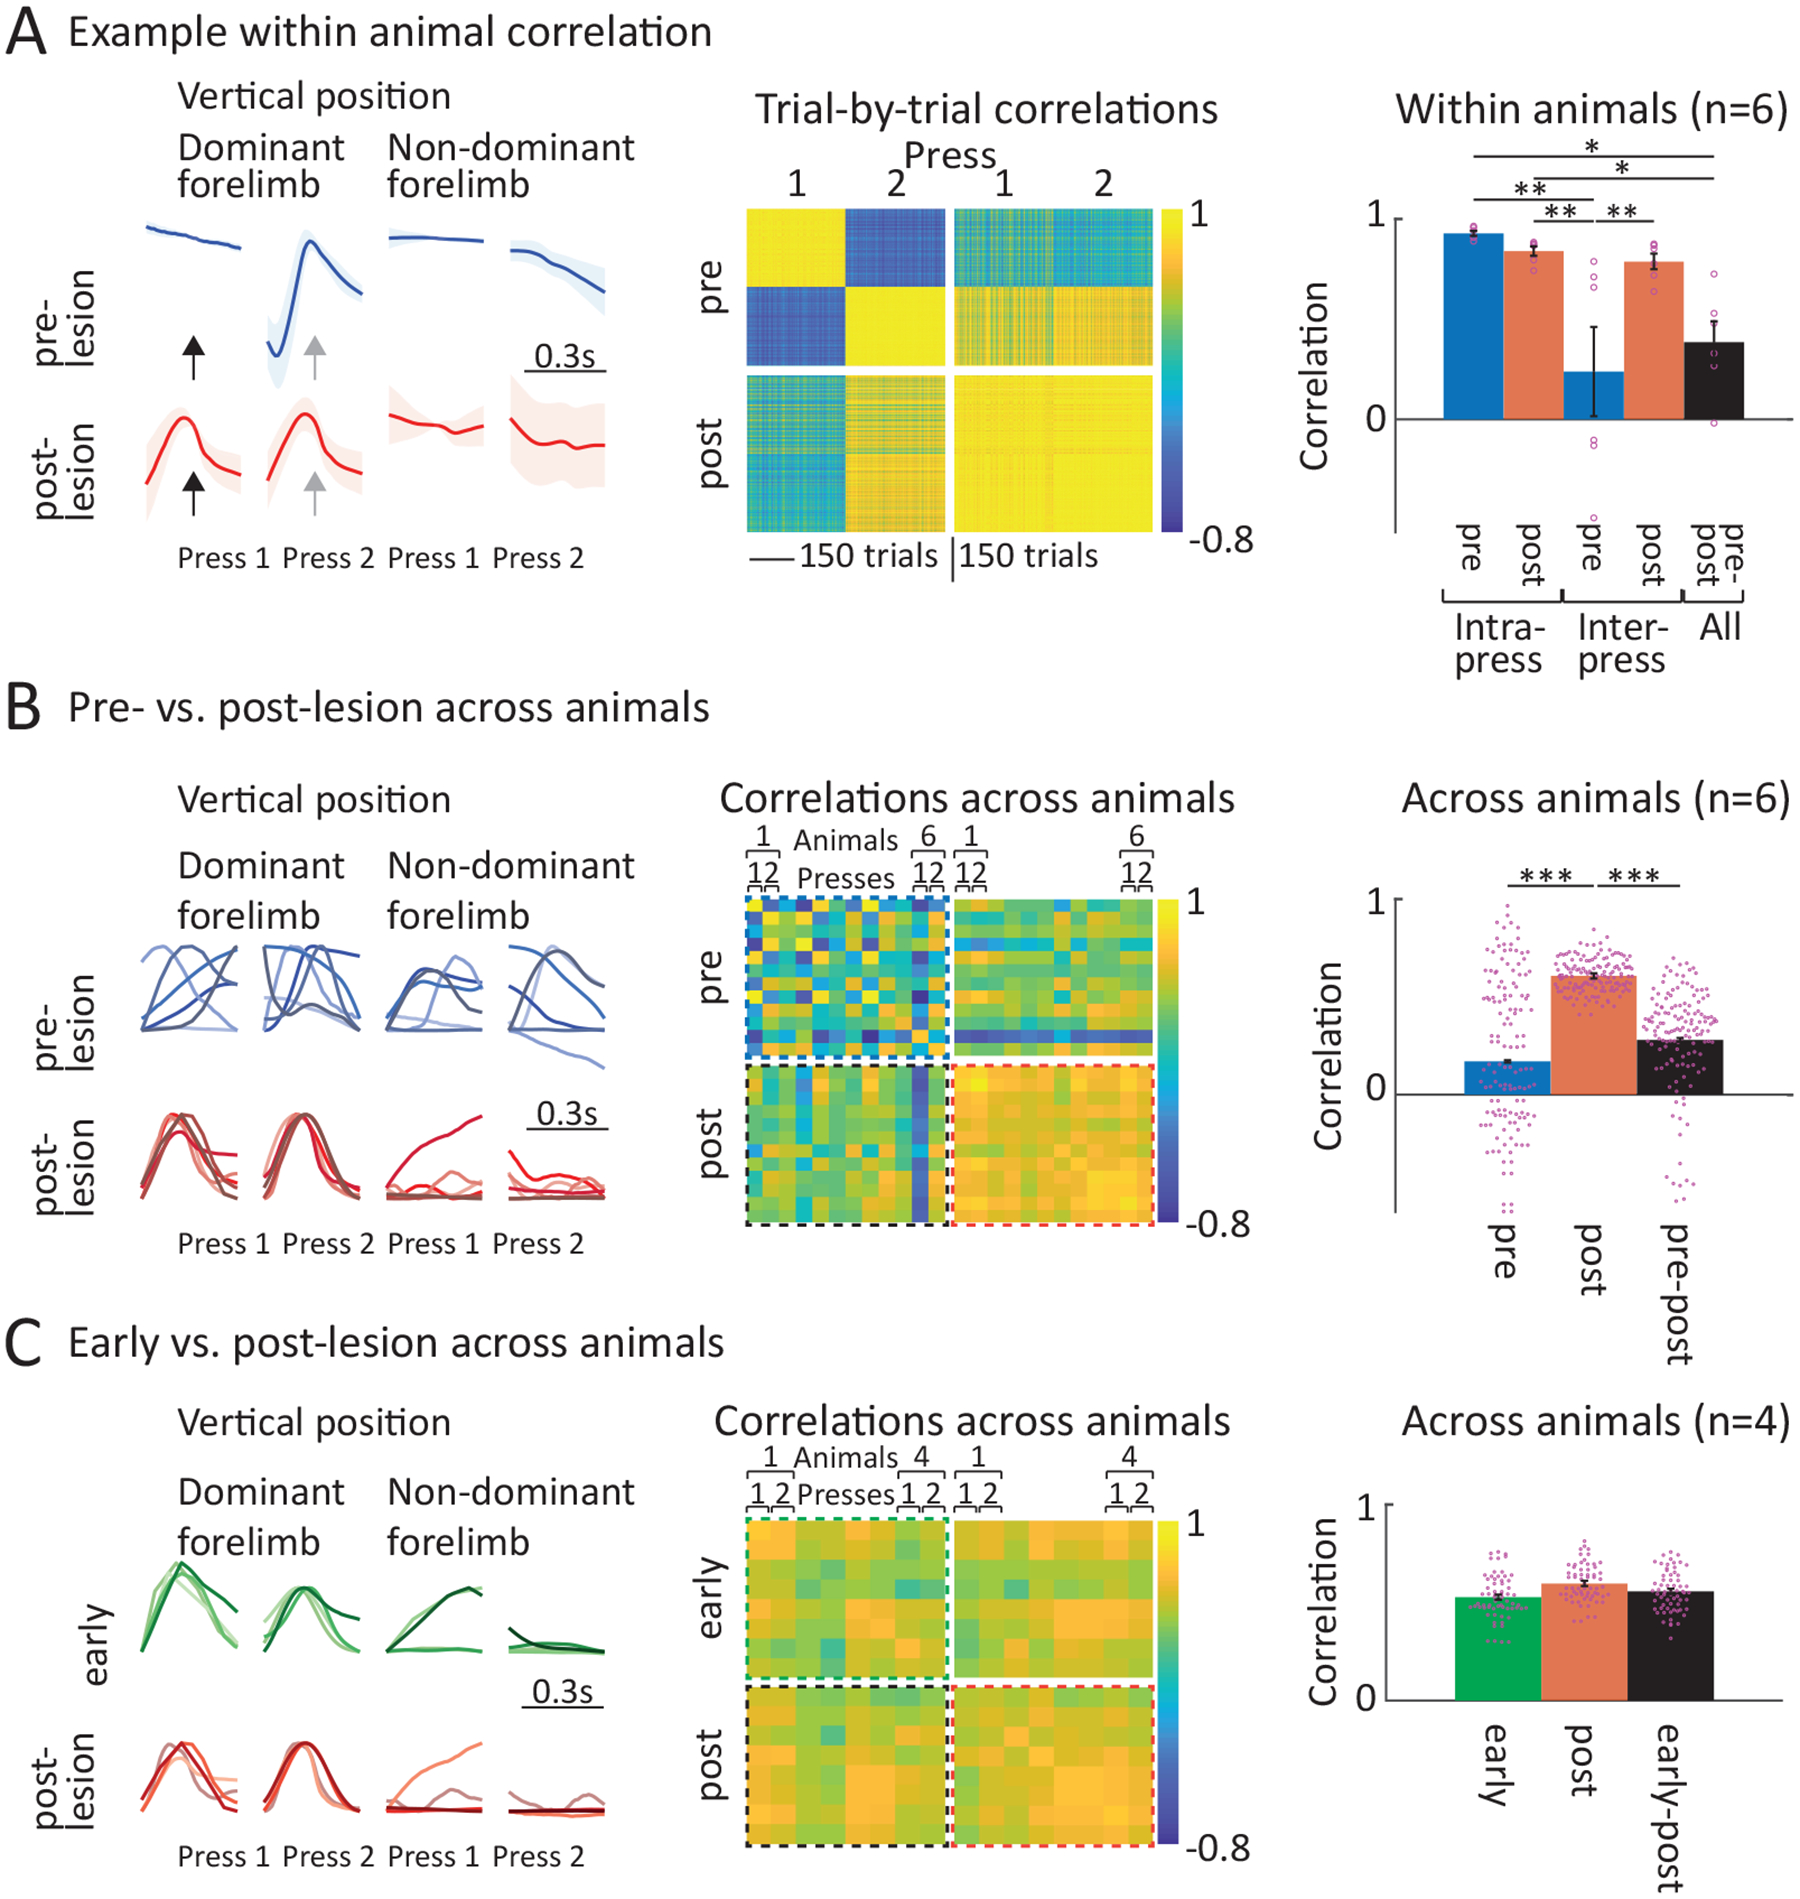
A. Comparison of 1st and 2nd lever-presses within animals before and after DLS lesion. (Column 1) Average movement trajectories for the 1st and 2nd press before and after DLS lesion in an example animal (same as the animal shown in Fig. 7A). Black and grey arrows indicate the time of the 1st and 2nd press, respectively. (Column 2) Pairwise correlations between lever-presses of the example animal before and after DLS lesion. (Column 3) Averages of within animal correlations across animals (n=6 rats) and conditions. Shown are correlations between forelimb trajectories before and after DLS lesion between the same presses (Intra-Press: 1st to 1st and 2nd to 2nd) and between different presses (Inter-Press: 1st to 2nd). Also shown are correlations between the before and after lesion conditions (All) across all 1st and 2nd presses. Dots indicate individual animals, bars show mean ± SEM. For statistical details for all panels see Supplementary Table 6.*P < 0.05, **P < 0.01.
B. Comparison of 1st and 2nd lever-presses across animals before and after DLS lesions. (Column 1) Forelimb movement trajectories for the 1st and 2nd press before and after DLS lesion, overlaid for all tracked animals (n=6 rats, blue and red shades indicate individual animals). (Column 2) Pairwise correlations between press trajectories of all animals before and after DLS lesion. Shown are average trial-to-trial correlations across individual presses (animal 1 press 1, animal 1 press 2, etc.). (Column 3) Averages of across animal correlations per condition. Shown are correlations between all presses before and all presses after DLS lesion. Also shown are correlations between all presses before and all presses after lesion (pre-post). Mean ± SEM. ***P < 0.001.
C. Comparison of 1st and 2nd lever-presses across animals early in training and after DLS lesion. (Column 1) Forelimb movement trajectories for the 1st and 2nd presses early in training (green) and after DLS lesion (red, replotted from panel B), overlaid for all tracked animals (n=4 rats, subsample of rats in B, for which trajectories were available early in training). (Column 2) Pairwise correlations between press trajectories of all animals early in training and after DLS lesion. Shown are average trial-to-trial correlations across individual presses (animal 1 press 1, animal 1 press 2, etc.). (Column 3) Averages of across animal correlations per condition. Shown are correlations between all presses early and all presses after DLS lesion. Also shown are correlations between all presses early and all presses after lesion (Early-post). Mean ± SEM.
This, together with the fact that performance decreased to levels seen early in training (Fig. 6, Extended Data Fig. 8A), led us to speculate that the DLS lesioned animals revert to a BG-independent species-typical lever-pressing strategy, perhaps produced by control circuits in the brainstem54.
If rats indeed have an innate and favored means of pressing the lever, we argued that they would use it early in training as a substrate for the trial-and-error learning process that follows. To probe this, we compared the forelimb trajectories associated with lever-presses early in learning and after DLS lesions for a subset of animals (Fig. 8C, Supplementary Video 2). We found the movements to be very similar across all animals (Fig. 8C, Extended Data Figure 9B, Supplementary Video 2), further supporting the notion that animals revert to species-typical lever-pressing after DLS lesions.
This result could also be seen to support a role for the BG in selecting the learned behavior, which itself is stored and generated in downstream control circuits. Since DLS lesions would interfere with this putative selection process, animals might ‘default’ onto a more instinctual, species-typical lever-pressing behavior. We believe this ‘selection’ model is not a plausible explanation for several reasons. First, DLS activity during our task did not show the hallmarks of action selection (e.g. prominent phasic activity at action boundaries) (Fig. 2D–E, Extended Data Figs. 3,4)5,7,45,47,48. Second, we observed a complete loss of the learned behavior after DLS lesions (Figs. 7E, 8) instead of changes in its expression frequency predicted by a selection model39,55. To probe this idea further, we also examined animals with small DLS lesions (<25% of DLS, Extended Data Fig. 10A, n=3 rats) which we had excluded from prior analysis (Methods). While their task performance was significantly impaired, they performed better than animals with large lesions (Extended Data Fig. 10B). If the DLS selects the learned motor pattern over a ‘default’ innate one, this superior performance should manifest as an increased frequency with which the learned behavior is selected. However, analyzing the task-related movements of animals with small DLS lesions revealed that they neither expressed the repetitive species-typical behavior nor their pre-lesion learned one (Extended Data Fig. 10C–I). Rather, their movement kinematics were altered in idiosyncratic ways, a result far more compatible with the DLS specifying execution-level details of the learned behaviors than with it simply selecting a downstream motor module.
Discussion
We set out to probe whether and how the BG contribute to the execution of task-specific learned movement patterns. We found that neurons in the sensorimotor striatum represent the kinematic details of learned movement patterns (Figs. 3–4), representations that are not contingent on input from motor cortex (Fig. 5) and that reflect a causal role for the BG in the generation of the acquired skills (Figs. 6–8).
The BG’s diverse contributions to learned behaviors
These results inform a longstanding debate concerning BG’s role in the generation of learned behavior. The debate has centered on two dominant models – ‘action selection’ (Fig. 1B) and ‘vigor modulation’ (Fig. 1C) – that have often been pitted against each other. Our discovery of a ‘control’ function for the BG could be seen as yet another theory (Fig. 1D) to fuel the debate and further muddy the picture of what the BG do. Yet, we do not view these theories as incompatible or antagonistic, but rather as examples of a more general role for the BG in learning and enacting state-action policies. Through such a unifying lens, the ‘competing’ theories of BG function simply reflect different types of state-action policies, the particulars of which depend on the learning and control challenges posed by a given task.
If an animal is rewarded for producing a species-typical behavior in a particular context, the BG can learn to map context-specific inputs (e.g. a cue) to an output that helps ‘activate’ the right control module in downstream circuits (‘action selection’). Indeed, neural recordings in animals trained to produce repetitive sequences of species-typical actions, such as lever-pressing or locomotion, show BG activity bracketing the rewarded behavior5,7,25, with a subset of neurons showing elevated activity throughout. However, these neurons do not seem to distinguish between individual actions in the sequence or reflect their detailed kinematics25,43,45. Furthermore, silencing the sensorimotor BG in these tasks does not erase the trained behavior from the subject’s repertoire, but rather alters the probability with which it is selected39,55. This is consistent with the BG biasing the initiation and termination of over-trained behavioral ‘chunks’4,43, the details of which are elaborated in downstream circuits25.
If, on the other hand, the task requires animals to modulate the speed and/or amplitude of movements or action sequences already in their repertoire9,10,24 (Fig. 1C), BG output can produce a signal that acts on the appropriate control circuits to modify the gain of the behavior. In these cases, average activity in the striatum tends to be more uniform across the behavior, with levels of activity reflecting the vigor of the ongoing action9,10 but not its detailed kinematics10. Furthermore, while manipulations of BG activity during such tasks can interfere with the adaptive regulation of movement vigor they tend to leave the behaviors otherwise intact9,10,24.
In contrast to the aforementioned paradigms, our timed lever-pressing task challenges animals to adaptively change the kinematic structure and sequential order of their movements13 (Fig. 1E–F). Thus, what starts out as a BG-independent lever-pressing behavior (Fig. 8C) is shaped, through trial-and-error learning, into an idiosyncratic continuous movement pattern that is unique to an animal and kinematically distinct from the initial behavior (Figs. 1F, 7–8, Supplementary Video 2). DLS activity continuously encodes this new and task-specific kinematic structure (Figs. 3–4) and is essential for generating it (Figs. 7–8). These findings are qualitatively distinct from how the DLS represents and contributes to species-typical behaviors5,7,9,10,25,39,45 and strongly support a model in which the DLS specifies the detailed kinematics of learned motor skills.
Challenging our animals in new ways revealed that the BG can do more than bias the expression and/or the vigor of existing actions. When the task demands it, the sensorimotor arm of the BG (including the DLS) becomes engaged and learns to specify and control the fine-grained kinematic structure of the learned skills. These task-related differences in BG function highlight the importance of carefully considering the specific challenges inherent to a particular task and interpreting the results with those in mind.
BG can function independently of motor cortex
Given that cortex is widely assumed to be the principal source of state information to the BG15,17,18 and that – for learned behaviors at least – motor cortex is thought to be a main target of BG’s output35,56, our finding that BG’s contribution to skilled motor output survives motor cortical lesions inspires a re-evaluation of how cortical and subcortical circuits interact during skilled behaviors.
For example, how do the BG implement state-action policies underlying skilled behavior in the absence of motor cortex? The necessary state information could, in principle, be provided by other cortical areas, such as somatosensory cortex36, yet a recent study suggests that thalamic inputs may play the more critical role in expert animals57. In terms of influencing motor output, the BG most likely act on motor circuits in the brainstem and midbrain2,52. These projections, from thalamus to striatum and from the BG to subcortical motor control circuits, are part of a phylogenetically older ‘BG-subcortical pathway’20.
This pathway is often thought of as a ‘hardwired’ circuit that functions to produce innate behavioral sequences, such as grooming20,58,59. Not unlike the behaviors we train, grooming comprises complex and fairly stereotypical movements that aren’t contingent on motor cortex58. DLS activity reflects the structure of such grooming sequences48 and focal lesions of the DLS disrupt their stereotypy59. Similar inferences about the role of the striatum in organizing action sequences have been drawn from a recent study probing exploratory behaviors in freely behaving mice47.
However, there are important differences in how the DLS encodes naturally expressed action sequences and how it represents the motor skills we train in our task. In grooming and exploratory behaviors, DLS activity preferentially represents the transition between individual motor elements47,48. In contrast, we see a more continuous representation that reflects the time-varying kinematics of the ongoing movements. Similarly, DLS lesions disrupt the syntax of innate action sequences without affecting the kinematics of the individual elements47,59. Though they are less frequent, ‘normal’ grooming sequences can be seen even after DLS lesions59, suggesting that while the BG may bias transitions between the different motor elements, they do not specify their kinematics. In contrast, DLS lesions completely abolished the movement patterns acquired in our task, replacing them with species-typical lever-press movements similar to those expressed early in learning (Figs. 7,8). Thus, while learned behaviors are likely to recruit the same control circuits and mechanisms that generate robust species-typical sequential behaviors60, they utilize them in more flexible and elaborate ways. Rather than merely selecting innate action elements, our results suggest that the BG provide an instructive signal to the brainstem and midbrain motor controllers, allowing their interactions to adapt, shape, and sequence innate motor elements into novel task-specific motor skills.
Comparing the mammalian and avian BG’s role in skilled behavior
Reassuringly, our discovery of a ‘control’ function for the BG mirrors what is seen in songbirds, where the song-specialized BG (Area X) affect the birds’ vocal output in spatiotemporally very specific ways29,30. In juvenile birds, Area X controls much of the microstructure of the bird’s vocalizations31; in adults, it contributes temporally specific error-correcting modifications29. This, similar to our findings, suggests an instructive role for the BG in specifying the precise kinematic structure of motor output16 (Fig. 1D).
Although BG output may play a similar role in the control of skilled behaviors across species, our study demonstrates that its role in the generalist mammal may be more pronounced than in the highly specialized songbird. Indeed, the behavioral specifications Area X provides, however fine-grained, are ultimately transferred to a dedicated (and plastic) song-control circuit downstream of the BG30,31. In contrast, the mammalian brain may not have the luxury of reprogramming lower-level control modules for every new task since this could interfere with other behaviors contingent on these same circuits. This may explain why the output of the large and plastic mammalian BG remains necessary for specifying the detailed structure of well-learned motor skills, especially when these rely on more ‘hardwired’ subcortical control circuits.
In summary, our study probed the function of the BG through the lens of a learned behavior with rich and idiosyncratic kinematic structure. Our results extend our understanding of their function to include an important role in specifying the execution-level kinematic details of learned movement patterns. The specifics of how this function is implemented in subcortical neural circuitry remain to be elucidated.
Methods
Animals
The care and experimental manipulation of all animals were reviewed and approved by the Harvard Institutional Animal Care and Use Committee. Experimental subjects were female Long Evans rats (n=9 for striatal recordings and n=28 for lesion experiments; Charles River Laboratories; RRID: RGD_2308852). Rats were 3–10 months old at the start of training.10,11,52 Because the behavioral effects of our circuit manipulations could not be pre-specified before the experiments, we chose sample sizes that would allow for identification of outliers and for validation of experimental reproducibility. Animals were excluded from experiments post-hoc if the lesions were found to be outside of the intended target area or affected additional brain structures (see Lesion section). The investigators were not blinded to allocation during experiments and outcome assessment, unless otherwise stated.
Statistical tests applied to neural data were non-parametric and did not assume normality. To the extent feasible, these tests employed resampling methods such as randomization and bootstrapping. Statistical tests used in behavioral analyses used parametric statistical tests such as ANOVA and the Student’s t-test (see Supplementary Information for more details). The data distribution for these analyses was assumed to be normal but this was not formally tested. All statistical tests were two-sided. All statistics on behavioral data pooled across animals is reported in the figures as mean ± SEM. Multiple comparison tests were used where justified. The null hypothesis for all applied tests was that the means of the probed metric were equal between the compared groups/time-points, i.e. that there are no systematic or consistent differences between the compared groups/time-points.
No statistical methods were used to pre-determine the number of subjects in our study but our sample sizes are similar to those reported in previous publications9,10,45. The subjects were randomly allocated to experimental groups. Data collection and analysis were not performed blind to the conditions of the experiments, except for histological verification of lesion location and sizes. Units with very low firing rates (<0.25 Hz) during task execution were excluded from many analyses (see for ‘Criteria for unit selection’ for details). Animals were excluded from experiments post-hoc if the lesions were found to be outside of the intended target area or affected additional brain structures (see “Quantification of lesion size” for details).
Behavioral Training
Rats were trained in a lever-pressing task as previously described13. Water-restricted animals were rewarded with water for pressing a lever twice within performance-dependent boundaries around a prescribed interval between the presses (IPI = 700 ms). In addition, animals had to withhold pressing for 1.2 s after unsuccessful trials before initiating a new trial (inter-trial interval: ITI). All animals were trained in a fully automated home-cage training system61. Animals were only used for manipulations or recordings after they had reached our learning criteria (mean IPI = 700 ms ± 10%; CV of IPI distribution < 0.25 for a 3000-trial sliding window) and a median ITI > 1.2 s, indicating that they had learned the task structure and stabilized their performance.
Electrophysiological recordings
Microdrive construction, surgical and recording procedures were as previously described34. Once rats reached asymptotic (expert) performance on the timed lever-pressing task, we performed surgery to implant microdrives containing arrays of 16 tetrodes into the dorsolateral striatum (n=3 rats) or dorsomedial striatum (n=3). In an additional cohort of animals (n=3), we performed recordings in the dorsolateral striatum after motor cortex lesion. For this, we performed two-stage bilateral lesions of motor cortex as previously described13 (see lesion surgeries below). During the surgery for the second motor cortex lesion, we also implanted the microdrive in the dorsolateral striatum. After making a 4 to 5 mm diameter craniotomy and removing the dura, we slowly lowered the 16-tetrode array to a depth of 4.5 mm. Electrodes were targeted to a location 0.5 mm anterior and 4 mm lateral to bregma for dorsolateral striatum and 0.3 mm anterior and 2 mm lateral to bregma for dorsomedial striatum and were implanted unilaterally in the striatum contralateral to the dominant forelimb in the lever-pressing task.
After 7 days of recovery, rats were returned to their home-cages, which had been outfitted with an electrophysiology recording extension. The cage was placed in an acoustic isolation box, and training on the task resumed. Behavioral data was acquired using high-speed imaging (at 120 Hz) from 2 cameras (Flea 3, Point Grey) placed on either side of the training cage. Neural and behavioral data was recorded continuously (24/7) for 12–16 weeks. We occasionally advanced the recording microdrive by distances ranging from ~160–320 μm approximately 2–4 times over the recording lifetime.
At the end of the experiments, animals were anesthetized and anodal current (30 μA for 30 s) passed through select electrodes to create micro-lesions at the electrode tips. Terminal locations for the stimulated electrodes were subsequently determined as described in the Histology section.
Lesion surgeries
Bilateral striatal lesions, targeting either the motor cortex-recipient part (DLS) or the non-motor cortex input receiving part (DMS), and GPi/EP lesions were performed in two stages. Once animals had reached asymptotic task performance (see Behavioral Training), the first striatal lesion was performed contralateral to the paw used for the first lever-press in the acquired behavior. After lesion and recovery (10 days), animals returned to training until their performance stabilized (at least 14 days after lesion). Subsequently, the ipsilateral striatal lesion was performed and after recovery animals were returned to training.
Lesions were performed as previously described13. Anesthetized animals (2% isoflurane in carbogen) were placed in a stereotactic frame. After incision of the skin along the midline and cleaning of the skull, Bregma was located and small craniotomies for injections were performed above the targeted brain areas. A thin glass pipette connected to a micro-injector (Nanoject II, Drummond) was lowered to the injection site and an excitotoxin was injected. For striatal lesions quinolinic acid (0.09M in PBS (pH=7.3), Sigma-Aldrich) was injected in 4.9 nl increments to a total volume of 175 nl per injection site, at a speed of < 0.1 ul/min. For GPi lesions ibotenic acid (1% in 0.1M NaOH, Abcam) was injected in 4.9 nl increments to a total volume of 400 nl per injection site. After injection, the glass pipette was retracted by 100 μm and remained there for at least 3 min before further retraction to allow for diffusion and to prevent backflow of the drug. After all injections were performed, the skin was sutured and animals received painkillers (Buprenorphine, Patterson Veterinary). Animals recovered for 10 days before being reintroduced to training.
For injection coordinates, according to Paxinos62, see Supplementary Table 1.
Motor cortex lesions for the cohort of animals in which we performed electrophysiological recordings in the dorsolateral striatum were performed analogous to striatal lesions and as previously described13. We injected ibotenic acid (1% in 0.1M NaOH, Abcam) in 4.9 nl increments to a total volume of 92 nl per injection site.
For injection coordinates, according to Paxinos62, see Supplementary Table 2.
Control surgeries
To test for nonspecific effects of surgery and striatal injections on behavior, we performed 1-stage control surgeries according to the procedure described above, bilaterally injecting different non-toxic solutions, either fluorophore-coated latex microspheres (red excitation [exc.] = 530 nm, emission [em.] = 590 nm and green exc. = 460 nm, em. = 505 nm) referred to as retrobeads (Lumafluor)63,64 or Adeno-associated viruses (AAVs) for non-specific expression of GFP (Penn Vector Core) into DLS. This allowed for post-hoc evaluation of the targeting of our control injections. Animals were returned to training after 10 days of recovery.
To determine which regions of the striatum receive input from either motor cortex or prefrontal cortex (PFC) we injected AAVs for non-specific expression of GFP (Penn Vector Core) in either motor cortex or PFC. Injections were done in 9.2 nl increments, evenly spaced while slowly retracting the injection-pipette for a total volume of 300 nl per site and 1.5 μl per hemisphere for motor cortex, and 500 nl per site and 1 μl per hemisphere for PFC. After surgery, we allowed for at least 4 weeks of viral expression before histological analysis (see Histology).
For injection coordinates, according to Paxinos62, see Supplementary Table 3.
Histology
At the end of the experiment, animals were euthanized (100 mg/kg ketamine and 10 mg/kg xylazine), transcardially perfused with 4% paraformaldehyde (PFA), and their brains were harvested for histology to confirm lesion size and location, or electrode implantation site. The brains were sectioned into 80 or 100 μm slices using a vibratome (Leica), mounted and stained with cresyl violet to reconstruct either lesion size or electrode location. In a subset of animals, immunofluorescence staining was performed instead of cresyl violet staining. After slicing, sections were blocked for 1 h at room temperature in blocking solution (1% BSA, 0.3% TritonX), stained overnight at 4°C with primary antibodies for NeuN (to stain for neuronal cell bodies; 1:500 in blocking solution; Millipore MAB377) and GFAP (to stain for glia cells; 1:500 in blocking solution; Sigma G9269) and then with appropriate fluorescently-coupled secondary antibodies (1:1000 in blocking solution; anti-Mouse, Alexa Fluor 647 conjugate, A-21236 and anti-Rabbit, Alexa Fluor 488 conjugate, A-11034, both Thermo Fischer Scientific) for 2 h at room temperature.
To determine the extent of motor cortex and PFC projections in the striatum, immunofluorescent staining was performed in the same way, but for NeuN (see above) and GFP (1:1000 in blocking solution, Thermo Fischer A111122 and 1:1000 anti-Rabbit, Alexa Fluor 488 conjugate, A-11034, Thermo Fischer Scientific) to amplify the signal from the viral GFP expression.
Images of whole brain slices were acquired at 10x magnification with either a VS210 Whole Slide Scanner (Olympus) or an Axioscan Slide Scanner (Zeiss).
Quantification of lesion size
To determine the extent and location of striatal lesions, we analyzed several sections (4–6) spanning the anterior-posterior extent of the striatum, allowing for an estimate of the overall lesion size. Lesion boundaries were determined throughout the striatum and adjacent areas, blind to the animals’ identity and performance. Boundaries were marked manually based on differences in cell morphology and density (loss of larger neuronal somata and accumulation of smaller glial cells). The extent of the striatum was determined based on the Paxinos Rat Brain Atlas62, using anatomical landmarks (external capsule, ventricle) and cell morphology and density. Additionally, we marked the GPe in posterior sections, since mistargeted injections may lead to its partial lesioning, disrupting the output both of the DLS and DMS.
In addition to overall lesion size, we also determined the lesioned fractions of the DLS/DMS. Since DLS and DMS are not clearly defined, we made use of their differential input patterns from motor cortex and PFC, respectively, to estimate their extent. We used viral expression of GFP in motor cortex or PFC to visualize their respective axonal projection patterns in the striatum (n=3 each; see Control surgeries). Areas with axonal labeling in all animals were considered as motor cortex-input/PFC-input receiving. We used these identified boundaries of DLS and DMS to determine the lesioned fractions in the experimental animals. Based on these estimates we excluded animals with lesions affecting less than 50% of the respective target area or more than 10% of the non-targeted part of the striatum (n=4 rats) from the main analysis. Of these animals, we used n=3 rats with small DLS lesions (<25% of DLS lesioned) for a comparison to the effects of large DLS lesions (Extended Data Fig. 10). In addition, we excluded animals with lesions affecting a significant part of the GPe (>30%; n=3 rats).
Kinematic Tracking
To determine the movement trajectories of the animals’ forelimbs and head in our task, we made use of recently developed machine learning approaches, using deep neuronal networks to determine the position of specific body parts in individual video frames41,42.
Task-videos were acquired at 120 Hz by cameras pointing at the lever from either side and saved as snippets ranging from 1 s before the first lever-press to 2 s after the last lever-press in a trial. We randomly selected about 500 frames from each perspective, balanced across pre- and post-manipulation conditions and manually labeled the position of the forelimbs and head in each frame, using custom-written Matlab code. This data was used to train individual neural networks for each animal.
We trained ResNet-50 networks that were pretrained on ImageNet, using DeeperCut (https://github.com/eldar/pose-tensorflow)41 in Python 2.7 (Python Software Foundation). Training was performed using default parameters (1 million training iterations, 3 color channels, with pairwise terms, without intermediate supervision). Data augmentation was performed during training by rescaling images from a range of 85% to 115%.
The trained neural network was then used to predict the position of the body parts in all frames in all trials. The position of a body part in a frame is given by the peak of the network’s output score-map. Frames in which the body part was occluded were identified as having a low peak score. For both the training and the subsequent predictions we used GPUs in the Harvard Research Computing cluster.
Because the two forelimbs could often be confused for each other in the neural network’s predictions from a single frame, we took advantage of correlations across time to constrain the predictions. For each forelimb, the predicted score-maps for all frames in a single trial video were passed through a Kalman filter using the Python toolbox filterpy. Specifically, a constant-acceleration Kalman smoother was used which assumes that the forelimb on adjacent frames will have the same acceleration (zero jerk) plus a small noise term. Only frames with a weak neural-network prediction score were adjusted by the Kalman filter; otherwise the original neural-network prediction was used as the forelimb position.
The tracking accuracy was validated post-hoc by visual inspection of at least 50 predicted trajectories per animals. Initial training with lower frame numbers often led to inaccurate tracking results. After settling on a number of 500 training frames, none of the trained networks was discarded.
Missing frames in the trajectories, e.g. due to temporary occlusions of the forelimbs, were linearly interpolated for a maximum of 5 consecutive frames. Trajectories with longer occlusions were discarded. One animal was excluded from trajectory analysis, since the quality of the recorded videos was not sufficient for high-quality tracking due to inappropriate lighting conditions and long-lasting occlusions of the forelimbs
Neural data analysis
Spike-sorting
We used our custom-designed spike-sorting algorithm Fast Automated Spike Tracker (FAST)34 to parse the raw neural data collected over weeks and months of continuous recordings, and isolate the spiking activity of populations of single units in an efficient and high-throughput manner. Extensive details and validation of our spike-sorting procedure can be found in a previous publication from our group34.
Unit type identification
Isolated units were classified as putative spiny projection neuron (SPN) or fast spiking interneuron (FSI) types on the basis of their spike-waveform features – including peak width (full width at half maximum) and time-interval between spike peak and valley – as well as their mean firing rates, averaged over a unit’s recording lifetime65,66. Units with peak width >150 μs, peak-valley interval >500 μs and mean firing rate ≤10 Hz were classified as SPNs (76.1%), while units with peak width ≤150 μs, peak-valley interval ≤500 μs and mean firing rate ≥0.1 Hz were classified as FSIs (15.5%). Leftover units that did not meet any of these criteria (8.5%) were excluded from all neural analyses.
Criteria for unit selection
For all analyses, the sole criterion for unit inclusion was whether its average firing rate during the “trial” period equaled or exceeded a threshold value of 0.25 Hz. The duration of the trial period depended on the analysis. For PETH analyses, it ranged from 1 s prior to the 1st lever-press until 2 s following this event. For the encoding and decoding analyses which depended on accurate movement tracking, the trial period was narrower and ranged from 0.2 s prior to the 1st lever-press until 0.2 s after the 2nd lever-press. The reason for this narrower window was that we were able to reliably track rats’ movements only during this period since the field of view of our high-speed cameras was restricted to the vicinity of the lever. Of the total striatal units (SPNs and FSIs) recorded in the DLS, DMS and motor-cortex lesioned DLS, these criteria eliminated 31%, 49% and 36%, respectively, from the trial-averaged PETH analyses, and 47%, 56% and 46%, respectively, from the trial-by-trial encoding analyses.
Peri-event time histograms (PETHs)
We computed peri-event time histograms (PETHs) of unit firing rates, aligned to the first lever-press of the timed lever-pressing task. Even though our spike-sorting algorithm tracks units across multiple days, we only considered trials recorded on a single day, in order to avoid confounds due to possible day-by-day instability in single unit representations. For each unit, we chose the recording day with the most behavioral trials, pooling from up to 2 consecutive behavioral sessions. To restrict our analysis of neural activity to periods of stereotyped behavior, we selected only rewarded trials that followed previously rewarded trials (to control for the rat’s starting position), and these trials’ inter-press intervals had to be within 20% of the target inter-press interval of 0.7 s (to ensure movement stereotypy). To account for the remaining variation in the length of the behavior, we linearly warped all spike-times that occurred between the 1st and 2nd lever-press by a factor: where is the inter-press interval (in seconds) on that trial67.
PETHs were computed separately for each sequence mode (see section ‘Identification of sequence modes’), for the period ranging from 1 s prior to until 2 s following the 1st lever-press of the behavior. We discretized the warped spike train in 25 ms bins to yield time-varying spike counts, which were then summed over trials to yield the PETH. To compute the Z-scored PETH, we used a bootstrap approach to generate 1e6 “shuffled” PETH bins by sampling, with replacement, from the pool of all spike counts (pooled over all times in the learned behavior and across all trials) used to compute the observed PETH. We computed the mean and standard deviation of these shuffled PETH bins and used these to Z-score the observed PETH. We smoothed the Z-scored PETH with a Gaussian kernel (σ = 25 ms) before plotting, or before calculating its maximum or minimum value which we termed the Z modulation of that unit.
Trial-by-trial correlations of neural activity
To calculate trial-by-trial correlations for a given neuron, we binned all spikes recorded within the period 1 s prior to and 2 s following the 1st lever-press into 25 ms bins on individual trials and then smoothed the spike-count vector with a Gaussian kernel (σ = 25 ms). We then calculated the correlation coefficients between the smoothed spike-count vectors for pairs of trials and averaged these measurements over all pairwise combinations of trials in which the unit spiked at least once.
Sparseness index
We calculated the sparseness index as previously described68. We first calculated PETHs (25 ms bins) for each unit during the period ranging from 1 s prior to and 2 s following the 1st lever-press, as described above. Histograms were divided by the total number of spikes to yield the spiking probability within each bin (). We then computed the sparseness index (SI)69 as:
where N indicates the number of bins in the histogram. This index is 1 (maximal sparseness) when the activity is restricted to a single time bin and 0 if the spikes are evenly distributed across the time bins.
Testing non-uniformity of population activity
To determine whether the average activity of DLS SPN units was non-uniformly distributed over the learned behavior, we averaged Z-scored PETHs (calculated at 25 ms resolution) over the population of recorded units and then measured the non-uniformity of this population-averaged activity by calculating its standard deviation over time. The standard deviation of the population-averaged activity was computed separately for each sequence mode (see section ‘Identification of sequence modes’), then averaged across all modes identified for a given rat and finally across DLS recordings (n=3 rats). We only considered sequence modes for which we had recorded at least 50 units. The population averaged standard deviation was compared to the distribution expected by chance if the PETHs of individual neurons were jittered in time relative to each other (n=1e4 permutations).
Processing of kinematic data for neural data analysis
We smoothed the raw trajectories (position traces) of markers on the forelimbs and the head (see section Kinematic Tracking) using a cubic smoothing spline (function csaps in Matlab, smoothing parameter = 0.1). To account for possible movement in camera position from one session to the next, we subtracted from each trace the average position of that marker at the time of the 1st lever press in that session. Following this, we computed the velocity and acceleration of each marker in both horizontal and vertical dimensions. All kinematic features were down sampled by averaging to match the timescale at which neural data was binned (25 ms bins).
Statistics of event (lever-press, start/stop, choice-point) aligned average activity
To determine whether average SPN or FSI activity in the DLS was significantly modulated at the time of either the 1st or 2nd lever-presses, or at the start or stop (as quantified by analysis of trial-to-trial variability in movement trajectories), or at choice-points within the behavior, we considered the population averaged Z-scored activity (in 25 ms bins) within a ±0.2 s window centered on the event of interest. We chose the range of this analysis window based on the specifics of our motor task and established knowledge of the timescales over which BG activity is reported to influence movement. Due to the rapid succession of salient events in the interval pressing task such as the 1st and 2nd lever presses (0.7 s interval) and reward delivery (typically within 0.3–0.4 s following the end of the skilled behavior), we restricted the window size to ±0.2 s such that an activity peak, if it did exist, could be unambiguously linked to a particular task-related event. This window is also larger than the timescale over which many prior studies observe average striatal activity peaking relative to the start or end of a learned behavior5,25,70.
The average activity across SPNs and FSIs was calculated separately for each mode (see section Identification of sequence modes) for which we recorded at least 50 units, then averaged across modes within each rat and then across all rats in which we recorded from DLS. In case of choice-points, we also averaged together the Z-scored activity of the pair of modes being compared. This average trace was compared to a distribution of average Z-scored activity expected by chance if the events occurred at random times within the skilled behavior (ranging from 1 s before and 2 s after the 1st lever-press, n=1e4 permutations). The confidence interval was adjusted for multiple comparisons (for the n=5 bins within 0.1 s of the event) using the Šidák correction.
Correlations between measures of neural activity and behavior
Correlations between measures of neural activity, such as population-averaged activity or distance between ensemble representations, and measures of behavior, such as average forelimb speed or discriminability between trajectories of pairs of sequence modes, were obtained by computing the correlation coefficient for every sequence mode (or pairs of modes) and then averaging these across all modes (or mode pairs) for every rat, and finally across all rats (n=3 DLS rats). To determine if these correlation coefficients were statistically significant, we compared the observed average correlation coefficient to a null distribution generated by randomly jittering the temporal relationship between the measure of neural activity and the measure of behavior at the level of individual sequence modes / mode pairs (n=1e4).
Quantifying distance between ensemble neural representations of sequence mode pairs
For this analysis, we considered only pairs of modes in which we had recorded at least 50 units in total. Note that different units in this dataset could be recorded on different days – i.e. they constituted a pseudo-population. For each unit and sequence mode, we computed 1st lever press aligned PETHs of trial-averaged spike counts (in 25 ms bins) ranging over a period 0.3 s prior to and 1 s after the 1st lever-press. Before averaging, we square-root transformed the spike counts to stabilize their variance and prevent high firing rate units from dominating the analysis. As before, we only considered trials whose IPIs were within 20% of the target and we linearly time-warped spikes between the two lever-presses to account for residual variation in the IPI. We then performed principal component analysis (PCA) on the matrices of population activity (neurons versus time) concatenated across the two modes along the time dimension. We restricted our analysis to the subspace defined by the principal components that accounted for at least 90% of the total variance (6 ± 2 PCs, n=3 rats, mean ± SD). We computed the Euclidean distance between the neural trajectories corresponding to each mode as a function of time, Z-scored with respect to their time-averaged trial-by-trial variation (quantified using neural trajectories computed from randomly split halves of the trials within each mode).
Encoding analysis
We used generalized linear models (GLMs) to determine the extent to which the instantaneous activity of striatal units could be predicted from the kinematics of the movement patterns. For each unit, we measured spike counts (25 ms bins) within the trial period ranging from 0.2 s before the 1st lever-press until 0.2 s after the 2nd lever-press. When fitting the GLMs, we used an exponential link function and modeled the observed spike counts with a Poisson distribution. 75% of the trials in each session were used for training the GLM, and the remaining 25% were held out for testing. We used elastic-net regularization (90% L1, 10% L2) to prevent over-fitting. The optimal value of the regularization penalty parameter (λ) was determined for each neuron separately using 5-fold cross-validation within the training set of trials. GLMs were fit to data using the software package “Glmnet for Matlab (2013)” (http://www.stanford.edu/~hastie/glmnet_matlab/)71.
Kinematic regressors for the encoding models included the horizontal and vertical components of the position, velocity and acceleration of contra- and ipsilateral forelimbs and the head. Since the kinematic variables were sampled at 120 Hz, 3 consecutive samples of these measurements were used to predict the co-incident 25 ms spike count bin. Goodness of fit for the encoding model was measured by a log-likelihood based measure termed the pseudo-R2 72.
Here is the log-likelihood of observing spike-count data given the GLM’s predictions, is the log-likelihood of a “saturated” model that has as many parameters as observations, and is the log-likelihood of the data given a “null” model that only fits the average spike count in the dataset. Since our spike sorting method allows for tracking the same units across multiple session, we fit separate encoding models in each session and then, for each unit, reported the average encoding pseudo-R2 across sessions.
Decoding analysis
Following previous work73, we used a feedforward neural network with two hidden layers to predict the time-varying vertical and horizontal velocity components of the forelimbs and the head, sampled at 25 ms intervals, using 75 ms of co-incident spiking activity (binned into 25 ms bins) from ensembles of striatal neurons (including both SPNs and FSIs). The network comprised two fully connected hidden layers of 400 units each with a rectified linear activation function. While training the network we used dropout on the two hidden layers (dropout probability = 0.05). We used the Adam optimizer to train the neural network. We measured the accuracy of decoding using 4-fold cross-validation. For this analysis, we only considered behavioral sessions in which there were at least 10 (or 15) simultaneously recorded units that fired at least 1 spike in total across all trials within the trial period (from 0.2 s before and 0.2 s after the 1st lever-press and 2nd lever-press, respectively). In these sessions, we fit decoding models using the activity of up to n=20 randomly sampled ensembles of size 5 to 10, as well as 15 striatal units. In each session, only trials corresponding to the most frequent sequence mode were considered for this analysis. Decoding accuracy measured in each ensemble was then averaged across all 20 ensembles of the same size and then averaged across the relevant sessions in each rat’s dataset.
Behavioral data analysis
Identification of sequence modes
Close examination of task-related kinematics revealed that individual rats often solve the interval pressing task using multiple unique, but related, movement patterns that we refer to as “sequence modes”. To systematically identify these sequence modes, we performed unsupervised clustering of all task-associated kinematics recorded from individual rats. This kinematic data included horizontal and vertical components of position, velocity, and acceleration of both forelimbs, recorded during a period ranging from 0.2 s preceding the first lever-press to 0.2 s following the second lever-press, for all trials in which the rat performed at least two lever-presses within 1.2 s. To account for trial-to-trial variability in inter-press intervals, we linearly time-warped (i.e. resampled) kinematic data recorded between the two lever-presses to a target interval of 0.7 s. The variance of each kinematic feature (position, velocity, or acceleration) was standardized by dividing by its standard deviation estimated across all time-points and horizontal and vertical components for both forelimbs. After pre-processing, we performed 2-dimensional t-distributed stochastic neighborhood embedding (t-SNE)74 of the kinematic data associated with each trial (all kinematic features and components, forelimbs and time-points). We then applied density peak clustering75 to identify putative sequence modes. In the final step, we manually corrected for over-clustering by the density peak algorithm by examining the task-aligned kinematic traces for each cluster and combining those which had very similar kinematics that were judged to lie along a continuum.
Identifying the start and end of the skilled behavior
This analysis was restricted to trials whose inter-press intervals were within 20% of the target inter-press interval of 0.7 s and was performed separately for each sequence mode. To account for residual trial-to-trial variability in the inter-press interval, we resampled the traces between the 1st and 2nd lever-press to have the same number of samples (i.e. the trajectories were linearly time-warped). To quantify trial-to-trial variability in these movement trajectories, we calculated the average standard deviation of task-aligned horizontal and vertical position traces of both forelimbs and the head, as a function of time within the skilled behavior. We then identified the times at which the standard deviation of the trajectories exceeded a threshold value either before the 1st lever-press (“start”) or after the 2nd lever-press (“stop”). The threshold was set to twice the average standard deviation of the trajectory between the two lever-presses.
Identifying choice-points from movement trajectories of sequence mode pairs
The continuous and stereotyped nature of the skilled behaviors we train, makes their segmentation difficult using previously established criteria such as ‘pauses’ in motor output76,77 or a reduction in stereotypy78. Instead, we identified choice-points by comparing pairs of sequence modes. We quantified the time-varying separation between the movement trajectories recorded during execution of distinct modes (see section Identification of sequence modes) as the cross-validated (10-fold) accuracy of a quadratic discriminant model trained on the instantaneous positions of the forelimbs and the head. For this analysis, we only considered trials whose IPIs were within 20% of the target (0.7 s) IPI. We linearly time-warped the movement trajectories to account for residual trial-to-trial variation in the IPI. We restricted this analysis to the same sessions in which we performed the accompanying neural analysis (see below). We designated the time at which the discriminability (classifier accuracy) first exceeded 70% as the “choice-point” between the two modes and the time of peak classifier accuracy as the time of “peak discriminability”.
Performance metrics
Performance metrics were determined based on the timing of lever-presses in our task. The inter-press interval (IPI) was determined as the time between the 1st and 2nd press in a trial, the inter-trial interval (ITI) as the time between the last press in an unsuccessful trial and the next occurring lever-press. The CV was calculated across 25 trials and the moving average was low pass-filtered with a 50-trial boxcar filter. The fraction of trials close to the target IPI was calculated using the same windows and filters. Trials were labeled as close to the target if they were in the IPI range of 700 ms ± 20%.
Calculation of JS divergence
As a measure for the dissimilarity of the IPI and ITI distributions in individual animals, we calculated the Jensen-Shannon (JS) divergence of the distributions. The JS divergence is a symmetric derivative of the Kullback-Leibler divergence (KLD). We calculated the JS divergence (JSD) as:
where
Trajectory analysis for behavioral experiments
We compared the trajectories of both forelimbs of all tracked animals before and after DLS or DMS lesions (Fig. 7,8). We focused on the position of the forelimbs in the vertical dimension, in which the movements in our task are more pronounced than in the horizontal dimension. To be able to compare the stereotypy of the trajectories for the learned movement patterns, we sub-selected trials which were successful and rewarded, and which occurred after unrewarded trials. This allowed us to compare trials with the same start and end positions. This is necessary, since animals move down to, and back up from, a reward port underneath the lever after successful trials13. We further sub-selected trials only from the most common, dominant sequence mode (see Identification of Sequence Modes above), so that trajectories were comparable. We plotted the average of the selected trajectories before and after the manipulation, calculated the SEM (Fig. 7A,B) and plotted a projection of all selected trials (Fig. 7A,B). To calculate the correlations between the individual trials, we linearly time-warped the trajectories to the same duration by interpolating between the lever-presses. Since the lever-presses themselves have stereotyped trajectories, largely independent of the trial duration, we interpolated only the trajectories from 100 ms after the first to 100 ms before the second lever-press to preserve the shape of the presses. From these time-warped trajectories we calculated trial-to-trial correlations separately for both forelimbs and averaged the correlations for each trial (Fig. 7A,B). These correlations were averaged for the individual conditions within animals and those means were averaged across animals and plotted with the SEM (Fig. 7A,B).
To compare the trajectories across animals, we linearly time-warped all trajectories and normalized their amplitude to their individual maximum amplitude (Fig. 7C,D). To calculate the correlations across animals, we first calculated the average pair-wise correlations across all trials within individual animals, and then averaged these across the individual animals (Fig. 7C,D).
The distributions of correlation coefficients between individual forelimb trajectories before and after lesions (Fig. 7E,F, Extended Data Fig. 10G) were calculated as follows: The pair-wise correlations between individual trajectories before or after the lesion and the mean trajectory of each of the animal’s pre-lesion sequence modes were calculated (same trial selection criteria as for other analyses: IPI range 700 ± 200 ms, rewarded trials after unrewarded trials). For each trial, the highest correlation to a pre-lesion mode was selected to determine the probability distribution of the maximum pre-pre and pre-post correlations. Shown in the figures are the average probability distributions across animals.
We separately compared the lever-press movements, defined as the trajectory in the range of ±150 ms around a detected lever-press (Fig. 8A) and performed the same analysis as for the full trajectories in Fig. 7. To compare the lever-presses across animals before and after DLS lesion, we normalized the trajectories to their individual maximum amplitude and plotted their overlay (Fig. 8B). As above, we calculated the average pairwise correlations for all lever-presses in all trials of all animals across the conditions (pre- and post-lesion) and averaged them first by lever-press (i.e. animal 1 press 1, animal 1 press 2, etc.) and then by condition (Fig. 8B). To compare the lever-presses after the lesion to the presses early in training, we additionally sub-selected trials as described above from the first 2000 trials of training. And performed the same analysis (Fig. 8C; Extended Data Fig. 9B). These results were also compared to the lever-presses of animals with small DLS lesions (Extended Data Fig. 10H,I).
Extended Data
Extended Data Fig. 1. Striatal subdivisions, recording sites and extent of lesions.
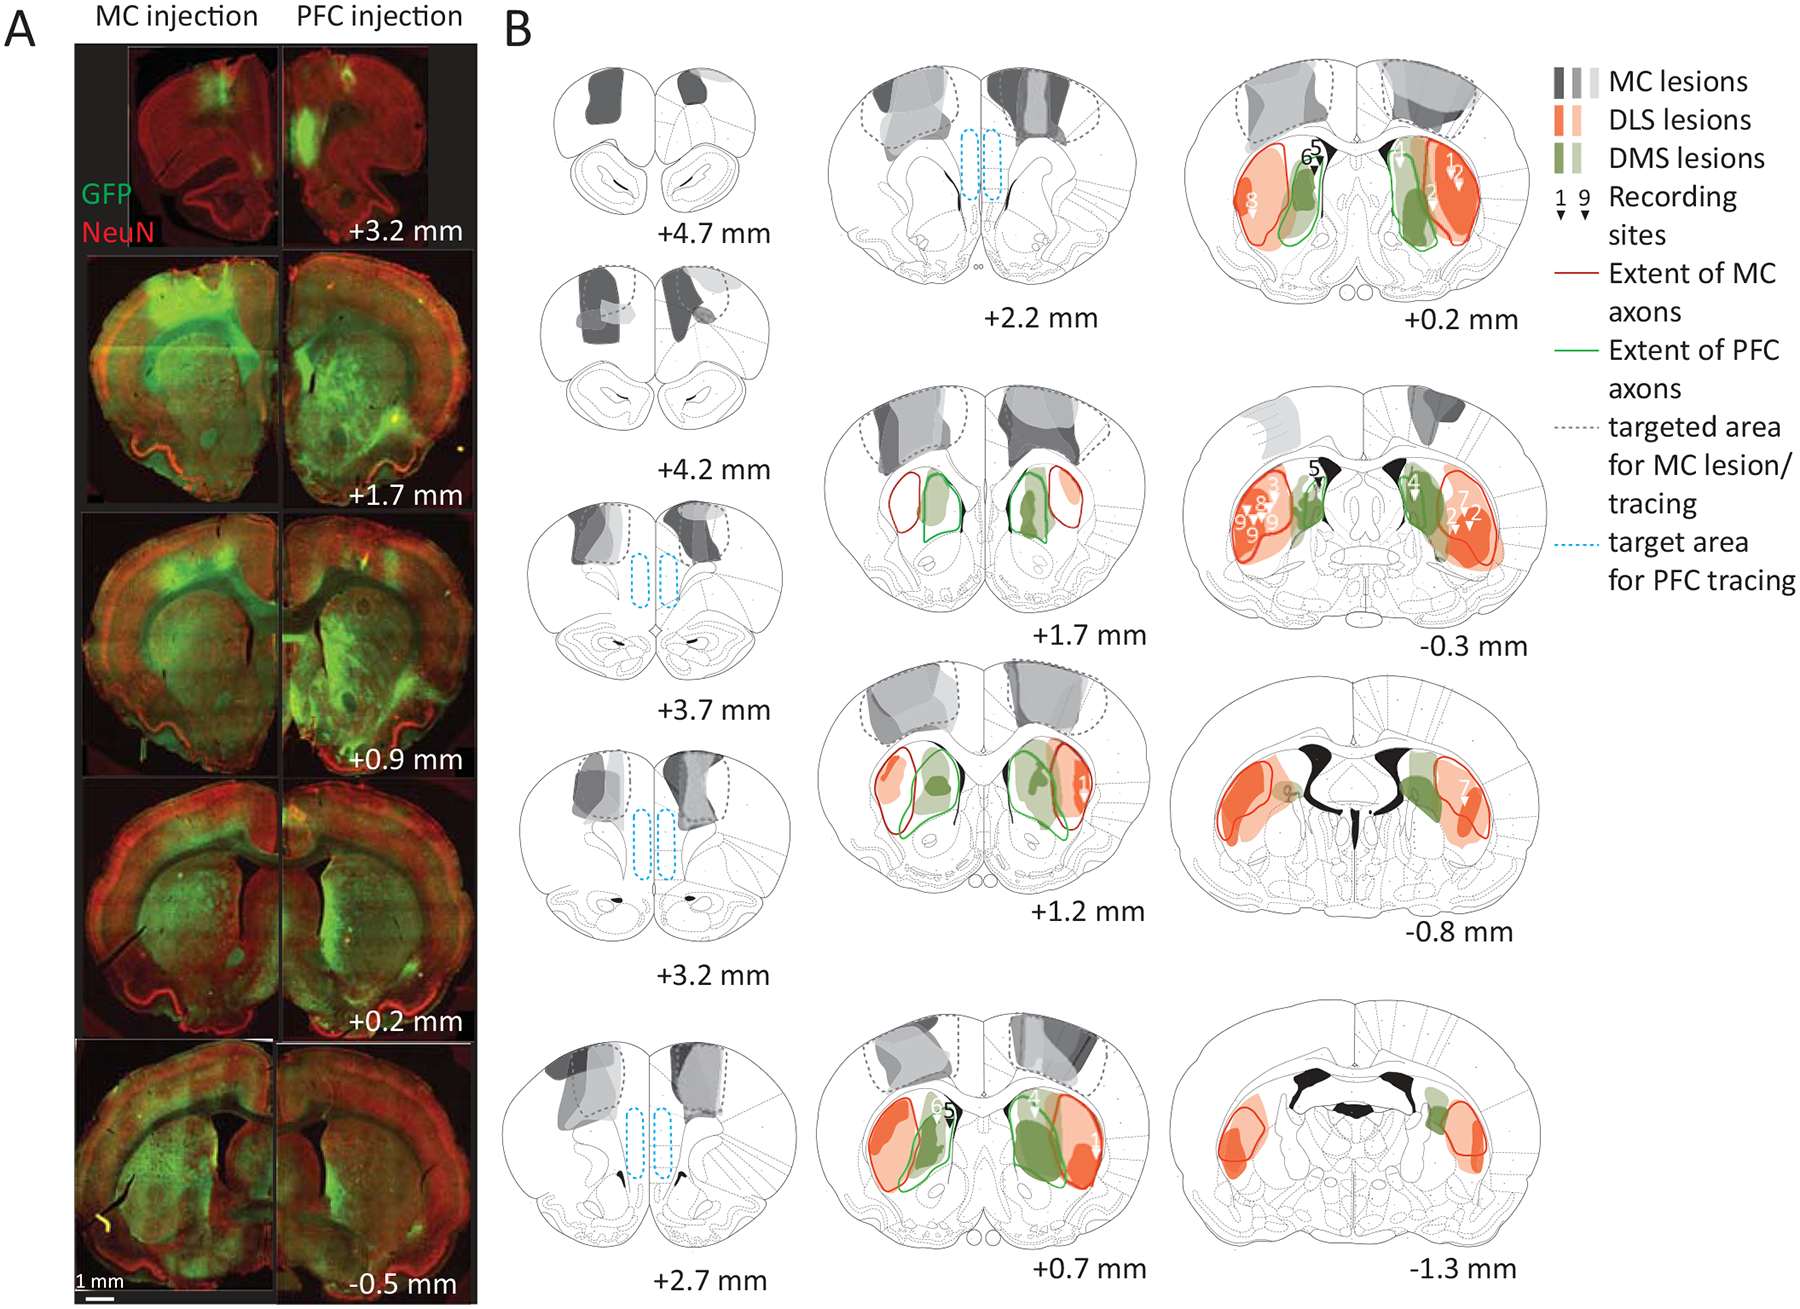
A. Virally-mediated fluorescent labeling of axons originating in either motor cortex (MC) or prefrontal cortex (PFC) to determine the outlines of the MC-recipient dorsolateral striatum (DLS) and of the PFC-recipient dorsomedial striatum (DMS), respectively. Based on the distinct projection patterns we estimated the extent of the DLS and DMS, respectively, along the anterior-posterior axis of the striatum.
B. DLS/DMS outlines, recording sites and lesion extents. The outlines of the DLS and DMS determined in A along the anterior-posterior axis are indicated by red and green lines, respectively. Locations of recording electrode implantation sites in DLS and DMS are marked with arrowheads. Numbers indicate individual animals. For some animals several recording locations were determined, due to individual tetrode bundles of our recording arrays spreading apart during implantation. The extents of MC lesions in three recorded animals are marked in different shades of grey for individual animals and the dotted lines indicate the area in MC targeted for lesions. The extents of the DLS and DMS lesions are marked as shaded red and green areas, respectively. Lighter areas indicate the extent of the largest lesion across animals at a given anterior-posterior position, darker areas indicate the extent of the smallest lesion. Blue dotted lines indicate the target area for PFC tracing injections.
Extended Data Fig. 2. Classification of striatal units and statistics of task-aligned FSI activity in DLS and DMS.
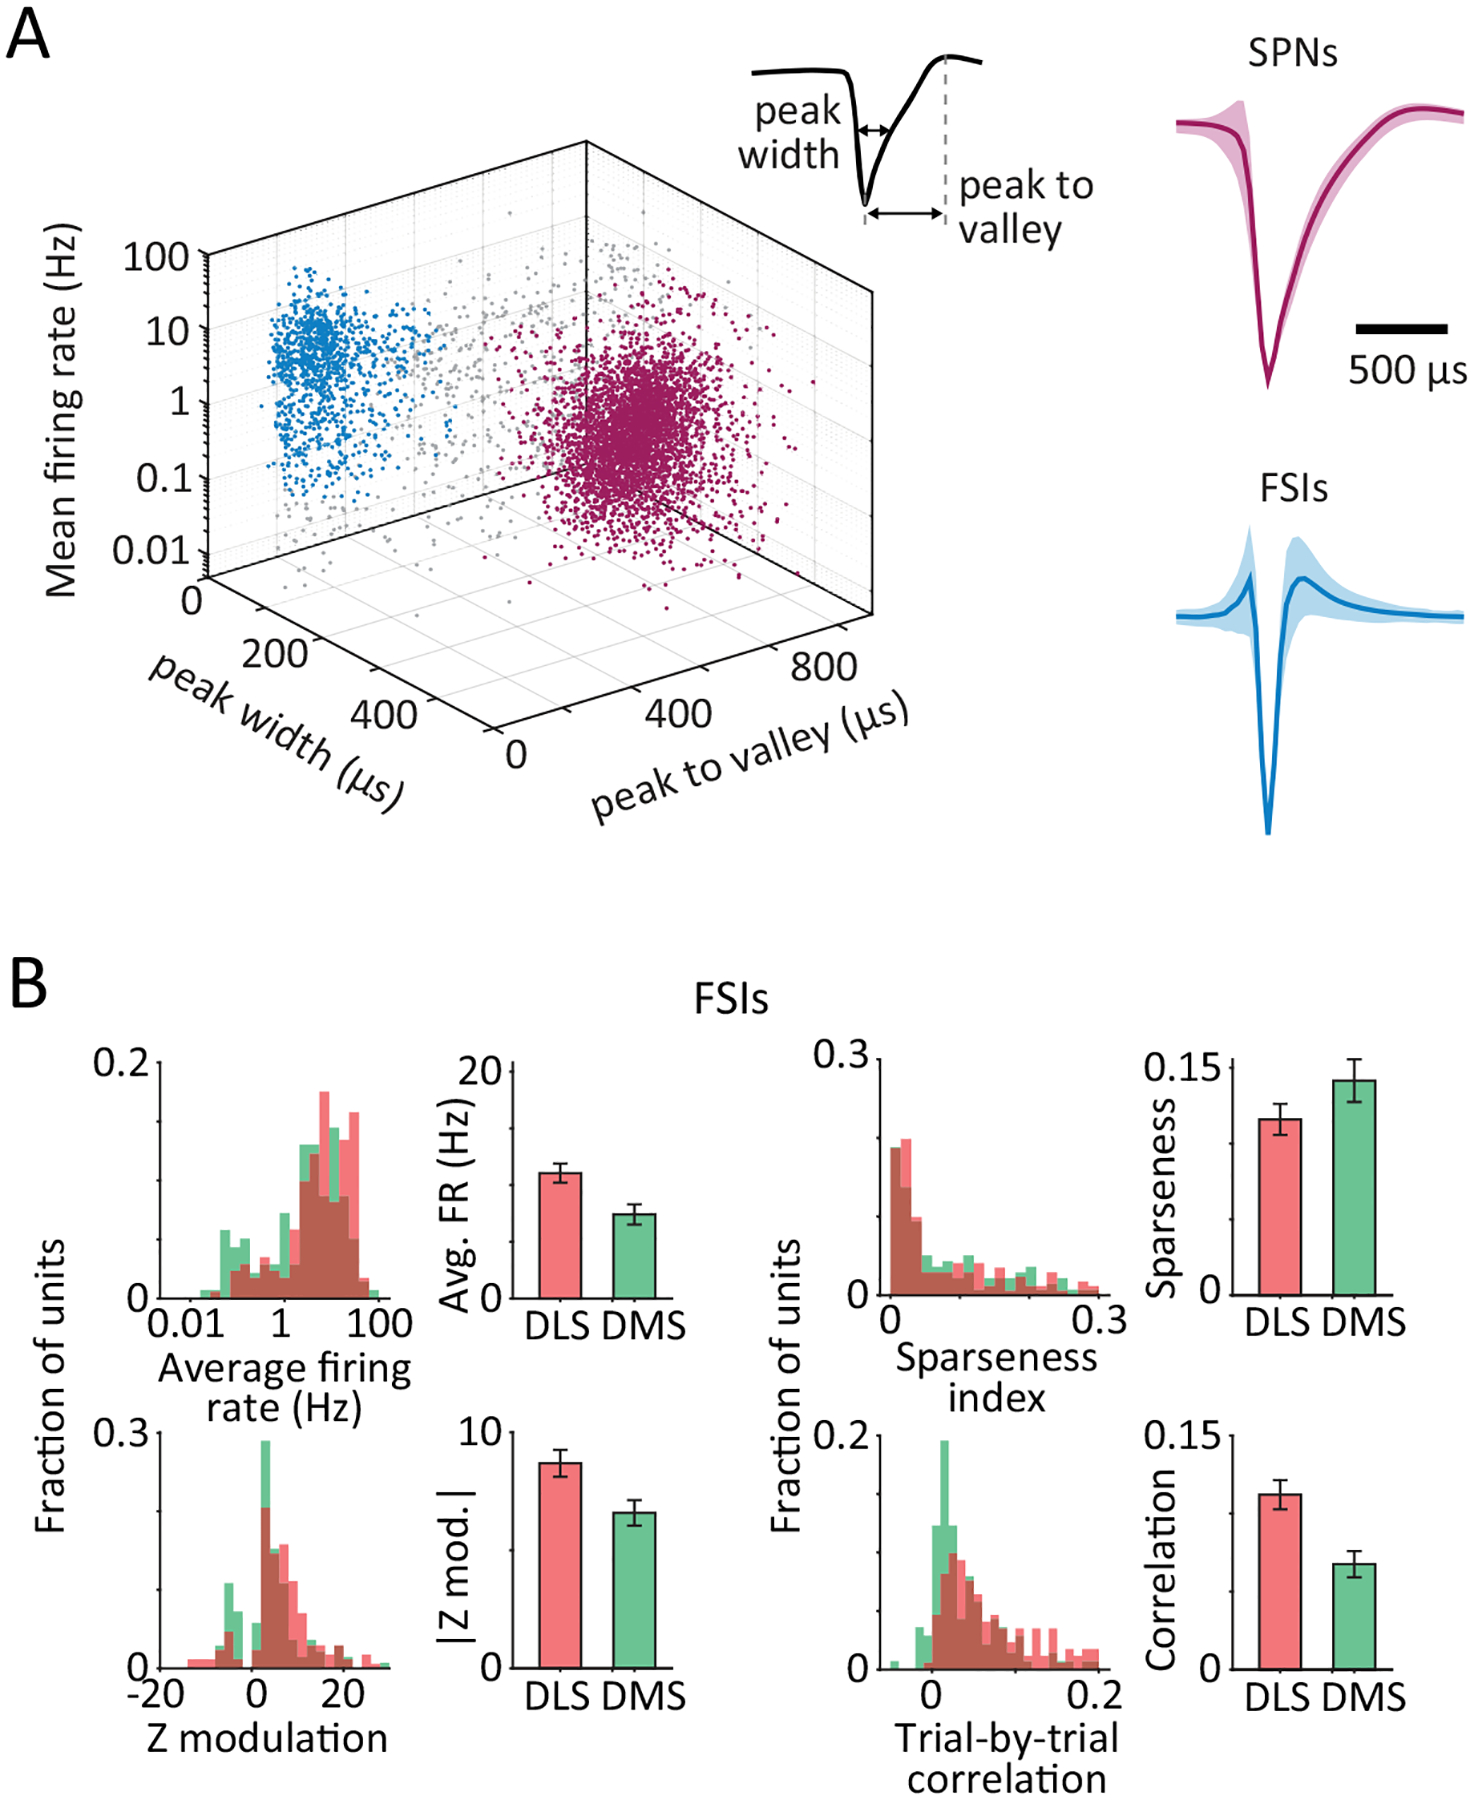
A. Classification of single units recorded in striatum into putative spiny projection neurons (SPNs, maroon) and fast spiking interneurons (FSIs, blue). (Left) Spike waveform features such as peak-width and peak-to-valley interval, as well as average firing rates were used in combination to classify units as SPNs or FSIs. Grey dots indicate unclassified units (8.5%) that were excluded from further analysis. (Right) Population averaged spike waveforms for putative SPNs (top) and FSIs (bottom). Data presented as mean ± SD across units. All waveforms were rescaled to unit amplitude prior to averaging.
B. Average firing rate during the trial-period (p=3e-3), maximum modulation of Z-scored firing rate during the trial-period (p=0.01), sparseness index (p=0.13) and average trial-to-trial correlation of task-aligned spiking (p=1e-3) in putative FSIs recorded in the DLS (red, n=171) and DMS (green, n=138). Bars and error-bars represent mean and SEM, respectively, across units. P-values measure the two-sided probability that two datasets have the same mean and are computed by bootstrapping difference in means (n=1e4 bootstraps).
Extended Data Fig. 3. Population-averaged activity in the DLS at the beginning and end of the skilled behavior.
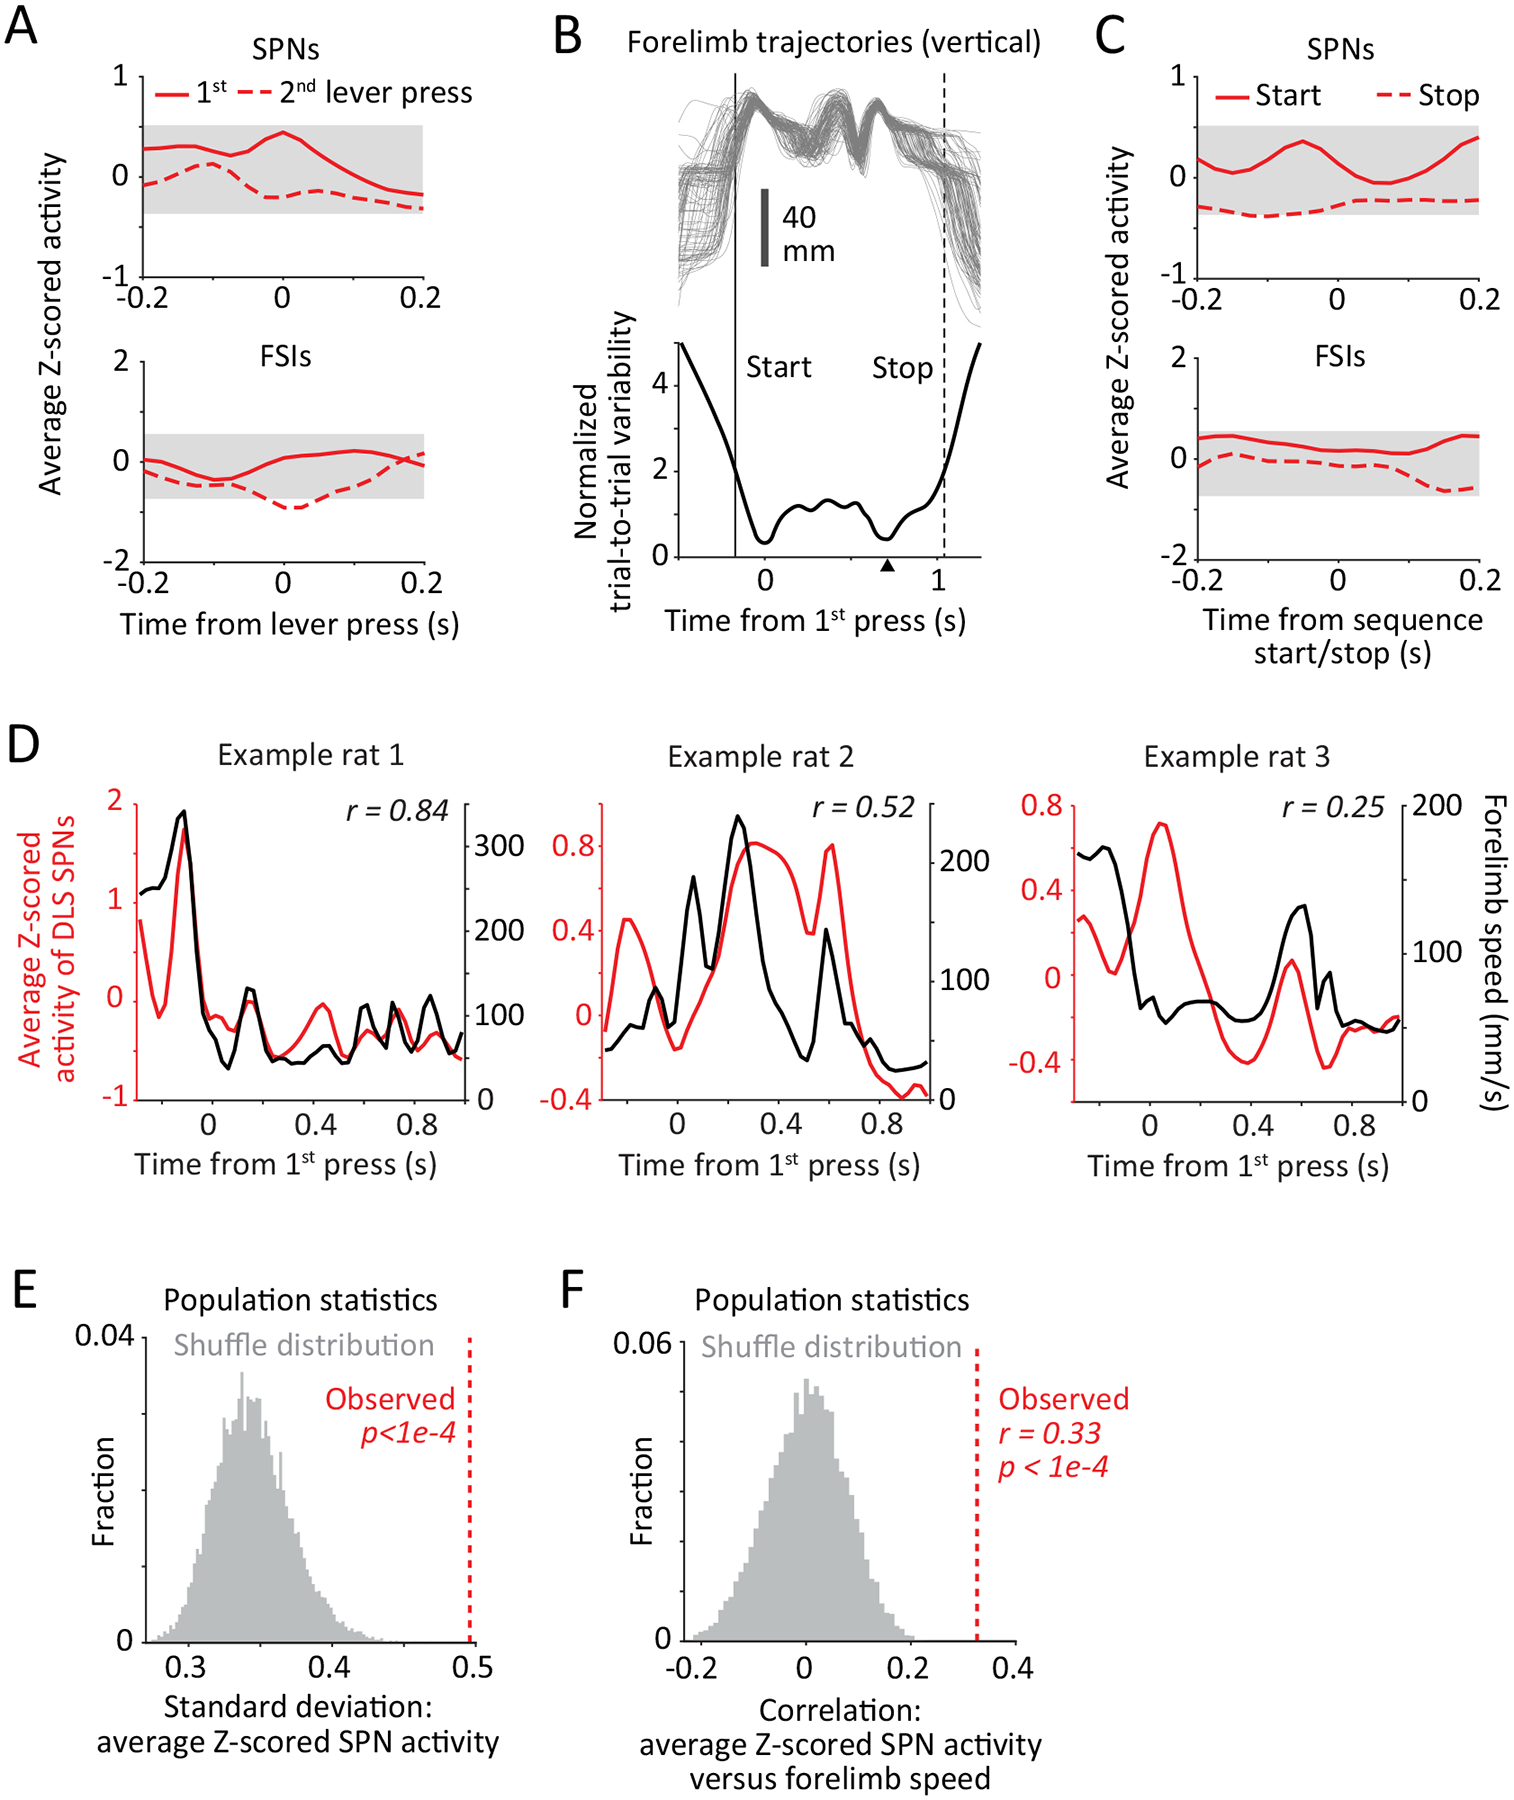
A. Average Z-scored activity of putative SPN (top) or FSI (bottom) populations recorded in the DLS around the time of the 1st (solid line) and 2nd (dashed lined) lever-presses (n=3 rats). Grey shading represents 95% confidence interval, corrected for multiple comparisons, of the distribution of Z-scored activity expected by chance if lever-presses occurred at random times (n=1e4 randomizations).
B. Trial-to-trial variability of an example rat’s task-aligned movement trajectories. (Top) Trajectories of the rat’s forelimb (vertical component) in an example session corresponding to a specific sequence mode (see Extended Data Fig. 4). Each line denotes a trial. (Bottom) Normalized trial-by-trial variability (see Methods) of movement trajectories of the rat’s forelimbs and head. Times at which this measure exceeds a value of 2 (dashed lines) are designated the start or stop time of the motor sequence. On average, starts occurred 0.42 ± 0.46 s prior to the first lever-press and stops occurred at 0.35 ± 0.02 s after the second lever-press (mean ± SD, n=3 rats).
C. Average Z-scored activity for populations of SPNs (top) or FSIs (bottom) recorded in the DLS around the start (solid line) and stop (dashed lined) of the skilled behavior (n=3 rats). Grey shading represents 95% confidence interval, corrected for multiple comparisons, of the distribution of Z-scored activity expected by chance if start/stop occurred at random times (n=1e4 randomizations).
D. Average Z-scored activity for populations of SPNs recorded in the DLS of three example rats during execution of a representative sequence mode (red lines). Superimposed are trial-averaged forelimb speed profiles (black, averaged over both contra- and ipsi-lateral forelimbs), from the same individuals.
E. Non-uniformity of the average Z-scored activity profiles of DLS SPNs, measured by their standard deviation, was averaged across sequence modes and then across rats (red line, n=3 rats). Grey histogram shows distribution expected by chance if SPNs showed independent activity (generated by randomly jittering the Z-scored PETHs of individual units prior to averaging, n=1e4 randomizations), and p-value quantifies the two-sided probability that this explains the data.
H. Correlation coefficient between average speed profiles and average activity of DLS SPN populations (both shown in panel D), averaged across sequences modes and then across rats (red line, n=3 rats). Grey histogram shows the statistic distribution under the null hypothesis (no relationship between the variables) computed by randomization (n=1e4 permutations), and p-value quantifies the two-sided probability that this explains the data.
Extended Data Fig. 4. Identification of sequence modes and population-averaged activity in the DLS at choice points between modes.
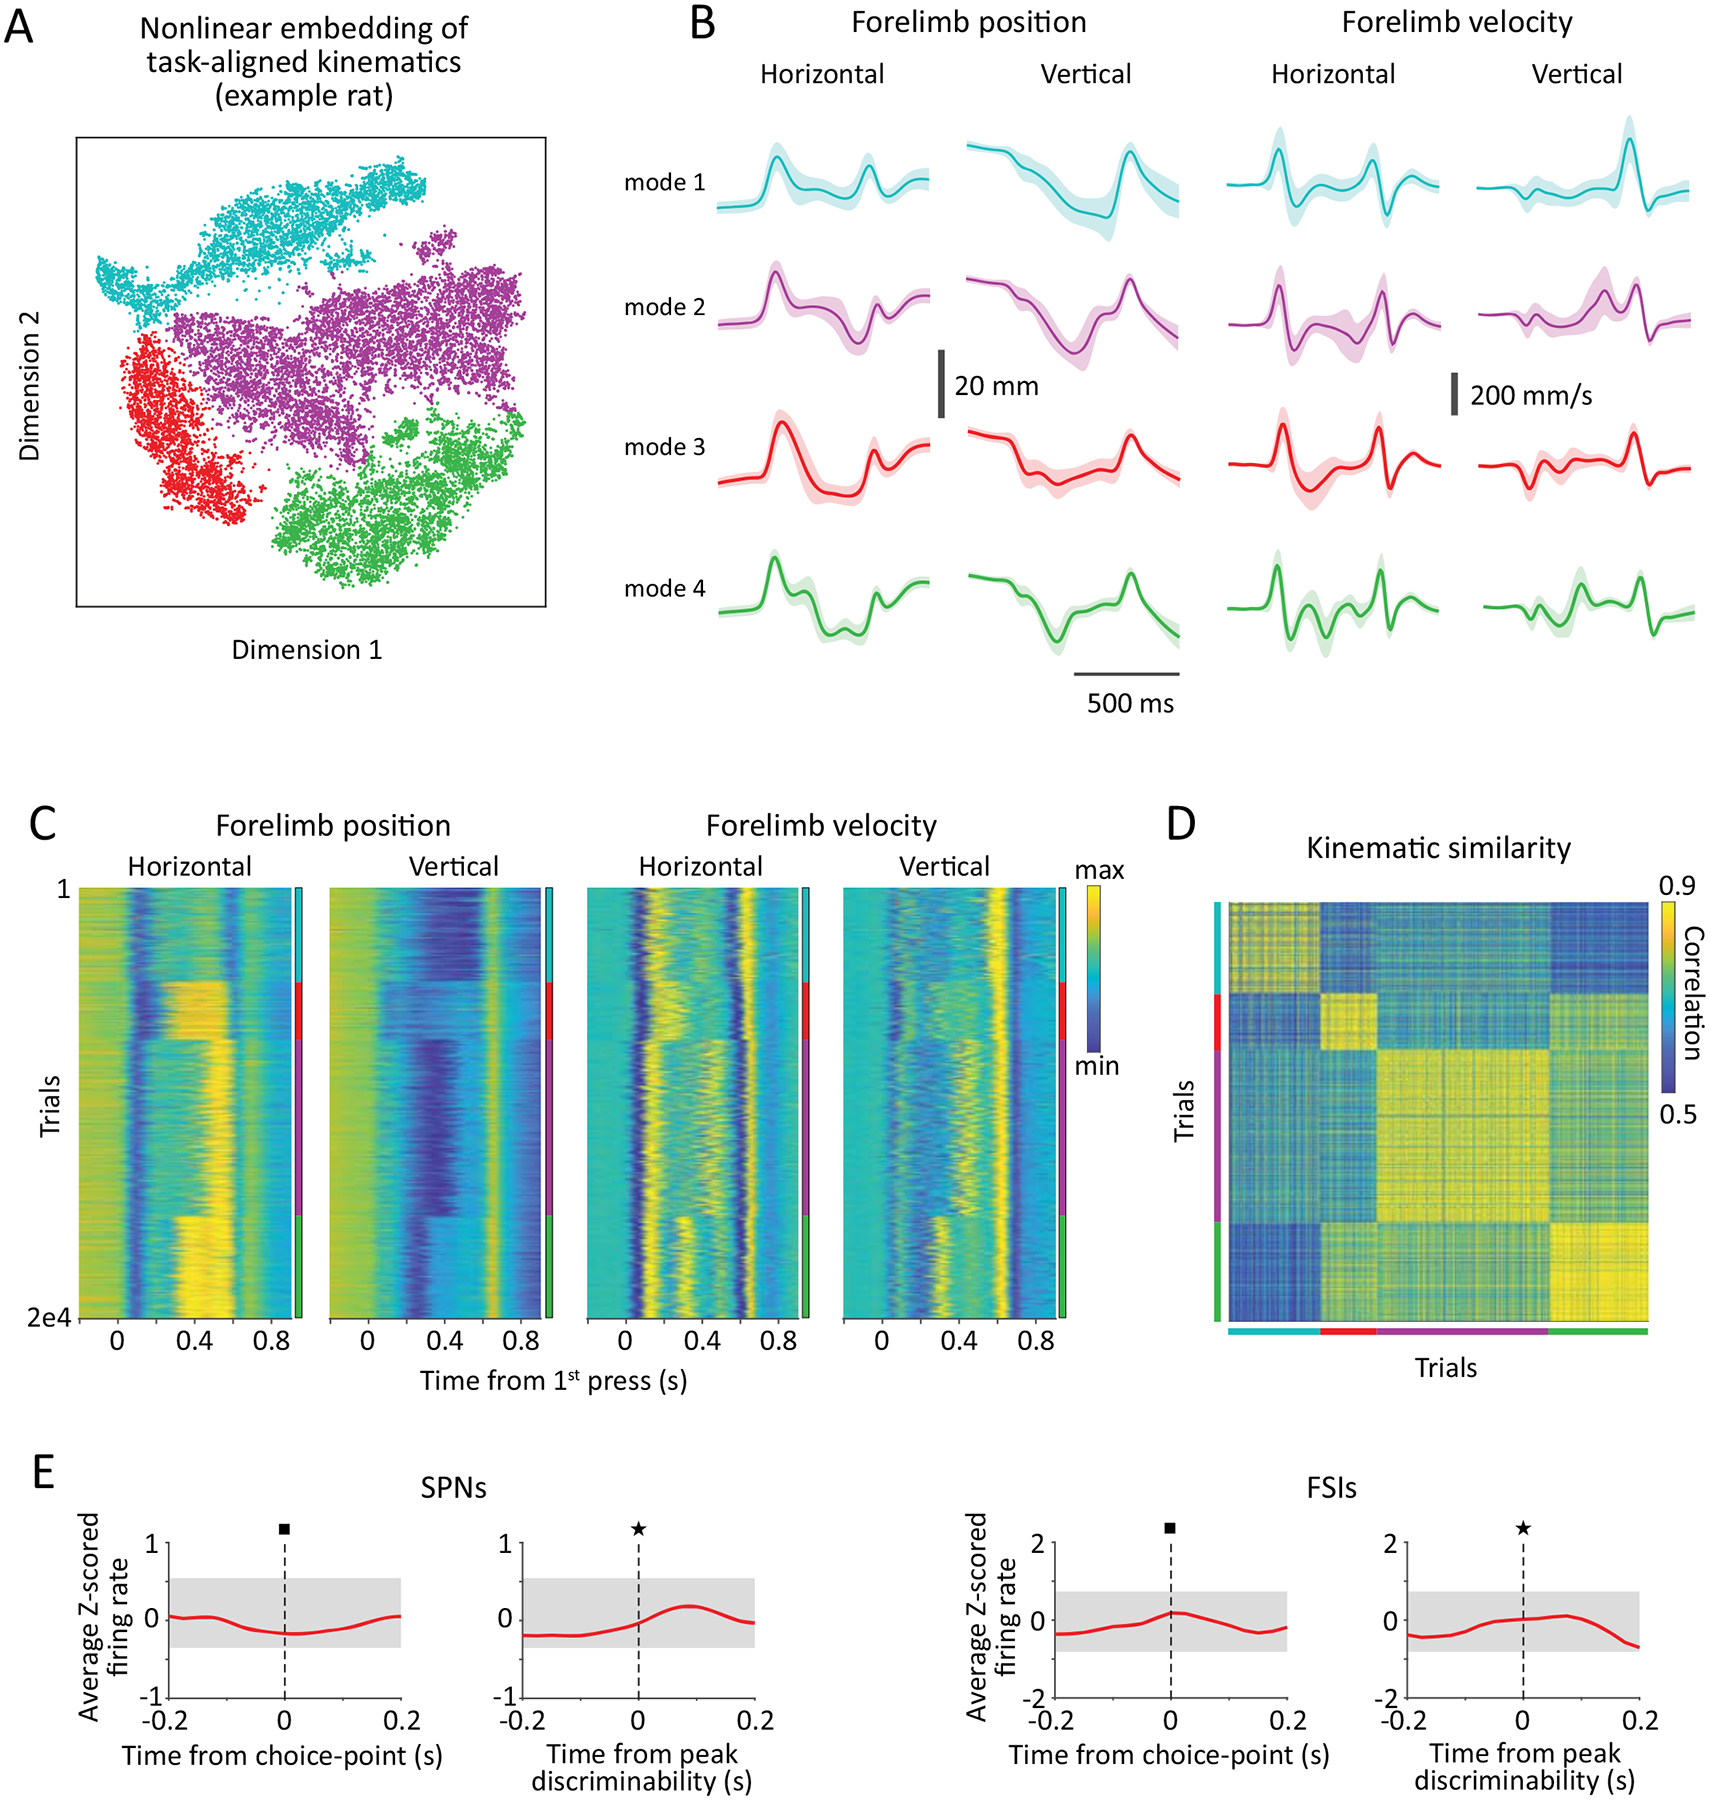
A. Two-dimensional t-distributed stochastic neighborhood embedding (tSNE) of task-aligned kinematic trajectories for a subset of trials from an example rat. Each point represents a trial and colors represent distinct modes identified by a semi-automated unsupervised clustering algorithm (see Methods). On average we identified 5 ± 2 modes (mean ± SD) per rat (n=9 rats).
B. Task-aligned horizontal and vertical components of the position and velocity of a single forelimb averaged across trials within each sequence mode shown in panel A. Shading represents standard deviation across trials.
C. Task-aligned kinematic variables including forelimb position (left) and velocity (right) for a random subset of 20,000 trials performed by the example rat, sorted by sequence mode (indicated by colors, as in panels A-B). Kinematics have been time-warped to account for trial-by-trial variability in the interval between the 1st and 2nd lever-presses.
D. Pairwise correlations between the kinematics of the trials shown in C, sorted by sequence mode.
E. Average Z-scored activity for populations of SPNs (top) or FSIs (bottom) recorded in the DLS around the time of choice-points (left) or at peak discriminability between the trajectories corresponding to pairs of modes (right). Z-scored activity is averaged across units and modes in a mode pair, then across all mode-pairs in each rat and then across rats (n=3 rats). Grey shading represents 95% confidence interval, corrected for multiple comparisons, of the distribution of Z-scored activity expected by chance if these events occurred at random times.
Extended Data Fig. 5. Comparison between encoding of different kinematic features by striatal neurons.
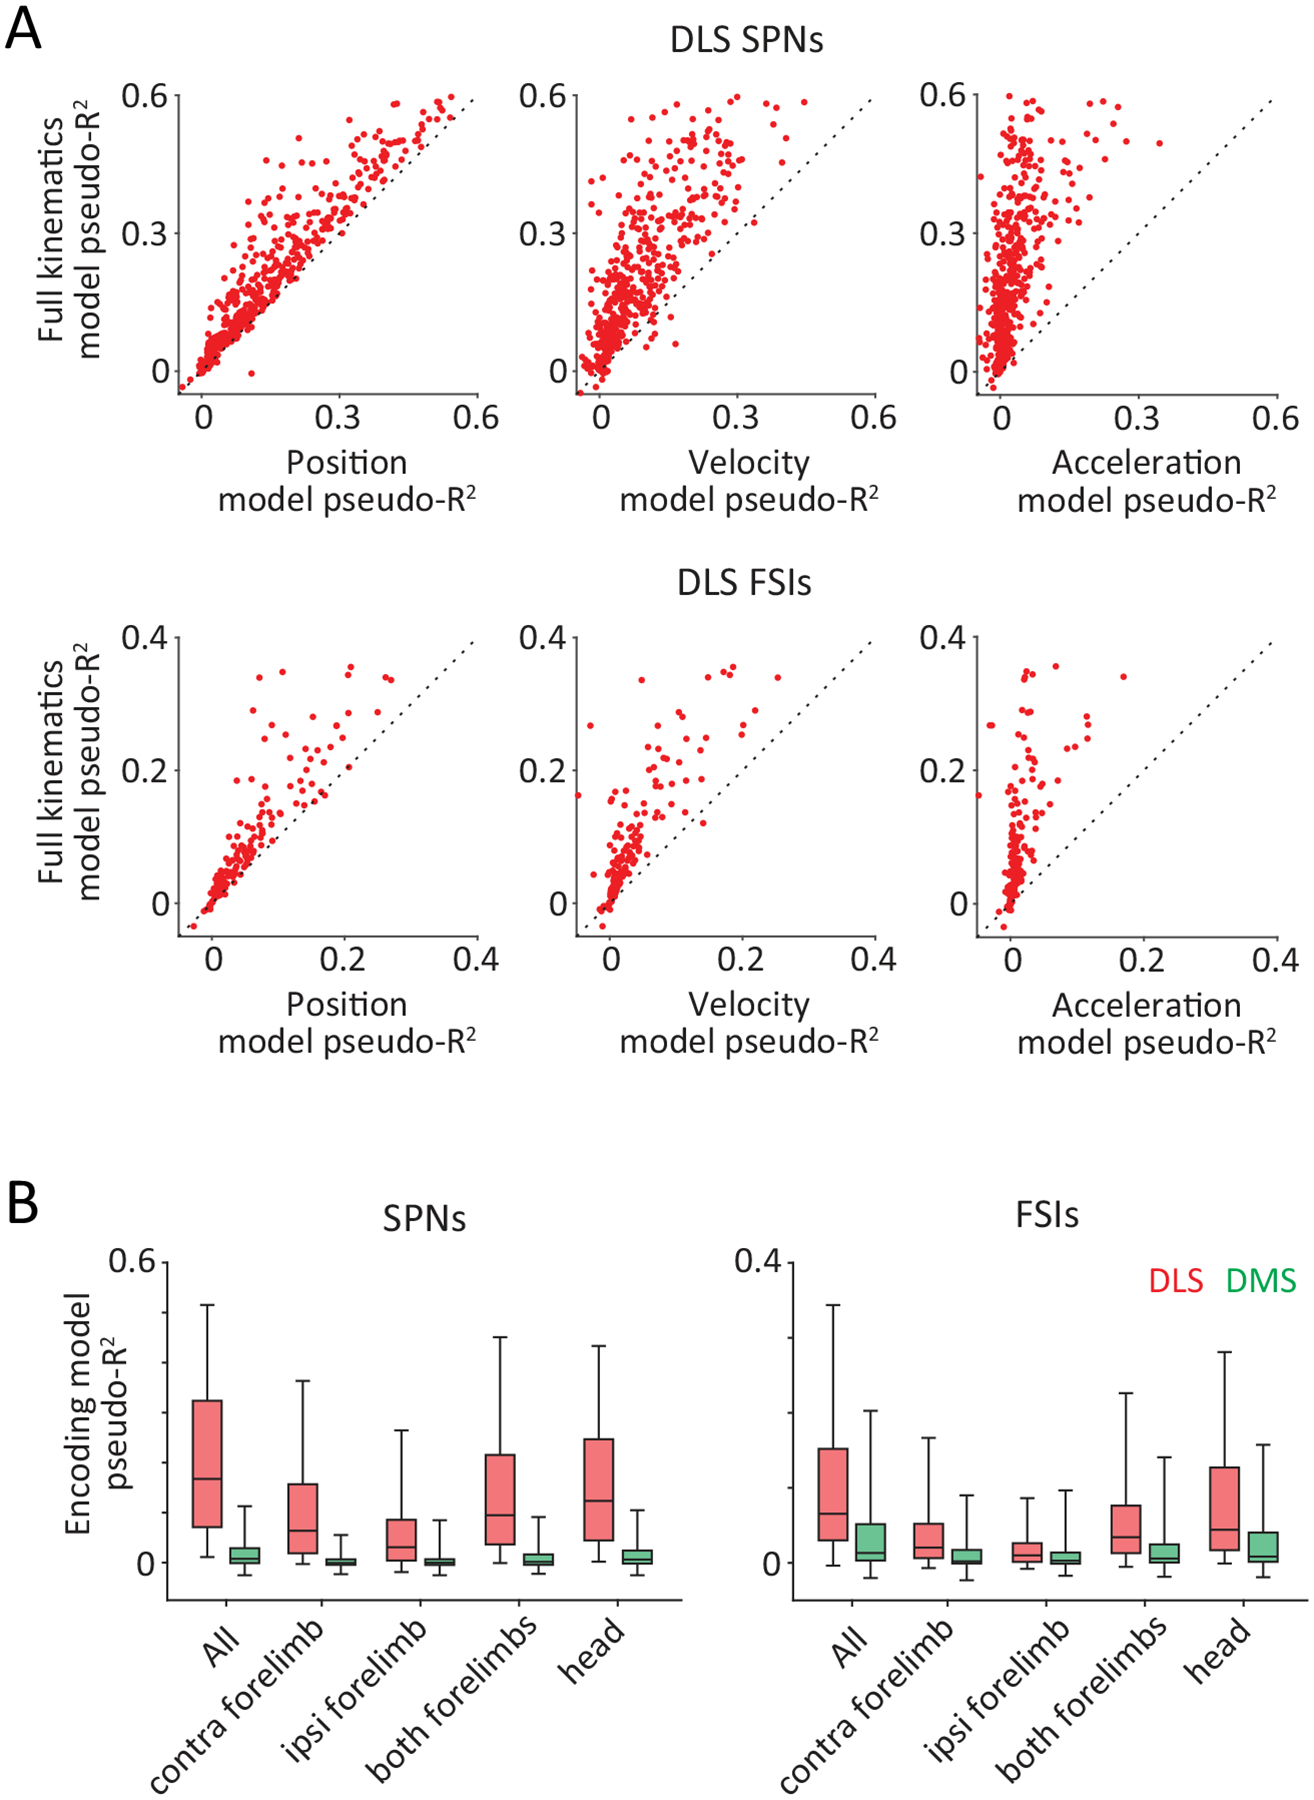
A. Scatter plots comparing the goodness of fit, measured using the pseudo-R2 (see Methods), between encoding models that use a combination of all kinematic variables (position, velocity and acceleration) versus those that use only position (left), velocity (middle) or acceleration (right) variables to predict the activity of DLS SPNs (top) and FSIs (bottom). p<1e-4 for all SPN kinematic comparisons and p=4e-3, <1e-4, <1e-4 for FSI kinematic encoding comparisons to position, velocity and acceleration variables, respectively. P-values are computed by bootstrapping paired difference in means (n=1e4 bootstraps) and quantify the likelihood that two distributions have the same mean.
B. Goodness of fit, measured by pseudo-R2 (see Methods), for encoding models that use detailed kinematics (position, velocity and acceleration) of all tracked effectors and those that only use kinematics of the contralateral forelimb, ipsilateral forelimb, both forelimbs or the head to predict spiking activity of putative SPNs (left) and FSIs (right) in the DLS (red, n=492 SPNs and 164 FSIs from 3 rats) and DMS (green, n=213 SPNs and 123 FSIs from 3 rats). Boxes denote 1st, 2nd (median) and 3rd quartiles, while whiskers show the 5th and 95th percentile of the distribution. p<1e-4 for all encoding comparisons between SPNs in DLS and DMS, and p=1e-4, 6e-3, 0.49, 4e-3, 1e-4 for comparisons between FSI encoding in the DLS and DMS of all effectors, contra-, ipsi-, both forelimbs and head, respectively. P-values measure the probability that the two datasets have the same mean and are estimated by bootstrapping difference in means (n=1e4 bootstraps).
Extended Data Fig. 6. Characterization of task performance and DLS representations after motor cortex lesion.
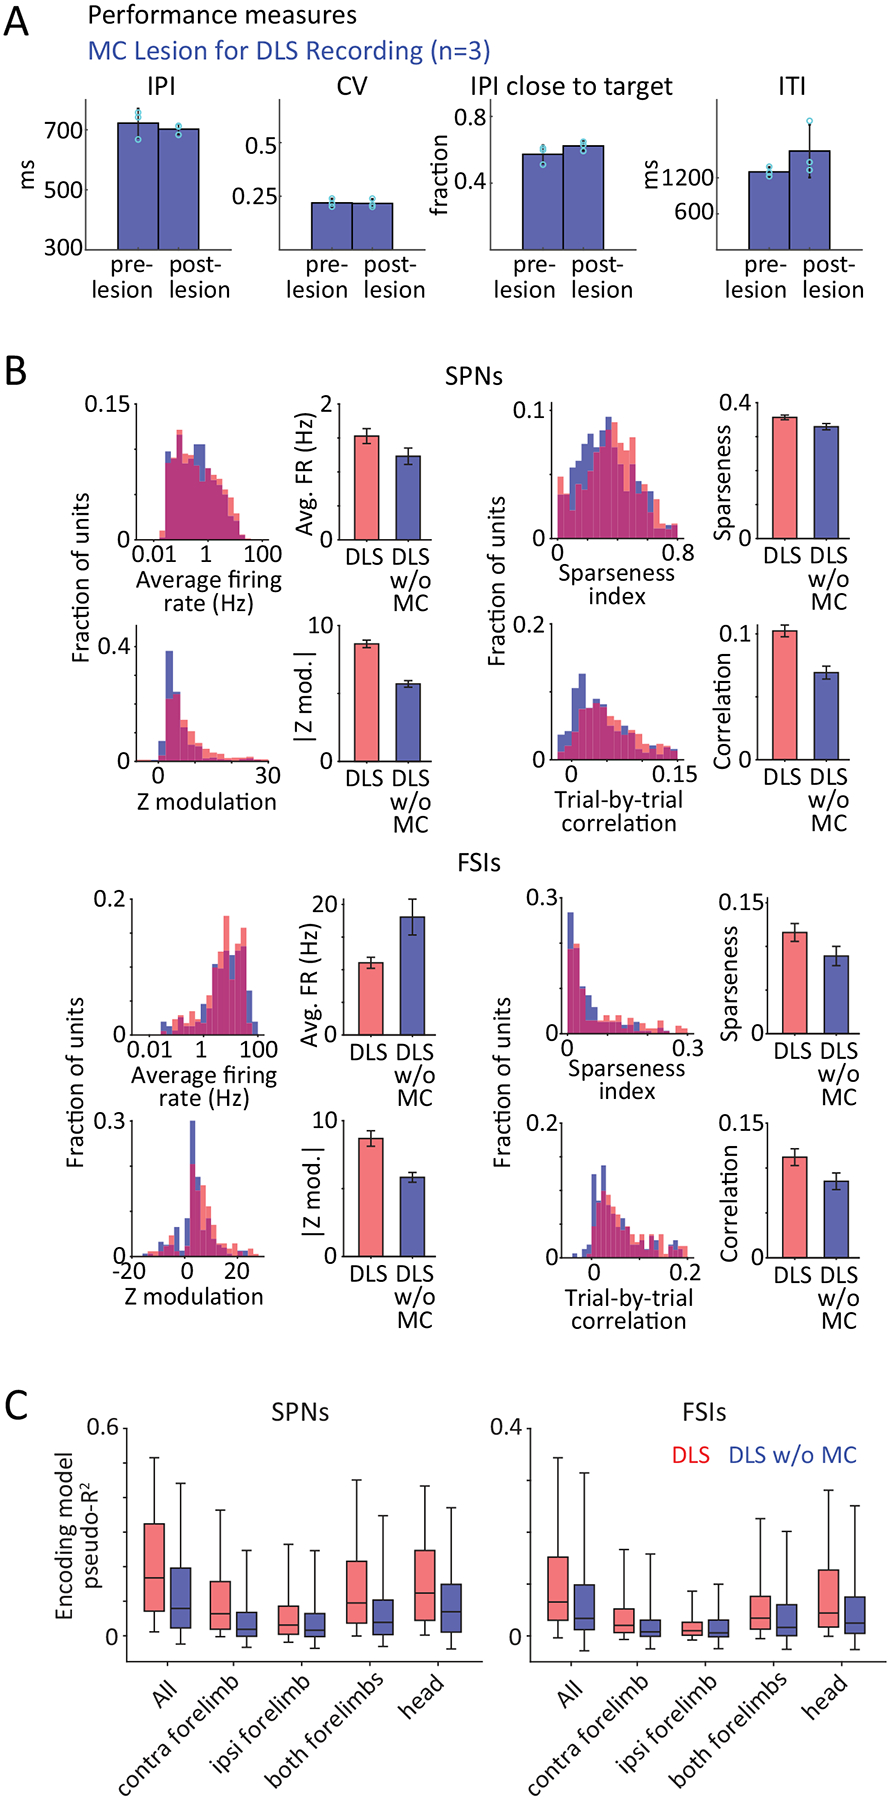
A. Comparison of performance measures before and after motor cortex (MC) lesion (n=3). IPI: Inter-Press Interval, CV of IPI: Coefficient of Variation of the IPI, IPI close to target: Fraction of trials close to target IPI (700 ms ± 20%), ITI: Inter-Trial Interval. Pre-Lesion: last 2,000 trials before lesion, post-Lesion: first 2,000 trials after lesion. Dots indicate individual animals and bars show means ± SEM. For statistical details see Supplementary Table 7.
B. (Top) Comparing task-aligned activity statistics, including average firing rate during the trial-period (p=0.09), maximum modulation of Z-scored firing rate during the trial-period (p<1e-4), sparseness index (p=0.02) and average trial-to-trial correlation of task-aligned spiking (p<1e-4), between putative SPNs recorded in the intact (red, n=683, replotted from Fig. 2C) and MC-lesioned (blue, n=379) DLS. (Bottom) Average firing rate during the trial-period (p=0.01), maximum modulation of Z-scored firing rate during the trial-period (p=5e-4), sparseness index (p=0.08) and average trial-to-trial correlation of task-aligned spiking (p=0.05) in putative FSIs recorded in the intact (red, n=171, replotted from Extended Data Fig. 2B) and MC-lesioned (blue, n=153) DLS. Bars and error-bars represent mean and SEM, respectively, across units. P-values measure the probability that two datasets have the same mean and are computed by bootstrapping difference in means (n=1e4 bootstraps).
C. Goodness of fit, measured by pseudo-R2, for encoding models that use kinematics of all tracked effectors and those that only use kinematics of the contralateral forelimb, ipsilateral forelimb, both forelimbs or the head to predict spiking activity of putative SPNs (left) and FSIs (right) in the DLS of intact (red, n=492 SPNs and 164 FSIs from 3 rats, replotted from Extended Data Fig. 5B) and MC-lesioned (blue, n=279 SPNs and 169 FSIs from 3 rats) animals. Boxes denote 1st, 2nd (median) and 3rd quartiles, while whiskers show the 5th and 95th percentile of the distribution. p<1e-4, =4e-3, <1e-4, <1e-4 for comparisons between SPN encoding in the intact and MC-lesioned DLS of all effectors, contra-, ipsi-, both forelimbs and head, respectively. p=0.04, 0.66, 0.04, 0.04 for comparisons between FSI encoding in the intact and MC-lesioned DLS of all effectors, contra-, ipsi-, both forelimbs and head, respectively. P-values measure the probability that the two datasets have the same mean and are estimated by bootstrapping difference in means (n=1e4 bootstraps).
Extended Data Fig. 7. Task performance after DLS, but not DMS, lesions is impaired, resembles performance early in training, and does not recover.
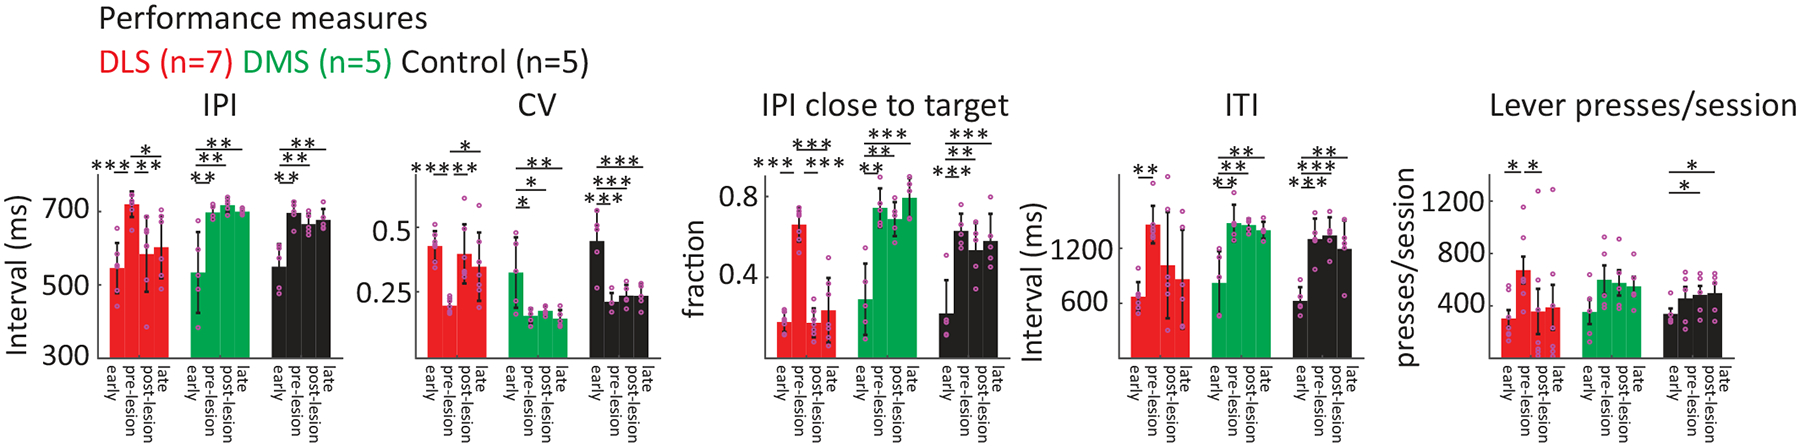
Comparison of performance measures at different stages before and after lesions of DLS (n=7 rats), DMS (n=5), and control injections (n=5). IPI: Inter-Press Interval, CV of IPI: Coefficient of Variation of the IPI, IPI close to target: Fraction of trials close to target IPI (700 ms ± 20%), ITI: Inter-Trial Interval. Early: first 2,000 trials in training, pre-lesion: last 2,000 trials before lesion, post-lesion: first 2,000 trials after lesion, late: trials 10,000 to 12,000 after lesion. Presses/session: Average number of lever-presses per session. Early: first 10 sessions in training, pre-lesion: last 20 sessions before lesion, post-lesion: first 20 sessions after lesion, late: sessions 50 to 70 after lesion. Dots indicate individual animals and bars show mean ± SEM. For statistical details see Supplementary Table 8. *p < 0.05, **p < 0.01, ***p < 0.001.
Extended Data Fig. 8. Lesions of the GPi/EP affect task performance similarly to DLS lesions.
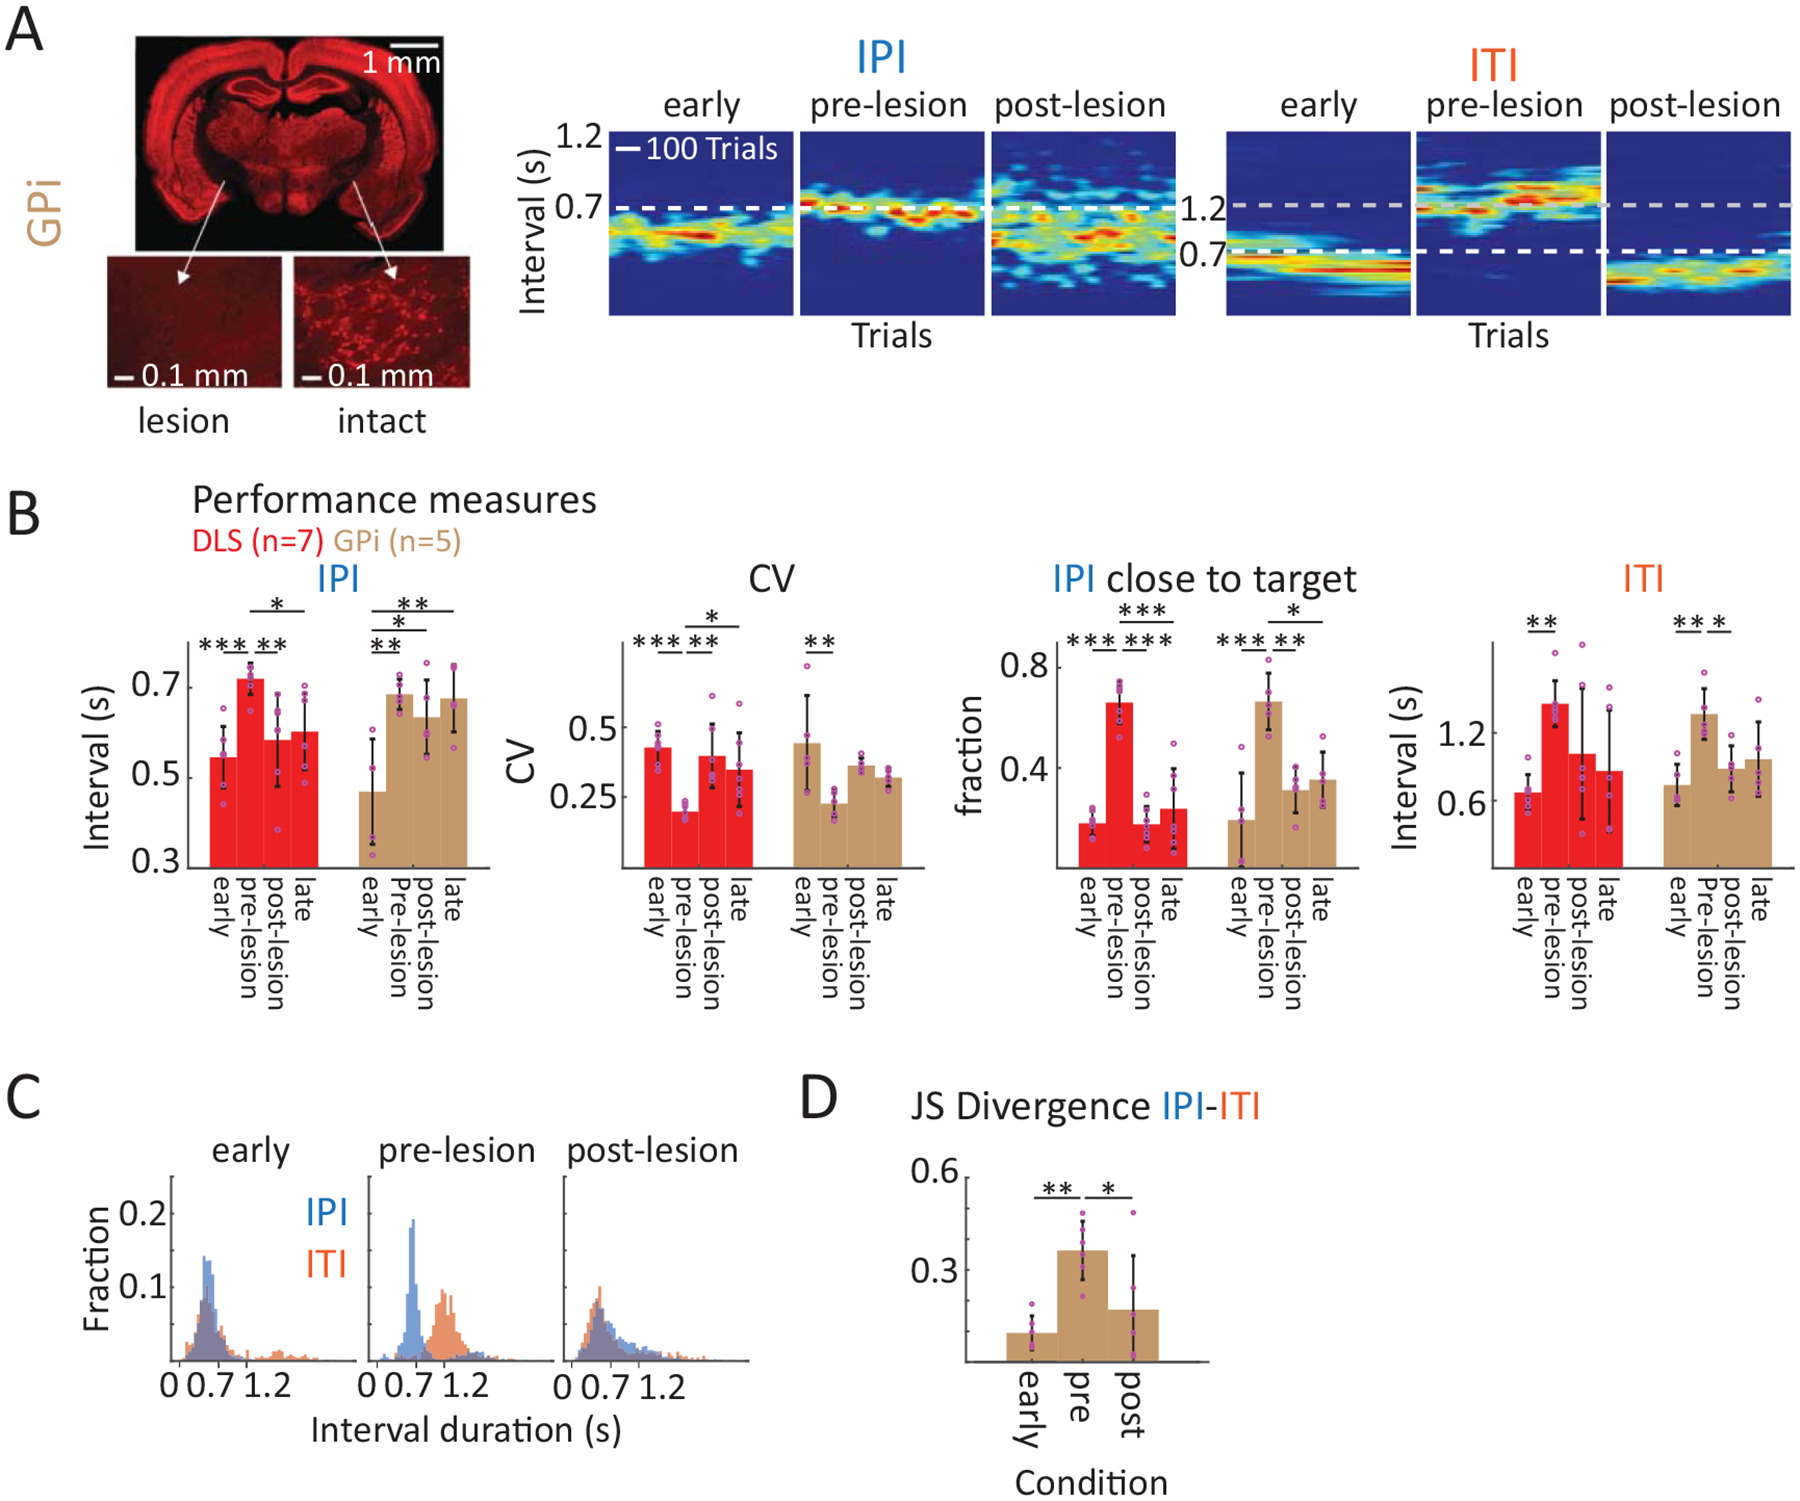
A. Representative example of the effect of a GPi (EP) lesion on task performance. Left: Example histological image of a unilateral GPi lesion, showing the comparison between the lesioned and the intact GPi. Experimental animals underwent bilateral GPi lesions (see Methods). Right: IPIs and ITIs for an example animal early in training, before and after bilateral GPi lesion. Population data shown in panel B.
B. GPi lesions (n=5 rats) have long-lasting effects on various measures of performance (cf. Extended Data Fig. 7). DLS performance as shown in Extended Data Fig. 7, here shown for comparison. Dots indicate individual animals and bars show mean ± SEM.
C. Left: Example distributions of IPI and ITI interval lengths early in training, and before and after GPi lesion.
D. JS Divergence of IPI and ITI distributions for all GPi-lesioned animals (n=5 rats). Dots indicate individual animals and bars show mean ± SEM. For statistical details see Supplementary Table 9. *p < 0.05, **p < 0.01.
Extended Data Fig. 9. DLS lesions do not affect lever-press vigor, but lead to regression to a common lever-pressing behavior.
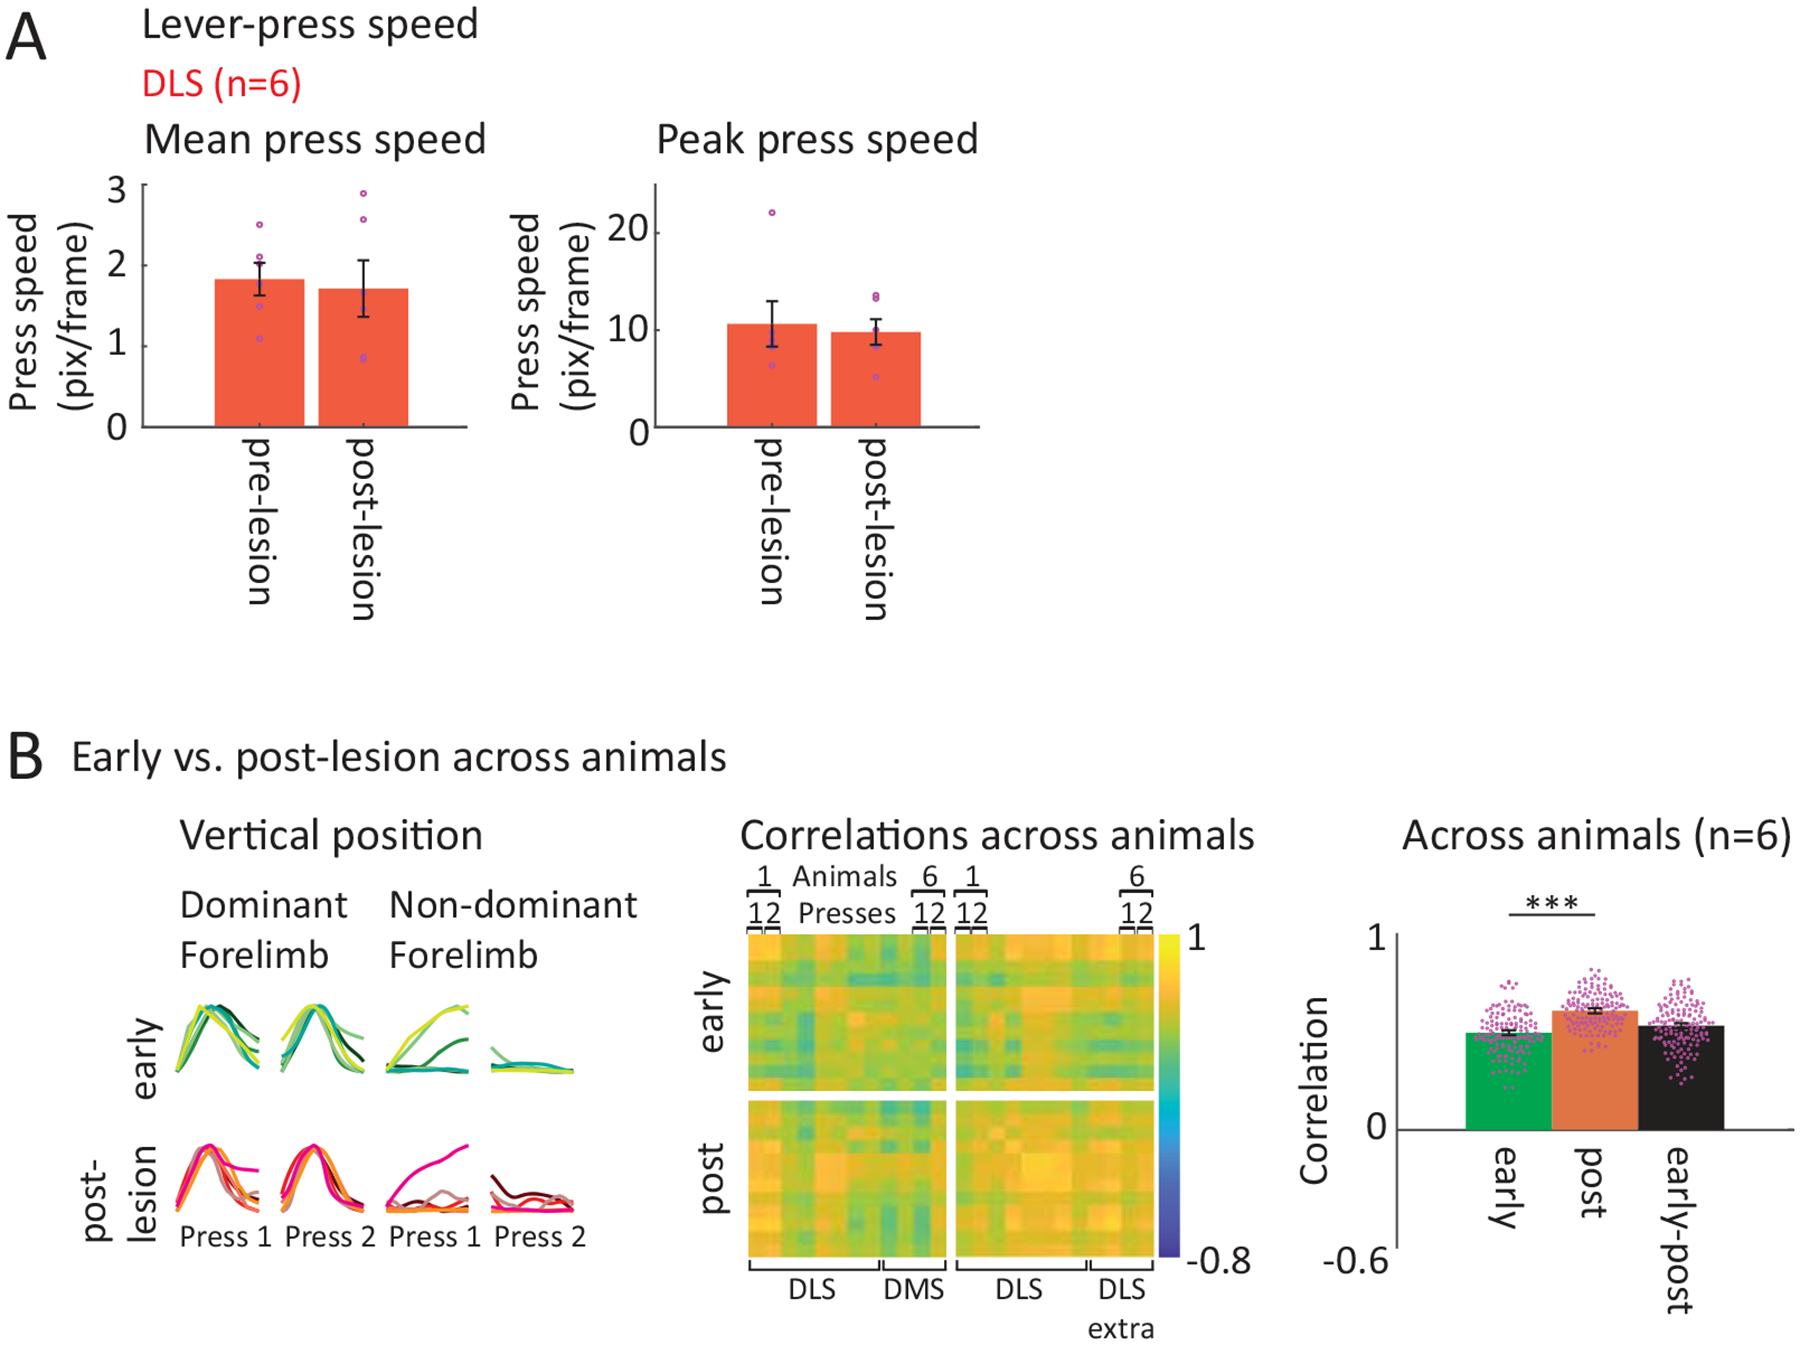
A. Comparison of mean and peak lever-press speeds before and after DLS lesion (see Fig. 8). Speeds were averaged over 1st and 2nd lever-presses. Dots indicate individual animals and bars show mean ± SEM. No significant differences were detected. For statistical details see Methods.
B. The comparison of 1st and 2nd lever-presses across animals early in training and after DLS lesion (see Fig. 8C) was extended to additional animals. The post-lesion lever-presses of the 2 DLS-lesioned animals which were not included in Fig. 8C (due to lack of trajectories for the early presses) were added. In addition, the trajectories of the early lever-presses of 2 of the DMS-lesioned animals (shown in Fig. 7) were added. The remaining animals were re-plotted from Fig. 8C. (Column 1) Forelimb movement trajectories for the 1st and 2nd presses early in training (green) and after DLS lesion (red), overlaid for all tracked animals (early in training: DLS-lesioned animals n=4, DMS-lesioned animals n=2; post-lesion: DLS-lesioned animals n=6). (Column 2) Pairwise correlations between press trajectories of all animals early in training and after DLS lesion. Shown are average trial-to-trial correlations across individual presses (animal 1 press 1, animal 1 press 2, etc.). (Column 3) Averages of across animal correlations per condition. Shown are correlations between all presses early, all presses after DLS lesion and between all presses early and all presses after lesion (early-post). Mean ± SEM. For statistical details see Supplementary Table 10. ***p < 0.001.
Extended Data Fig. 10. Small lesions of the DLS affect performance and movement kinematics but do not, in contrast to large DLS lesions, cause animals to revert to species-typical lever-pressing behaviors.
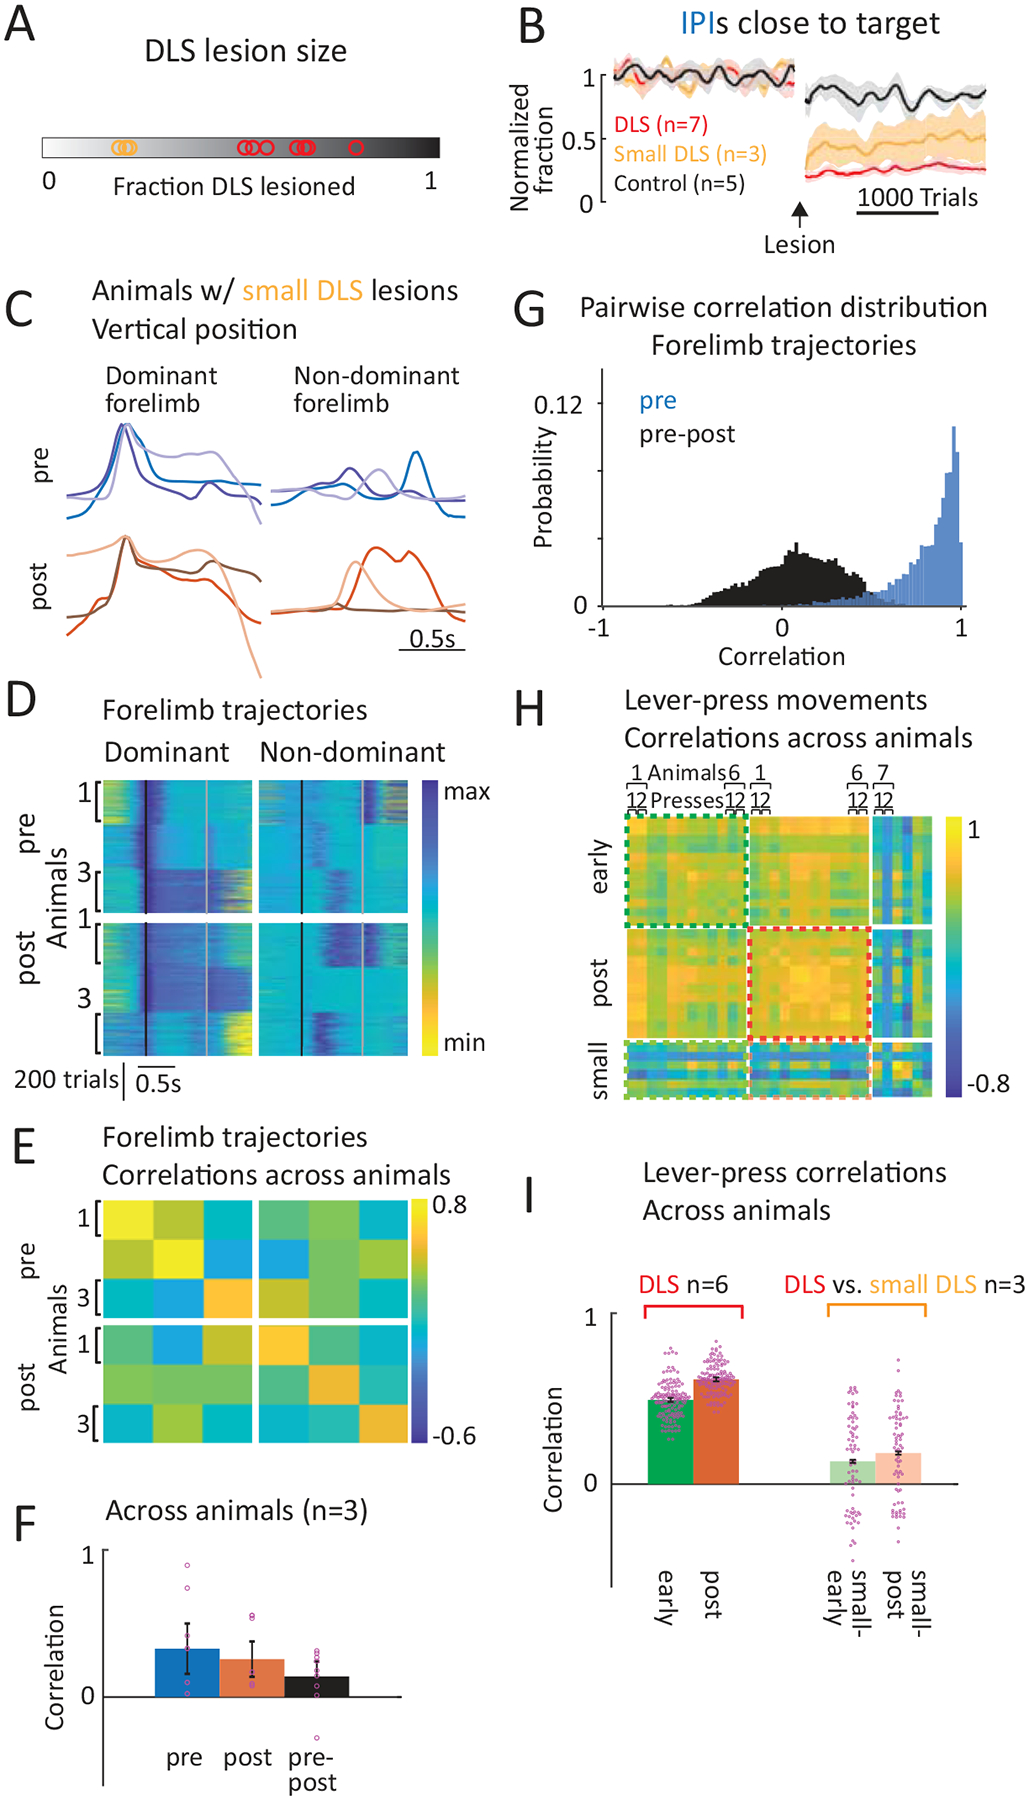
A. Fraction of DLS lesioned. Red: Animals with large DLS lesions, included in Figs. 6–8. Yellow: Animals with small DLS lesions (excluded from prior analysis).
B. Average performance across animals (large DLS lesions n=7 rats; small DLS lesions n=3, Control n=5), normalized to pre-manipulation performance. Fraction of trials with IPIs close to target (700 ms ± 20%). Shading represents SEM. Partially replotted from Fig. 6B.
C. Comparison of average forelimb trajectories (vertical position) before and after small DLS lesions for all animals (from trials within a range of mean IPI ± 30 ms). The forelimb performing the 1st lever-press is regarded dominant (n=3 rats).
D. Forelimb vertical displacement in randomly selected trials (200 per animal) of all animals before and after small DLS lesions. Trials are sorted by IPI and normalized to minimum and maximum displacement for each animal. Black lines mark the 1st, grey lines the 2nd lever-press.
E. Pairwise correlations between trials shown in D, averaged per animal.
F. Averages of correlations shown in E by condition (averages of all pre-to-pre, post-to-post and pre-to-post correlations). Mean ± SEM.
G. Distributions of correlation coefficients between individual forelimb trajectories before (blue) and after (black) small DLS lesion, and the animal’s pre-lesion modes (see Methods). Probability distributions were computed for each rat and then averaged (n=3). Fraction of trials with correlations >0.85 (Mean ± SEM): pre 0.53 ± 0.24, pre-post 0 ± 0.
H. Comparison of forelimb trajectories associated with 1st and 2nd lever-presses across animals with large and small DLS lesions. Pairwise correlations between press trajectories of animals early in training, of animals after large (replotted from Extended Data Fig. 9B) and of animals after small DLS lesions. Shown are average trial-to-trial correlations across individual presses (animal 1 press 1, animal 1 press 2, etc.) (n=6 rats early, n=6 large DLS lesions (partially overlapping, see Extended Data Fig. 9B), n=3 small DLS lesions).
I. Averages of across animal correlations for selected conditions. Left: correlations between all presses early (dark green dotted square in H) and all presses after large DLS lesions (dark red dotted square in H) as in Extended Data Fig. 9B. Right: correlations between all presses early and all presses after small DLS lesions (small-early; light green dotted square in H) and between all presses after large DLS lesions and all presses after small DLS lesions (small-post; light red dotted square in H). All comparisons show statistically significant differences with p<0.001, except the comparison small-early to small-post. Mean ± SEM. For statistical details see Supplementary Table 11.
Supplementary Material
Acknowledgements
We thank Sean Escola, James Murray and members of the Ölveczky lab for advice on data analysis and for discussions and comments on the manuscript. We thank Steve Turney and the Harvard Center for Biological Imaging for infrastructure and support. We thank Alexander and Mackenzie Mathis for help with setting up markerless tracking. This work was supported by NIH grants R01-NS099323-01 and R01-NS105349 to B.P.Ö., by a Life Sciences Research Foundation and Charles A. King Foundation postdoctoral fellowship to A.K.D. and by EMBO and HFSP postdoctoral fellowships to S.B.E.W. The funders had no role in study design, data collection and analysis, decision to publish or preparation of the manuscript.
Footnotes
Competing Interests
The authors declare no competing interests.
Code availability
All MATLAB analysis scripts will be made available upon reasonable request.
Data availability
The generated datasets are available from the corresponding author upon reasonable request.
References
- 1.Krakauer JW, Hadjiosif AM, Xu J, Wong AL & Haith AM Motor Learning. Compr. Physiol 9, 613–663 (2019). [DOI] [PubMed] [Google Scholar]
- 2.Stephenson-Jones M, Samuelsson E, Ericsson J, Robertson B & Grillner S Evolutionary conservation of the basal ganglia as a common vertebrate mechanism for action selection. Curr. Biol. CB 21, 1081–1091 (2011). [DOI] [PubMed] [Google Scholar]
- 3.Dudman JT & Krakauer JW The basal ganglia: from motor commands to the control of vigor. Curr. Opin. Neurobiol 37, 158–166 (2016). [DOI] [PubMed] [Google Scholar]
- 4.Graybiel AM & Grafton ST The Striatum: Where Skills and Habits Meet. Cold Spring Harb. Perspect. Biol 7, a021691 (2015). [DOI] [PMC free article] [PubMed] [Google Scholar]
- 5.Barnes TD, Kubota Y, Hu D, Jin DZ & Graybiel AM Activity of striatal neurons reflects dynamic encoding and recoding of procedural memories. Nature 437, 1158–1161 (2005). [DOI] [PubMed] [Google Scholar]
- 6.Desmurget M & Turner RS Motor Sequences and the Basal Ganglia: Kinematics, Not Habits. J. Neurosci 30, 7685–7690 (2010). [DOI] [PMC free article] [PubMed] [Google Scholar]
- 7.Jin X & Costa RM Start/stop signals emerge in nigrostriatal circuits during sequence learning. Nature 466, 457–462 (2010). [DOI] [PMC free article] [PubMed] [Google Scholar]
- 8.Lauwereyns J, Watanabe K, Coe B & Hikosaka O A neural correlate of response bias in monkey caudate nucleus. Nature 418, 413–417 (2002). [DOI] [PubMed] [Google Scholar]
- 9.Panigrahi B et al. Dopamine Is Required for the Neural Representation and Control of Movement Vigor. Cell 162, 1418–1430 (2015). [DOI] [PubMed] [Google Scholar]
- 10.Rueda-Orozco PE & Robbe D The striatum multiplexes contextual and kinematic information to constrain motor habits execution. Nat. Neurosci 18, 453–460 (2015). [DOI] [PMC free article] [PubMed] [Google Scholar]
- 11.Samejima K, Ueda Y, Doya K & Kimura M Representation of Action-Specific Reward Values in the Striatum. Science 310, 1337–1340 (2005). [DOI] [PubMed] [Google Scholar]
- 12.Ericsson KA, Krampe RT & Tesch-Römer C The role of deliberate practice in the acquisition of expert performance. Psychol. Rev 100, 363–406 (1993). [Google Scholar]
- 13.Kawai R et al. Motor cortex is required for learning but not for executing a motor skill. Neuron 86, 800–812 (2015). [DOI] [PMC free article] [PubMed] [Google Scholar]
- 14.Sutton RS & Barto AG Reinforcement Learning: An Introduction. (Bradford Books, 2018). [Google Scholar]
- 15.Daw N, Niv Y & Dayan P Actions, Policies, Values, and the Basal Ganglia. Recent Breakthr. Basal Ganglia Res (2006). [Google Scholar]
- 16.Fee MS & Goldberg JH A hypothesis for basal ganglia-dependent reinforcement learning in the songbird. Neuroscience 198, 152–170 (2011). [DOI] [PMC free article] [PubMed] [Google Scholar]
- 17.Frank MJ Computational models of motivated action selection in corticostriatal circuits. Curr. Opin. Neurobiol 21, 381–386 (2011). [DOI] [PubMed] [Google Scholar]
- 18.Joel D, Niv Y & Ruppin E Actor–critic models of the basal ganglia: new anatomical and computational perspectives. Neural Netw. 15, 535–547 (2002). [DOI] [PubMed] [Google Scholar]
- 19.Hikosaka O GABAergic output of the basal ganglia. in Progress in Brain Research (eds. Tepper JM, Abercrombie ED & Bolam JP) vol. 160 209–226 (Elsevier, 2007). [DOI] [PubMed] [Google Scholar]
- 20.McHaffie JG, Stanford TR, Stein BE, Coizet V & Redgrave P Subcortical loops through the basal ganglia. Trends Neurosci. 28, 401–407 (2005). [DOI] [PubMed] [Google Scholar]
- 21.Balleine BW, Delgado MR & Hikosaka O The Role of the Dorsal Striatum in Reward and Decision-Making. J. Neurosci 27, 8161–8165 (2007). [DOI] [PMC free article] [PubMed] [Google Scholar]
- 22.Yin HH & Knowlton BJ The role of the basal ganglia in habit formation. Nat. Rev. Neurosci 7, 464–476 (2006). [DOI] [PubMed] [Google Scholar]
- 23.Hikosaka O & Wurtz RH Modification of saccadic eye movements by GABA-related substances. II. Effects of muscimol in monkey substantia nigra pars reticulata. J. Neurophysiol 53, 292–308 (1985). [DOI] [PubMed] [Google Scholar]
- 24.Jurado-Parras M-T et al. The Dorsal Striatum Energizes Motor Routines. Curr. Biol 0, (2020). [DOI] [PubMed] [Google Scholar]
- 25.Vandaele Y et al. Distinct recruitment of dorsomedial and dorsolateral striatum erodes with extended training. eLife 8, e49536 (2019). [DOI] [PMC free article] [PubMed] [Google Scholar]
- 26.Houk JC & Wise SP Feature Article: Distributed Modular Architectures Linking Basal Ganglia, Cerebellum, and Cerebral Cortex: Their Role in Planning and Controlling Action. Cereb. Cortex 5, 95–110 (1995). [DOI] [PubMed] [Google Scholar]
- 27.Redgrave P, Prescott TJ & Gurney K The basal ganglia: a vertebrate solution to the selection problem? Neuroscience 89, 1009–1023 (1999). [DOI] [PubMed] [Google Scholar]
- 28.Park J, Coddington LT & Dudman JT Basal Ganglia Circuits for Action Specification. Annu. Rev. Neurosci 43, 485–507 (2020). [DOI] [PubMed] [Google Scholar]
- 29.Ali F et al. The Basal Ganglia Is Necessary for Learning Spectral, but Not Temporal, Features of Birdsong. Neuron 80, 494–506 (2013). [DOI] [PMC free article] [PubMed] [Google Scholar]
- 30.Andalman AS & Fee MS A basal ganglia-forebrain circuit in the songbird biases motor output to avoid vocal errors. Proc. Natl. Acad. Sci 106, 12518–12523 (2009). [DOI] [PMC free article] [PubMed] [Google Scholar]
- 31.Aronov D, Andalman AS & Fee MS A Specialized Forebrain Circuit for Vocal Babbling in the Juvenile Songbird. Science 320, 630–634 (2008). [DOI] [PubMed] [Google Scholar]
- 32.Turner RS & Anderson ME Pallidal Discharge Related to the Kinematics of Reaching Movements in Two Dimensions. J. Neurophysiol 77, 1051–1074 (1997). [DOI] [PubMed] [Google Scholar]
- 33.Kupferschmidt DA, Juczewski K, Cui G, Johnson KA & Lovinger DM Parallel, but Dissociable, Processing in Discrete Corticostriatal Inputs Encodes Skill Learning. Neuron 96, 476–489.e5 (2017). [DOI] [PMC free article] [PubMed] [Google Scholar]
- 34.Dhawale AK et al. Automated long-term recording and analysis of neural activity in behaving animals. eLife 6, e27702 (2017). [DOI] [PMC free article] [PubMed] [Google Scholar]
- 35.Alexander GE, DeLong MR & Strick PL Parallel organization of functionally segregated circuits linking basal ganglia and cortex. Annu. Rev. Neurosci 9, 357–381 (1986). [DOI] [PubMed] [Google Scholar]
- 36.Hunnicutt BJ et al. A comprehensive excitatory input map of the striatum reveals novel functional organization. eLife 5, e19103 (2016). [DOI] [PMC free article] [PubMed] [Google Scholar]
- 37.Miyachi S, Hikosaka O & Lu X Differential activation of monkey striatal neurons in the early and late stages of procedural learning. Exp. Brain Res 146, 122–126 (2002). [DOI] [PubMed] [Google Scholar]
- 38.Yin HH et al. Dynamic reorganization of striatal circuits during the acquisition and consolidation of a skill. Nat. Neurosci 12, 333–341 (2009). [DOI] [PMC free article] [PubMed] [Google Scholar]
- 39.Miyachi S, Hikosaka O, Miyashita K, Kárádi Z & Rand MK Differential roles of monkey striatum in learning of sequential hand movement. Exp. Brain Res 115, 1–5 (1997). [DOI] [PubMed] [Google Scholar]
- 40.Thorn CA, Atallah H, Howe M & Graybiel AM Differential Dynamics of Activity Changes in Dorsolateral and Dorsomedial Striatal Loops during Learning. Neuron 66, 781–795 (2010). [DOI] [PMC free article] [PubMed] [Google Scholar]
- 41.Insafutdinov E, Pishchulin L, Andres B, Andriluka M & Schiele B DeeperCut: A Deeper, Stronger, and Faster Multi-person Pose Estimation Model. in Computer Vision – ECCV 2016 (eds. Leibe B, Matas J, Sebe N & Welling M) 34–50 (Springer International Publishing, 2016). [Google Scholar]
- 42.Mathis A et al. DeepLabCut: markerless pose estimation of user-defined body parts with deep learning. Nat. Neurosci 21, 1281–1289 (2018). [DOI] [PubMed] [Google Scholar]
- 43.Diedrichsen J & Kornysheva K Motor skill learning between selection and execution. Trends Cogn. Sci (2015) doi: 10.1016/j.tics.2015.02.003. [DOI] [PMC free article] [PubMed] [Google Scholar]
- 44.Graybiel AM The Basal Ganglia and Chunking of Action Repertoires. Neurobiol. Learn. Mem 70, 119–136 (1998). [DOI] [PubMed] [Google Scholar]
- 45.Jin X, Tecuapetla F & Costa RM Basal ganglia subcircuits distinctively encode the parsing and concatenation of action sequences. Nat. Neurosci 17, 423–430 (2014). [DOI] [PMC free article] [PubMed] [Google Scholar]
- 46.Sternad D It’s not (only) the mean that matters: variability, noise and exploration in skill learning. Curr. Opin. Behav. Sci 20, 183–195 (2018). [DOI] [PMC free article] [PubMed] [Google Scholar]
- 47.Markowitz JE et al. The Striatum Organizes 3D Behavior via Moment-to-Moment Action Selection. Cell 174, 44–58.e17 (2018). [DOI] [PMC free article] [PubMed] [Google Scholar]
- 48.Sjöbom J, Tamtè M, Halje P, Brys I & Petersson P Cortical and striatal circuits together encode transitions in natural behavior. Sci. Adv 6, eabc1173 (2020). [DOI] [PMC free article] [PubMed] [Google Scholar]
- 49.Geddes CE, Li H & Jin X Optogenetic Editing Reveals the Hierarchical Organization of Learned Action Sequences. Cell 174, 32–43.e15 (2018). [DOI] [PMC free article] [PubMed] [Google Scholar]
- 50.Mink JW THE BASAL GANGLIA: FOCUSED SELECTION AND INHIBITION OF COMPETING MOTOR PROGRAMS. Prog. Neurobiol 50, 381–425 (1996). [DOI] [PubMed] [Google Scholar]
- 51.Turner RS & Desmurget M Basal ganglia contributions to motor control: a vigorous tutor. Curr. Opin. Neurobiol 20, 704–716 (2010). [DOI] [PMC free article] [PubMed] [Google Scholar]
- 52.Grillner S & Robertson B The basal ganglia downstream control of brainstem motor centres--an evolutionarily conserved strategy. Curr. Opin. Neurobiol 33, 47–52 (2015). [DOI] [PubMed] [Google Scholar]
- 53.Redgrave P & Coizet V Brainstem interactions with the basal ganglia. Parkinsonism Relat. Disord 13 Suppl 3, S301–305 (2007). [DOI] [PubMed] [Google Scholar]
- 54.Ruder L & Arber S Brainstem Circuits Controlling Action Diversification. Annu. Rev. Neurosci 42, 485–504 (2019). [DOI] [PubMed] [Google Scholar]
- 55.Yin HH The Sensorimotor Striatum Is Necessary for Serial Order Learning. J. Neurosci 30, 14719–14723 (2010). [DOI] [PMC free article] [PubMed] [Google Scholar]
- 56.Shmuelof L & Krakauer JW Are We Ready for a Natural History of Motor Learning? Neuron 72, 469–476 (2011). [DOI] [PMC free article] [PubMed] [Google Scholar]
- 57.Wolff SBE, Ko R & Ölveczky BP Distinct roles for motor cortical and thalamic inputs to striatum during motor learning and execution. bioRxiv 825810 (2019) doi: 10.1101/825810. [DOI] [PMC free article] [PubMed] [Google Scholar]
- 58.Berridge KC & Whishaw IQ Cortex, striatum and cerebellum: control of serial order in a grooming sequence. Exp. Brain Res. Exp. Hirnforsch. Expérimentation Cérébrale 90, 275–290 (1992). [DOI] [PubMed] [Google Scholar]
- 59.Cromwell HC & Berridge KC Implementation of action sequences by a neostriatal site: a lesion mapping study of grooming syntax. J. Neurosci. Off. J. Soc. Neurosci 16, 3444–3458 (1996). [DOI] [PMC free article] [PubMed] [Google Scholar]
- 60.Grillner S & Wallén P Innate versus learned movements--a false dichotomy? Prog. Brain Res 143, 3–12 (2004). [DOI] [PubMed] [Google Scholar]
- 61.Poddar R, Kawai R & Ölveczky BP A Fully Automated High-Throughput Training System for Rodents. PLoS ONE 8, e83171 (2013). [DOI] [PMC free article] [PubMed] [Google Scholar]
- 62.Paxinos G & Watson C A stereotaxic atlas of the rat brain. N. Y. Acad (1998). [Google Scholar]
- 63.Katz LC & Iarovici DM Green fluorescent latex microspheres: a new retrograde tracer. Neuroscience 34, 511–520 (1990). [DOI] [PubMed] [Google Scholar]
- 64.Katz LC, Burkhalter A & Dreyer WJ Fluorescent latex microspheres as a retrograde neuronal marker for in vivo and in vitro studies of visual cortex. Nature 310, 498–500 (1984). [DOI] [PubMed] [Google Scholar]
- 65.Berke JD, Okatan M, Skurski J & Eichenbaum HB Oscillatory Entrainment of Striatal Neurons in Freely Moving Rats. Neuron 43, 883–896 (2004). [DOI] [PubMed] [Google Scholar]
- 66.Gage GJ, Stoetzner CR, Wiltschko AB & Berke JD Selective Activation of Striatal Fast Spiking Interneurons during Choice Execution. Neuron 67, 466–479 (2010). [DOI] [PMC free article] [PubMed] [Google Scholar]
- 67.Leonardo A & Fee MS Ensemble Coding of Vocal Control in Birdsong. J. Neurosci 25, 652–661 (2005). [DOI] [PMC free article] [PubMed] [Google Scholar]
- 68.Ölveczky BP, Otchy TM, Goldberg JH, Aronov D & Fee MS Changes in the neural control of a complex motor sequence during learning. J. Neurophysiol 106, 386–397 (2011). [DOI] [PMC free article] [PubMed] [Google Scholar]
- 69.Lehky SR, Sejnowski TJ & Desimone R Selectivity and sparseness in the responses of striate complex cells. Vision Res. 45, 57–73 (2005). [DOI] [PMC free article] [PubMed] [Google Scholar]
- 70.Martiros N, Burgess AA & Graybiel AM Inversely Active Striatal Projection Neurons and Interneurons Selectively Delimit Useful Behavioral Sequences. Curr. Biol. CB 28, 560–573.e5 (2018). [DOI] [PMC free article] [PubMed] [Google Scholar]
- 71.Friedman JH, Hastie T & Tibshirani R Regularization Paths for Generalized Linear Models via Coordinate Descent. J. Stat. Softw 33, 1–22 (2010). [PMC free article] [PubMed] [Google Scholar]
- 72.Colin Cameron A & Windmeijer FAG An R-squared measure of goodness of fit for some common nonlinear regression models. J. Econom 77, 329–342 (1997). [Google Scholar]
- 73.Glaser JI et al. Machine Learning for Neural Decoding. eNeuro 7, (2020). [DOI] [PMC free article] [PubMed] [Google Scholar]
- 74.van der Maaten L & Hinton G Visualizing Data using t-SNE. J. Mach. Learn. Res 9, 2579–2605 (2008). [Google Scholar]
- 75.Rodriguez A & Laio A Clustering by fast search and find of density peaks. Science 344, 1492–1496 (2014). [DOI] [PubMed] [Google Scholar]
- 76.Ramkumar P et al. Chunking as the result of an efficiency computation trade-off. Nat. Commun 7, 12176 (2016). [DOI] [PMC free article] [PubMed] [Google Scholar]
- 77.Tchernichovski O, Nottebohm F, Ho CE, Pesaran B & Mitra PP A procedure for an automated measurement of song similarity. Anim. Behav 59, 1167–1176 (2000). [DOI] [PubMed] [Google Scholar]
- 78.Wiltschko AB et al. Mapping Sub-Second Structure in Mouse Behavior. Neuron 88, 1121–1135 (2015). [DOI] [PMC free article] [PubMed] [Google Scholar]
Associated Data
This section collects any data citations, data availability statements, or supplementary materials included in this article.
Supplementary Materials
Data Availability Statement
The generated datasets are available from the corresponding author upon reasonable request.