The BMJ logoLink to The BMJ
. 1999 Mar 20;318(7186):803.

Performance indicators for primary care groups

Current indicators have been chosen for ease of collection rather than scientific validity

Paul Myers 1
PMCID: PMC1115225  PMID: 10082714

Editor—McColl et al provide a welcome alternative1 to performance indicators proposed by the NHS Executive and the Department of Health.2 They have suggested a range of evidence based interventions which are likely to produce behaviour change at practice level. The proposed indicators are very different from the performance indicators in current use, which seem to have a political role at health authority level, often being used simply to search for poorly performing doctors.

I have looked at the performance indicators that have been described in the literature, and in particular the scientific evidence underpinning them. Little evidence exists for the validity of using the common indicators in current use.3 A consistent finding is that indicators are often chosen for their ease of collection rather than their scientific validity. The most commonly used indicators include uptake of cervical cytology, immunisation rates, and various prescribing indicators. I have found little published research showing the importance of a high or low indicator. This applies particularly when the indicators have been accepted as proxy measures of individual general practitioners’ clinical competence. Others have also reviewed performance indicators and have identified additional areas that raise doubts about their validity.4,5

The new indicators will need to be differentiated from the non-clinical indicators that are currently popular markers of clinical competence. In practice these often reflect historic support that has been provided for the practice rather than the competence of the individual general practitioner. Thus the proposed introduction of evidence based clinical indicators for primary care groups provides a more acceptable way forward.

Although McColl et al’s paper refers to cost effectiveness of proposed interventions, the likely timescale over which they will operate requires consideration, as it has an important implication for the primary care groups at which they are targeted. Although secondary and tertiary prevention may reduce morbidity and mortality over decades, the short term effects of the implementation of interventions will create upward pressure on costs, particularly prescribing costs. This issue should not present obstacles to the promotion of evidence based interventions at the level of primary care groups but must be taken into account when these groups and health authorities are funding health improvement plans.

References

  • 1.McColl A, Roderick P, Gabbay J, Smith H, Moore M. Performance indicators for primary care groups: an evidence based approach. BMJ. 1998;317:1354–1360. doi: 10.1136/bmj.317.7169.1354. . (14 November.) [DOI] [PMC free article] [PubMed] [Google Scholar]
  • 2.NHS Executive. The new NHS: modern and dependable. A national framework for assessing performance. London: Department of Health; 1998. [Google Scholar]
  • 3.Myers P. Are current performance indicators helpful in the identification of poorly performing GPs? Departmental report. London: Queen Mary and Westfield College; 1998. [Google Scholar]
  • 4.Majeed FA, Voss S. Performance indicators for general practice. BMJ. 1995;311:209–210. doi: 10.1136/bmj.311.6999.209. [DOI] [PMC free article] [PubMed] [Google Scholar]
  • 5.Aveyard P. Monitoring the performance of general practices. J Eval Clin Pract. 1997;3:275–281. doi: 10.1046/j.1365-2753.1997.t01-1-00004.x. [DOI] [PubMed] [Google Scholar]
BMJ. 1999 Mar 20;318(7186):803.

Will they discriminate against small general practices?

Suresh Shah 1,2, Adrian Cook 1,2

Editor—We believe that the debate over performance monitoring in primary care groups and general practices1-1 has overlooked a combination of factors that may already be giving rise to a discriminatory effect against small general practices. An improvement to a system in which quarterly figures are used in isolation would be a rolling average of the current quarter plus the three preceding quarters.

Table.

Probability of failing to reach infant immunisation targets, by size of practice

Practice Single quarter
Four quarters aggregated
No of patients in target group Minimum for 90% coverage P No of patients in target group Minimum for 90% coverage P
Small 22 20 0.09 88 79 0.01
Large 110 99 0.01 440 396 <0.001

Indicators such as infant immunisation rates are measured by proportional coverage of a target group. For any practice, aggregating quarterly infant vaccination figures over several years would measure the long term coverage of that practice. Quarterly coverage would vary about this figure; the higher variability in smaller practices is explained by binomial variation, where the standard deviation of a proportion p is given by (p(l−p)/n)—the variability of p increases as n decreases.

Practices slightly above target in the long term would probably fall below in some quarters, while those slightly below target in the long term would occasionally rise above. Preschool immunisation figures are above 90% in England and Wales,1-2 so it would follow that most practices are above target in the long term. Hence the number of practices losing out because of quarterly variations will be greater than the number gaining.

We therefore predict that the most affected group is the group of small practices. The effect is to their disadvantage and results in reduced payment and an appearance of poorer performance. We have calculated the expected effect in an imaginary group of 100 small practices and 100 large practices, each achieving 95% long term coverage with a target of 90%. Quarterly coverage varies about 95%, with greater variability in the small practices. In a single quarter one large practice and nine small practices would be expected to fall below 90% and lose payment, despite identical long term coverage rates (table). If the results of four quarters were aggregated only one small practice and no larger practices would be expected to fail.

Footnotes

Competing interest: This work was funded by a small bursary from the West London Research Network.

References

  • 1-1.McColl A, Roderick P, Gabbay J, Smith H, Moore M. Performance indicators for primary care groups: an evidence based approach. BMJ. 1998;317:1354–1360. doi: 10.1136/bmj.317.7169.1354. . (14 November.) [DOI] [PMC free article] [PubMed] [Google Scholar]
  • 1-2.Vaccine coverage statistics for children up to five years of age in the United Kingdom. Commun Dis Rep CDR Wkly. 1998;8:345–346. [Google Scholar]
BMJ. 1999 Mar 20;318(7186):803.

Local consensus opinion must be reflected

Thomas Scanlon 1, Polly Tarrant 1

Editor—McColl et al state the criteria that primary care groups should use for selecting performance indicators.2-1 Performance indicators, they say, should be attributable to health care, sensitive to change, based on reliable and valid information, and precisely defined and should reflect important clinical areas and include a variety of dimensions of care.

We would add a further criterion: they should reflect local consensus opinion. The process of developing indicators of performance is as important as the evidence base behind them. There is a widespread perception in general practice that “indicators of good practice” are often developed by academics and managers who are remote and whose knowledge of clinical practice no longer includes personal experience. The same view is held about many guidelines, with the result that their impact on practice has often been negligible.

If performance indicators are to be embraced by clinicians then ownership is essential. To that end we have adopted an inclusive approach to developing quality indicators in East Sussex, Brighton and Hove. A consensus group of doctors, nurses, and managers working in primary care is currently considering a range of indicators in the first stage of a Delphi approach. We hope by this process to establish a group of primary care quality indicators that not only fulfil McColl et al’s criteria but also enjoy broad local support. Only then, we believe, will practitioners be willing to consider and adjust their own practice when they are seen to be performing differently from others.

References

  • 2-1.McColl A, Roderick P, Gabbay J, Smith H, Moore M. Performance indicators for primary care: an evidence based approach. BMJ. 1998;317:1354–1360. doi: 10.1136/bmj.317.7169.1354. . (14 November.) [DOI] [PMC free article] [PubMed] [Google Scholar]
BMJ. 1999 Mar 20;318(7186):803.

Performance of these indicators is critical

Mike Cranney 1,2, Stuart Barton 1,2

Editor—We agree with McColl et al that performance indicators for use by primary care groups should be more evidence based,3-1 but the interpretation of the available evidence and the implementation of performance indicators is not as straightforward as they suggest. Of the eight primary care interventions discussed, the control of hypertension arguably has the strongest combination of evidence, potential impact, and cost effectiveness. Unfortunately, assessing control of hypertension among a group of general practitioners is difficult. The apparent performance of a practice might have more to do with digit preference, the number of available blood pressure readings per patient, or mere chance than with any underlying variation in medical practice.

The authors give the mean level of control among hypertensive patients as 40%. In a multipractice audit we found that the figure changed from 37% to 54% according to whether control was defined as <160/90 or ⩽160/90 mm Hg.3-2 These results were based on the mean of up to three measurements per patient. The mean control changed from 26% to 62% with the different definitions when only one reading was available. Chance has a major role too: we found that the main determinant of whether a practice performed particularly well or particularly badly was the sample size in that practice (even though we used sample sizes of 10% of elderly patients, as others have done).3-3

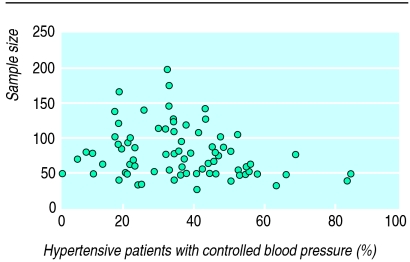
In the 76 practices in our audit, control of treated hypertensive patients varied between zero and 86%. The figure shows a funnel plot illustrating the influence of sample size. A sample size of 200-250 per practice is necessary to obtain even minimally reliable results (a signal to noise ratio over unity). This clearly has resource implications and may increase the funding required to deliver clinical governance.

Figure.

Figure

Funnel plot showing proportion of hypertensive patients with controlled blood pressure and sample size used in each practice. The spread of the proportions is largest when the sample size is low. Detailed analysis of the variance indicates that a sample size of 200 is needed to discriminate reliably between practices

We strongly disagree with the authors that treating elderly hypertensive patients is less cost effective than treating younger patients. Treating elderly patients delivers a greater benefit in the short term because the baseline risk is so much higher. The morbidity and mortality from coronary heart disease and cerebrovascular disease are substantially reduced in elderly patients: only 18 older people need to be treated for five years to prevent such events. More than twice as many younger patients need to be treated to prevent one death, and two to four times as many to prevent one cardiovascular event.3-4

Performance indicators certainly need to reflect important clinical areas and be sensitive to change, but even those with the best evidence base may fail to deliver in routine practice. The performance of performance indicators is a critical issue.

References

  • 3-1.McColl A, Roderick P, Gabbay J, Smith H, Moore M. Performance indicators for primary care groups: an evidence based approach. BMJ. 1998;317:1354–1360. doi: 10.1136/bmj.317.7169.1354. . (14 November.) [DOI] [PMC free article] [PubMed] [Google Scholar]
  • 3-2.Cranney M, Barton S, Walley T. The management of hypertension in the elderly by general practitioners in Merseyside: the rule of halves revisited. Br J Gen Pract. 1998;48:1146–1150. [PMC free article] [PubMed] [Google Scholar]
  • 3-3.Fahey T, Lancaster T. The detection and management of hypertension in the elderly of Northamptonshire. J Public Health Med. 1995;17:57–62. [PubMed] [Google Scholar]
  • 3-4.Mulrow CD, Cornell JA, Herrara CR, Kadri A, Farnett L, Aguilar C. Hypertension in the elderly: implications and generalizability of randomized trials. JAMA. 1994;272:1932–1938. [PubMed] [Google Scholar]
BMJ. 1999 Mar 20;318(7186):803.

Authors’ reply

Alastair McColl 1,2,3,4, Paul Roderick 1,2,3,4, John Gabbay 1,2,3,4, Helen Smith 1,2,3,4, Michael Moore 1,2,3,4

Editor—We share Myers’s concerns about the lack of scientific evidence underpinning proposed performance indicators. We presented a method to identify primary care interventions of proved efficacy and suggested performance indicators that could monitor their use.

We are evaluating our indicators in all 18 practices of a future primary care group, several of which are small practices. By presenting confidence intervals when comparing practice values with a local or an estimated national mean we have made the problems addressed by Shah and Cook more transparent. The training of those using and interpreting performance indicators should include how to understand the role of chance in the variation of indicator values.

Scanlon and Tarrant suggest the local development of indicators reflecting local consensus opinion with a Delphi approach. Primary care groups should use local consensus to prioritise their action. If they use only their local indicators, however, they will be unable to compare themselves with others outside their small locality. Nationally agreed clearly defined indicators would enable wider comparisons and help to identify variations in practice. Consensus indicators derived from Delphi approaches are not necessarily evidence based.4-2

The implementation of performance indicators is not straightforward. We stated that indicators require evaluation both before and after introduction into routine use. Our current evaluation project highlights the difficulties, many of which can be overcome. Interpretation of evidence is not straightforward (see our table 24-1). We used our sources of evidence in an “illustrative way to demonstrate the potential for developing evidence based process indicators.”

Cranney and Barton’s data show that control of hypertension is a problem that needs to be addressed whatever definition is used. Our method emphasised the importance of having indicators that reflect the detection and control of hypertension. These are not yet part of currently proposed indicators.4-3 We agree that primary care groups will need to balance the accuracy of indicator values against the cost of data collection. If our indicators were widely accepted then providers of primary care software would be more likely to provide straightforward mechanisms for data collection. Evidence for the efficacy of antihypertensive treatment in elderly patients is strong.4-4 Our reference to its relative cost effectiveness was from a Department of Health document.4-5

Our evidence based indicators could help to turn evidence into everyday practice and to have an impact on the population’s health. They will be useful not only for primary care groups engaging in clinical governance but also to justify investment in primary care interventions which should deliver clear health gains.

References

  • 4-1.McColl AJ, Roderick P, Gabbay J, Smith H, Moore M. Performance indicators for primary care groups: an evidence based approach. BMJ. 1998;317:1354–1360. doi: 10.1136/bmj.317.7169.1354. . (14 November.) [DOI] [PMC free article] [PubMed] [Google Scholar]
  • 4-2.Campbell SM, Roland MO, Qualyle JA, Shekelle PG, Buetow S. Quality indicators for general practice: which ones can general practitioners and health authority managers agree are important and how useful are they? J Public Health Med. 1998;20:414–421. doi: 10.1093/oxfordjournals.pubmed.a024796. [DOI] [PubMed] [Google Scholar]
  • 4-3.NHS Executive. The new NHS: modern and dependable. A national framework for assessing performance. London: Department of Health; 1998. [Google Scholar]
  • 4-4.Mulrow C, Lau J, Cornell J, Brand M. The Cochrane Database of Systematic Reviews. The Cochrane library. Cochrane Collaboration. Oxford: Update Software; 1997. Antihypertensive drug therapy in the elderly. (Updated quarterly.) [Google Scholar]
  • 4-5.NHS Executive. Assessing the options: CHD/stroke. Target effectiveness and cost-effectiveness of interventions to reduce CHD and stroke mortality. London: Department of Health; 1995. [Google Scholar]

Articles from BMJ : British Medical Journal are provided here courtesy of BMJ Publishing Group

RESOURCES