Abstract
The detection of oral bacteria in fecal samples has been associated with inflammation and intestinal diseases. The increased relative abundance of oral bacteria in feces has two competing explanations: either oral bacteria invade the gut ecosystem and expand (the Expansion hypothesis), or oral bacteria transit through the gut and their relative increase marks the depletion of other gut bacteria (the Marker hypothesis). Here, we collect oral and fecal samples from mouse models of gut dysbiosis (antibiotic treatment and DSS-induced colitis) and used 16S rRNA sequencing to determine the abundance dynamics of oral bacteria. We found that the relative, but not absolute, abundance of oral bacteria increases reflecting the Marker hypothesis. Fecal microbiome datasets from diverse patient cohorts, including healthy individuals and patients with allo-HCT or IBD, consistently support the Marker hypothesis and explain associations between oral bacteria abundance and patient outcomes consistent with depleted gut microbiota. By distinguishing between the two hypotheses, our study guides the interpretation of microbiome compositional data and could potentially identify cases where therapies are needed to rebuild the resident microbiome rather than protect against invading oral bacteria.
Introduction
The microbiomes inhabiting different healthy human body regions have distinct bacterial populations, which reflect the unique characteristics of each ecological niche1. Despite occasional exchange among these sites, their resident bacterial populations remain distinctive. For example, humans swallow 1.5 × 10¹² salivary bacteria per day2, some of which can travel to the lower gastrointestinal tract3–5 through the enteral6,7 and hematogenous8 routes. Gastric acids and antimicrobial peptides kill many oral travelers. Still, those who survive the journey must overcome colonization resistance from gut resident bacteria, better competitors in the gut environment7. Consequently, oral bacteria are typically scarce in the intestine and hardly detectable in the fecal samples of healthy individuals9,10.
Several factors, including antibiotic use, dietary shifts, aging, and intestinal inflammation, can increase the relative abundance of oral bacteria in fecal samples6. This relative enrichment of oral bacteria has been associated with several diseases, including Crohn’s disease11, ulcerative colitis12, irritable bowel syndrome13, colorectal cancer14, and liver cirrhosis15. However, the mechanisms underlying these associations remain unclear.
An important point to consider is that the oral bacterial enrichment in the intestine has primarily been detected through amplicon sequencing of the 16S rRNA gene using DNA extracted from fecal samples. This method produces compositional data, and we propose two competing explanations for its interpretation (Fig. 1): either the total abundance of oral bacteria expands within the intestine (the Expansion hypothesis), or the absolute abundance of gut resident bacteria decreases, resulting in a relatively higher representation of oral bacteria in fecal samples without a similar increase in their absolute numbers (the Marker hypothesis). While the Expansion hypothesis suggests that the gut environment has changed to favor its colonization by foreign bacteria originating from the oral cavity, the Marker hypothesis implies that the gut resident population was damaged with reduced total bacterial load, which increases the proportion of oral bacteria detected in the feces. Distinguishing between the two hypotheses is crucial for correctly interpreting microbiome data and their implications for human health.
Figure 1: The relative enrichment of oral bacteria in feces has two competing explanations.
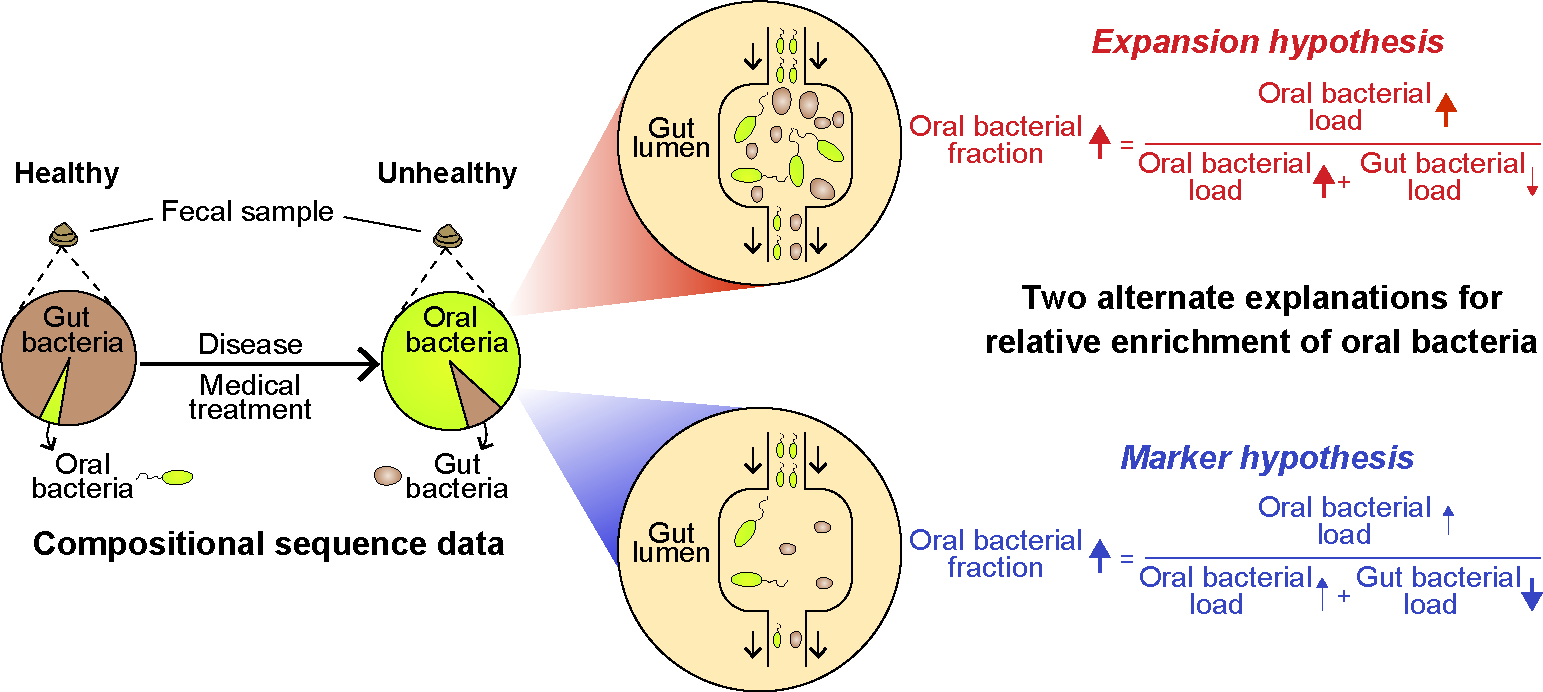
Certain diseases and medical treatments lead to an enrichment of oral bacteria in fecal samples. This phenomenon has two plausible explanations. In the Expansion hypothesis (highlighted in red), the increased fraction of oral bacteria is caused by a similar rise in absolute numbers. On the other hand, the Marker hypothesis (highlighted in blue) attributes this phenomenon to the depletion of gut bacteria. Whereas the Expansion hypothesis suggests that the gut environment has become more favorable for oral bacteria, the Marker hypothesis proposes that the number of gut resident bacteria has decreased. Consequently, the oral bacteria, which are simply passing through, increase in proportion in feces. Distinguishing between these two hypotheses is crucial for interpreting microbiome population dynamics through compositional analysis of fecal samples.
Here, we compared the two hypotheses using experiments with mice and data from human patients. In the mouse model, we collected each subject’s paired oral and fecal samples to quantify the total fraction of oral bacteria detected in the fecal samples after antibiotic treatment or chemically-induced epithelial damage. We found that antibiotic treatment, which depletes the gut bacterial population, increases the fraction of oral bacteria in feces without increasing their absolute numbers. In contrast, chemically-induced inflammation, which alters the composition of the gut microbiota without decreasing its population size, leaves the fraction of oral bacteria detected in feces unchanged. In human patients, we developed a method to estimate the oral bacterial fraction in fecal samples of individuals lacking paired oral samples. Using this method, we observed a similar increase in the relative, but not absolute, abundance of oral bacteria in the feces of patients who suffered gut bacterial depletion. These results favor the Marker hypothesis over the Expansion hypothesis. Finally, we show that the fraction of oral bacteria in feces not only serves as a marker for the depletion of gut bacteria but is also associated with patient outcomes consistent with a loss of gut bacteria.
Results
Treating mice with antibiotics supports Marker hypothesis
To study the enrichment of oral bacteria in the intestine, we treated eight C57BL/6J female mice with a cocktail of antibiotics (ampicillin, vancomycin, and neomycin) for one week (Fig. 2a). This regimen is known to cause a significant depletion of gut-resident bacteria16. We included two additional groups of (a) five untreated mice and (b) five mice treated with DSS (dextran sulfate sodium)—a chemical used to induce epithelial damage without impacting the total bacterial load in feces17—for comparison. Throughout the experiment, we collected paired fecal and oral samples, which were subsequently analyzed by 16S amplicon sequencing to profile bacterial composition (Extended Data Fig. 1a) and by 16S quantitative PCR (qPCR) to estimate total bacterial abundance (Extended Data Fig. 1b).
Figure 2: The administration of antibiotics to mice depletes gut bacteria and increases the relative abundance of oral bacteria in fecal samples.
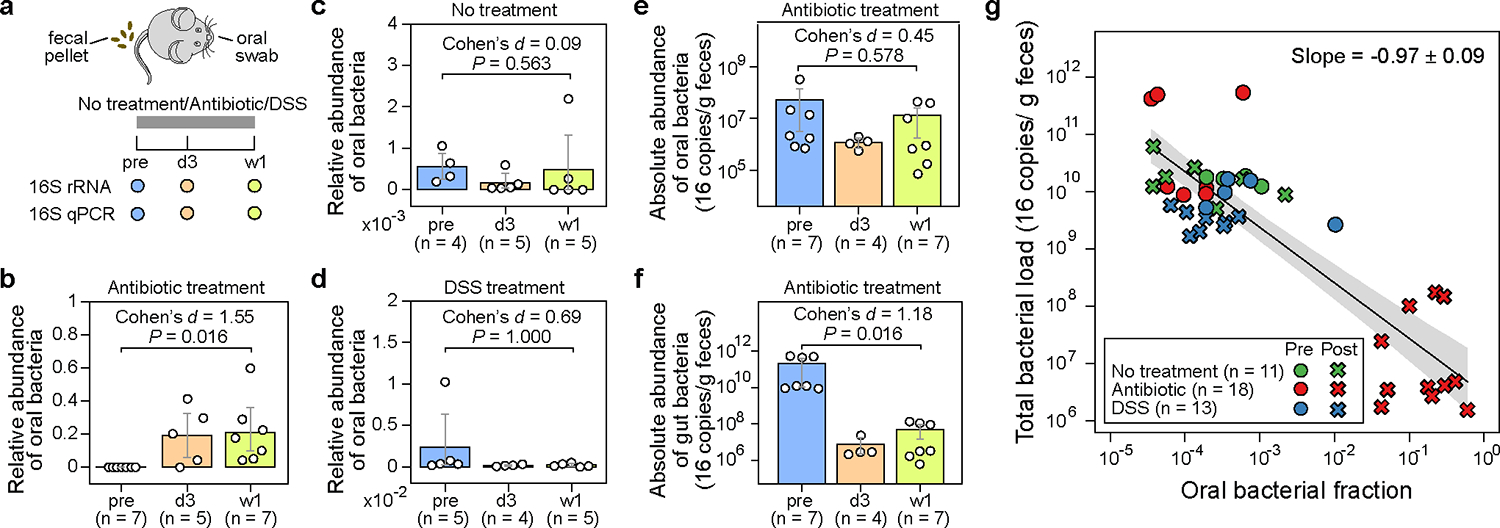
a, Experimental design. The experiment included three research arms: untreated controls (n=5), mice administered an antibiotic cocktail of ampicillin, vancomycin, and neomycin (n=8), and mice treated with dextran sulfate sodium (DSS) (n=5). Paired fecal and oral samples were collected at three-time points: the same day before treatment initiation (pre), 3 days after treatment initiation (d3), and one week after treatment initiation (w1). Samples with less than 1,000 reads were excluded from analysis and not shown in panels (b)-(g). b-d, Relative abundance of oral bacteria in fecal samples from mice in the antibiotic treatment group (b), no treatment group (c), and DSS treatment group (d). e,f, Absolute abundance of oral (e) and gut (f) bacteria in fecal samples from antibiotic-treated mice. In panels (b)-(f), each circle represents a fecal sample. Bar heights represent the means, with error bars indicating the 95% confidence interval (CI). P values were calculated using a one-sided Wilcoxon signed-rank test. g, Linear regression between oral bacterial fraction and total bacterial load in the log10-log10 scale. Pre-treatment (pre) and post-treatment (d3, w1) samples are represented by circles and crosses, respectively. The black line, and the shading of the same color indicates the ±95% CI. Samples with zero oral bacterial fraction were not shown and excluded from the linear regression analysis.
The composition of bacterial populations in the oral and fecal samples before antibiotic treatment were very different, reflecting the distinct habitats of these two organs (Extended Data Fig. 1a). Due to this niche specificity, we could define “oral resident bacteria”, as opposed to “gut resident bacteria”, as those amplicon sequence variants (ASVs) highly abundant and prevalent in pre-treatment oral samples but rarely found in their paired, pre-treatment fecal samples (Methods). We identified 53 such oral ASVs that belong to 32 classified genera (Table S1a), which further enabled us to calculate the total fraction of oral bacteria in all fecal samples (Table S1b). We subsequently compared the oral bacterial fraction that was estimated by our approach to the oral bacterial fraction that was calculated by the established source tracking algorithm, FEAST18, for post-treatment samples (Table S1c). This comparison, which validated our approach, yielded a remarkable consistency for oral bacterial fractions greater than 0.0001 (Extended Data Fig. 2; see Supplementary Note 1 for discussion on the discrepancy between the two approaches when oral bacterial fraction is less than 0.0001).
As expected, one week of antibiotic treatment resulted in a significant reduction in the total bacterial load in feces compared to the untreated and DSS-treated mice (Extended Data Fig. 1b). In antibiotic-treated mice, the drop in the total bacterial load coincided with an increased total fraction of oral bacteria detected in the feces (Fig. 2b). This fraction surged from an average of 1.7e-4 in the pre-treatment samples to an average of 0.19 on day 3 and 0.21 after one week. Remarkably, the microbiota composition of post-antibiotic treatment fecal samples was more similar to the pre-treatment oral samples than to the pre-treatment fecal samples (Extended Data Fig. 3a; see Adonis test in Table S2). In contrast, there was no enrichment of oral bacteria in the untreated mice (Fig. 2c). In DSS-treated mice, the chemically induced gut inflammation altered gut microbiota composition substantially (Extended Data Fig. 3b; see Adonis test in Table S2). However, DSS treatment did not decrease the total bacterial load (Extended Data Fig. 1b). There was also no increase in the fraction of oral bacteria detected in feces (Fig. 2d).
We next focused on the antibiotic-treated mice to investigate whether the observed oral bacterial enrichment aligned with the Expansion or Marker hypothesis. To determine the absolute abundance of oral bacteria, we multiplied the total relative abundance of oral bacteria by the total bacterial load. Notably, the average absolute load of oral bacteria detected in the feces did not increase after antibiotic treatment (Fig. 2e). Instead, the observed relative enrichment of oral bacteria coincided with a significant reduction in the absolute abundance of gut bacteria, which decreased by >1,000 fold on average (Fig. 2f).
The pure Marker hypothesis (i.e., oral bacterial load remains constant, and relative enrichment is solely driven by gut bacterial depletion) indicates that the derivative of log10(total bacterial load) to the log10(oral bacterial fraction) equals −1 (see Supplementary Note 2 for mathematical derivation). Conversely, a positive derivative would reject the pure Marker hypothesis and favor the pure Expansion hypothesis (i.e., gut bacterial load remains constant, and relative enrichment is solely driven by oral bacterial expansion). Remarkably, a linear regression between the log10-transformed oral bacterial fraction and total bacterial load in mouse feces produced a slope of −0.97 (Fig. 2g). These results, taken together, strongly support the Marker hypothesis as the predominant explanation for the enrichment of oral bacteria after antibiotic treatment.
In our experiments, antibiotics caused the most significant increase in the fraction of oral bacteria detected in feces (from ~0.0001 to ~0.1), along with a substantial decrease in the total bacterial load (from ~1010 to ~107 16S copies/g feces). In control or DSS-treated mice, the level of oral bacteria remained low (~0.0001), consistent with negligible changes observed in the total bacterial load, which stayed high at ~1010. The DSS perturbation, therefore, offers a critical counterexample. DSS induced a significant shift in the gut microbiota composition without reducing the total bacterial load. Consistent with the prediction of the Marker hypothesis, we did not observe an enrichment of oral bacteria in the feces after DSS treatment.
Quantifying oral bacteria in human fecal samples
We next aimed to determine whether the Marker hypothesis remains the major mechanism for the reported enrichment of oral bacteria in the human intestine. Similar to the mouse microbiome, bacterial populations residing in the human body have distinct compositions depending on the body site1. We, therefore, adopted a similar strategy as used in our mouse data analysis to identify and quantify oral bacteria in human feces (Methods and Fig. 3a,b). We analyzed 2,932 paired oral (collected from several oral cavity sites) and fecal samples from 223 healthy individuals in the Human Microbiome Project (HMP)1. We found 178 oral ASVs (Table S3) that belong to 42 classified genera, including 24 Prevotella and 15 Streptococcus ASVs (Fig. 3c). The set of 178 reference oral ASVs obtained from the HMP cohort enabled us to calculate the total fraction of oral bacteria in new fecal samples, even without paired oral samples. We validated our approach by analyzing a publicly available dataset consisting of paired fecal and saliva samples from patients with inflammatory bowel disease and their healthy controls19 (Extended Data Fig. 4 and Supplementary Note 3).
Figure 3: Oral bacterial ASVs identified from healthy human individuals involved in the HMP dataset.
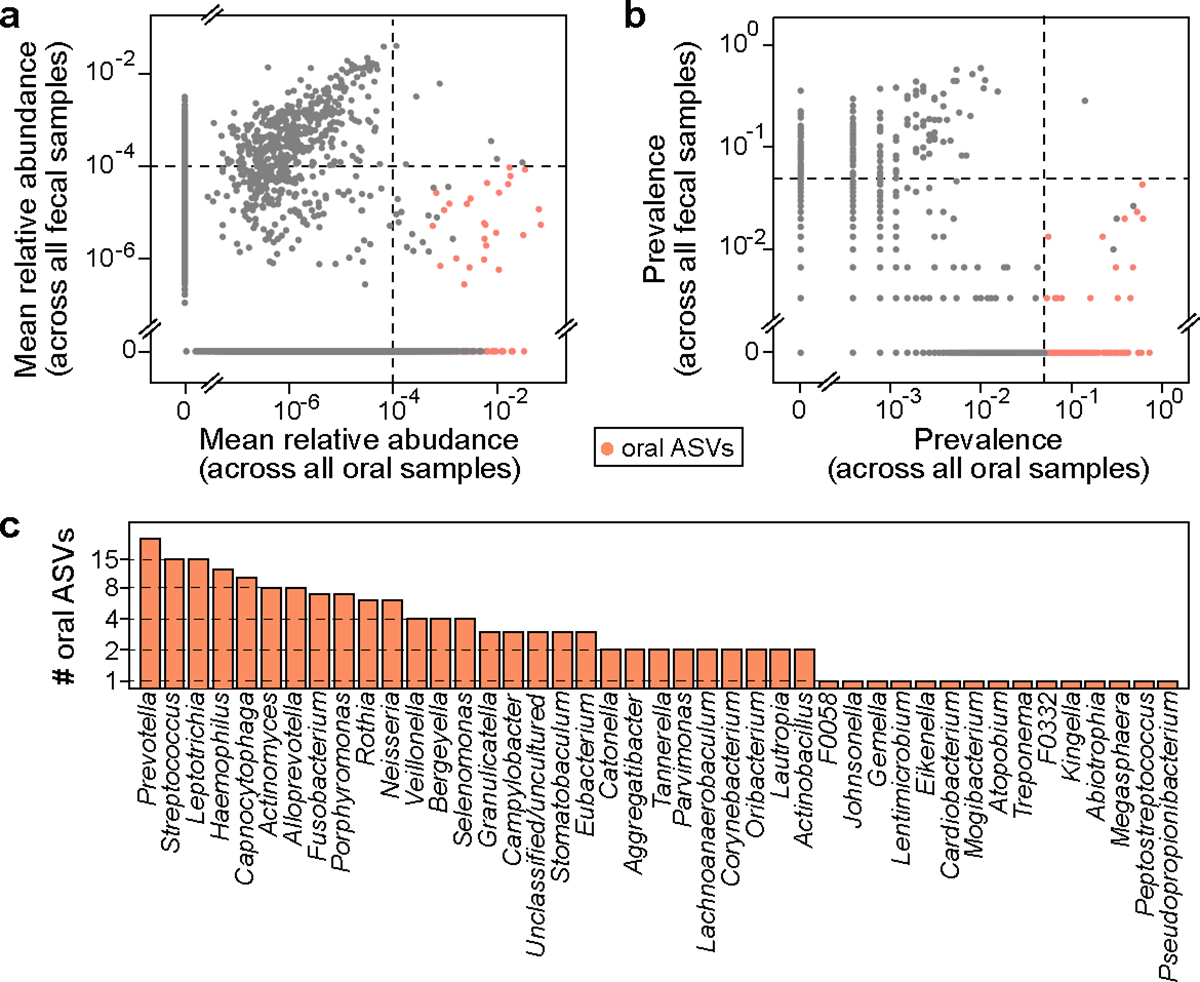
a,b, Mean relative abundance (a) and prevalence (b) of ASVs across 2,641 oral cavity samples (x-axis) and 291 paired fecal samples (y-axis). Each dot represents an ASV. Black dashed lines represent the cutoffs used to identify oral ASVs (see Methods for details). Among a total of 23,411 ASVs, 178 ASVs identified as of oral origin are highlighted in orange. c, Distribution of the 178 oral ASVs at the genus level.
Allo-HCT patient cohort supports the Marker hypothesis
Having established a method for detecting oral ASVs in human samples, we leveraged a previously compiled human microbiome dataset20 to test the two hypotheses. This dataset comprises 10,433 longitudinal fecal samples collected from 1,276 patients who underwent allogeneic hematopoietic cell transplantation (allo-HCT) over the past decade at Memorial Sloan Kettering Cancer Center (MSKCC). Within this dataset, a nested subset of 3,108 samples included 16S qPCR data. Since paired oral samples were unavailable, we used the above reference set to identify oral ASVs (Table S4a) and quantify their total fraction in fecal samples (Table S4b). Interestingly, 901 of the 10,433 fecal samples were dominated by a single oral ASV with a relative abundance that exceeded 30% (Fig. 4a). These oral ASVs with > 30% abundance primarily belong to three genera, Streptococcus, Actinomyces, and Abiotrophia, which dominated 778, 73, and 30 samples respectively. Notably, factors such as biofilm-forming capacity (Supplementary Note 4) and sequencing depth (Fig. S1) did not account for the observed variations in oral bacterial fraction.
Figure 4: Relative enrichment of oral bacteria in fecal samples of allo-HCT patients coincides with onset of antibiotic prophylaxis and depletion of gut bacteria.
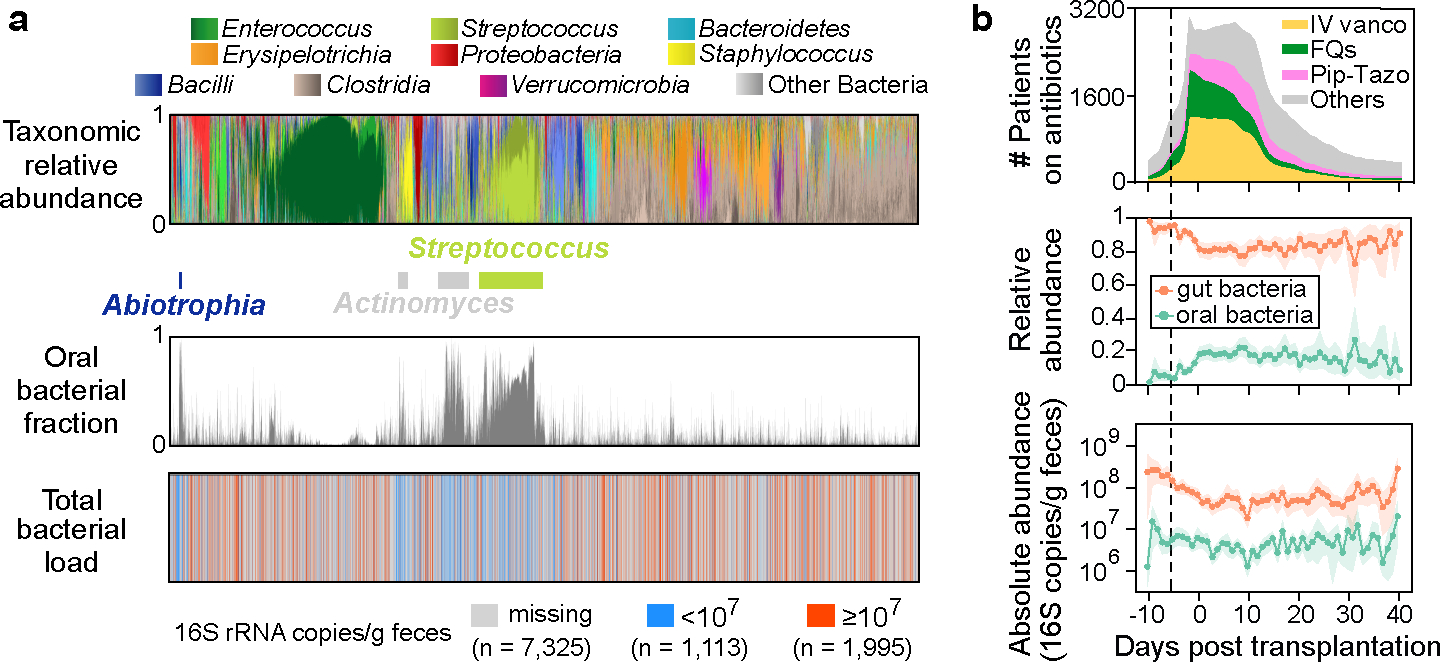
a, Bacterial population composition in all 10,433 fecal samples from our MSKCC dataset. Each thin vertical bar represents a single sample, with taxonomic composition (top), estimated oral bacterial fraction (middle), and total bacterial load (bottom) aligned for all samples. b, Profiles of antibiotic exposure (top) aligned with the population dynamics of relative (middle) and absolute (bottom) abundance of oral (green curves) and gut (orange curves) bacteria in feces. Lines and dots represent the means, and shadings of the same color indicate the 95% confidence interval. The black dashed line marks the median day −6 when antibiotic prophylaxis was initiated. IV vanco: intravenous vancomycin; FQs: fluoroquinolones; Pip-Tazo: piperacillin-tazobactam.
As shown in Fig. 4b (top), oral bacteria became significantly enriched in the fecal samples before allo-HCT, which temporally coincided with the onset of antibiotic prophylaxis (Methods; n = 87, one-sided Wilcoxon signed-rank test, the same below; P = 1.2e-11, Cohen’s d = 1.09). Among the major antibiotics, piperacillin-tazobactam showed the most significant association with the enrichment (Table S5 and Supplementary Note 5), which has been confirmed in a separate cohort of pediatric allo-HCT recipients21 (Extended Data Fig. 5). Notably, the rise in the relative abundance of oral bacteria did not correlate with changes in their absolute abundance (Fig. 4b, middle and bottom, green curves), which remained stable without significant increase throughout the transplantation period (P = 0.364, Cohen’s d = 0.15). As a result, the relative enrichment was attributed to the significant reduction in the absolute abundance of gut bacteria (P = 9.9e-8, Cohen’s d = 0.65), as shown by the orange curve in the bottom panel of Fig. 4b.
Analogous to the analysis of our mouse experiment, we performed a linear regression analysis between the log10(oral bacterial fraction) and log10(total bacterial load). This analysis yielded a slope of −0.41 (Extended Data Fig. 6), which is higher than the theoretically expected value of −1 under the pure Marker hypothesis. However, by simulating the impact of interindividual variability on the regression slope (Methods), the theoretical value of the slope increased to −0.36 (Extended Data Fig. 7a), suggesting that the observed discrepancy may arise from the variability between patients. In contrast to the negative linear regression slope observed for oral bacteria, positive slopes were observed for several dominant gut bacterial genera, indicating that their relative abundance reflected their absolute abundance (Table S6).
We also analyzed metagenomic data available for a nested subset of 395 fecal samples22 (Methods). A peak-to-trough ratio analysis revealed a slow growth rate for the most abundant oral ASV (Streptococcus ASV_8), suggesting that the Streptococcus was not actively proliferating in the intestine (Table S7 and Supplementary Note 6). Collectively, our human microbiome data analysis extends our findings beyond mice and validates the Marker hypothesis as the primary explanation for the enrichment of oral bacteria detected in patients’ feces.
Marker hypothesis also applies to IBD patients
The relative enrichment of oral bacteria in fecal samples has been recognized as a characteristic of IBD23. Intriguingly, another hallmark of IBD is a depleted microbial load in fecal samples24,25. If the Marker hypothesis holds for IBD patients, these two microbiome signatures should exhibit an inverse relationship. To test this hypothesis, we analyzed a previously published quantitative microbiome dataset obtained from 17 patients with Crohn’s disease and from 80 healthy controls24. These data included 16S amplicon sequencing and flow cytometric enumeration of microbial cells. As expected, these patients showed a higher oral bacterial fraction and lower total microbial load in their fecal samples compared to healthy controls (Fig. 5, marginal distributions). As a result, these two signatures were negatively correlated with a regression slope of −0.30, a value that matches the pure Marker hypothesis after considering interindividual variability (Extended Data Fig. 7b). We, therefore, conclude that the Marker hypothesis applies in the case of Crohn’s disease and joins the two previously discovered IBD biomarkers.
Figure 5: Inverse correlation between total fraction of oral bacteria and microbial load in fecal samples of patients with Crohn’s disease.
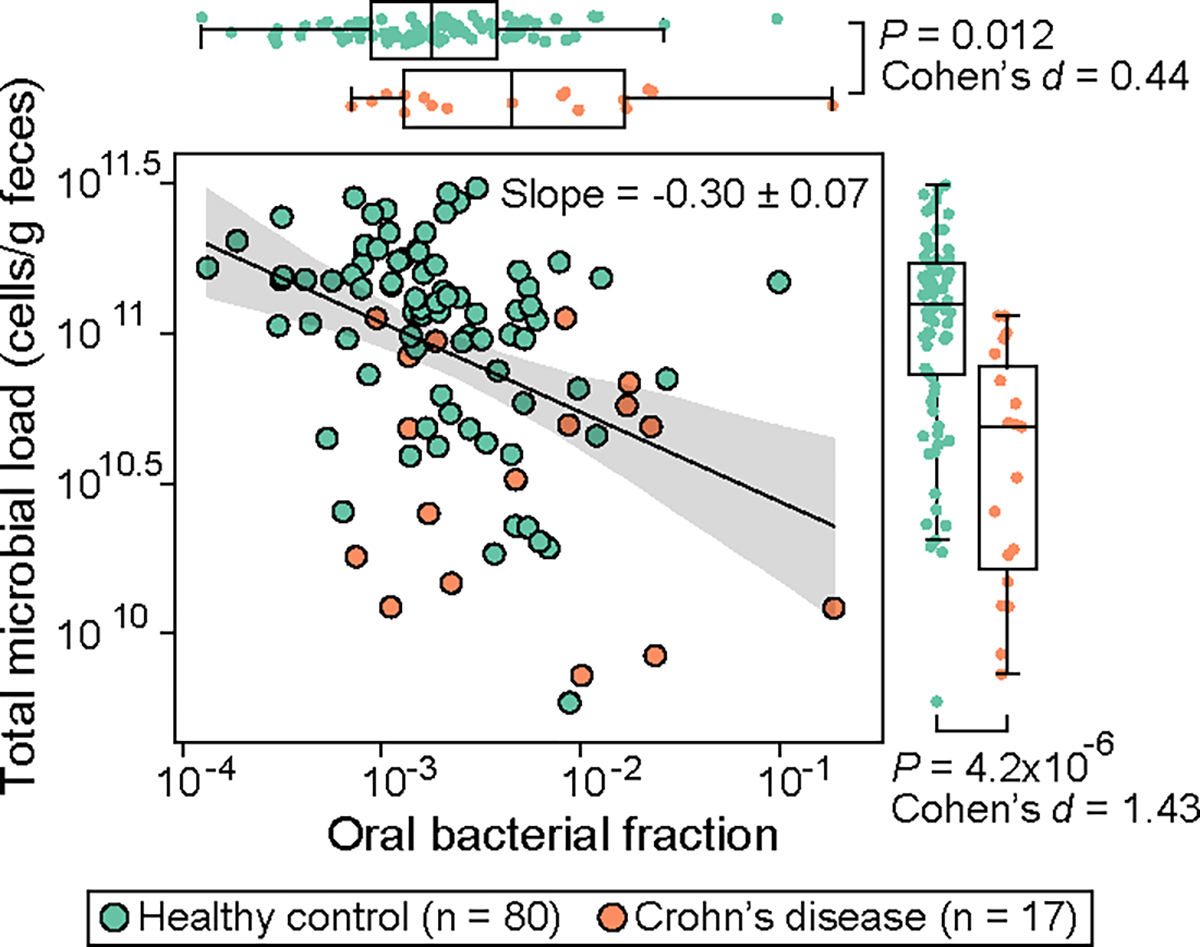
Each circle represents a fecal sample. Samples with zero oral bacterial fraction in the original dataset were excluded from the plot and statistical analyses. The black line represents the best linear fit, and the shading of the same color indicates the 95% confidence interval. The plot also displays the regression slope and its standard error. P values for the difference in the marginal distributions between patient and control groups were calculated using a one-sided Mann-Whitney U test. Box plots represent the median, 25th and 75th percentiles and whiskers represent the 95th and 5th percentiles.
Clinical implications
Loss of gut bacteria can alter host physiology and impact host health24–27. Having established the Marker hypothesis, we sought to determine whether the oral bacterial fraction can replace the total bacterial load in assessing the impacts of gut bacterial depletion on patient outcomes. This substitution, if validated, has potential clinical implications, since the associations between the size of the gut bacterial population and patient outcomes could be effectively studied without measuring the total bacterial load. To test the hypothesis, we used the MSKCC allo-HCT cohort which contains comprehensive patient outcome metadata. In this dataset, we showed that the oral bacterial fraction in feces can predict the depletion of total bacteria, with a mean cross-validation accuracy of 69% (Extended Data Fig. 8).
We considered four outcomes potentially impacted by the loss of gut bacteria: loss of stool consistency, fungal overgrowth, bloodstream infection, and overall survival. If oral bacterial fraction could replace the total bacterial load, it should be associated with these patient outcomes.
Previous studies have linked stool consistency and the gut microbiome28. As expected, we found a significant association between a high oral bacterial fraction and a low stool consistency (Extended Data Fig. 9a). Also, gut bacterial depletion can create an ecological niche for fungi to colonize and expand30. Consistent with the expectation, we saw that the fraction of oral bacteria is significantly higher in fecal samples with a positive fungal culture than in those with a negative fungal culture (Extended Data Fig. 9b). Moreover, the depletion of gut bacteria also eliminates potentially invasive pathogens that may translocate to bloodstream and cause infections31,32. Here, we saw that a high oral bacterial fraction reduces the risk of total bacterial bloodstream infections (Methods; Hazard ratio = 0.29; 95% confidence interval, 0.11–0.75; P = 0.011). This contrasts to intestinal domination by Enterococcus, Klebsiella, or Escherichia, which increases the risk of subsequent bloodstream infections caused by these organisms31,32. The striking contrast, in turn, supports our previous finding that the relative enrichment of oral bacteria in feces of allo-HCT recipients was not driven by their expansion in the gut (Fig. 4b).
Previous analysis of the MSKCC allo-HCT cohort has established a link between intestinal expansion of Enterococcus and higher patient mortality34. Here, we investigated whether the oral bacterial fraction in feces is also associated with mortality for 1,268 allo-HCT recipients with available survival information. A Cox proportional hazard model, adjusted for confounders that include Enterococcus absolute abundance, age, underlying diseases, graft source, and conditioning regimen, revealed that a higher oral bacterial fraction was associated with a higher risk of all-cause mortality following allo-HCT (Table S8; Hazard ratio = 4.02; 95% confidence interval, 2.11–7.68; P = 6.3e-5). Since graft-versus-host disease (GVHD) is a major complication after allo-HCT, we further explored whether GVHD contributed to the observed association between oral bacterial fraction and all-cause mortality. Among 462 patients who died within two years after allo-HCT, 168 developed GVHD. Using a Fine-Gray competing risk regression model, we determined that the total fraction of oral bacteria predicted an elevated risk of GVHD-related mortality within two years (Table S8; Hazard ratio = 4.23; 95% confidence interval, 1.69–10.6; P = 0.006). These associations with patient survival demonstrate that oral bacterial fraction in feces serves as a quantitative measure of microbiome damage that adversely affects host health.
Discussion
The relative enrichment of oral bacteria detected in fecal samples has been associated with diseases6 and changes in host gene expression13 in various gastrointestinal disorders. To understand these associations, it is essential to distinguish changes in relative abundance from changes in absolute abundance24,35. In this study, we show that the relative enrichment of oral bacteria in feces signifies a depletion of intestinal bacteria, which we term as the Marker hypothesis. This phenomenon is manifested on population averages. On an individual level, new oral ASVs may emerge in the gut following perturbations, leading to their increased absolute abundances (Extended Data Fig. 10). While we demonstrate that the total numbers of oral bacteria did not increase when gut bacteria have been depleted, it remains unclear what niche factors prevent their growth in the gut and whether these oral bacteria are even alive. Further research is needed to explore the growth and survival of oral bacteria in the gut niche36.
In our mouse experiments, chemically-induced gut inflammation through DSS significantly alters the gut environment. Similar to a previous study17, we observed its consequences through marked changes in gut microbiota composition. However, DSS neither reduced the total bacterial load17 nor enriched oral bacteria in mouse feces. The DSS experiment illustrates a gut microbiome perturbation that does not increase the total fraction of oral bacteria. It also supports our findings from antibiotics, indicating that an increased oral bacterial fraction requires a reduced total bacterial load. Interestingly, the Crohn’s disease patients (Fig. 5) had lower total bacterial load levels than their healthy controls, which correlated with a higher fraction of oral bacteria detected in their feces. Therefore, the mouse model of DSS-induced gut inflammation does not mimic the gut bacterial depletion observed in these patients. The lack of information regarding past antibiotic use leaves uncertainty about whether the observed gut bacterial depletion in these patients could have resulted from antibiotics.
Previous studies have shown that ectopic colonization of oral bacteria in mouse gut can induce strong immune responses and gut inflammation3,5. These findings in mice suggest a potential causal link between the presence of translocated oral bacteria in the gut and the development of diseases. By demonstrating the Marker hypothesis, our study suggests that these microbiome-disease associations could be mediated—at least in part—by the loss of gut commensals. In mice, the total microbial load in the intestine has exhibited positive correlations with fecal IgA concentration25, the proportions of mucosal RORγt+ cells26, and colonic lamina propria FoxP3+ regulatory T cells25. Still, the Marker hypothesis does not exclude the possibility that oral bacteria can drive disease. Even without an absolute increase in population size, oral commensals may acquire pathogenic potential in the human gut. Further research is needed to investigate how the pathogenicity of oral bacteria and the loss of gut commensals synergistically impact host responses and exacerbate pathology.
In summary, we have validated the Marker hypothesis by showing a robust negative correlation between oral bacterial fraction and total bacterial load. This correlation was observed under conditions where the gut microbiota was disrupted in mice by antibiotics, patients undergoing allo-HCT and antibiotic therapies, and patients with inflammatory bowel disease. However, a limitation of our approach is its dependency on a significant depletion of gut bacteria induced by perturbations or diseases. Antibiotics serve as a potent demonstration of the Marker hypothesis by depleting gut bacterial load by over 1000-fold. When individuals exhibit minor or no variations in their total bacterial load37, the fractions of oral bacteria detected in fecal samples are too small, and their relationships with the total bacterial load cannot be reliably quantified. More research is needed to determine whether the Marker hypothesis remains valid under different perturbations and disease conditions.
Nonetheless, validating the Marker hypothesis under antibiotic treatment holds broad clinical significance. Antibiotics stand as a cornerstone in medical practice for preventing and treating infections. As a result, concerns about antibiotic collateral damage to the gut microbiome are pertinent in the treatment of various diseases. The measurement of oral bacterial fraction in fecal samples, as developed in our study, offers a valuable method for assessing gut microbiome collateral damage. For example, leveraging the negative correlation between oral bacterial fraction and total bacterial load allows the estimation of changes in the absolute abundance of bacterial taxa from their relative abundances. This can be achieved by calculating the ratio of their relative abundances to oral bacterial fraction in fecal samples (Fig. S2). With this convenient method, previously identified bacterial taxonomic biomarkers based on microbiome compositional data can be reevaluated to discover new biomarkers based on estimated absolute abundances. One such biomarker is the outcome of fecal microbiota transplantation (FMT). A high fraction of oral bacteria in the feces of individuals being considered for FMT may signal a depleted gut microbiota, thereby suggesting a better chance of successful FMT engraftment. Supporting this idea, a recent study found that Streptococcus salivarius, a typical oral bacterial species, in the recipient’s microbiota facilitates donor strain colonization38.
Methods
Research compliance.
This research complies with ethical regulations, with protocol approved by the Memorial Sloan Kettering Institutional Biosafety Committee (protocol LAB202300059, last approved 9/26/2023).
Mouse experiment setup.
Mice used in this study were C57BL/6J specific pathogen-free mice purchased from The Jackson Laboratories. Animals were 6–8 weeks old females. During the study, mice were single-housed in autoclaved cages with ad libitum access to autoclaved and acidified reverse osmosis water (pH, 2.5 to 2.8) and irradiated feed (LabDiet 5053, PMI, St Louis, MO). The animal holding room is maintained at 72 ± 2 °F (21.5 ± 1 °C), relative humidity between 30% and 70%, and a 12:12 hour light:dark photoperiod. Animal use is approved by MSKCC’s IACUC. The institution’s animal care and use program is AAALAC-accredited and operates in accordance with the recommendations provided in the Guide.
We performed two independent experiments. In the first one we tested the role of broad-spectrum antibiotics on the relative abundance of oral bacteria in the intestine and in the second one we repeated antibiotic cocktail treatment and included one more group that was exposed to dextran sulfate sodium (DSS) salt. Briefly, mice were treated with cocktail of ampicillin (0.5g/l), vancomycin (0.5g/l) and neomycin (1g/l) for one week in drinking water. To test the role of DSS, which is supposed to minimally affect bacterial load in the gut17, we treated the mice with 3% DSS in the drinking water for a week. The water was changed once during both treatments to preserve the activity of antibiotics and DSS. The third group of animals that served as a control drank regular water. Fecal pellets were collected at least immediately before and one week after the initiation of different treatments, and in some cases 3 days after the initiation of the treatment. Oral swabs were collected as per reference of Abusleme et al.39 at the time fecal sampling was done. Briefly, mice were hand-held while sterile swab was introduced into mouth and swiped for at least 30 seconds. After, the swab was put into 150 μl of TE buffer, and the tip was cut off so that the Eppendorf can be closed. Samples were put immediately to dry ice. One negative control swab was taken by pulling out the swab from the pouch and swirling through air for at least 30 seconds, after which it was put in TE and on dry ice. Fecal samples and oral swabs were kept at −80°C until further processing.
Mouse experiments followed ethical practices; all experiments approved by Institutional Animal Care and Use Committee (IACUC) (protocol 18–03-003, last approved 2/16/2024).
DNA extraction and sequencing.
DNA extraction and library preparation of the fecal samples collected during the first mouse experiment was done in the sequencing core facility at MSKCC. However, since the DSS treatment results in difficult amplification of the DNA, all fecal samples from the second experiment (control, antibiotic-treatment, and DSS-treatment samples) were subjected to DNA extraction and further processing in the Xavier lab with protocols adapted to ensure the proper DNA amplification and library preparation.
First experiment fecal samples processing. Fecal DNA was extracted and 16S rRNA gene was amplified using the previously described protocol40. QIAseq 1-step Amplicon Library Kit (catalogue number 180419) was used for generating libraries that were later quantified, normalized, and sequenced using MiSeq Reagent Kit V3 (catalogue number MS-102–3001).
Second experiment fecal samples processing. Bacterial DNA from fecal samples was extracted using the QIAamp® DNA Fast Stool Mini kit (catalogue number 51604) with introduction of a mechanic disruption step with bead-beating as per reference of Djukovic et al.41. The V4-V5 region of the 16S rRNA gene was amplified with Q5 High-Fidelity DNA Polymerase (NEB #M0491) following the manufacturer’s recommendations. Briefly, for each sample, 25 μl of the PCR was prepared containing 5 μl of the Q5 buffer, 5 μl of the Q5 enhancer, 0.5 μl of the 10 mM dNTPs and 0.625 μl of the Q5 polymerase. 2.5 μl of the forward and 2.5 μl of the reverse primer at concentrations of 10 μM were added. Forward and reverse primers used for each sample contained unique sequences that would allow demultiplexing during sequence processing step. 1 ng of the DNA extracted from fecal samples collected from control and antibiotic-treated groups was added to reaction, while the DNA obtained from DSS-treated animals was diluted 1:20 and 5 ul was amplified. This was done since the carryover DSS prevented amplification of the DNA from some fecal samples, while in diluted samples the amplification worked as expected. Where necessary, the volume of the reaction was completed with water. Cycling conditions of the PCR were 96 °C for 10 minutes, and 35 cycles of 96 °C for 10 seconds, 51 °C for 30 seconds and 72 °C for 30 seconds. The final elongation step was performed at 72 °C for 5 minutes. Amplification was confirmed with agarose gel electrophoresis and PCR products were purified with AxyPrep Magnetic Beads, quantified with Quant-iT PicoGreen dsDNA kit (Invitrogen P7589), normalized and pooled. KAPA LTP Library Preparation Kit (catalogue number 07961871001) was used to generate sequencing libraries that were later quantified with Quant-iT PicoGreen dsDNA kit, normalized, and sequenced using MiSeq Reagent Kit V3.
Oral samples processing. Oral DNA was extracted by using modified DNeasy Blood and Tissue Kit protocol as described in Abusleme et al.39. After extraction V4-V5 region of the 16S rRNA gene was amplified with Q5 High-Fidelity DNA Polymerase by cycling 1 ng of the extracted DNA. Volumes and concentrations of PCR reagents were the same as described above. The following steps that include agarose gel electrophoresis, PCR product purification, normalization, pooling, library preparation, library quantification, and sequencing were performed as described in the previous section.
Quantitative PCR (qPCR) for determining total bacterial load.
For assessing the total bacterial load in fecal and oral samples, qPCR against standard curve was used to determine 16S rRNA copy number. For this purpose, the PowerUP qPCR Kit (Catalog number: 4367659) was used. Briefly, for each sample, 20 μl PCR triplicates were prepared with each containing 2 μl of the DNA used as template, 10 μl of mix provided by the manufacturer, and 1 μl of forward and reverse primers at the final concentration of 0.5 μM. We used the primer pair 27F/338R to amplify the V1-V2 region of the 16S rRNA gene (F- AGAGTTTGATCMTGGCTCAG; R-TGCTGCCTCCCGTAGGAGT). To complete the volume of the reaction, 6 μl of water was added. A PCR product of the 16S rRNA gene from Enterococcus faecium ATCC 700221 strain was used for obtaining a standard curve by amplifying its 16S rRNA gene and purifying the product. The copy number of the PCR product was determined based on its concentration and 16S rRNA sequence. A standard curve was obtained by using 10-fold dilutions.
Cycling conditions of the qPCR were 50 °C for 2 minutes, 95 °C for 2 minutes, and 40 cycles of 95 °C for 15 seconds, 56 °C for 15 seconds and 72 °C for 60 seconds. By extrapolating results by looking the ones obtained from standard curve samples, the number of 16S rRNA genes was determined for each sample. The final number of 16S rRNA genes per 1 g of fecal sample was calculated by multiplying the number of 16S rRNA molecules obtained by qPCR with DNA elution volume after DNA extraction and dividing this number with the weight of the fecal pellet from which DNA extraction was performed.
16S amplicon sequencing data processing.
Samples collected from the first mouse experiment were sequenced once. Fecal and oral samples from the second mouse experiment were sequenced twice using the MiSeq sequencers at the Joao Xavier and Thomas Norman labs at MSKCC. Since the two sequencing runs yielded very similar read coverage and bacterial profiles, we combined the read counts from both runs for samples in the second mouse experiment. Sequence processing was done following DADA2 (Divisive Amplicon Denoising Algorithm) tutorial with an in-house script. Briefly, after demultiplexing, reads were trimmed to the first 180 bp or the first point with a quality score Q < 2, and removed if they contained ambiguous nucleotides (N) or if two or more errors were expected based on the quality of the trimmed reads. Paired reads were merged, and chimeras were removed. ASVs were identified using DADA2 and classified against the SILVA v138 database42.
The bacterial profiles of > 10,000 fecal samples from MSKCC allo-HCT recipients were previously analyzed by an in-house pipeline and compiled in a recent study20. Similarly, reads were trimmed to the first 180 bp or the first point with a quality score Q < 2, and removed if they contained ambiguous nucleotides (N) or if two or more errors were expected based on the quality of the trimmed reads. ASVs were identified using DADA243 and classified against the SILVA v138 database42.
The demultiplexed and primer-trimmed HMP1 16S sequences (V3-V5 region) were obtained from the Qitta repository44 and processed using QIIME (Quantitative Insights Into Microbial Ecology) 245. DADA2 was applied to denoise the data and generate an ASV per sample count table, using the QIIME denoise-pyro plugin45. To remove low-quality tails, we used parameter --p-trunc-len 395 to generate ASVs that cover the entire high-quality V4-V5 region. Taxonomy classification of the ASV sequences was performed using the QIIME plugin “feature-classifier”46 and the SILVA database42. The classification took three steps. We first extracted the V3-V5 region of the SILVA reference sequences using the extract-reads method. Then we created a classifier by using the fit-classifier-naïve-bayes method with extracted reads and the SILVA reference taxonomy. Finally, we ran the classifier on the ASV sequences using the classify-sklearn method to get their taxonomy.
All other microbiome datasets in this study were processed using QIIME 245. Demultiplexed short reads were trimmed using the QIIME cutadapt plugin47 with parameters “--p-error-rate 0.1” and “--p-overlap 3”. The trimmed reads were then denoised using the QIIME dada2 plugin with truncation lengths determined by per-base quality scores to generate ASV-level feature tables. Taxonomic classification was performed using the QIIME plugin “feature-classifier classify-sklearn”48 against the SILVA v138 database42.
For all microbiome datasets analyzed in this study, samples with sequencing coverage below 1,000 reads were excluded. Additionally, we excluded non-bacterial ASVs and ASVs with “Chloroplast” or “Mitochondria” in their taxonomy labels.
Identification of oral ASVs in fecal samples.
We leveraged paired oral and fecal samples to identify bacterial ASVs typically colonizing the oral cavity. An ASV is considered of oral origin if it satisfies all four of the following criteria simultaneously: (1) its relative abundance, averaged across all oral cavity samples, is above ; (2) its relative abundance, averaged across all fecal samples, does not exceed ; (3) its prevalence, across all oral cavity samples, is above ; (4) its prevalence, across all fecal samples, does not exceed . We identified a total of 53 such oral ASVs in all mice using and . Mouse-specific oral ASVs were selected by excluding any ASV from this set if it was undetectable in the pre-treatment oral samples. Exceptions were made for three mice (Control_2D, DSS_2A, DSS_2C) lacking pre-treatment oral samples, for which no ASVs were excluded. To identify oral ASVs in humans, we employed the HMP1 dataset and applied and . The cutoff values are consistent with those used in a previous study49 for identifying oral species (not ASVs) from metagenomic data. For both mice and humans, the prevalence of an ASV was calculated as the proportion of samples containing the ASV at a relative abundance above 50. Unless otherwise specified, we calculated the absolute abundance of oral and gut bacteria by multiplying their relative abundances by the total bacterial loads, which can be quantified by either 16S qPCR or flow cytometry.
Impact of interindividual variability on regression slope between oral bacterial fraction and total bacterial load.
In the absence of interindividual variability, the derivative of the log-transformed total bacterial load with respect to the log-transformed oral bacterial fraction equals to −1 under the pure Marker hypothesis and remains positive under the pure Expansion hypothesis (see Supplementary Note 2). To understand the impact of interindividual variability on this derivative, we simulated the oral bacterial fraction and total bacterial load in fecal samples from both a control and a case group. The control group samples are collected from individuals with low oral bacterial fraction. These individuals, for example, include healthy individuals or patients before a medical treatment. The case group samples are collected after a perturbation that induces relative enrichment of oral bacteria, such as antibiotic treatment and certain intestinal disorders. It is important to note that the control and case group samples do not necessarily come from the same longitudinal study and may be collected from different populations in a cross-sectional study.
For each control group sample , we assume that the log10-transformed values of the total bacterial load and oral bacterial fraction follow separate Gaussian distributions:
| Eq. 1 |
| Eq. 2 |
Here, and represent the means of the respective distributions, and and represent the standard deviations.
For each case group sample , we first generate its baseline values of oral bacterial fraction and total bacterial load from the same Gaussian distributions. These baseline values characterize the microbiome state prior to any perturbation that enriches oral bacteria in this sample. The log10-transformed value of oral bacterial fraction after the perturbation is drawn from a uniform distribution between and . Here, represents the maximum possible oral bacterial fraction, which may vary based on the strength and type of the perturbation. After sampling , the total bacterial load () in this sample can be computed in two different ways. Under the pure Marker hypothesis (i.e., oral bacterial load remains constant), we have . Under the pure Expansion hypothesis (i.e., gut bacterial load remains constant), we have .
The simulation parameters specific to the MSKCC allo-HCT cohort presented in Fig. 4 and the Crohn’s disease cohort presented in Fig. 5 were determined as follows. For the allo-HCT recipients, their fecal samples collected between day −20 and 40 relative to the day of transplantation were divided into two sets: 185 samples obtained prior to antibiotic prophylaxis constitute the control group, and 2,339 samples after the initiation of prophylaxis constitute the case group. Using the control group samples, we estimated the values of the following parameters: , , , and . On the other hand, the Crohn’s disease cohort consists of 80 healthy individuals in the control group and 17 patients with Crohn’s disease in the case group. We calculated the following parameter values from the control group samples: , , , and .
Cox proportional hazard model.
We used a time-varying Cox proportional hazard model to evaluate the association between antibiotic exposure and intestinal domination by oral ASVs in allo-HCT recipients. The inclusion criterion of patients with at least 10 samples between day −10 and 40 relative to transplantation led to 291 patients included. The event of interest was intestinal domination of any oral bacterial ASV that exceeds 30%. Binary indicators of antibiotic exposure were used as covariates (see Table S5 for included antibiotics). Patients without any oral bacterial domination at day 40 were censored. The model outputs the hazard ratio, which compares the likelihood of oral ASV domination occurring among patients with antibiotic exposure and patients without.
Using data from the same 291 patients, we performed the Cox proportional hazard regression analysis to assess the association between oral bacterial domination and total bloodstream infections (BSIs). Oral bacterial domination, as defined above, was analyzed as a time-varying predictor. The events of interest were BSIs caused by any bacterial species from Citrobacter, Enterobacter, Enterococcus, Klebsiella, Escherichia, Pseudomonas, Stenotrophomonas, and Streptococcus. Patients without any infection of interest at day 40 were censored. The hazard ratio indicates the relative risk of developing bacterial BSIs among patients with intestinal dominations of oral bacteria compared to those without dominations.
For both associations, we fit the Cox models using the CoxTimeVaryingFitter method from the Python package lifelines.
Survival analysis of allo-HCT recipients.
Following our previous approach33,51, we employed multivariable survival models with time-varying covariates to examine the associations between oral bacterial fraction in feces and all-cause or GVHD-related mortality among allo-HCT recipients. A total of 1,268 patients with fecal samples collected on or after day 0 relative to transplantation were included. The endpoint of interest was all-cause mortality or GVHD-related mortality until 2 years after allo-HCT, where patients who survived beyond 2 years were censored. Here, GVHD-related mortality was defined as death due to GVHD or after GVHD onset, without cancer relapse52 or other-cause mortality. Therefore, the GVHD-related mortality is the endpoint of interest with relapse and other-cause mortality as competition risks. Due to the different endpoint characteristics, we applied the Cox model and Fine-Gray model for all-cause mortality and GVHD-related mortality, respectively. Both models included oral bacterial fraction as the predictor, along with other covariates including log-transformed Enterococcus absolute abundance (a risk factor for both all-cause and GVHD-related mortality34), age, underlying disease, graft source, and conditioning intensity. Since qPCR data was available for fewer than a third of the samples, we used the Enterococcus-to-oral bacteria relative abundance ratio to estimate the absolute abundance of Enterococcus across all 10,433 samples. We have validated the estimation in Fig. S2. The theoretical underpinning for this estimation is provided by the inverse correlation between oral bacterial fraction and total bacterial load: dividing by the oral bacterial fraction is equivalent to multiplying by the total bacterial load. The two survival analyses were performed using functions coxph and finegray from the R package survival, respectively.
Shotgun metagenomic sequencing data processing.
We adapted a recently published bioinformatic pipeline53 to assemble bacterial genomes from metagenomic data. The pipeline uses MEGAHIT54 to assemble contigs from short reads. It subsequently employs Metabat255 and CONCOCT56 to bin these contigs into Metagenome-Assembled Genomes (MAGs). In the last step, it uses DAS Tool57 to generate an optimized, non-redundant set of MAGs. High-quality Streptococcus MAGs (≥ 75% complete, ≤ 175 fragments/Mbp sequence, and ≤ 2% contamination) classified by Kraken258 were further analyzed by iRep59. The iRep value of a MAG represents the average number of replication events over different subpopulations of the MAGs weighted by their relative abundances.
Statistical testing.
Detailed descriptions of statistical analyses, including sample size, hypothesis test name, P value, and effect size, are provided. All P values were corrected for multiple testing using false discovery rate (FDR) adjustment (the Benjamini-Hochberg procedure). Statistical significance was defined as (adjusted) P value < 0.05. The pairwise Adonis test was performed using the R package pairwiseAdonis. The Mann-Whitney U test, Wilcoxon signed-rank test, and linear regression analysis were performed using the corresponding functions in the Python Scipy package. Specifically, we used a one-sided Wilcoxon signed-rank test to assess the differences in the oral bacterial fraction, oral bacterial load, and gut bacterial load before and after the administration of antibiotic prophylaxis among MSKCC allo-HCT recipients. We defined the pre-treatment period as spanning from 20 days before transplantation until the onset of antibiotic prophylaxis. The post-treatment period extended from the initiation of antibiotic prophylaxis to the day of neutrophil engraftment. We computed their average values across all samples collected during each of the pre-treatment and post-treatment periods. Data collection and analysis were not performed blind to the conditions of the experiments.
Plots.
For all main and supplementary figures displaying a boxplot, the central line represents the median. The box limits correspond to the first and third quartiles (25th and 75th percentiles). The whiskers extend to the smallest and largest values or at most to 1.5 times the interquartile range, whichever is smaller. All plots were generated using Python Matplotlib library and the Seaborn package.
Extended Data
Extended Data Figure 1: Paired fecal and oral microbiome samples in the mouse experiments.
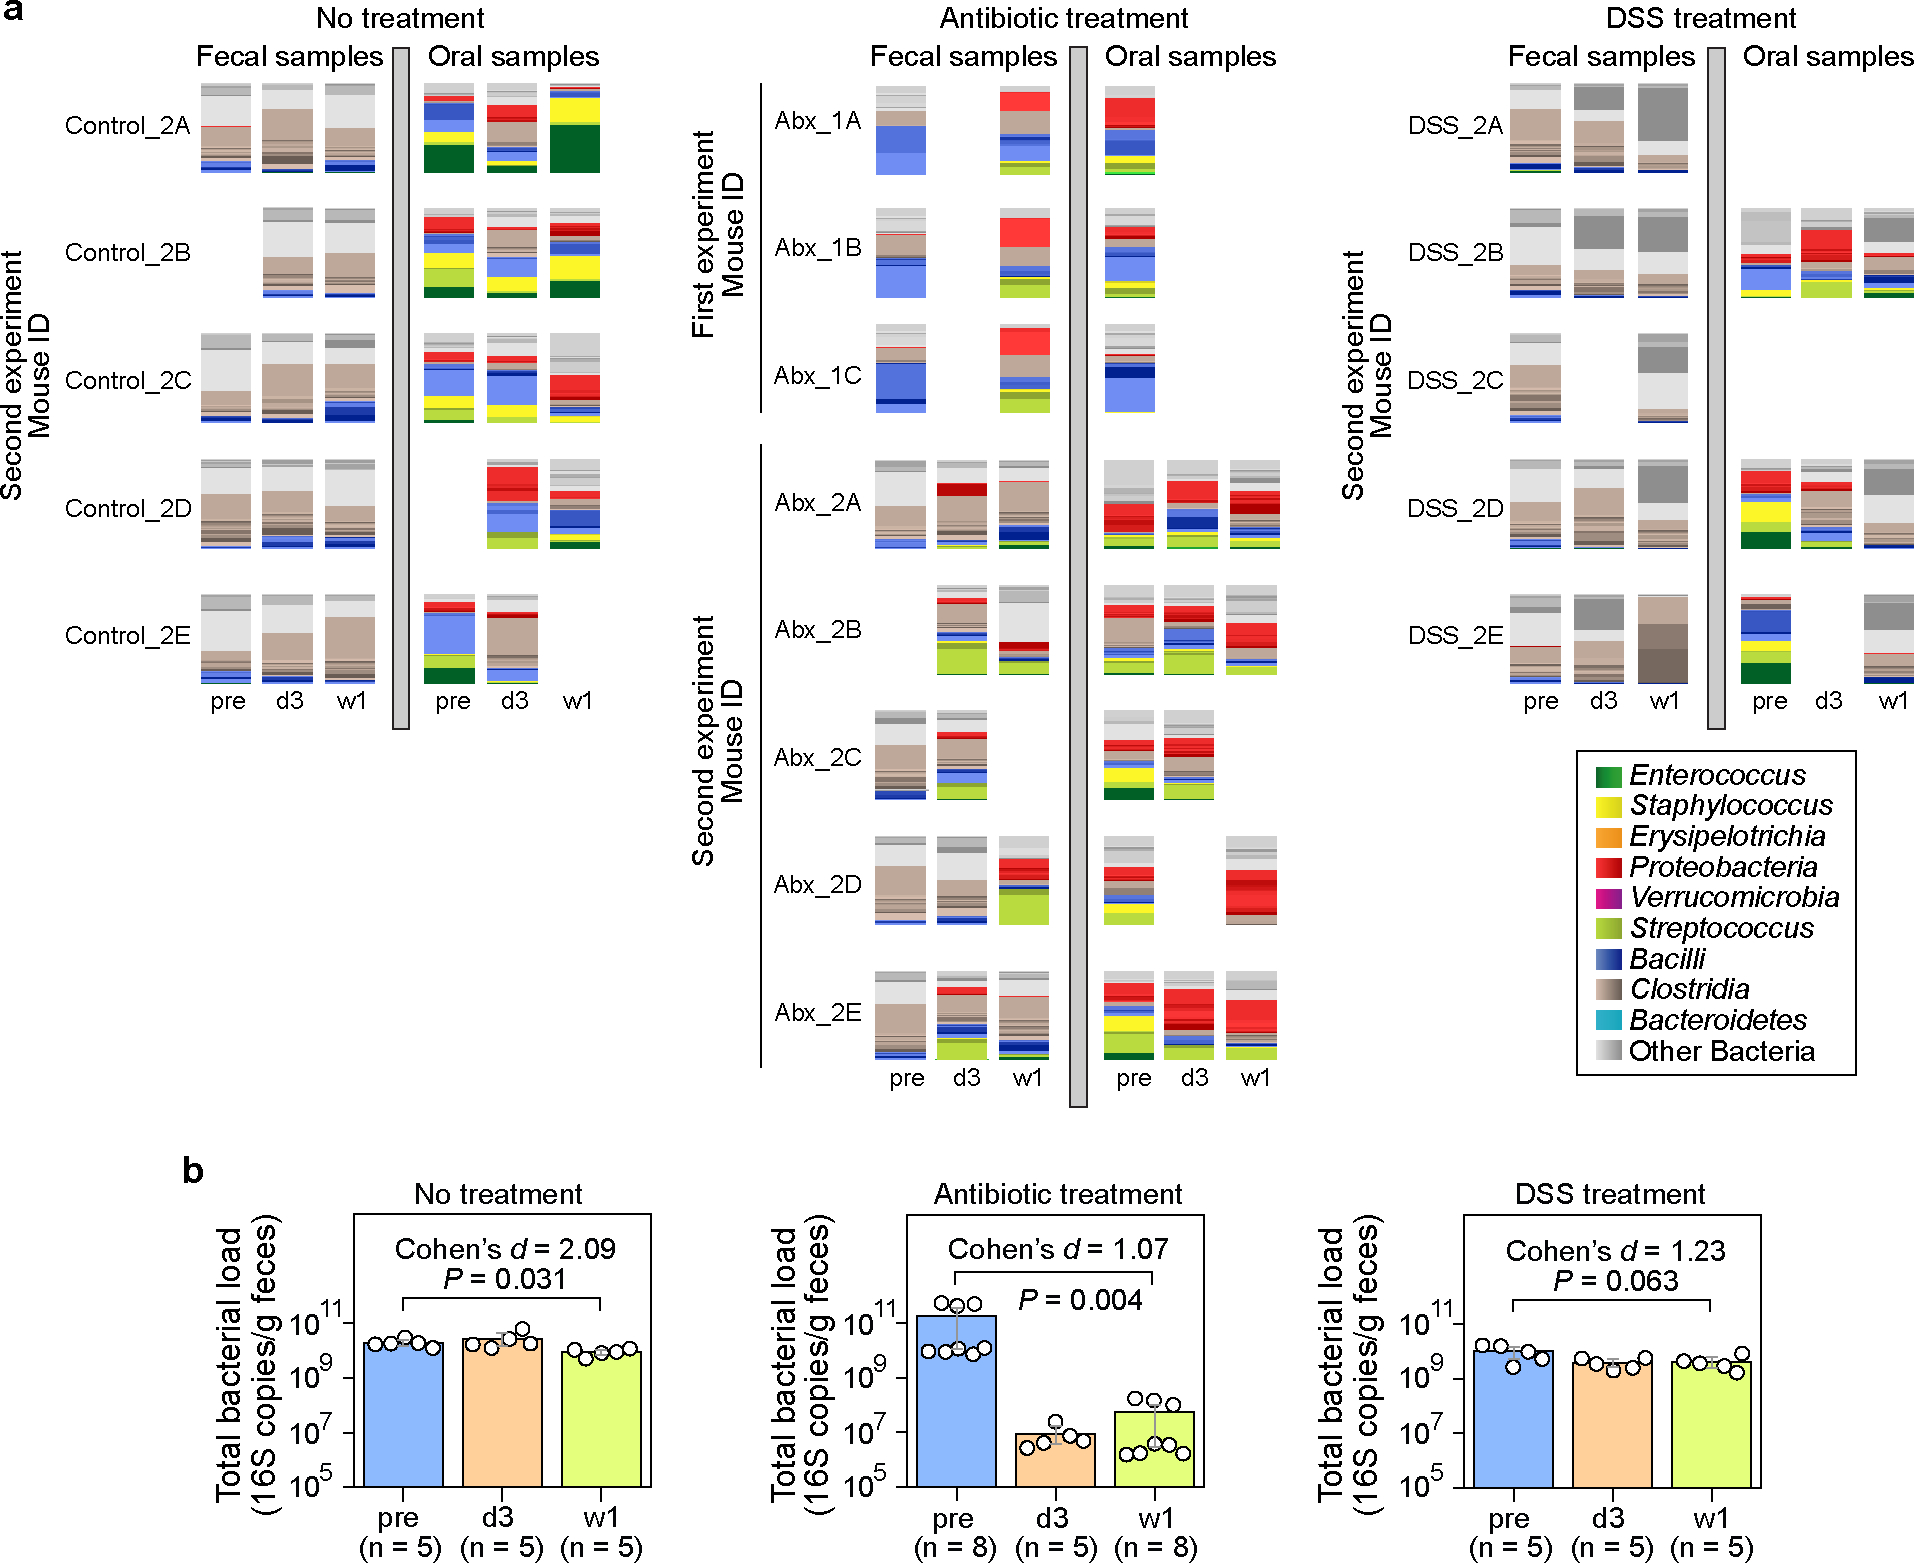
a, Bacterial ASV profiles displayed using stacked bar plots. Samples were collected at three time points: pre (before treatment), d3 (3 days after treatment initiation), and w1 (one week after treatment initiation). Missing samples in the second experiment were due to low sequence coverage (samples with less than 1,000 reads were excluded). b, Total bacterial load in fecal samples (circles). Bar heights represent the means, with error bars indicating the 95% confidence interval. P values were calculated using a one-sided Wilcoxon signed-rank test. DSS: Dextran Sulfate Sodium.
Extended Data Figure 2: Quantitative agreement between our method and FEAST18 for estimating oral bacterial fraction in post-treatment fecal samples.
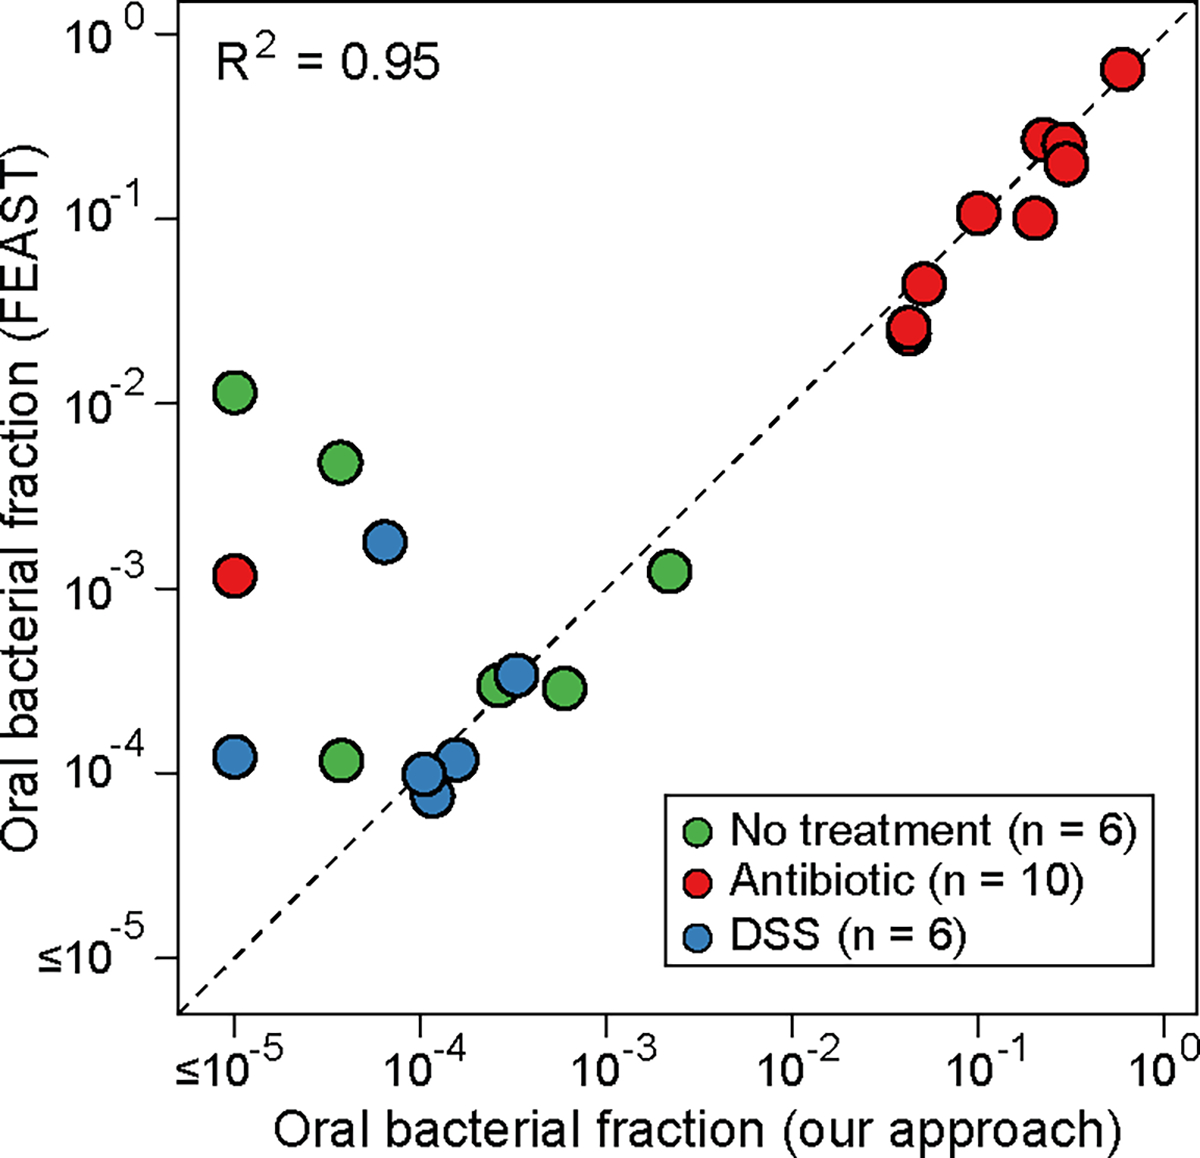
The FEAST-estimated values were averaged over 10 different runs. DSS: Dextran Sulfate Sodium. See Supplementary Note 1 for discussion on the discrepancy between the two approaches when oral bacterial fractions estimated by our approach fall below 0.0001.
Extended Data Figure 3: Principal coordinate analysis plot of the microbiome samples in the mouse experiments.
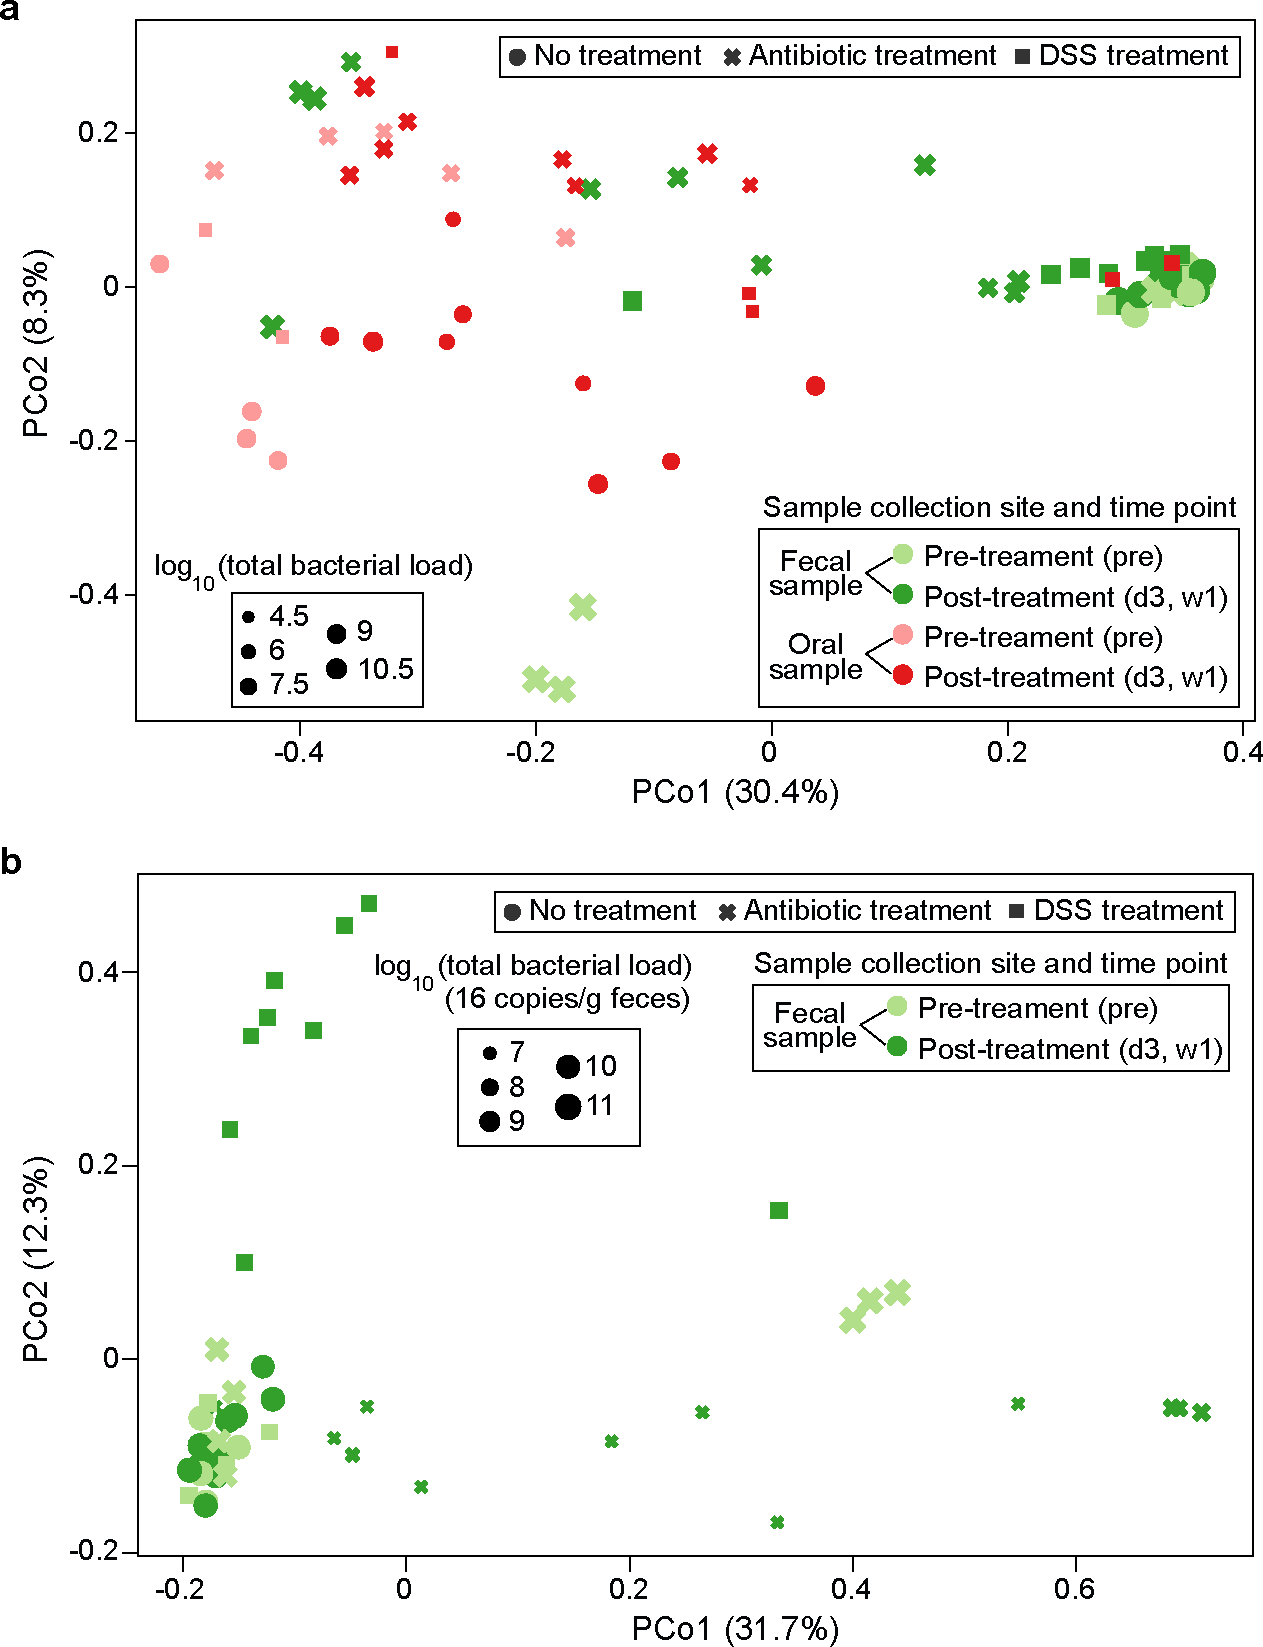
PCo1 and PCo2 represent principal component 1 and 2, respectively. a, Fecal and oral samples together. The unit of total bacterial load is 16S copies per gram of feces for fecal samples and 16S copies per swab for oral samples. b, Fecal samples only. Panel b shows that PCo1 captures the gut microbiota changes after antibiotic treatment, while PCo2 captures the gut microbiota changes after DSS treatment. DSS: Dextran Sulfate Sodium.
Extended Data Figure 4: Validation of oral bacterial ASVs identified from healthy individuals in patients with inflammatory bowel disease.
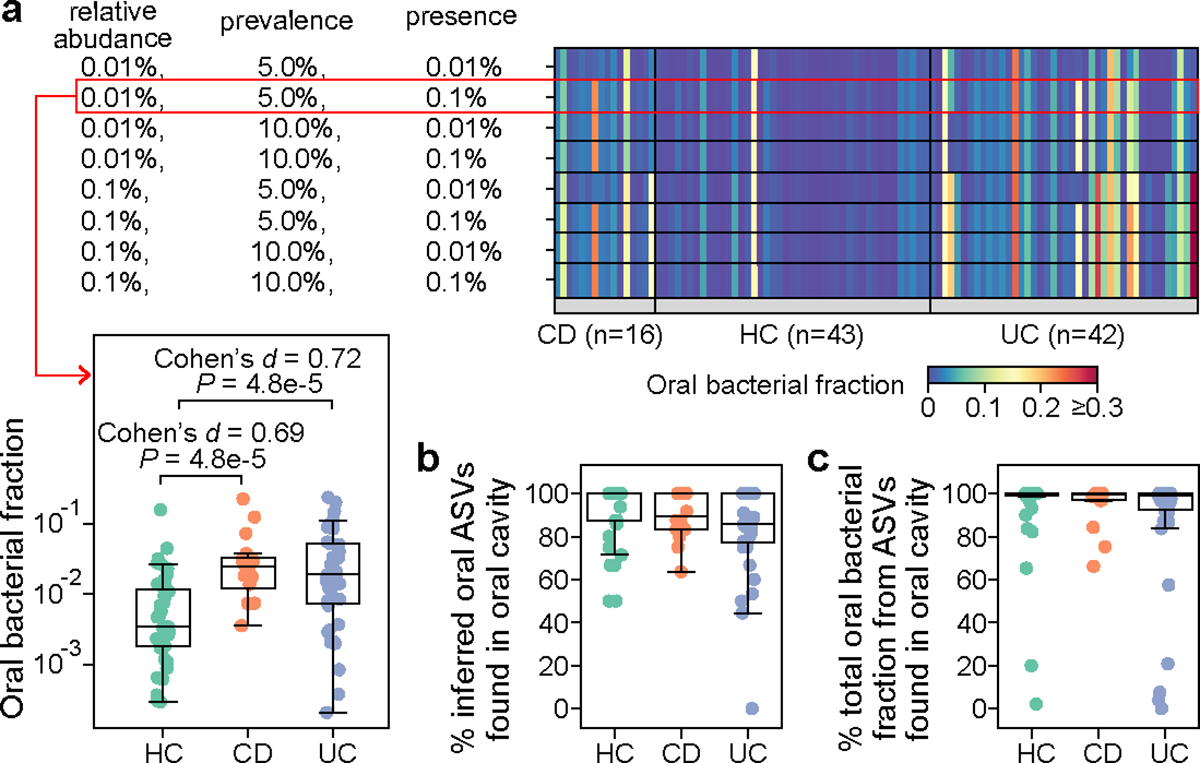
This cohort consists of 16 patients with Crohn’s disease (CD), 42 patients with ulcerative colitis (UC), and 43 healthy controls (HC). Notably, none of the participants had taken antibiotics within the last three months prior to the study entry. a, Impact of cutoff parameters on the estimated oral bacterial fraction in feces of these participants. We systematically varied cutoffs for the mean relative abundance (0.01%, 0.1%), prevalence (5%, 10%), and the definition of ASV presence (0.01%, 0.1%) in the computation of prevalence to establish the reference set of oral ASVs. For each reference set, oral ASVs in their feces were inferred through exact sequence matching. The default parameter combination used throughout the study is outlined in the red box. P values were calculated using a one-sided Mann-Whitney U test. b, Percentage of inferred oral ASVs in feces that are also found in paired saliva samples. c, Percentage of the total relative abundance of inferred oral ASVs in feces contributed by those found in paired saliva samples. Two HC samples with a zero oral bacterial fraction are not shown in all box plots. Box plots represent the median, 25th and 75th percentiles and whiskers represent the 95th and 5th percentiles.
Extended Data Figure 5: Validation of piperacillin-tazobactam’s effect on enriching oral bacteria in feces using an independent pediatric allo-HCT cohort.
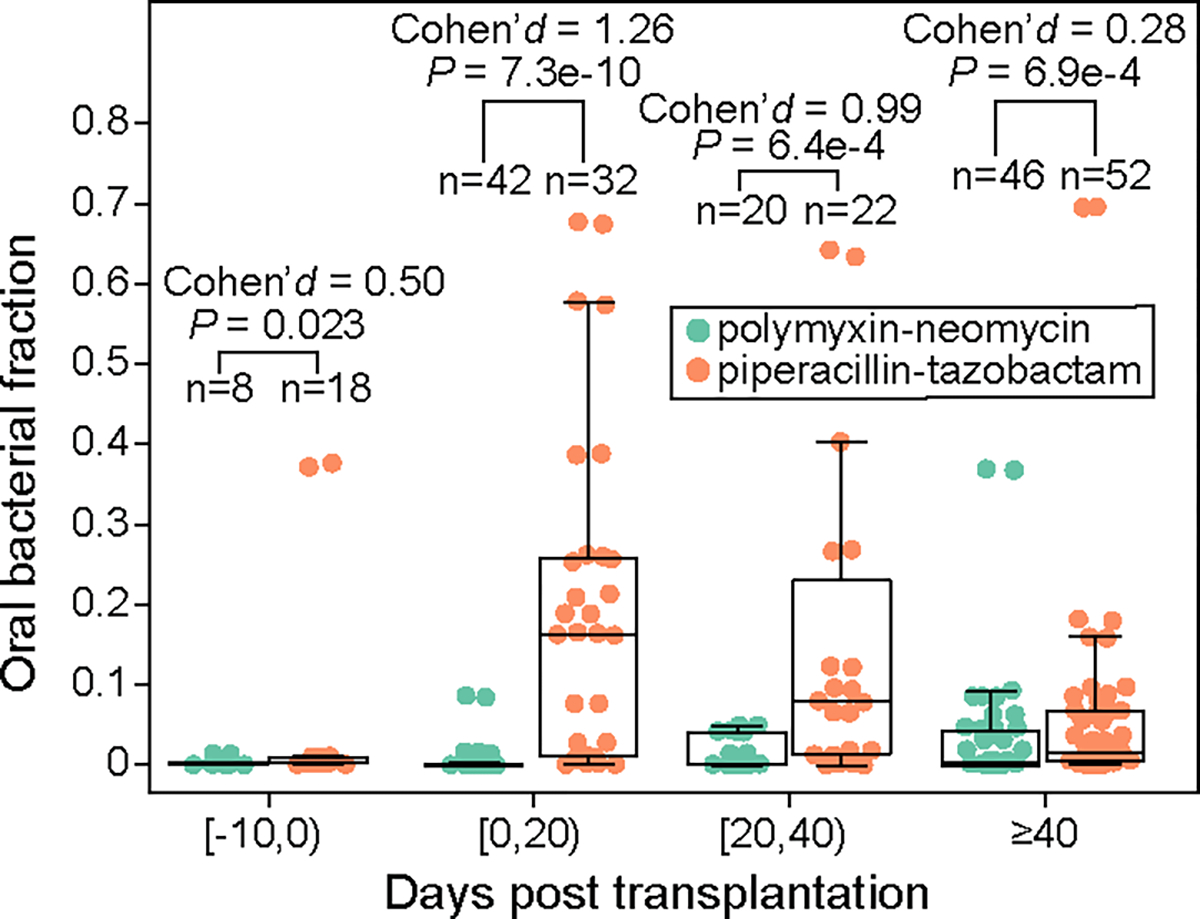
19 children (1–17 year old, 10.1 year old on average) were treated with either oral polymyxin-neomycin or oral piperacillin-tazobactam in the Leiden University Medical Center, Netherlands. Both medications were administered 10 days before transplantation until engraftment or 21 days after transplantation, whichever occurred later. Samples were grouped into four transplantation stages. FDR-corrected P values were calculated using a one-sided Mann-Whitney U test. Box plots represent the median, 25th and 75th percentiles and whiskers represent the 95th and 5th 148 percentiles.
Extended Data Figure 6: Inverse correlation between oral bacterial fraction and total bacterial load in fecal samples from MSKCC allo-HCT recipients.
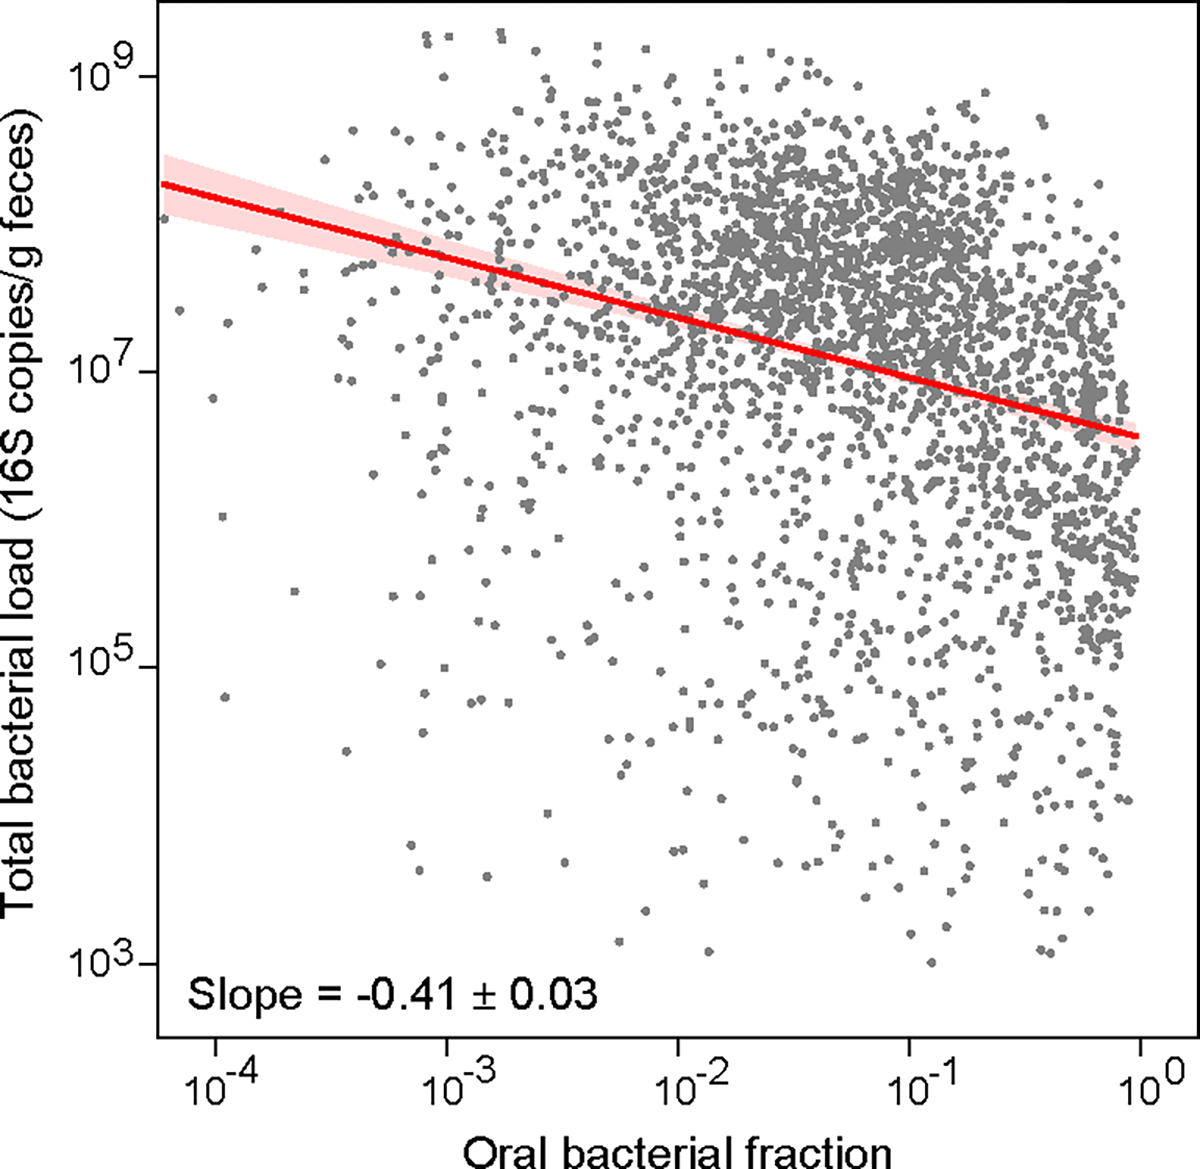
Each dot in the plot represents a fecal sample. Samples with zero oral bacterial fraction, or with total bacterial load less than 1,000 16S copies per gram of feces, or collected 20 days before or 40 days after transplantation were excluded from the plot and the linear regression analysis. The number of remaining samples is 2,524. The red line represents the best linear fit, and the shading of the same color indicates its ± 95% confidence interval. The plot also displays the estimated regression slope and its standard error.
Extended Data Figure 7: Impact of interindividual variability on the regression slope between oral bacterial fraction and total bacterial load.
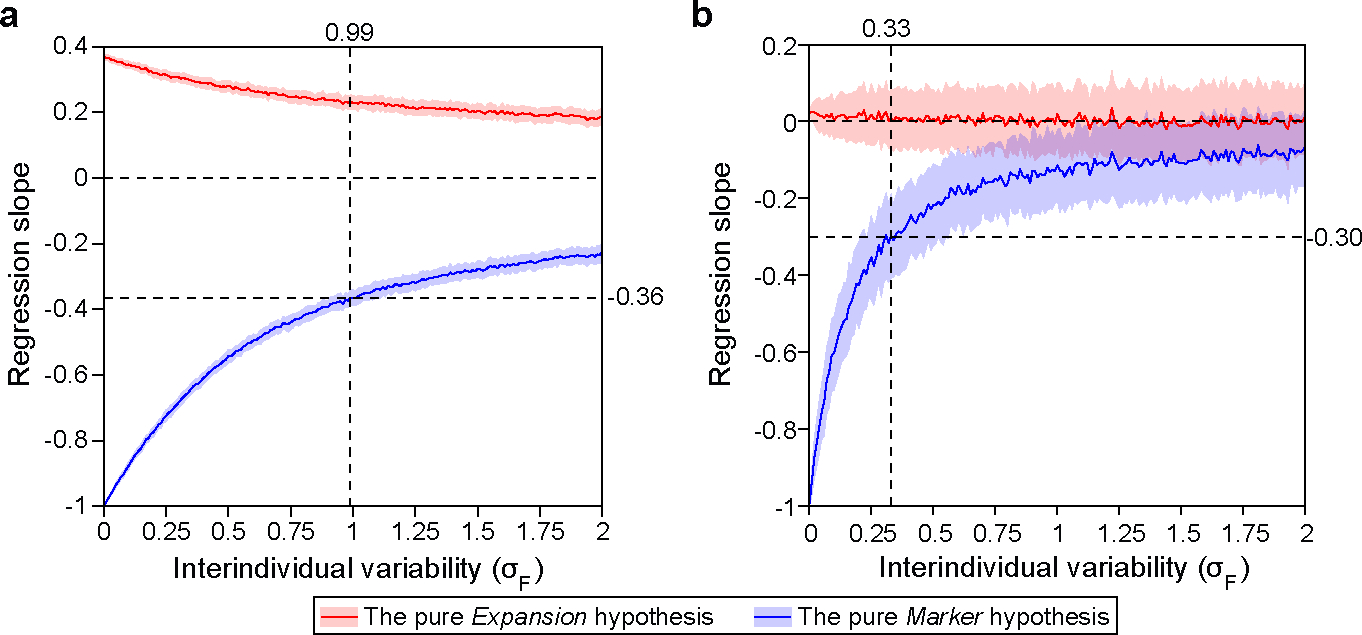
We generated synthetic datasets using parameters estimated from the MSKCC allo-HCT cohort analyzed in Fig. 4 (a) and the Crohn’s disease cohort analyzed in Fig. 5 (b). In both panels, we systematically varied (Eq. 1) from 0 to 2 while co-varying (Eq. 2) to maintain a constant ratio of . For each synthetic dataset, the regression slope was determined through linear regression between oral bacterial fraction and total bacterial load in the log-log space. The red and blue lines represent the mean slopes over 100 simulation runs, with the shaded regions of the same color indicating the standard deviations. Vertical dashed lines in the panel (a) and (b) mark the values estimated from the pre-antibiotic-prophylaxis samples in the allo-HCT cohort and from the healthy individuals in the Crohn’s disease cohort, respectively. At these values, the pure Marker hypothesis predicted that the regression slopes are −0.36 and −0.30. For detailed information on our simulation approach, please refer to the Methods section.
Extended Data Figure 8: Cross-validation accuracy for classifying total bacterial load in fecal samples from MSKCC allo-HCT recipients.
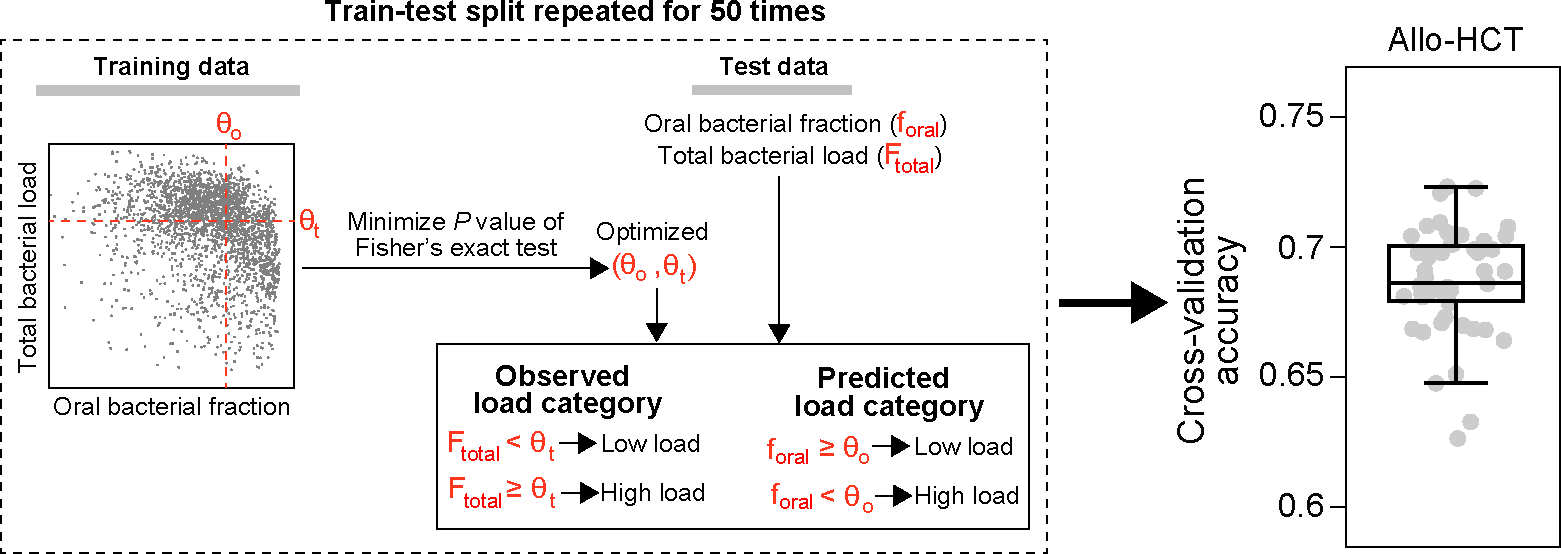
A schematic illustration of our classification model is enclosed in the dashed box. Our model uses two threshold parameters, and , to convert the oral bacterial fraction and total bacterial load into binary categories, respectively. Given training data, we optimized the two cutoff parameters by minimizing the P value of Fisher’s exact test of independence, subject to the constraints and . The optimized . was subsequently applied to predict high or low bacterial loads in the test set by comparing the oral bacterial fractions to . Simultaneously, we binarized the observed bacterial loads by comparing them to . Accuracy was assessed by comparing the predicted bacterial load categories to the observed bacterial load categories. In the boxplot, each dot corresponds to a single 5-fold cross-validation split and the random train-test split was repeated 50 times. Box plots represent the median, 25th and 75th percentiles and whiskers represent the 95th and 5th percentiles.
Extended Data Figure 9: Distribution of oral bacterial fraction in fecal samples from MSKCC allo-HCT recipients, categorized by stool consistency.
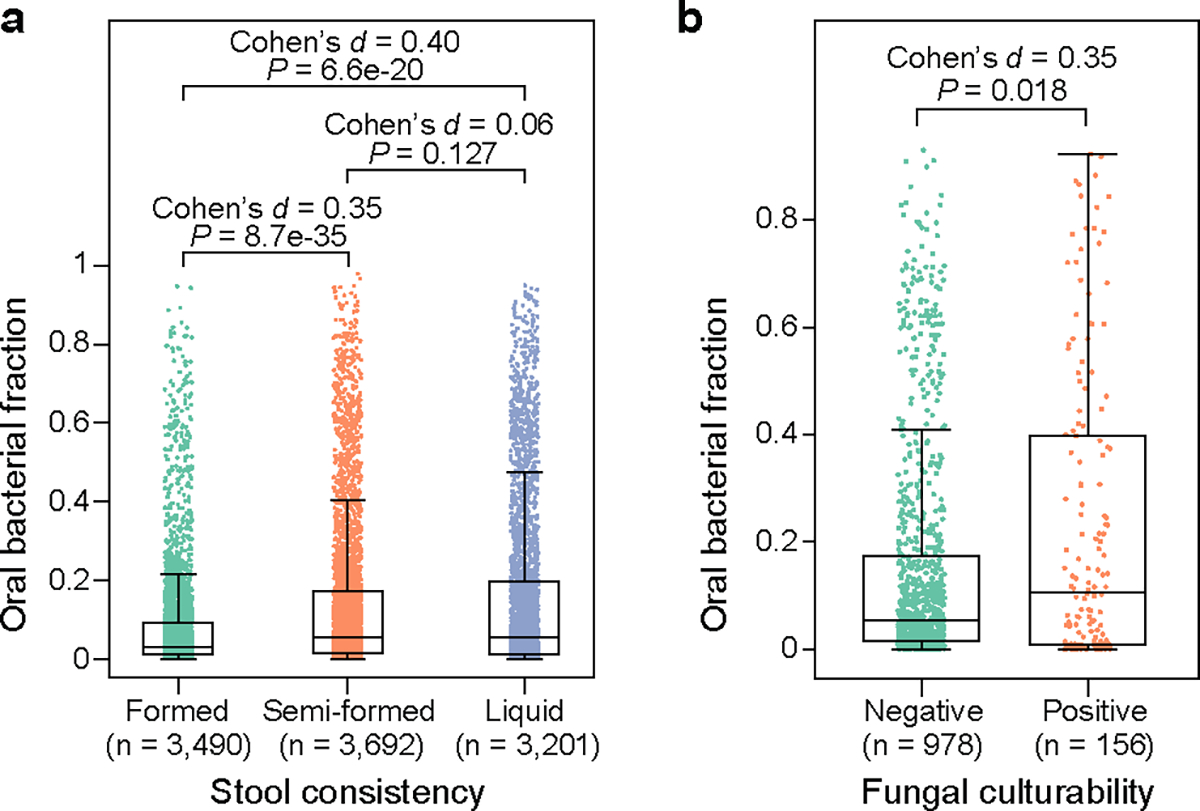
(a) and fungal cultivability (b). Each dot represents a fecal sample. FDR-corrected P values were calculated using a two-sided Mann-Whitney U test. Box plots represent the median, 25th and 75th percentiles and whiskers represent the 95th and 5th percentiles.
Extended Data Figure 10: Emergence of new oral ASVs in mouse feces after antibiotic treatment.
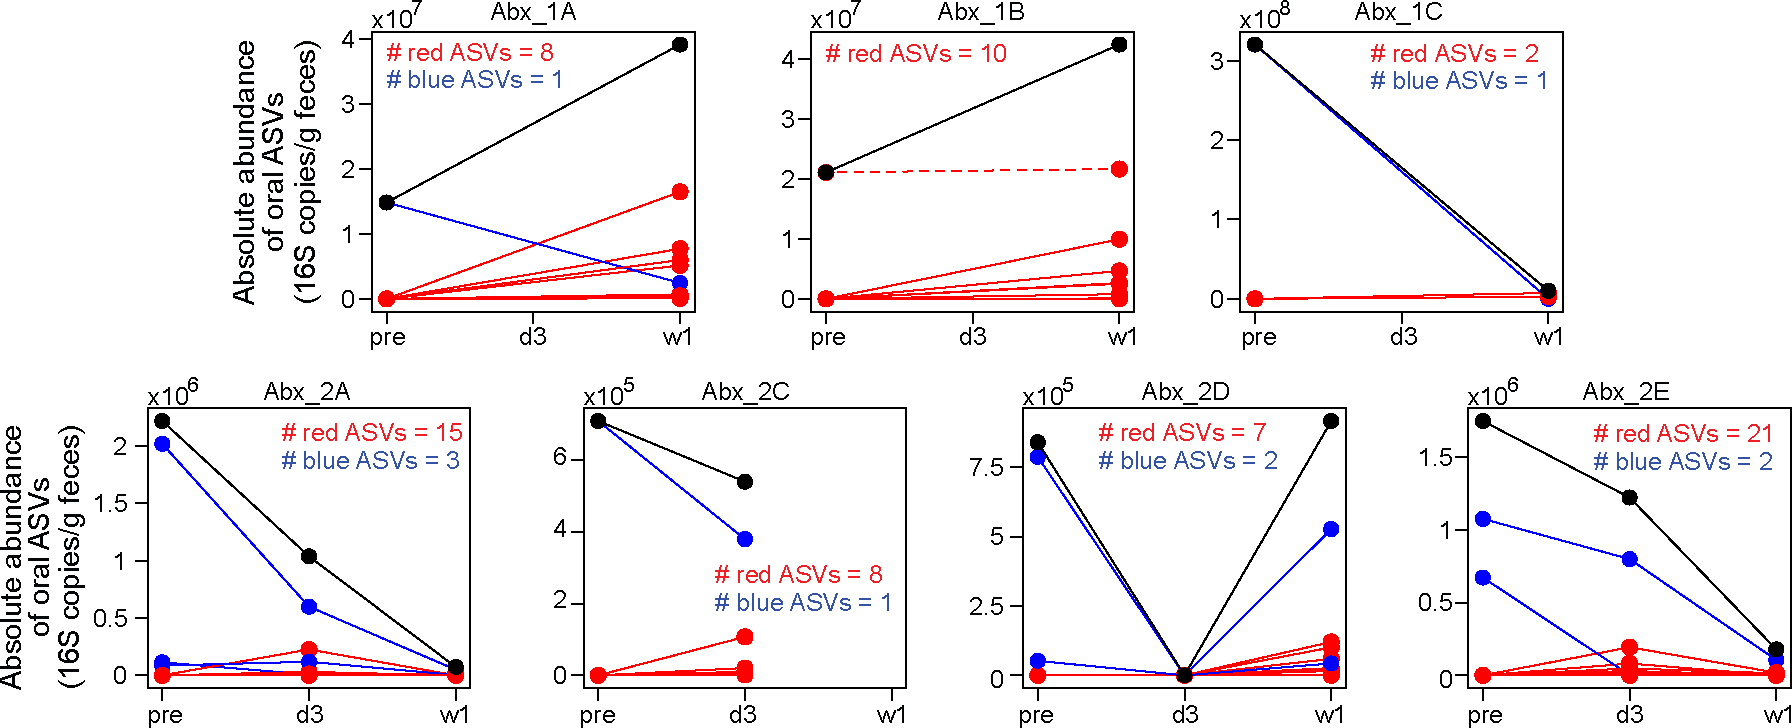
Each panel plots data from one mouse. Mouse Abx_2B was excluded due to the absence of its pre-treatment fecal sample. In each panel, individual oral ASVs are shown by lines. ASVs that increased in absolute abundance after treatment (i.e., post-treatment average > pre-treatment) are shown in red, while those that decreased or remained unchanged (post treatment average ≤ pre-treatment) are shown in blue. The black line in each panel represents the total absolute abundance, which is the sum of all red and blue lines. Except for one oral ASV in mouse Abx_1B (shown as a red dashed line), all ASVs displaying increased absolute abundance (solid red lines) were not present in the pre-treatment fecal samples; they represent new ASVs emerging from the oral cavity. Samples were collected at three time points: pre (before treatment), d3 (3 days after treatment initiation), and w1 (one week after treatment initiation).
Supplementary Material
Acknowledgments
This work was supported by National Institutes of Health (NIH) grant nos. U01 AI124275 (J.B.X.), R01 AI137269 (J.B.X.), R01 AI093808 (T.M.H.), and R21 AI156157 (T.M.H.). T.R. was funded by Deutsche Forschungsgemeinschaft (DFG, German Research Foundation) grant no. RO-5328/1-2 (T.R.).
Footnotes
Competing interests
J.U.P. reports research funding, intellectual property fees and travel reimbursement from Seres Therapeutics and consulting fees from DaVolterra, CSL Behring and from Maat Pharma. He serves on an Advisory board of and holds equity in Postbiotics Plus Research. He has filed intellectual property applications related to the microbiome (reference nos. 62/843,849, 62/977,908 and 15/756,845). M.R.M.v.d.B. has received research support from Seres Therapeutics; he has consulted, received honorarium from or participated in advisory boards for Seres Therapeutics, WindMIL Therapeutics, Rheos, Frazier Healthcare Partners, Nektar Therapeutics, Notch Therapeutics, Forty Seven Inc., Priothera, Ceramedix, Lygenesis, Pluto Immunotherapeutics, Magenta Therapeutics, Merck & Co., Inc. and DKMS Medical Council (Board); and he has IP Licensing with Seres Therapeutics, Juno Therapeutics and stock options from Seres and Notch Therapeutics. T.M.H. has participated in a scientific advisory board for Boehringer-Ingelheim Inc. T.R. is currently an employee of BioNTech SE. Memorial Sloan Kettering Cancer Center (MSKCC) has financial interests relative to Seres Therapeutics. The remaining authors declare no competing interests.
Code availability
Customized Python codes for reproducing the figures and tables are available on Github (https://github.com/liaochen1988/Oral_bacterial_manuscript_revision)
Data availability
A comprehensive list of the microbiome datasets used in this study, along with an indication of whether they contain quantitative data, is provided in Table S9. The raw 16S sequences of mouse fecal and oral samples collected in this study have been uploaded to Sequence Read Archive (SRA) with BioProject accession number PRJNA873058. All other microbiome datasets are publicly available. All processed data supporting the findings of this study are available within the article and its supplementary materials.
References
- 1.The Human Microbiome Project Consortium. Structure, function and diversity of the healthy human microbiome. Nature 486, 207–214 (2012). [DOI] [PMC free article] [PubMed] [Google Scholar]
- 2.Segata N, et al. Composition of the adult digestive tract bacterial microbiome based on seven mouth surfaces, tonsils, throat and stool samples. Genome Biol. 13, 1–18 (2012). [DOI] [PMC free article] [PubMed] [Google Scholar]
- 3.Atarashi K, et al. Ectopic colonization of oral bacteria in the intestine drives TH1 cell induction and inflammation. Science 358, 359–365 (2017). [DOI] [PMC free article] [PubMed] [Google Scholar]
- 4.Li B, et al. Oral bacteria colonize and compete with gut microbiota in gnotobiotic mice. Int. J. Oral Sci. 11, 1–9 (2019). [DOI] [PMC free article] [PubMed] [Google Scholar]
- 5.Kitamoto S, et al. The intermucosal connection between the mouth and gut in commensal pathobiont-driven colitis. Cell 182, 447–462. e414 (2020). [DOI] [PMC free article] [PubMed] [Google Scholar]
- 6.Kitamoto S, Nagao-Kitamoto H, Hein R, Schmidt T & Kamada N The bacterial connection between the oral cavity and the gut diseases. J. Dent. Res. 99, 1021–1029 (2020). [DOI] [PMC free article] [PubMed] [Google Scholar]
- 7.Jin S, Wetzel D & Schirmer M Deciphering mechanisms and implications of bacterial translocation in human health and disease. Curr. Opin. Microbiol. 67, 102147 (2022). [DOI] [PubMed] [Google Scholar]
- 8.Abed J, et al. Colon cancer-associated Fusobacterium nucleatum may originate from the oral cavity and reach colon tumors via the circulatory system. Front. Cell. Infect. Microbiol. 10, 400 (2020). [DOI] [PMC free article] [PubMed] [Google Scholar]
- 9.Schmidt TS, et al. Extensive transmission of microbes along the gastrointestinal tract. Elife 8, e42693 (2019). [DOI] [PMC free article] [PubMed] [Google Scholar]
- 10.Rashidi A, Ebadi M, Weisdorf DJ, Costalonga M & Staley C No evidence for colonization of oral bacteria in the distal gut in healthy adults. Proc. Natl. Acad. Sci. U.S.A. 118, e2114152118 (2021). [DOI] [PMC free article] [PubMed] [Google Scholar]
- 11.Gevers D, et al. The treatment-naive microbiome in new-onset Crohn’s disease. Cell Host Microbe 15, 382–392 (2014). [DOI] [PMC free article] [PubMed] [Google Scholar]
- 12.Schirmer M, et al. Compositional and temporal changes in the gut microbiome of pediatric ulcerative colitis patients are linked to disease course. Cell Host Microbe 24, 600–610. e604 (2018). [DOI] [PMC free article] [PubMed] [Google Scholar]
- 13.Priya S, et al. Identification of shared and disease-specific host gene–microbiome associations across human diseases using multi-omic integration. Nat. Microbiol, 1–16 (2022). [DOI] [PMC free article] [PubMed] [Google Scholar]
- 14.Kostic AD, et al. Fusobacterium nucleatum potentiates intestinal tumorigenesis and modulates the tumor-immune microenvironment. Cell host & microbe 14, 207–215 (2013). [DOI] [PMC free article] [PubMed] [Google Scholar]
- 15.Qin N, et al. Alterations of the human gut microbiome in liver cirrhosis. Nature 513, 59–64 (2014). [DOI] [PubMed] [Google Scholar]
- 16.Reikvam DH, et al. Depletion of murine intestinal microbiota: effects on gut mucosa and epithelial gene expression. PLoS One 6, e17996 (2011). [DOI] [PMC free article] [PubMed] [Google Scholar]
- 17.Taguer M, et al. Changes in Gut Bacterial Translation Occur before Symptom Onset and Dysbiosis in Dextran Sodium Sulfate-Induced Murine Colitis. mSystems 6, e00507–00521 (2021). [DOI] [PMC free article] [PubMed] [Google Scholar]
- 18.Shenhav L, et al. FEAST: fast expectation-maximization for microbial source tracking. Nat. Methods 16, 627–632 (2019). [DOI] [PMC free article] [PubMed] [Google Scholar]
- 19.Imai J, et al. A potential pathogenic association between periodontal disease and Crohn’s disease. JCI Insight 6(2021). [DOI] [PMC free article] [PubMed] [Google Scholar]
- 20.Liao C, et al. Compilation of longitudinal microbiota data and hospitalome from hematopoietic cell transplantation patients. Sci. Data 8, 1–12 (2021). [DOI] [PMC free article] [PubMed] [Google Scholar]
- 21.Bekker V, et al. Dynamics of the gut microbiota in children receiving selective or total gut decontamination treatment during hematopoietic stem cell transplantation. Biol. Blood Marrow Transplant. 25, 1164–1171 (2019). [DOI] [PubMed] [Google Scholar]
- 22.Yan J, et al. A compilation of fecal microbiome shotgun metagenomics from hematopoietic cell transplantation patients. Sci. Data 9, 1–11 (2022). [DOI] [PMC free article] [PubMed] [Google Scholar]
- 23.Read E, Curtis MA & Neves JF The role of oral bacteria in inflammatory bowel disease. Nat. Rev. Gastroenterol. Hepatol. 18, 731–742 (2021). [DOI] [PubMed] [Google Scholar]
- 24.Vandeputte D, et al. Quantitative microbiome profiling links gut community variation to microbial load. Nature 551, 507–511 (2017). [DOI] [PubMed] [Google Scholar]
- 25.Contijoch EJ, et al. Gut microbiota density influences host physiology and is shaped by host and microbial factors. Elife 8(2019). [DOI] [PMC free article] [PubMed] [Google Scholar]
- 26.Britton GJ, et al. Defined microbiota transplant restores Th17/RORγt+ regulatory T cell balance in mice colonized with inflammatory bowel disease microbiotas. Proceedings of the National Academy of Sciences 117, 21536–21545 (2020). [DOI] [PMC free article] [PubMed] [Google Scholar]
- 27.Zarrinpar A, et al. Antibiotic-induced microbiome depletion alters metabolic homeostasis by affecting gut signaling and colonic metabolism. Nat. Commun. 9, 1–13 (2018). [DOI] [PMC free article] [PubMed] [Google Scholar]
- 28.Vandeputte D, et al. Stool consistency is strongly associated with gut microbiota richness and composition, enterotypes and bacterial growth rates. Gut 65, 57–62 (2016). [DOI] [PMC free article] [PubMed] [Google Scholar]
- 29.Bedford A & Gong J Implications of butyrate and its derivatives for gut health and animal production. Anim. Nutr. 4, 151–159 (2018). [DOI] [PMC free article] [PubMed] [Google Scholar]
- 30.Zhai B, et al. High-resolution mycobiota analysis reveals dynamic intestinal translocation preceding invasive candidiasis. Nat. Med. 26, 59–64 (2020). [DOI] [PMC free article] [PubMed] [Google Scholar]
- 31.Stoma I, et al. Compositional flux within the intestinal microbiota and risk for bloodstream infection with gram-negative bacteria. Clinical Infectious Diseases 73, e4627–e4635 (2021). [DOI] [PMC free article] [PubMed] [Google Scholar]
- 32.Taur Y, et al. Intestinal domination and the risk of bacteremia in patients undergoing allogeneic hematopoietic stem cell transplantation. Clinical infectious diseases 55, 905–914 (2012). [DOI] [PMC free article] [PubMed] [Google Scholar]
- 33.Peled JU, et al. Microbiota as predictor of mortality in allogeneic hematopoietic-cell transplantation. N. Engl. J. Med. 382, 822–834 (2020). [DOI] [PMC free article] [PubMed] [Google Scholar]
- 34.Stein-Thoeringer C, et al. Lactose drives Enterococcus expansion to promote graft-versus-host disease. Science 366, 1143–1149 (2019). [DOI] [PMC free article] [PubMed] [Google Scholar]
- 35.Maghini DG, et al. Quantifying bias introduced by sample collection in relative and absolute microbiome measurements. Nat. Biotechnol, 1–11 (2023). [DOI] [PubMed] [Google Scholar]
- 36.Rojas-Tapias DF, et al. Inflammation-associated nitrate facilitates ectopic colonization of oral bacterium Veillonella parvula in the intestine. Nat. Microbiol, 1–13 (2022). [DOI] [PMC free article] [PubMed] [Google Scholar]
- 37.Sarrabayrouse G, et al. Fungal and bacterial loads: noninvasive inflammatory bowel disease biomarkers for the clinical setting. mSystems 6, 10.1128/msystems. 01277-01220 (2021). [DOI] [PMC free article] [PubMed] [Google Scholar]
- 38.Schmidt TS, et al. Drivers and determinants of strain dynamics following fecal microbiota transplantation. Nat. Med. 28, 1902–1912 (2022). [DOI] [PMC free article] [PubMed] [Google Scholar]
- 39.Abusleme L, et al. Oral microbiome characterization in murine models. Bio-protocol 7, e2655–e2655 (2017). [DOI] [PMC free article] [PubMed] [Google Scholar]
- 40.Taur Y, et al. Reconstitution of the gut microbiota of antibiotic-treated patients by autologous fecal microbiota transplant. Sci. Transl. Med. 10, eaap9489 (2018). [DOI] [PMC free article] [PubMed] [Google Scholar]
- 41.Djukovic A, et al. Lactobacillus supports Clostridiales to restrict gut colonization by multidrug-resistant Enterobacteriaceae. Nat. Commun. 13, 5617 (2022). [DOI] [PMC free article] [PubMed] [Google Scholar]
- 42.Quast C, et al. The SILVA ribosomal RNA gene database project: improved data processing and web-based tools. Nucleic Acids Res. 41, D590–D596 (2012). [DOI] [PMC free article] [PubMed] [Google Scholar]
- 43.Callahan BJ, et al. DADA2: High-resolution sample inference from Illumina amplicon data. Nat. Methods 13, 581–583 (2016). [DOI] [PMC free article] [PubMed] [Google Scholar]
- 44.Gonzalez A, et al. Qiita: rapid, web-enabled microbiome meta-analysis. Nat. Methods 15, 796–798 (2018). [DOI] [PMC free article] [PubMed] [Google Scholar]
- 45.Bolyen E, et al. Reproducible, interactive, scalable and extensible microbiome data science using QIIME 2. Nat. Biotechnol. 37, 852–857 (2019). [DOI] [PMC free article] [PubMed] [Google Scholar]
- 46.Bokulich NA, et al. Optimizing taxonomic classification of marker-gene amplicon sequences with QIIME 2’s q2-feature-classifier plugin. Microbiome 6, 1–17 (2018). [DOI] [PMC free article] [PubMed] [Google Scholar]
- 47.Martin M Cutadapt removes adapter sequences from high-throughput sequencing reads. EMBnet. journal 17, 10–12 (2011). [Google Scholar]
- 48.Pedregosa F, et al. Scikit-learn: Machine learning in Python. the Journal of machine Learning research 12, 2825–2830 (2011). [Google Scholar]
- 49.Thomas AM, et al. Metagenomic analysis of colorectal cancer datasets identifies cross-cohort microbial diagnostic signatures and a link with choline degradation. Nat. Med. 25, 667–678 (2019). [DOI] [PMC free article] [PubMed] [Google Scholar]
- 50.Machado D, et al. Polarization of microbial communities between competitive and cooperative metabolism. Nature ecology & evolution 5, 195–203 (2021). [DOI] [PMC free article] [PubMed] [Google Scholar]
- 51.Nguyen CL, et al. High-resolution analyses of associations between medications, microbiome, and mortality in cancer patients. Cell 186, 2705–2718. e2717 (2023). [DOI] [PMC free article] [PubMed] [Google Scholar]
- 52.Copelan E, et al. A scheme for defining cause of death and its application in the T cell depletion trial. Biol. Blood Marrow Transplant. 13, 1469–1476 (2007). [DOI] [PubMed] [Google Scholar]
- 53.Siranosian BA, et al. Rare transmission of commensal and pathogenic bacteria in the gut microbiome of hospitalized adults. Nat. Commun. 13, 1–17 (2022). [DOI] [PMC free article] [PubMed] [Google Scholar]
- 54.Li D, Liu C-M, Luo R, Sadakane K & Lam T-W MEGAHIT: an ultra-fast single-node solution for large and complex metagenomics assembly via succinct de Bruijn graph. Bioinformatics 31, 1674–1676 (2015). [DOI] [PubMed] [Google Scholar]
- 55.Kang DD, et al. MetaBAT 2: an adaptive binning algorithm for robust and efficient genome reconstruction from metagenome assemblies. PeerJ 7, e7359 (2019). [DOI] [PMC free article] [PubMed] [Google Scholar]
- 56.Alneberg J, et al. Binning metagenomic contigs by coverage and composition. Nat. Methods 11, 1144–1146 (2014). [DOI] [PubMed] [Google Scholar]
- 57.Sieber CM, et al. Recovery of genomes from metagenomes via a dereplication, aggregation and scoring strategy. Nat. Microbiol. 3, 836–843 (2018). [DOI] [PMC free article] [PubMed] [Google Scholar]
- 58.Wood DE, Lu J & Langmead B Improved metagenomic analysis with Kraken 2. Genome Biol. 20, 1–13 (2019). [DOI] [PMC free article] [PubMed] [Google Scholar]
- 59.Brown CT, Olm MR, Thomas BC & Banfield JF Measurement of bacterial replication rates in microbial communities. Nat. Biotechnol. 34, 1256–1263 (2016). [DOI] [PMC free article] [PubMed] [Google Scholar]
Associated Data
This section collects any data citations, data availability statements, or supplementary materials included in this article.
Supplementary Materials
Data Availability Statement
A comprehensive list of the microbiome datasets used in this study, along with an indication of whether they contain quantitative data, is provided in Table S9. The raw 16S sequences of mouse fecal and oral samples collected in this study have been uploaded to Sequence Read Archive (SRA) with BioProject accession number PRJNA873058. All other microbiome datasets are publicly available. All processed data supporting the findings of this study are available within the article and its supplementary materials.


