Abstract
Background:
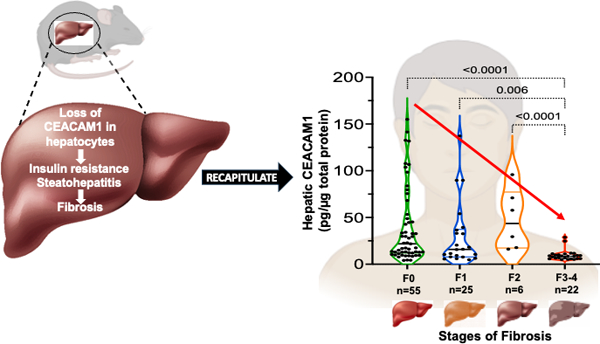
The role of insulin resistance in hepatic fibrosis in Metabolic dysfunction-Associated SteatoHepatitis (MASH) remains unclear. CEACAM1 promotes insulin clearance to maintain insulin sensitivity and repress de novo lipogenesis, as bolstered by the development of insulin resistance and steatohepatitis in AlbuminCre+Cc1fl/fl mice with liver-specific Ceacam1 deletion. We herein investigated whether these mice also developed hepatic fibrosis and whether hepatic CEACAM1 is reduced in patients with MASH at different fibrosis stages.
Methods:
AlbuminCre+Cc1fl/fl mice were fed a regular or a high-fat diet before their insulin metabolism and action were assessed during intraperitoneal glucose tolerance test, and their livers excised for histochemical, immunohistochemical and Western blot analysis. Sirius red staining was used to assess fibrosis, and media transfer was employed to examine whether mutant hepatocytes activated hepatic stellate cells (HSCs). Hepatic CEACAM1 protein levels in patients with varying disease stages were assessed by ELISA.
Results:
Hepatocytic deletion of Ceacam1 caused hyperinsulinemia-driven insulin resistance emanating from reduced hepatic insulin clearance. AlbuminCre+Cc1fl/fl livers showed inflammation, fibrosis and hepatic injury, with more advanced bridging and chicken-wire hepatic fibrosis under high-fat conditions. Media transferred from hepatocytes isolated from mutant mice activated control HSCs, likely owing to their elevated endothelin-1 content. Interestingly, hepatic CEACAM1 levels were lower in the livers of patients with MASH and declined gradually with advanced fibrosis stage.
Conclusions:
Hepatic CEACAM1 levels declined with progression of MASH in humans. The phenotype of AlbuminCre+Cc1fl/fl mice assigned a key role to CEACAM1 loss from hepatocytes in hepatic fibrosis independently of other liver cells.
Keywords: insulin extraction, insulin resistance, hepatic stellate cells, steatohepatitis, fibrosis stage
Graphical Abstract
1. INTRODUCTION
Metabolic dysfunction-Associated Steatotic Liver Disease (MASLD), previously known as non-alcoholic fatty liver disease, is a heterogenous disease ranging from hepatic steatosis to steatohepatitis, fibrosis and apoptosis (MASH-Metabolic dysfunction-Associated SteatoHepatitis, previously known as NASH). Its global incidence has risen in parallel to increased obesity, although some patients are not obese.1 Whether hepatic insulin resistance is implicated in hepatic fibrosis/injury remains debatable in spite of the documented reversal effect of insulin sensitizers and incretins on these pathologies.2
When phosphorylated by the insulin receptor, CarcinoEmbryonic Antigen-related Cell Adhesion Molecule 1 (CEACAM1) partakes in the insulin-receptor complex to induce the rate of insulin’s endocytosis in hepatocytes and targeting to degradation. This promotes hepatic insulin clearance3 and binding of CEACAM1 to fatty acid synthase (FASN) to mediate repression of its enzymatic activity in response to incoming insulin pulses in the portal vein.4 Consistently, mice with liver-specific Ceacam1 deletion (AlbCre+Cc1fl/fl) develop impaired hepatic insulin extraction with resultant chronic hyperinsulinemia at 2 months of age. This is followed by hepatic insulin resistance at 6–7 months with elevated FASN expression owing to increased hyperinsulinemia-induced SREBP-1c transcriptional activity.5 Subsequently, hepatic lipid production increases followed by its redistribution to adipose tissue to increase visceral obesity and release of lipolysis-derived non-esterified fatty acids (NEFA) at 9 months of age.5 The phenotype of AlbCre+Cc1fl/fl demonstrates that reduced insulin clearance can cause hyperinsulinemia-driven hepatic insulin resistance with steatohepatitis and visceral obesity. It also shows that hepatic insulin resistance can precede NEFA release and is not simply a consequence thereof.
Mice with global Ceacam1 null deletion (Cc1–/–) phenocopy AlbCre+Cc1fl/fl mutants insofar as the disease begins with reduced insulin clearance at 2 months of age. In contrast to AlbCre+Cc1fl/fl mutants, Cc1–/–nulls develop hepatic insulin resistance together with visceral obesity and elevated lipolysis-derived NEFA release at 6 months.6 At this age, they manifest spontaneous pericellular hepatic fibrosis.7 Given the key role that NEFA plays in MASH,8 hepatic fibrosis in global Cc1–/– nulls was hypothesized to be secondary to their elevated NEFA levels. However, blocking lipolysis with nicotinic acid did not prevent hepatic fibrosis in Cc1–/–,7 emphasizing the primary role of CEACAM1 loss in their hepatic fibrosis.
Hepatic fibrosis emanates from excessive collagen production in activated myofibroblastic hepatic stellate cells (HSCs). The latter can result from injured hepatocytes or endothelial cells. Endothelial loss of Ceacam1 causes hepatic fibrosis in the absence of insulin resistance or hepatic steatosis.9 In humans, the level of endothelial CEACAM1 progressively decreases with advanced fibrosis stage.9 Thus, we herein investigated whether AlbCre+Cc1fl/fl mutants with hepatocytes-specific loss of Ceacam1 develop hepatic fibrosis independently of other hepatic cells.
2. METHODS
2.1. Mice
The generation of AlbuminCre+Cc1fl/fl (AlbCre+Cc1fl/fl or Alb+Cc1fl/fl.C57BL/6J) mice with loss of Ceacam1 primarily in hepatocytes has been reported.5 Per approved institutional protocols, male mutants with their Floxed AlbCre– Cc1fl/fl (AlbCre–Cc1fl/fl) controls were kept in a 12-h dark/light cycle and fed ad-libitum either a standard chow (RD) for 8 months or a 45% high-fat (HF) diet (Research Diets, D12451, New Brunswick, NJ) for 3 months starting at 5 months of age.
2.2. Metabolic phenotyping
Metabolic phenotyping was conducted on male mice kept in cages with Alpha-dri bedding (Shepherd Specialty Papers) for 1–2 days. To assess biochemical parameters, retro-orbital venous blood was drawn after 18h fasting into heparinized micro-hematocrit capillary tubes (22–362566, Fisherbrand, Waltham, MA), and liver excised to determine hepatic triacylglycerol as previously described.5 Plasma was analyzed by ELISA for insulin and C-peptide (ALPCO, Salem, NH) and endothelin-1 (Abcam, Cambridge, MA). NEFA (Wako, Richmond, VA) and triacylglycerol (Pointe Scientific, Canton, MI) were assayed by enzymatic colorimetric assays.
2.3. Insulin metabolism and action
Overnight-fasted mice were anaesthetized with pentobarbital (1.1mg/kg body weight) before receiving an intraperitoneal dextrose injection of 3g/kg BW of 50% Dextrose, USP (Hospira Inc. Lake Forest, IL). Retro-orbital blood was drawn at 0, 30,120min post-injection to measure blood glucose, insulin and C-peptide levels during intraperitoneal glucose tolerance test (IPGTT). Hepatic insulin clearance was measured as the ratio of the area under the curve (AUC) (calculated by the trapezoid method) of C-peptide/Insulin during IPGTT time points.10 Insulin secretion was assessed as a ratio of AUC of insulin from 0–30min over the corresponding AUC for glucose (AUC-Ins30/AUC-Glu30),11 and Insulin Sensitivity Index (ISI) was calculated by the Matsuda method since few IPGTT time points were used.12
2.4. Liver histology in mice
Livers were sectioned, formalin-fixed paraffin-embedded (FFPE) and stained with hematoxylin-eosin (H&E) for assessing NAFLD activity score (NAS), as described.13 To assess fibrosis, deparaffinized and rehydrated slides were stained with 0.1% Sirius Red stain (Direct Red 80, Sigma-Aldrich, St Louis, MO) and imaged by Nikon Eclipse 90i Microscope (Nikon, Melville, NY), as described.9
For immunohistochemical analysis, FFPE sections were deparaffinized in xylene, progressively rehydrated in alcohol gradient before quenching peroxidases with 3% H2O2 and . heat-induced antigen-retrieval using 10mM sodium citrate buffer (pH 6.0) or Tris-buffer (pH 10.0), per antibody requirement. The Abcam antibodies [α-CD68 (1:150), Mac2 (1:250), MPO (1:1000), CD4 (1:1000), CD8 (1:2000), and α-Ki67 (1:100, monoclonal)] and α-Cleaved Caspase 3 (1:200, Cell Signaling, Danvers, MA) were used. This was followed by blotting with ImmPRESS HRP horse anti-mouse or anti-rabbit (Vector labs, Newark, CA) for 30min before being treated with 3,3’-Diaminobenzidine (DAB, Vector labs) and hematoxylin counterstain (Vector labs). Sections were evaluated blindly and positively stained cells were counted in 5 fields/mouse at 40X magnification.
2.5. Primary cell isolation and media transfer
Primary hepatocytes3 and liver sinusoidal endothelial cells (LSEC)9 were isolated from ketamine/xylazine-anesthetized 2-to-3–month-old mice, and hepatic stellate cells (HSCs) from 8-month-old mice and incubated at 37°C/5%CO2.9
LSEC were incubated in EBM2 media-15% fetal bovine serum (FBS), 0.04% glutamine, and bullet kit (Cambrex, Lonza Biosciences, Walkersville, MD).
Hepatocytes were maintained in DMEM (Gibco Lab, Gaithersburg, MD)-10% FBS, 1% glutamine, and 1% penicillin/streptomycin (Gibco). HSCs from controls were incubated in 6-well plates in DMEM with 10% FBS, 0.04% gentamycin, 1% antibiotic/antimycotic (Gibco) at 50–60% confluence. Media were collected and cells washed with PBS (Gibco) before re-incubation for 24h in the collected regular media or in conditioned media from hepatocytes isolated from control or mutant mice.
2.6. Western blot analysis
Liver lysates from mice were analyzed by SDS PAGE followed by immunoprobing with antibodies against phosphoSmad2 (Ser465/467-1:1000), phosphoStat3 (Y705-1:1000), phosphoNF-κB (S536-1:500) and CHOP (L63F7-1:1000) (Cell Signaling). To normalize per total proteins loaded, proteins were analyzed on parallel gels and probed with polyclonal antibodies against α-tubulin monoclonal antibody, α-Smad2, α-Stat3 and α-NF-κB (Cell Signaling). Blots were incubated with horseradish peroxidase-conjugated donkey anti-rabbit IgG or anti-mouse IgG antibody (GE Healthcare Life Sciences, Chicago, IL) and detected by Enhanced Chemiluminiscent Substrate (Thermo Scientific, Rockford, IL).
2.7. Quantitative real-time-PCR (qRT-PCR) analysis
Total RNA was isolated with NucleoSpin RNA, Mini kit (MACHEREY-NAGEL Inc. Allentown, PA). cDNA was synthesized by iScript cDNA Synthesis Kit (Bio-Rad), using 1μg of total RNA and oligodT primers. cDNA was evaluated with qRT-PCR (StepOne Plus, Applied Biosystems, Foster City, CA), and mRNA was normalized against 18s.
2.8. Statistical analysis
Data were analyzed using one-way ANOVA analysis with Bonferroni correction or two-tailed Student t-test using GraphPad Prism6 software and presented as mean±SEM. P<0.05 was considered statistically significant.
2.9. Evaluation of clinical human liver biopsies
Routine standard of care human liver tissue biopsies were obtained from adult male and female patients undergoing bariatric surgery, orthotopic liver transplantation with a MASH diagnosis or from donor livers not placed for transplantation. Research was conducted in accordance with the Declarations of Helsinki and Istanbul, and was approved by IRB-protocols (201700650 and 201900298) at the University of Florida. Subjects were provided consent between August 2018 and December 2021 (Table S2). Neither patients nor the public were involved in the design, conduct, reporting, or dissemination plans of the research. Tissue samples were deidentified after collection and prior to analysis. Biopsies were split and either immediately flash frozen and stored at −80oC or stored in 10% buffered formalin for 24h, paraffin embedded (FFPE), sectioned and then processed for regular histological evaluation by two blinded clinical pathologists. Histology assessment of MASLD/MASH stage of disease severity was performed according to the Nonalcoholic Steatohepatitis Clinical Research Network Scoring System, including a detailed fibrosis grading.13 Flash frozen biopsies were homogenized with PBS+0.3% NP-40 (v/v), including protease inhibitors and protein extracted by centrifugation. Homogenate supernatants were diluted and CEACAM1 protein levels were assessed with Human CEACAM1/CD66a according to manufacturer’s instructions [DuoSet ELISA kits (R&D Systems, Minneapolis, CA)].
3. RESULTS
3.1. Compromised hepatic insulin clearance and insulin action in AlbCre+Cc1fl/fl mice
As previously reported,5 8-month-old AlbCre+Cc1fl/fl mice exhibited elevated body weight, visceral adiposity and plasma NEFA levels compared to their control counterparts (Table 1). Whereas HF feeding induced body weight and visceral obesity in mutants and controls, it did not affect NEFA levels in mutants, but it differentially increased their liver weights (Table 1).
TABLE 1.
Serum and tissue biochemistry
| RD Alb–Cc1fl/fl |
HFD Alb–Cc1fl/fl |
RD Alb+Cc1fl/fl |
HFD Alb+Cc1fl/fl |
|
|---|---|---|---|---|
| Body Weight (g) | 30.3 ± 0.6 | 40.6 ± 1.6§ | 35.0 ± 1.3* | 49.2 ± 0.7*§ |
| % Liver/BW | 4.4 ± 0.3 | 3.4 ± 0.2 | 4.5 ± 0.4 | 5.4 ± 0.2*§ |
| % WAT/BW | 1.7 ± 0.2 | 5.6 ± 0.3§ | 2.8 ± 0.1* | 7.5 ± 1.8*§ |
| NEFA (mEq/L) | 0.5 ± 0.0 | 0.9 ± 0.1§ | 0.7 ± 0.1* | 0.8 ± 0.1 |
| Insulin (pmol/L) | 31.6 ± 1.8 | 55.9 ± 6.1§ | 45.5 ± 1.3* | 103.2 ± 9.4*§ |
| C-peptide (pmol/L) | 370. ± 91. | 521. ± 174§ | 534. ± 187. | 1246. ± 120*§ |
| C/I molar ratio | 14.5 ± 1.5 | 9.5 ± 1.2§ | 8.8 ± 1.2* | 11.3 ± 0.6 |
| Triacylglycerol (mg/dL) | 55.1 ± 7.2 | 56.6 ± 11.0 | 53.5 ± 6.4 | 78.1 ± 12.6 |
| Hepatic TG (μg/mg) | 65.2 ± 6.2 | 218.7 ± 41.5§ | 97.8 ± 11.5* | 430.0 ± 90.1*§ |
Male mice were fed HFD or kept on RD for 3 months starting at 5 months of age (n=5/genotype/feeding group). Mice were fasted from 5:00 p.m. until 11:00 a.m. the next morning before blood was drawn and tissues were excised. Except for blood glucose and tissues, values (mean±SEM) refer to serum levels.
P<0.5 Alb+Cc1fl/fl vs Alb–Cc1fl/fl per each feeding group;
P<0.05 HFD vs RD/genotype, %WAT/BW denotes visceral adiposity; steady-state C/I molar ratio denotes C-peptide/Insulin molar ratio as a measure of basal insulin clearance; TG denotes triacylglycerol; hepatic TG was measured in μg/mg protein.
As expected,5 AlbCre+Cc1fl/fl mice also exhibited chronic hyperinsulinemia resulting mainly from reduced hepatic insulin clearance (Table 1-lower steady-state C-peptide/insulin molar ratio relative to controls). HFD repressed insulin clearance in control mice, but not in mutants (Table 1). To further assess insulin clearance, blood glucose and plasma insulin and C-peptide levels were measured at 0–120 min post-intraperitoneal glucose injection (Figure 1A–C). As Figure 1A shows, liver-specific Ceacam1 deletion adversely affected glucose tolerance under both RD and HFD feeding conditions despite higher insulin levels (Figure 1B). C-peptide excursion was normal in RD-fed mutant mice (Figure 1C), supporting normal insulin secretion (Figure 1E- unchanged AUC-Ins30/AUC-Glu30 from 0–30 min). Accordingly, AlbCre+Cc1fl/fl mutants exhibited comparable fasting blood glucose levels relative to controls under both feeding conditions (Figure 1D).
FIGURE 1.
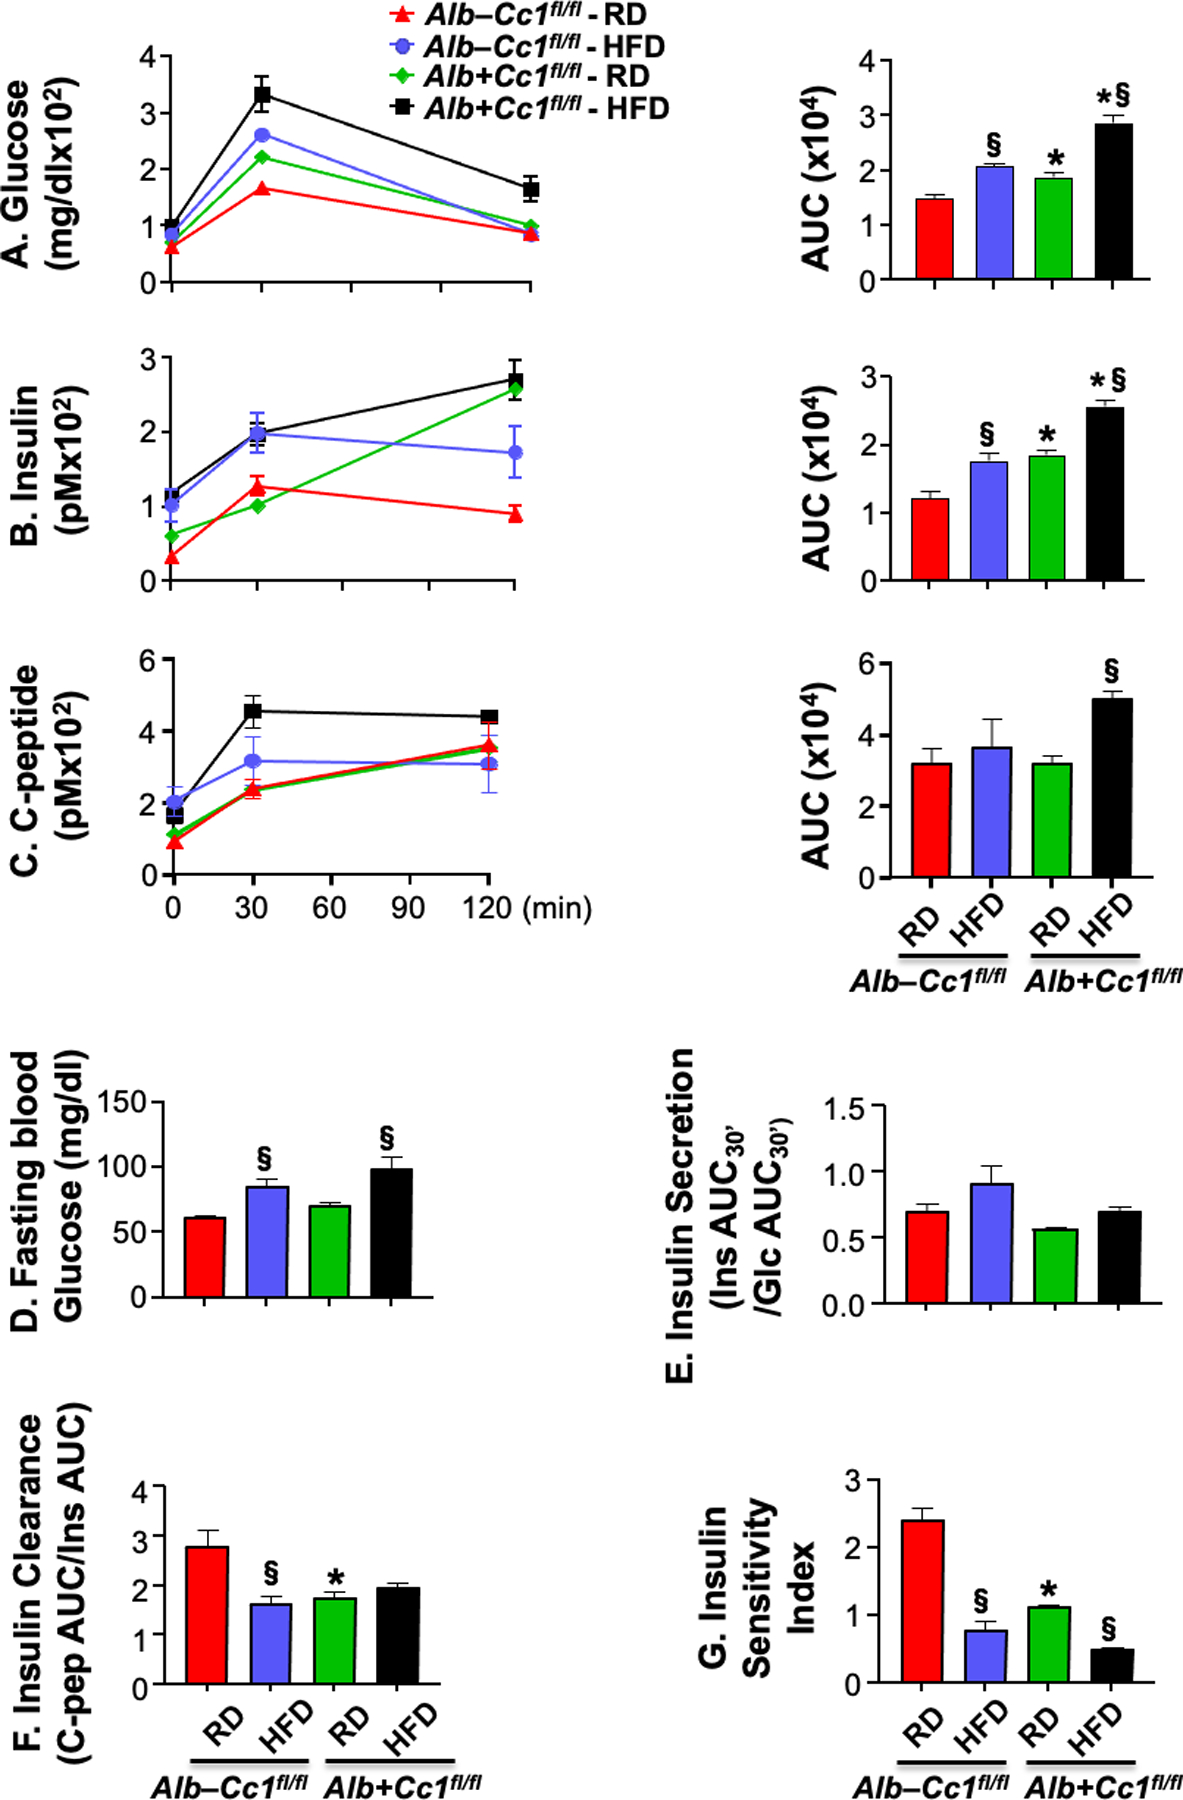
Insulin metabolism during IPGTT. (A-C) glucose, insulin and C-peptide levels were measured at 0, 30 and 120 min post i.p. injection of glucose in age-matched 8-month-old mice fed with a regular diet [RD, red (control) and green (mutant) bars] or a high-fat diet [HFD, blue (control) and black (mutant) bars] in the last 3 months before sacrifice (n=3–4/genotype/feeding group). Accompanying graphs represent area under the curve (AUC). (D) fasting blood glucose, (E) insulin secretion (Ratio of Insulin AUC at 0–30 min/Glucose AUC at 0–30 min), (F) insulin clearance (C-peptide AUC/Insulin AUC) and (G) Insulin Sensitivity Index were also measured. Values were expressed as means ± SEM. *P<0.05 Alb+Cc1fl/fl vs Alb–Cc1fl/fl per feeding group; §P<0.05 HFD vs RD per genotype.
Insulin clearance, assessed by the ratio of AUC of C-peptide/Insulin during IPGTT, was ~2-fold lower in RD-fed mutants than controls (Figure 1F). Whereas HFD significantly lowered insulin clearance in control mice, likely to contribute to the compensatory response to insulin resistance (see below), it did not cause further reduction in hepatic insulin clearance in mutant mice, similarly to steady-state insulin clearance (Table 1). In the absence of significant changes in insulin secretion, the higher basal hyperinsulinemia and insulin accumulation in mutants at the late time points post-glucose injection under both feeding conditions (Figure 1B) were likely caused by impaired hepatic insulin clearance.
Glucose intolerance caused by liver-specific Ceacam1 deletion was accompanied by insulin resistance, as assessed by the lower insulin sensitivity index in RD-fed mutants relative to their controls (Figure 1G). HF consumption lowered insulin sensitivity in both strains of mice (Figure 1G).
3.2. Elevated hepatic steatosis and inflammation in AlbCre+Cc1fl/fl mice
As Table 1 shows, hepatic triacylglycerol levels were higher in RD-fed AlbCre+Cc1fl/fl than controls, and HFD caused a substantial increase in fat accumulation in both strains leading to ~2-fold higher fat accumulation in AlbCre+Cc1fl/fl livers than controls (Table 1). As previously reported,5 H&E staining of liver sections of 8-month-old RD-fed AlbCre+Cc1fl/fl mice showed diffused micro- and macro-vesicular fat deposition across the liver parenchyma unlike their AlbCre–Cc1fl/fl controls (Figure 2A and accompanying graph b vs a). HFD amplified predominantly micro-vesicular deposition in controls as opposed to macro-vesicular deposition in mutants (Figure 2A and graph c and d, respectively).
FIGURE 2.
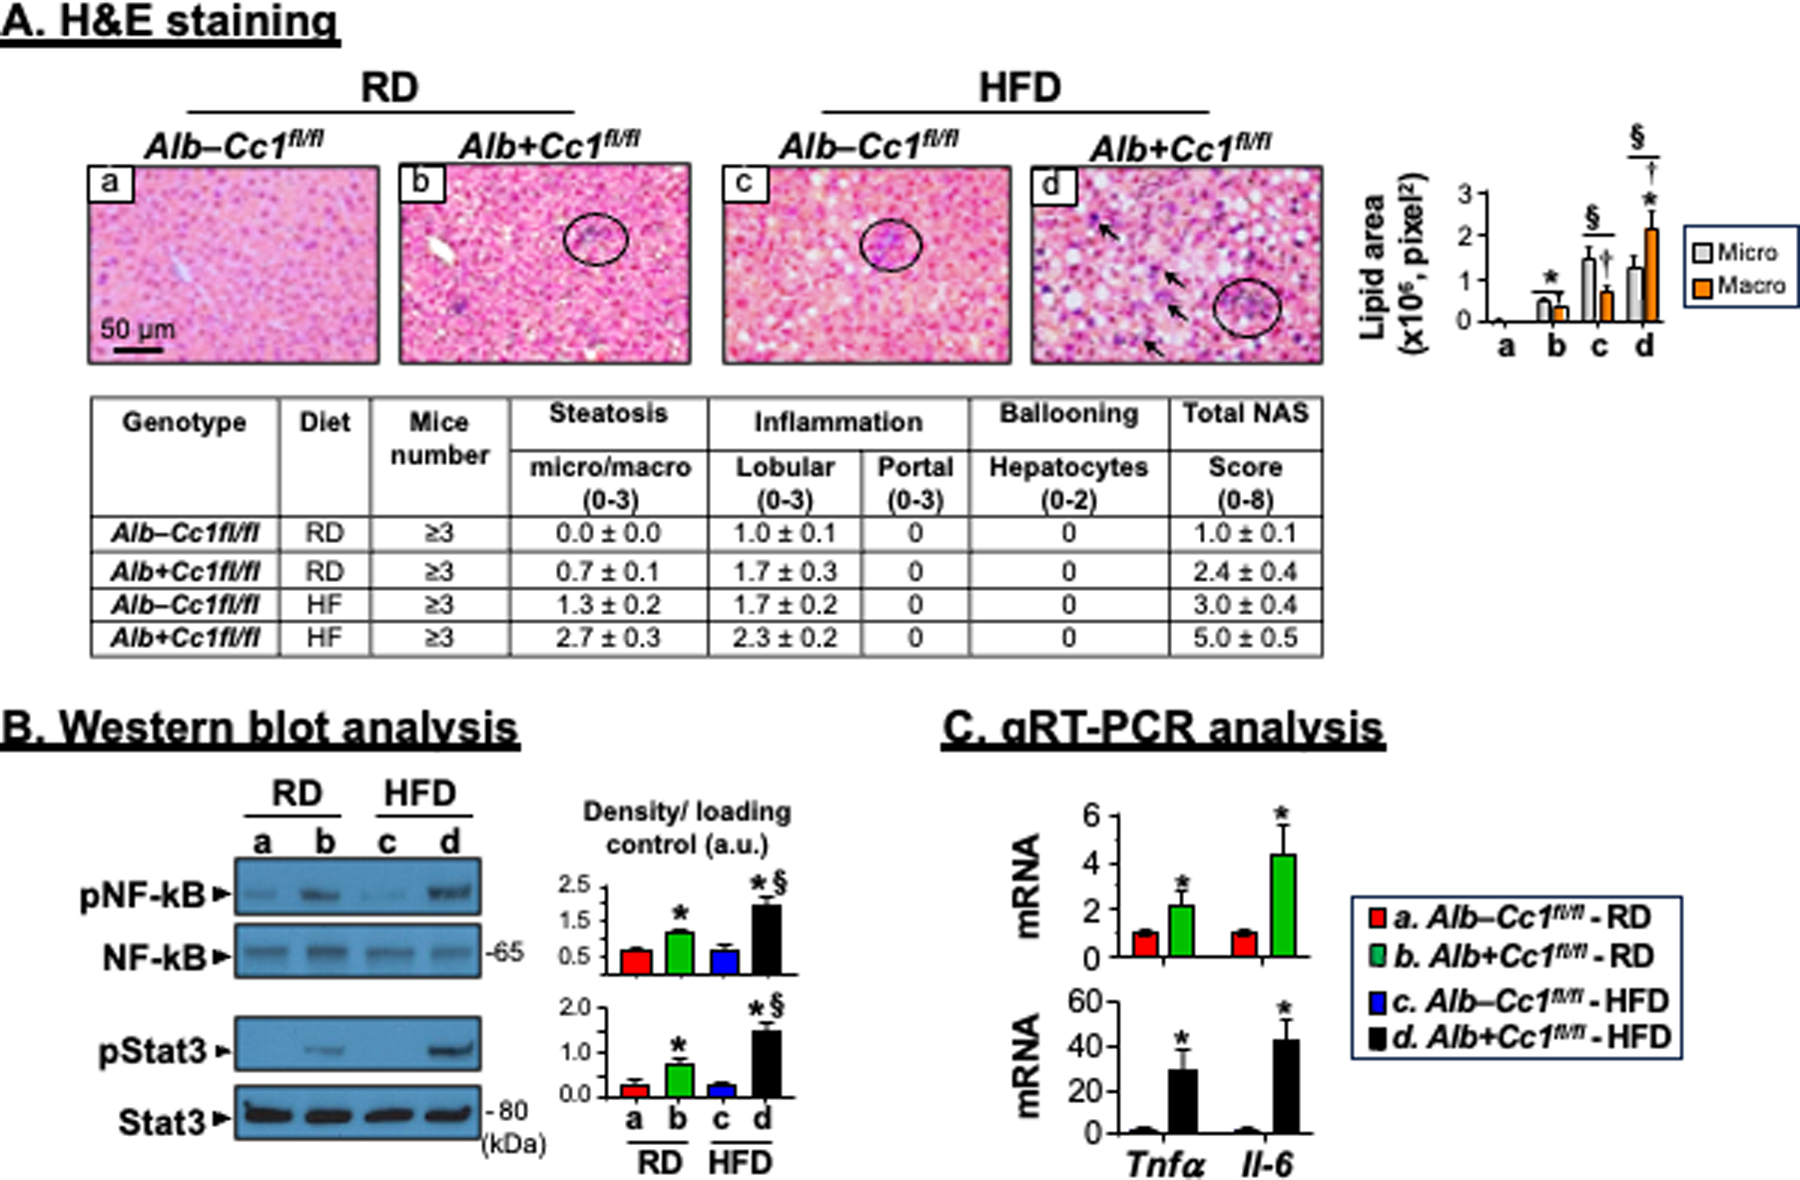
Histological and biochemical analysis of inflammation. Livers were removed from 8-month-old mice following feeding either a regular chow (RD) diet or a HFD diet for 3 months. (A) H&E staining of liver sections to identify foci of inflammatory cell infiltrates. Accompanying table represents NAS (n=3–6 mice/genotype/feeding group). Scoring was performed independently by 2–3 different scientists based on NIH guidelines. In the accompanying graph, the areas of lipid vesicles were assessed using Image J (v1.53t) in 5 fields/mouse at 20X magnification and means ± SEM in pixel2 unit were presented. *P<0.05 Alb+Cc1fl/fl vs Alb–Cc1fl/fl per feeding group; §P<0.05 HFD vs RD per genotype; †P<0.05 macrovesicles vs microvesicles per genotype. (B) Western blot analysis was performed on liver lysates from randomly picked 2 mice/genotype/feeding group. Representative gels indicate the activation (phosphorylation) of NF-κB and Stat3 inflammatory pathways using phospho-antibodies normalized against total NF-κB and Stat3 loaded proteins, respectively. Numbers to the right of the gels indicate apparent molecular mass (kDa). Gels were scanned and the density of the test band was divided by that of its corresponding loading control and represented in arbitrary units (a.u) in the accompanying graph. Values were expressed as means ± SEM. *P<0.05 Alb+Cc1fl/fl vs Alb–Cc1fl/fl per feeding group; §P<0.05 HFD vs RD per genotype. (C) qRT-PCR analysis of Tnfα and Il-6 mRNA in liver lysates normalized to 18s. Values were expressed as means ± SEM. *P<0.05 vs Alb–Cc1fl/fl.
H&E staining also revealed few mononuclear inflammatory islands with no significant change in hepatocellular architecture in RD-fed AlbCre+Cc1fl/fl mutants (Figure 2A.b vs a). Whereas HFD caused an increase in inflammatory infiltration of few islands into the parenchyma of AlbCre–Cc1fl/fl controls (Figure 2A.c), its effect on mutant mice was more pronounced, causing multiple foci of lobular inflammatory islands (Figure 2A.d, arrows). The NAS score was 2-fold higher in RD-fed AlbCre+Cc1fl/fl mice than their RD-fed controls (P<0.05), and HFD elevated it from 3 to 5 in mutants (Table accompanying Figure 2A). This suggested advancement of MASH in HFD-fed mutants.
As in global Cc1–/–,7 NF-κB was basally activated (phosphorylated) in 8-month-old AlbCre+Cc1fl/fl livers, more strongly when fed with a HFD, as demonstrated by Western blot analysis of liver lysates with α-phosphoNF-κB antibody (Figure 2B). This likely contributed to the higher mRNA levels of hepatic pro-inflammatory TNFα and IL-614 cytokines than controls (Figure 2C). IL-6 production could lead to activation of Stat3-mediated pro-inflammatory pathways in mutant livers, as demonstrated by Western analysis with α-phosphoStat3 antibody (Figure 2B). The data support the critical role of hepatic CEACAM1 in regulating the inflammatory milieu of the liver.15
Immunohistochemical (IHC) analysis of CD68 and Mac2 revealed more intense macrophage recruitment (Figure S1A) and activation (Figure 3A, panels b vs a and d vs c), respectively, in the liver parenchyma of 8-month-old RD- and HFD-fed AlbCre+Cc1fl/fl mice than controls. In support of increased innate immune response in AlbCre+Cc1fl/fl mice, immunostaining of MPO indicated neutrophil accumulation in the lobular areas of mutant, but not control livers (Figure 3B, panels b vs a and d vs c). Consistently, the mRNA levels of CD68 and S100A8, a neutrophil marker, were ~2-fold higher in RD-fed mutants than controls (Figure S1B). Additionally, mRNA (Figure S1B) and protein levels of pro-inflammatory CD4+T and CD8+T cells were higher in AlbCre+Cc1fl/fl livers (Figure 3C–D, panels b vs a and d vs c). In contrast, the hepatic expression of the anti-inflammatory Treg Foxp3 mRNA levels was not altered (Figure S1B). Together, this demonstrated increased T-cell lymphocytes recruitment to injured liver.16
FIGURE 3.
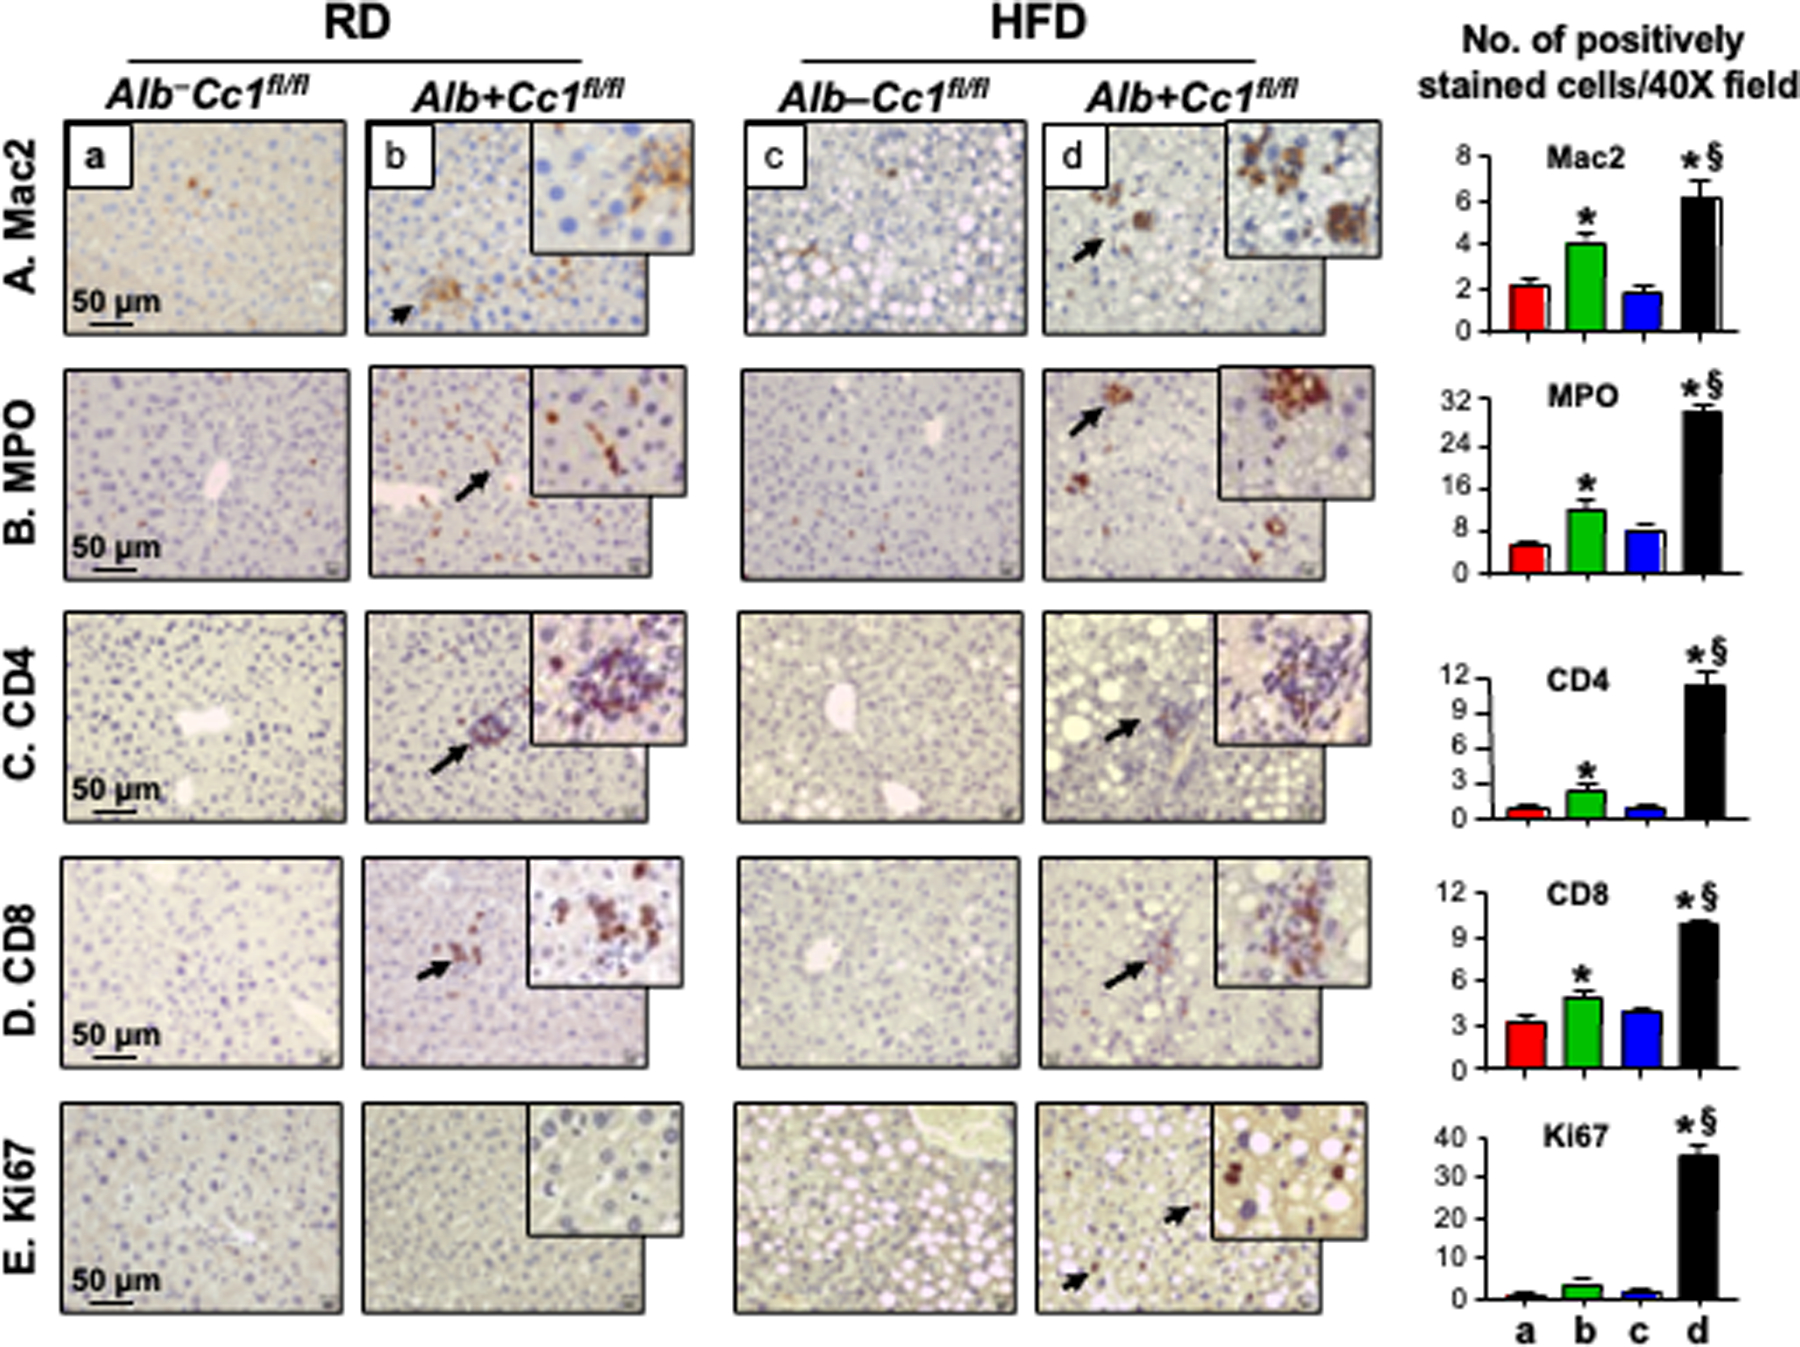
Immunohistochemical analysis of inflammation and cell proliferation. Livers were removed from 8-month-old Alb+Cc1fl/fl mice (panels b and d), and their littermate controls (panels a and c) (n = 6/genotype/feeding group) and their sections subjected to IHC analysis to detect inflammatory cells (A-D) using (A) Mac2 for macrophage activation, (B) MPO to determine neutrophil accumulation and (C-D) CD4 and CD8 to immunostain T cells. (E) sections were immunostained with Ki67 to examine cell proliferation. Representative images were taken at 50μm magnification and shown with insets at 20μm. Number of positively stained cells were counted in 5 fields/mouse at 40X magnification and means ± SEM were presented graphically. *P<0.05 Alb+Cc1fl/fl vs Alb–Cc1fl/fl per feeding group; §P<0.05 HFD vs RD per genotype.
3.3. Development of hepatic fibrosis in AlbCre+Cc1fl/fl mice
Consistent with CEACAM1 downregulating EGFR/MAPK-dependent cell proliferation pathways, 17 IHC analysis revealed elevated Ki67 staining in the livers of HFD-fed AlbCre+Cc1fl/fl mice (Figure 3E, panel d vs a-c), as in the livers of L-SACC1 transgenics with liver-specific inactivation of CEACAM1.17 Because liver proliferation can drive fibrosis,18 we stained liver sections with Sirius Red to detect collagen fibers. As Figure 4A shows, RD-fed AlbCre+Cc1fl/fl mutants, but not their controls, developed periportal fibrosis (panel b vs a) that was amplified in response to HFD with more interstitial bridging and chicken-wire collagen deposition (Figure 4A panel d vs b, and accompanying table, Brunt score of 2.3 vs 1.5 in controls). In contrast, control mice exhibited minimal fibrosis under both feeding conditions [Brunt score of 0.1 (RD) - 0.4(HFD)] (Figure 4A and table). Consistently, mRNA levels of pro-fibrogenic genes (α-Sma, Tgfβ and Desmin) were higher (by ~≥2-fold) in mutant livers relative to controls under both feeding conditions (Figure 4B). Whereas mRNA of Col1α1 and Col3α1 were not significantly elevated in the livers of RD-fed mutants (Figure 4B, green vs red bars), they were induced by HFD (Figure 4B, black vs blue bars). Hepatic fibrosis could be mediated in part by the activation of the canonical TGFβ-Smad2/3 pro-fibrogenic pathway, as indicated by increased Smad2 phosphorylation (Figure 4C) with no significant change in the mRNA levels of Smad7, a TGFβ-Smad2/3 inhibitor (Figure 4B, black vs blue bars).
FIGURE 4.
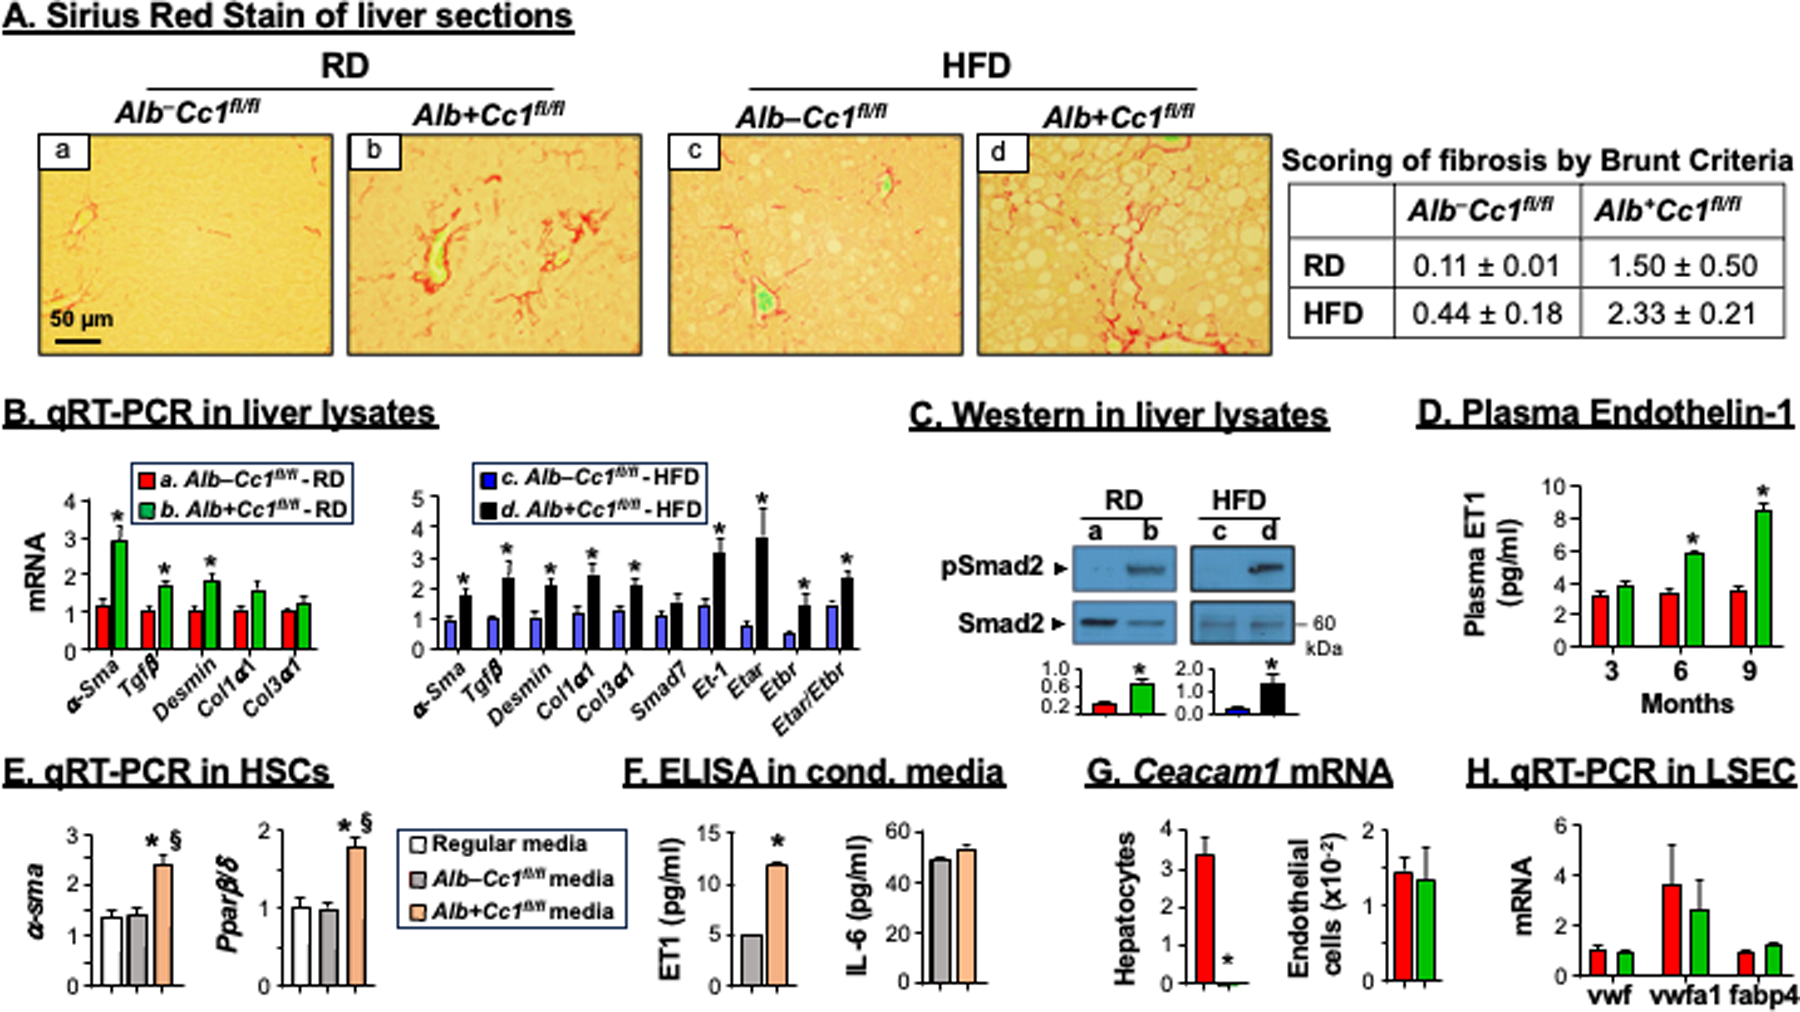
Analysis of fibrosis. Livers were removed from 8-month-old mice (n=6/genotype/feeding group). (A) Sirius Red staining was performed to detect interstitial (panel b) and bridging (panel d) deposition of collagen fibers in mutant mice. Representative images were taken at 50μm magnification. Accompanying table shows fibrosis scoring per Brunt criteria. (B) mRNA analysis of fibrotic markers in liver tissues normalized to 18s from RD-fed controls (red bars) and mutants (green bars) and from HFD-fed controls (blue bars) and mutants (black bars). Values were expressed as means ± SEM. *P<0.05 vs Alb–Cc1fl/fl. (C) Western blot analysis was performed on liver lysates as in the legend to Figure 2. Representative gels indicate the activation (phosphorylation) of α-phosphoSmad2 antibody normalized against total loaded Smad2 proteins. Number to the right of the gels indicate apparent molecular mass (kDa). Gels were scanned and the density of the test band was divided by that of its corresponding loading control and represented in arbitrary units (a.u) in the accompanying graph. (D) plasma ET1 levels in RD-fed Alb–Cc1fl/fl (red bars) and Alb+Cc1fl/fl mice (green bars) at 3, 6 and 9 months of age. Values were expressed as mean ± SEM. *P<0.05 vs AlbCre–Cc1fl/fl controls. (E) Primary hepatic stellate cells (HSCs) from control mice were re-incubated with their collected regular media (white bar), media transferred from AlbCre–Cc1fl/fl control hepatocytes (grey bars) or media from AlbCre+Cc1fl/fl mutant hepatocytes (orange bar). HSCs activation was determined by qRT-PCR analysis of α-Sma and Pparβ/δ relative to 18s in duplicate. (F) ET1 and IL-6 content was assessed in conditioned media. Values were expressed as mean ± SEM. *P<0.05 vs AlbCre–Cc1fl/fl control media and §P<0.05 vs regular media. (G) qRT-PCR analysis of Ceacam1 mRNA levels in hepatocytes and endothelial cells normalized to 18s. Values were expressed as mean ± SEM. *P<0.05 vs AlbCre–Cc1fl/fl. (H) qRT-PCR analysis of mRNA levels of genes marking cell damage in LSECs performed in duplicate. Values were expressed as mean ± SEM.
Increased synthesis of endothelin-1 (ET1) and of its receptors A (ETAR)19 mediates proliferation of HSCs, whereas that of ETBR elicits antiproliferative activity in HSCs.20 Consistent with NF-κB activation in RD-fed AlbCre+Cc1fl/fl livers, their plasma levels of ET1, a transcriptional target of NF-κB,21 were ~2-fold higher than their controls starting at 6 months of age (Figure 4D), and preceding the onset of hepatic fibrosis at 8 months. HFD significantly induced its hepatic mRNA level and that of Etar by ~3.5-fold, elevating the Etar/Etbr ratio by ~1.5–2 fold in mutant mice (Figure 4B, black vs blue bars). Furthermore, incubating primary HSCs from control mice in conditioned media from hepatocytes isolated from RD-fed AlbCre+Cc1fl/fl mutants, but not their AlbCre–Cc1fl/fl controls, led to their activation, as indicated by the ~2-fold increase in their α-Sma and Pparβ/δ mRNA levels (Figure 4E). This could be caused by the pro-fibrogenic ET1, the level of which was increased by ~3-fold in the conditioned media from mutant hepatocytes without a change in the pro-inflammatory IL-6 levels (Figure 4F).
Further emphasizing the primary role of CEACAM1 loss from hepatocytes in HSCs activation independently of its role in endothelial cells,9 Ceacam1 expression in these extra-hepatocytic cells was unaltered (Figure 4G). Consistently, the expression of cell damage markers (vwf, vwfa1 and Fabp4)22 in the liver sinusoidal endothelial cells of AlbCre+Cc1fl/fl mutants were intact relative to their controls (Figure 4H).
Increased fibrosis could drive liver injury in mutant mice, as indicated by the higher Nrf and Txn mRNA levels in RD-fed and Hgf, Nrf, Nqo and Txn in HF-fed mutants (Figure 5A). The higher Nox4 mRNA levels (Figure 5A) pointed to possible contribution of elevated oxidative stress with TGFβ signaling to induce more progressive liver injury in mutants.23
FIGURE 5.
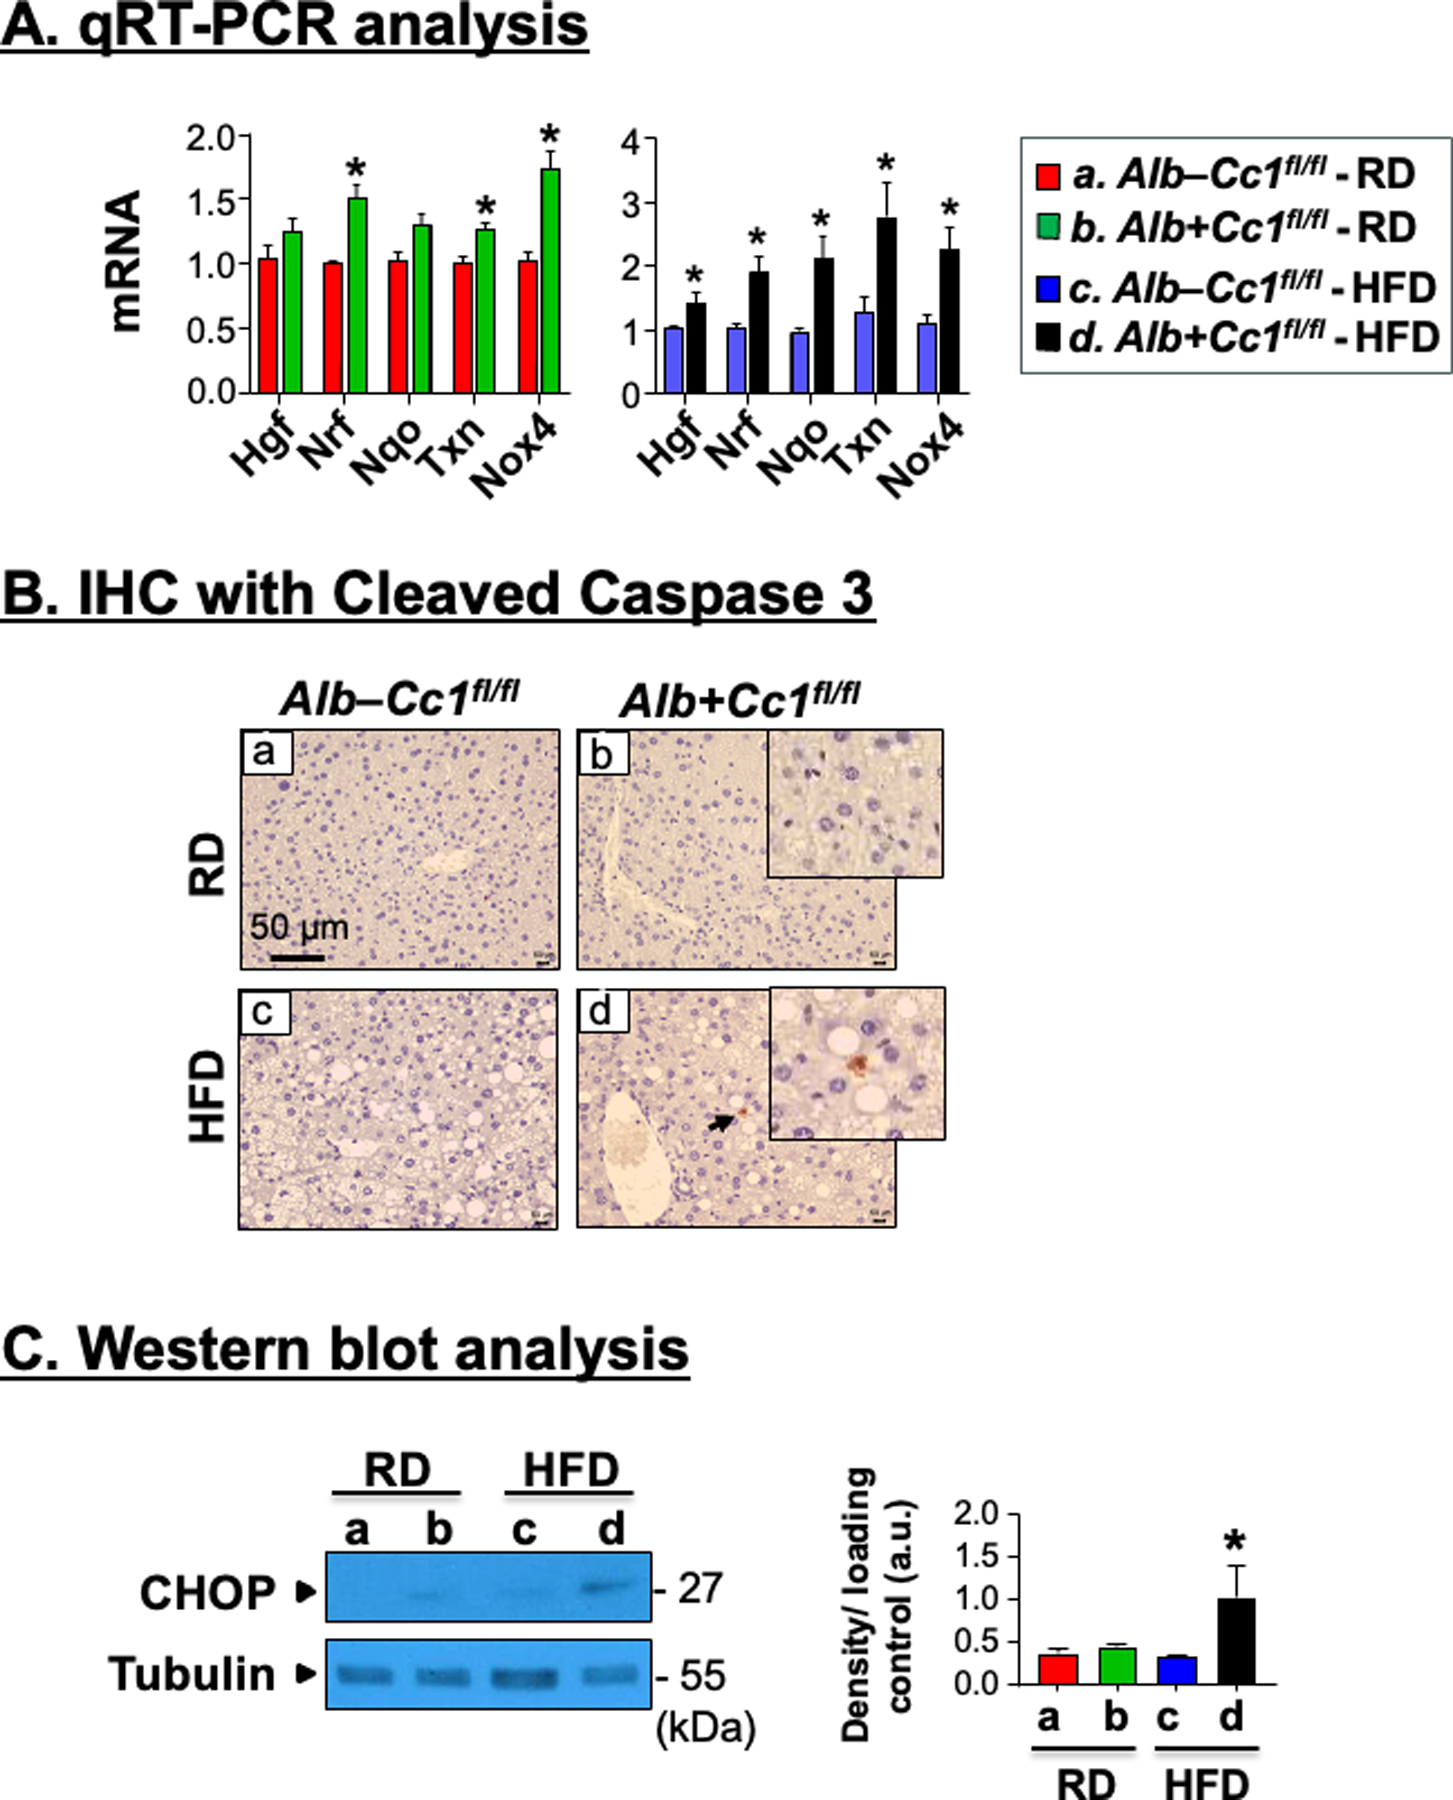
Analysis of hepatic injury and apoptosis. Livers were removed from 8-month-old Alb+Cc1fl/fl mice (n = 6/genotype/feeding group). (A) mRNA analysis of hepatic injury markers in liver tissues normalized to 18s, respectively. Values were expressed as means ± SEM. *P<0.05 vs Alb–Cc1fl/fl. (B) Immunohistochemical analysis of Cleaved Caspase 3 to detect apoptotic cells. Representative images were taken at 50μm magnification and shown with insets for RD- and HFD-fed mutants (panels b and d) at 20μm. (C) Western blot analysis of CHOP normalized against tubulin (total loaded proteins) was performed on liver lysates. Gels were scanned and the density of the test band was divided by that of its corresponding loading control and represented in arbitrary units (a.u) in the accompanying graph. Values were expressed as means ± SEM. *P<0.05 vs Alb–Cc1fl/fl.
Consistent with the well-characterized contribution of apoptosis to cell injury, IHC analysis of liver sections with cleaved Caspase 3 (Cl-Caspase 3) detected apoptotic cells in HFD-fed mutants, but not in HFD-fed control livers or RD-fed mutants (Figure 5B.d vs a–c). Moreover, hepatic CHOP protein content was higher in liver lysates of HFD-fed than RD-fed mutants (Figure 5C). This demonstrated that the rise in apoptosis in null livers by HF feeding contributed to their more robust liver injury and fibrosis. Together, the data assigned a major role for hepatocytic CEACAM1-dependent pathways in protecting against hepatocyte injury and apoptosis.
3.4. Reduced hepatic CEACAM1 expression in patients with MASH and fibrosis
We have recently reported that CEACAM1 expression in endothelial cells gradually declines with advanced fibrosis stage in patients, capturing the fibrosis phenotype in mice with endothelial loss of Ceacam1.9 Thus, we next examined whether hepatic expression changes with fibrosis progression in obese patients and in patients with a MASH diagnosis (Table S2). Although the patient pool was mainly Non-Hispanic (Whites and Blacks), some Hispanics were also included. We observed a significant reduction in the expression of CEACAM1 in patients who developed MASH versus patients without MASH (p=0.0001) (Figure 6A). Moreover, hepatic CEACAM1 protein content progressively declined with advancement of fibrosis (Figure 6B). These observations indicate an inverse relationship between hepatic CEACAM1 expression and progressive liver fibrosis.
FIGURE 6.
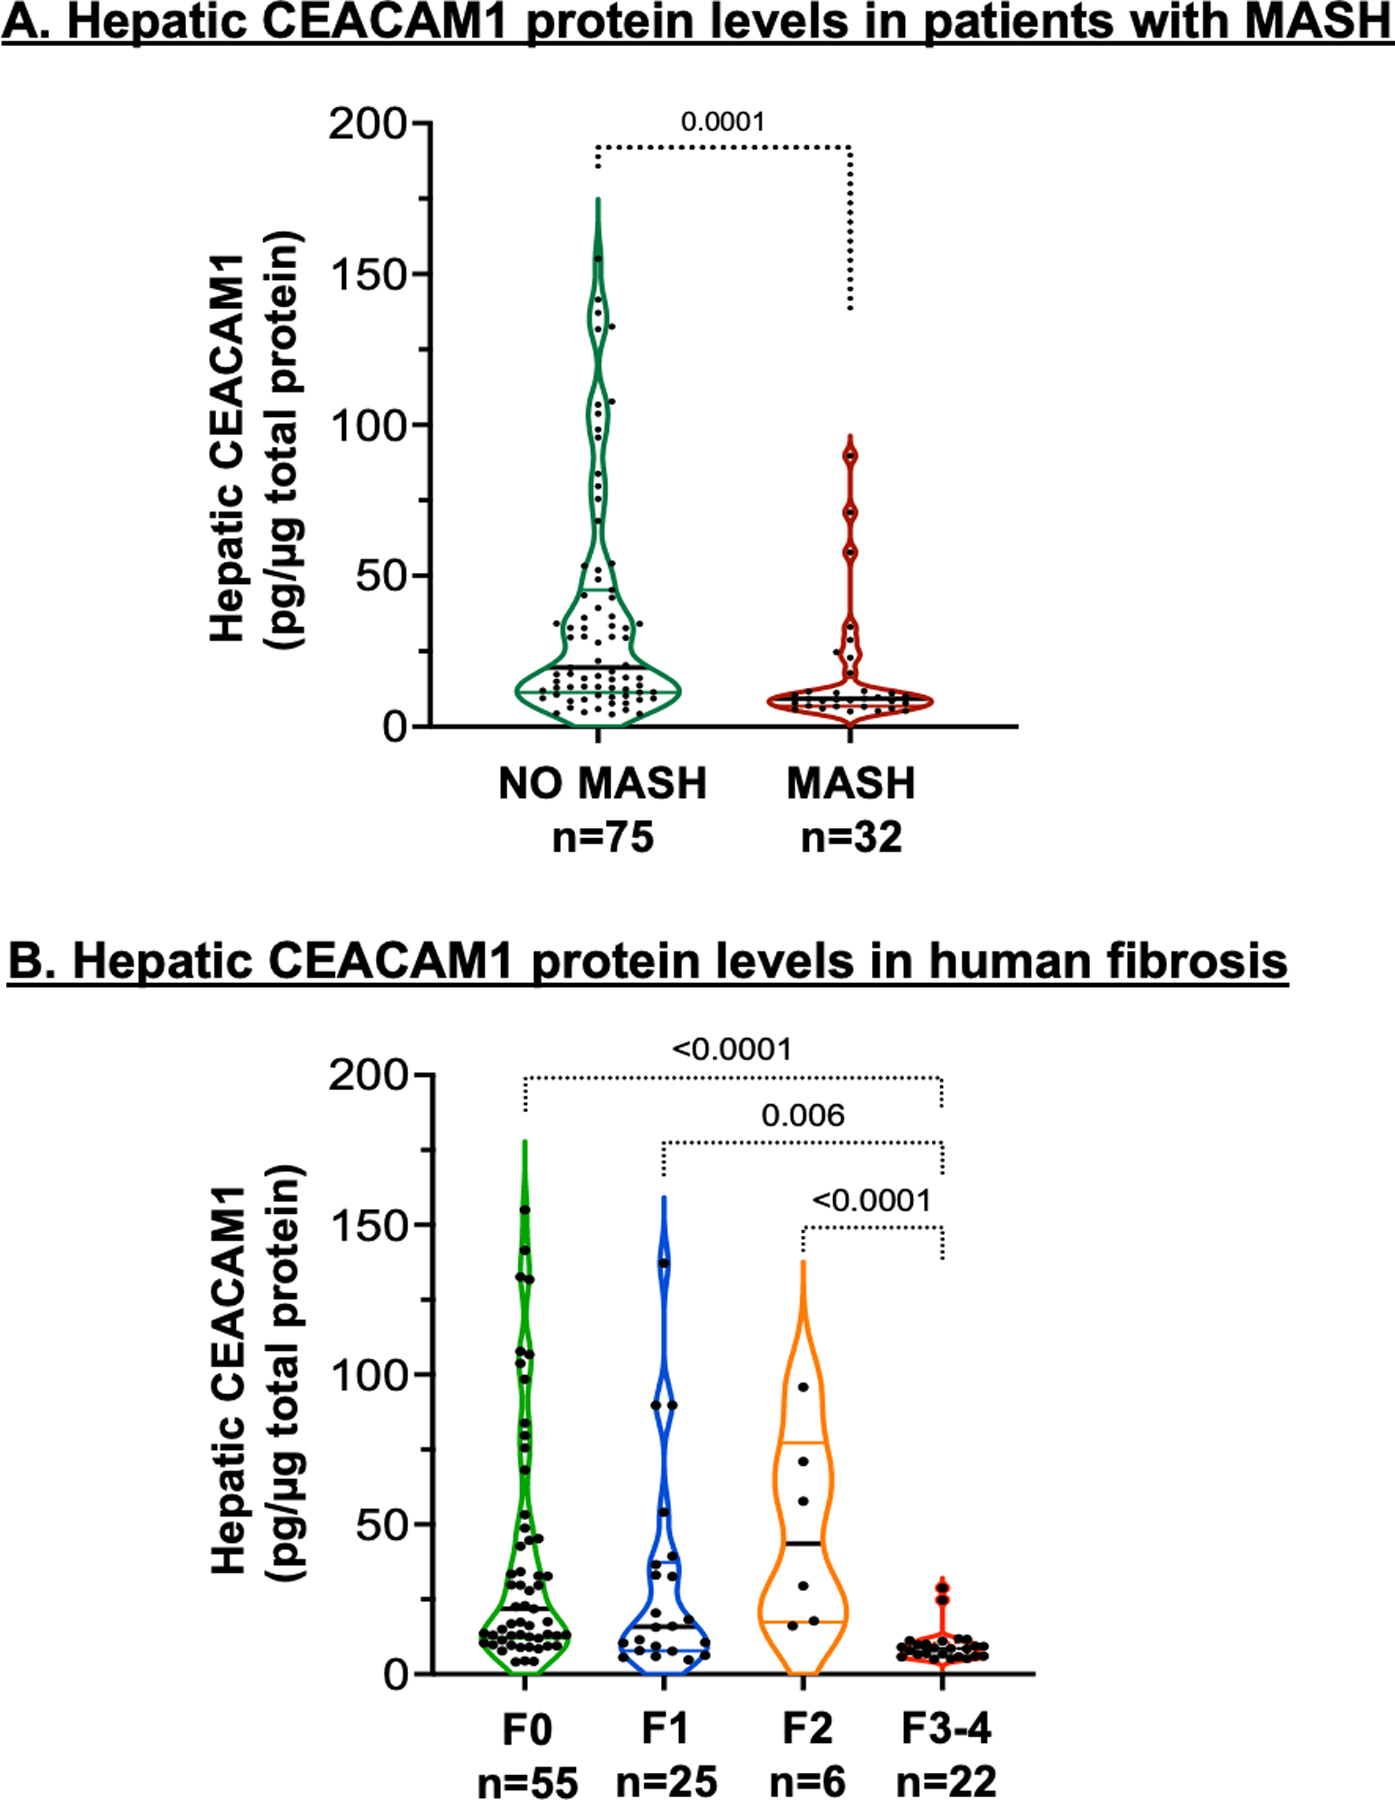
Analysis of CEACAM1 protein levels in patients with MASH. Total hepatic CEACAM1 protein expression was quantified by ELISA in total protein extracts of liver biopsies from human subjects and assessed by (A) the presence (n=32) or absence (n=75) of a biopsy-proven MASH disease stage and (B) different stages of fibrosis: F0 (n=55), F1 (n=25), F2 (n=6) and F3-4 (n=22).
4. DISCUSSION
Ceacam1 deletion predominantly from hepatocytes caused hyperinsulinemia-driven hepatic insulin resistance and steatohepatitis followed by visceral obesity and increased lipolysis-derived NEFA in AlbCre+Cc1fl/fl mice.5 The current studies demonstrated that it also caused spontaneous interstitial periportal hepatic fibrosis that progressed into bridging fibrosis when mutant mice were fed a high-fat diet. On the other hand, liver-specific rescuing of CEACAM1 reversed hepatic fibrosis and injury in addition to insulin resistance and steatohepatitis in global Cc1–/– nulls under both feeding conditions.7 The gain-of-function and the loss-of-function models assign a major role to hepatocytic CEACAM1, not only in terms of promoting insulin sensitivity, but also in protecting against hepatic fibrosis. These observations in mice promote an intriguing hypothetical mechanism for the inverse relationship between hepatocytic CEACAM1 levels and the progression of fibrosis stage in patients with MASH, as shown in the current studies and as supported by single cell RNA-sequencing data in human livers.9
The development of fibrosis in 8-month-old AlbCre+Cc1fl/fl mice followed hepatic insulin resistance, as determined previously by hyperinsulinemia-euglycemia clamp analysis.5 This is supported by the current study that assessed for the first time, insulin resistance by low Insulin Sensitivity Index together with altered insulin metabolism during IPGTT, as done during oral glucose tolerance test (OGTT) in humans.11 The data confirmed that hyperinsulinemia in AlbCre+Cc1fl/fl mice was mainly driven by reduced hepatic insulin clearance without a significant change in insulin secretion, which under IPGTT, assess integrated acute and second-phase insulin release. These observations in mice agree with Bril et al.24 reporting on hyperinsulinemia in patients with MASH and fibrosis being a correlate of reduced hepatic insulin clearance (measured during OGTT) rather than increased insulin secretion.
Adipocytes-derived effectors play a significant role in the pathogenesis of hepatic fibrosis in humans.8 Thus, it is possible that increased plasma NEFA contributed to the development of fibrosis in RD-fed AlbCre+Cc1fl/fl mice. However, the progression of fibrosis in response to HFD was not directly related to NEFA, since HFD did not elevate NEFA levels relative to controls. Instead, it was associated with increased inflammation, which would in turn, cause hepatocellular injury.25 In support of the well-documented metabolic and immune regulation by CEACAM1 in the liver,26 it is reasonable to speculate that the enhanced pro-inflammatory state in AlbCre+Cc1fl/fl livers is a manifestation of the immune response to hyperinsulinemia-driven hepatic steatosis, which in turn alters the hepatic inflammatory milieu.27
Because liver-specific inactivation of CEACAM1 caused progressive fibrosis in HFD-fed transgenic mice,27 it is likely that deleting the anti-inflammatory long-isoform of CEACAM1 contributed to the increased inflammatory response to CEACAM1 loss from hepatocytes. The mechanistic underpinning of this relationship has been described: Upon its phosphorylation by epidermal growth factor receptor (EGFR), CEACAM1 sequesters Shc to repress downstream signaling pathways. When CEACAM1 is deleted, Shc coupling to EGFR is increased, as we have reported under basal and hyperinsulinemic conditions in hepatocytes17. This leads to activation of MAPkinase and NF-κB pathways. The former induces proliferation and the latter leads to increased transcription of inflammatory markers such as TNFα and IL-614 which in turn, activate NF-κB and Stat3, respectively. Consistent with hyperinsulinemia-driven endothelin-1 production,28 this also leads to the synthesis of endothelin-1 and its pro-fibrogenic A receptor to cause vasoconstriction, which could induce HSCs activation and collagen formation.29 Accordingly, the conditioned media of mutant hepatocytes containing elevated endothelin-1 with normal IL-6 levels activated HSCs in the absence of any damage to LSEC derived from mutant mice. Together with elevation in plasma endothelin-1 preceding hepatic fibrosis, this indicates that CEACAM1 loss in hepatocytes independently caused HSCs activation and hepatic fibrosis in RD-fed AlbCre+Cc1fl/fl mice.
In conclusion, the current studies demonstrated that hepatocytes-specific deletion of Ceacam1 reduced hepatic insulin clearance to cause hyperinsulinemia-driven insulin resistance and steatohepatitis, in addition to hepatic fibrosis. Because the latter occurred in the absence of LSEC damage unlike the insulin sensitive normo-insulinemic mice with endothelial loss of CEACAM1,9 this assigned a primary role to compromised hepatocytic CEACAM1 function in hepatic fibrosis independent of its role in endothelial cells. Furthermore, CEACAM1 protein levels were low in patients with MASH and progressively declined with advanced fibrosis stage. This proposes that incretins and PPARγ agonists reverse hepatic fibrosis in patients with MASLD/MASH,2,24 at least in part, by activating Ceacam1 transcription.30
Supplementary Material
Acknowledgments:
This work was supported by NIH grants: R01-HL112248, R01-DK054254, R01-DK124126 and R01-MD012579 to S.M.N.; R01-MD012579 (Supplement) to S.D.; and K08-DK113244 to AZ. We thank the OHF J.J.Kopchick Eminent Research Chair to S.M.N.
Abbreviations
- Ceacam1
Mouse gene encoding CEACAM1 protein
- CEACAM1
Carcinoembryonic Antigen-related Cell Adhesion Molecule1 protein
- Alb+Cc1fl/fl (AlbCre+Cc1fl/fl)
Albumin-Cre transgenics with homozygous null Ceacam1 gene
- Alb–Cc1fl/fl(AlbCre–Cc1fl/fl)
Flox littermate controls
- Cc1–/–
Global Ceacam1 knockout mice
- HSCs
Hepatic stellate cells
- IPGTT
Intraperitoneal glucose tolerance test
- OGTT
Oral glucose tolerance test
- NOX4
Nicotinamide adenine dinucleotide phosphate reduced oxidase 4
Footnotes
Conflict of interest/Financial disclosure: None declared.
References
- 1.Younossi ZM. Non-alcoholic fatty liver disease - A global public health perspective. J Hepatol Mar 2019;70(3):531–544. doi: 10.1016/j.jhep.2018.10.033 [DOI] [PubMed] [Google Scholar]
- 2.Bril F, Sanyal A, Cusi K. Metabolic Syndrome and Its Association with Nonalcoholic Steatohepatitis. Clin Liver Dis May 2023;27(2):187–210. doi: 10.1016/j.cld.2023.01.002 [DOI] [PubMed] [Google Scholar]
- 3.Poy MN, Yang Y, Rezaei K, et al. CEACAM1 regulates insulin clearance in liver. Nat Genet Mar 2002;30(3):270–6. doi: 10.1038/ng840 [DOI] [PubMed] [Google Scholar]
- 4.Najjar SM, Yang Y, Fernstrom MA, et al. Insulin acutely decreases hepatic fatty acid synthase activity. Cell Metab Jul 2005;2(1):43–53. doi: 10.1016/j.cmet.2005.06.001 [DOI] [PubMed] [Google Scholar]
- 5.Ghadieh HE, Russo L, Muturi HT, et al. Hyperinsulinemia drives hepatic insulin resistance in male mice with liver-specific Ceacam1 deletion independently of lipolysis. Metabolism Apr 2019;93:33–43. doi: 10.1016/j.metabol.2019.01.008 [DOI] [PMC free article] [PubMed] [Google Scholar]
- 6.DeAngelis AM, Heinrich G, Dai T, et al. Carcinoembryonic antigen-related cell adhesion molecule 1: a link between insulin and lipid metabolism. Diabetes Sep 2008;57(9):2296–303. doi: 10.2337/db08-0379 [DOI] [PMC free article] [PubMed] [Google Scholar]
- 7.Helal RA, Russo L, Ghadieh HE, et al. Regulation of hepatic fibrosis by carcinoembryonic antigen-related cell adhesion molecule 1. Metabolism Aug 2021;121:154801. doi: 10.1016/j.metabol.2021.154801 [DOI] [PMC free article] [PubMed] [Google Scholar]
- 8.Rosso C, Kazankov K, Younes R, et al. Crosstalk between adipose tissue insulin resistance and liver macrophages in non-alcoholic fatty liver disease. J Hepatol Nov 2019;71(5):1012–1021. doi: 10.1016/j.jhep.2019.06.031 [DOI] [PubMed] [Google Scholar]
- 9.Muturi HT, Ghadieh HE, Abdolahipour R, et al. Loss of CEACAM1 in endothelial cells causes hepatic fibrosis. Metabolism Jul 2023;144:155562. doi: 10.1016/j.metabol.2023.155562 [DOI] [PMC free article] [PubMed] [Google Scholar]
- 10.Borges DO, Patarrao RS, Ribeiro RT, et al. Loss of postprandial insulin clearance control by Insulin-degrading enzyme drives dysmetabolism traits. Metabolism May 2021;118:154735. doi: 10.1016/j.metabol.2021.154735 [DOI] [PubMed] [Google Scholar]
- 11.Wood AC, Jensen ET, Bertoni AG, et al. Defining the Relative Role of Insulin Clearance in Early Dysglycemia in Relation to Insulin Sensitivity and Insulin Secretion: The Microbiome and Insulin Longitudinal Evaluation Study (MILES). Metabolites Jun 26 2021;11(7)doi: 10.3390/metabo11070420 [DOI] [PMC free article] [PubMed] [Google Scholar]
- 12.DeFronzo RA, Matsuda M. Reduced time points to calculate the composite index. Diabetes Care Jul 2010;33(7):e93. doi: 10.2337/dc10-0646 [DOI] [PubMed] [Google Scholar]
- 13.Kleiner DE, Brunt EM, Van Natta M, et al. Design and validation of a histological scoring system for nonalcoholic fatty liver disease. Hepatology Jun 2005;41(6):1313–21. doi: 10.1002/hep.20701 [DOI] [PubMed] [Google Scholar]
- 14.Son YH, Jeong YT, Lee KA, et al. Roles of MAPK and NF-kappaB in interleukin-6 induction by lipopolysaccharide in vascular smooth muscle cells. J Cardiovasc Pharmacol Jan 2008;51(1):71–7. doi: 10.1097/FJC.0b013e31815bd23d [DOI] [PubMed] [Google Scholar]
- 15.Najjar SM, Russo L. CEACAM1 loss links inflammation to insulin resistance in obesity and non-alcoholic steatohepatitis (NASH). Semin Immunopathol Jan 2014;36(1):55–71. doi: 10.1007/s00281-013-0407-3 [DOI] [PMC free article] [PubMed] [Google Scholar]
- 16.Seki E, Schwabe RF. Hepatic inflammation and fibrosis: functional links and key pathways. Hepatology Mar 2015;61(3):1066–79. doi: 10.1002/hep.27332 [DOI] [PMC free article] [PubMed] [Google Scholar]
- 17.Abou-Rjaily GA, Lee SJ, May D, et al. CEACAM1 modulates epidermal growth factor receptor--mediated cell proliferation. J Clin Invest Oct 2004;114(7):944–52. doi: 10.1172/JCI21786 [DOI] [PMC free article] [PubMed] [Google Scholar]
- 18.Cast A, Kumbaji M, D’Souza A, et al. Liver Proliferation Is an Essential Driver of Fibrosis in Mouse Models of Nonalcoholic Fatty Liver Disease. Hepatol Commun Aug 2019;3(8):1036–1049. doi: 10.1002/hep4.1381 [DOI] [PMC free article] [PubMed] [Google Scholar]
- 19.Barton M, Yanagisawa M. Endothelin: 30 Years From Discovery to Therapy. Hypertension Dec 2019;74(6):1232–1265. doi: 10.1161/HYPERTENSIONAHA.119.12105 [DOI] [PubMed] [Google Scholar]
- 20.Kitamura Y, Hayashi K. Imbalance between expression of endothelin receptors A and B in terminal liver cirrhosis due to hepatitis C viral infection: immunohistochemical study of autopsy cases. J Gastroenterol Hepatol Aug 2008;23(8 Pt 2):e451–6. doi: 10.1111/j.1440-1746.2007.04958.x [DOI] [PubMed] [Google Scholar]
- 21.Suryavanshi SV, Kulkarni YA. NF-kappabeta: A Potential Target in the Management of Vascular Complications of Diabetes. Front Pharmacol 2017;8:798. doi: 10.3389/fphar.2017.00798 [DOI] [PMC free article] [PubMed] [Google Scholar]
- 22.Verhulst S, van Os EA, De Smet V, Eysackers N, Mannaerts I, van Grunsven LA. Gene Signatures Detect Damaged Liver Sinusoidal Endothelial Cells in Chronic Liver Diseases. Front Med (Lausanne) 2021;8:750044. doi: 10.3389/fmed.2021.750044 [DOI] [PMC free article] [PubMed] [Google Scholar]
- 23.Sun X, Harris EN. New aspects of hepatic endothelial cells in physiology and nonalcoholic fatty liver disease. Am J Physiol Cell Physiol Jun 1 2020;318(6):C1200–C1213. doi: 10.1152/ajpcell.00062.2020 [DOI] [PMC free article] [PubMed] [Google Scholar]
- 24.Bril F, Lomonaco R, Orsak B, et al. Relationship between disease severity, hyperinsulinemia, and impaired insulin clearance in patients with nonalcoholic steatohepatitis. Hepatology Jun 2014;59(6):2178–87. doi: 10.1002/hep.26988 [DOI] [PubMed] [Google Scholar]
- 25.Wan J, Weiss E, Ben Mkaddem S, et al. LC3-associated phagocytosis in myeloid cells, a fireman that restrains inflammation and liver fibrosis, via immunoreceptor inhibitory signaling. Autophagy Aug 2020;16(8):1526–1528. doi: 10.1080/15548627.2020.1770979 [DOI] [PMC free article] [PubMed] [Google Scholar]
- 26.Horst AK, Najjar SM, Wagener C, Tiegs G. CEACAM1 in Liver Injury, Metabolic and Immune Regulation. Int J Mol Sci Oct 11 2018;19(10)doi: 10.3390/ijms19103110 [DOI] [PMC free article] [PubMed] [Google Scholar]
- 27.Lee SJ, Heinrich G, Fedorova L, et al. Development of nonalcoholic steatohepatitis in insulin-resistant liver-specific S503A carcinoembryonic antigen-related cell adhesion molecule 1 mutant mice. Gastroenterology Dec 2008;135(6):2084–95. doi: 10.1053/j.gastro.2008.08.007 [DOI] [PMC free article] [PubMed] [Google Scholar]
- 28.Mahmoud AM, Szczurek MR, Blackburn BK, et al. Hyperinsulinemia augments endothelin-1 protein expression and impairs vasodilation of human skeletal muscle arterioles. Physiol Rep Aug 2016;4(16)doi: 10.14814/phy2.12895 [DOI] [PMC free article] [PubMed] [Google Scholar]
- 29.Friedman SL. Mechanisms of hepatic fibrogenesis. Gastroenterology May 2008;134(6):1655–69. doi: 10.1053/j.gastro.2008.03.003 [DOI] [PMC free article] [PubMed] [Google Scholar]
- 30.Ghadieh HE, Muturi HT, Russo L, et al. Exenatide induces carcinoembryonic antigen-related cell adhesion molecule 1 expression to prevent hepatic steatosis. Hepatol Commun Jan 2018;2(1):35–47. doi: 10.1002/hep4.1117 [DOI] [PMC free article] [PubMed] [Google Scholar]
Associated Data
This section collects any data citations, data availability statements, or supplementary materials included in this article.


