Abstract
In developing B cells, V(D)J recombination assembles exons encoding IgH and Igκ variable regions from hundreds of gene segments clustered across Igh and Igk loci. V, D and J gene segments are flanked by conserved recombination signal sequences (RSSs) that target RAG endonuclease1. RAG orchestrates Igh V(D)J recombination upon capturing a JH-RSS within the JH-RSS-based recombination centre1–3 (RC). JH-RSS orientation programmes RAG to scan upstream D- and VH-containing chromatin that is presented in a linear manner by cohesin-mediated loop extrusion4–7. During Igh scanning, RAG robustly utilizes only D-RSSs or VH-RSSs in convergent (deletional) orientation with JH-RSSs4–7. However, for Vκ-to-Jκ joining, RAG utilizes Vκ-RSSs from deletional- and inversional-oriented clusters8, inconsistent with linear scanning2. Here we characterize the Vκ-to-Jκ joining mechanism. Igk undergoes robust primary and secondary rearrangements9,10, which confounds scanning assays. We therefore engineered cells to undergo only primary Vκ-to-Jκ rearrangements and found that RAG scanning from the primary Jκ-RC terminates just 8 kb upstream within the CTCF-site-based Sis element11. Whereas Sis and the Jκ-RC barely interacted with the Vκ locus, the CTCF-site-based Cer element12 4 kb upstream of Sis interacted with various loop extrusion impediments across the locus. Similar to VH locus inversion7, DJH inversion abrogated VH-to-DJH joining; yet Vκ locus or Jκ inversion allowed robust Vκ-to-Jκ joining. Together, these experiments implicated loop extrusion in bringing Vκ segments near Cer for short-range diffusion-mediated capture by RC-based RAG. To identify key mechanistic elements for diffusional V(D)J recombination in Igk versus Igh, we assayed Vκ-to-JH and D-to-Jκ rearrangements in hybrid Igh–Igk loci generated by targeted chromosomal translocations, and pinpointed remarkably strong Vκ and Jκ RSSs. Indeed, RSS replacements in hybrid or normal Igk and Igh loci confirmed the ability of Igk-RSSs to promote robust diffusional joining compared with Igh-RSSs. We propose that Igk evolved strong RSSs to mediate diffusional Vκ-to-Jκ joining, whereas Igh evolved weaker RSSs requisite for modulating VH joining by RAG-scanning impediments.
Subject terms: Epigenetics in immune cells, Gene regulation, DNA recombination
Experiments in mouse models, and in cell lines that only allow primary Vκ-to-Jκ rearrangements, enable characterization of the mechanisms of V(D)J recombination.
Main
Bona fide RSSs flanking antigen receptor gene segments have a conserved palindromic heptamer with a consensus CACAGTG sequence and a less-conserved AT-rich nonamer separated by 12-bp or 23-bp spacers1 (denoted 12RSSs and 23RSSs, respectively). RAG endonuclease initiates V(D)J recombination by cleaving between the CAC of the heptamer and flanking coding sequences upon capturing complementary 12RSSs and 23RSSs in its two active sites, a property known as 12/23 restriction1,13,14. In the mouse Igh, more than 100 VH segments lie within a 2.4 Mb distal portion followed downstream by multiple D segments and four JH segments2. VH segments have downstream 23RSSs, D segments have 12RSSs on both sides, and JH segments have upstream 23RSSs2. Owing to 12/23 restriction, VH segments cannot directly join to JH segments. In progenitor B (pro-B) cells, joining of all D segments, except proximal DQ52, to JH segments occurs via linear scanning during which RAG dominantly captures and utilizes downstream, deletional D-12RSSs owing to convergent orientation with JH-23RSSs5. As DQ52 lies within the Igh-RC, both of its RSSs access RAG by short-range diffusion, but the downstream DQ52-12RSS predominates owing to its superior strength2,5,15. The DJH intermediate and its upstream 12RSS form a RC for VH-to-DJH joining2,3; but the IGCR1 regulatory region just upstream of the D segments contains two CTCF-binding elements (CBEs) that substantially impede upstream RAG scanning4,6,16. Moreover, most D-proximal VH segments have RSS-associated CBEs that impede RAG scanning and enhance their interaction with the DJH-RC, increasing their utilization far beyond that provided by their RSSs alone3. To promote balanced VH utilization, the activity of CBEs and other VH locus scanning impediments is diminished in pro-B cells by developmental down-modulation of the WAPL cohesin-unloading factor7,17, enabling linear loop extrusion to directly present the entire VH locus to the RAG-bound DJH-RC7. Although RAG linearly scans the length of an inverted VH locus, VH-to-DJH joining is nearly abrogated due to bona fide VH-RSSs no longer being in convergent orientation with the DJH-RC RSS7.
Primary Vκ-to-Jκ joining does not use RAG scanning
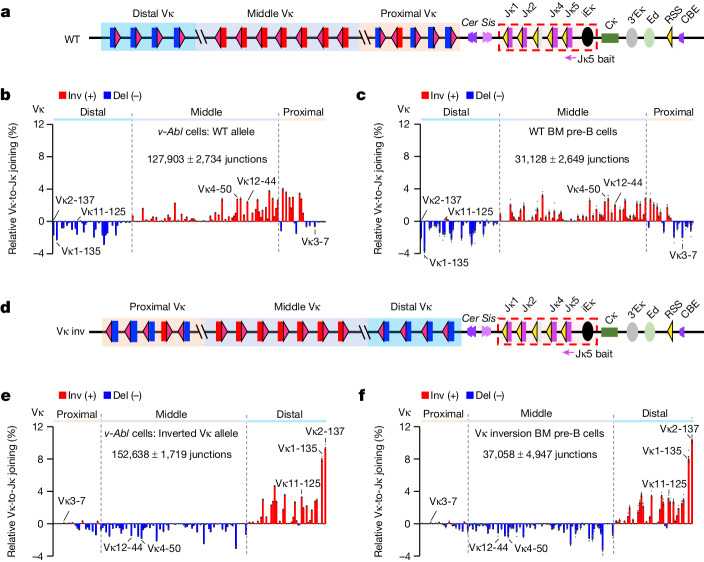
The distal 3 Mb of mouse Igk contains 103 functional Vκ segments associated with 12RSSs followed downstream by the Igk-RC that contains 4 functional Jκ segments with 23RSSs, allowing direct Vκ-to-Jκ joining8 (Fig. 1a). The Cer and Sis elements, each of which contain two CBEs and are located in the 13 kb interval between the most proximal Vκ and Jκ1 (Fig. 1a), functionally promote distal Vκ usage11,12. In precursor B (pre-B) cells, initial (primary) Vκ-to-Jκ rearrangements mostly utilize Jκ118. Subsequently, the three functional downstream Jκ segments (Jκ2, Jκ4 and Jκ5) undergo secondary rearrangements with remaining upstream Vκ segments18. V(D)J recombination, which occurs strictly in the G1 phase of the cell cycle19, can be activated in G1-arrested Abelson murine leukaemia virus-transformed pro-B cell lines20 (hereafter referred to as ‘v-Abl cells’). For high-throughput genome-wide translocation sequencing-adapted V(D)J-sequencing (HTGTS-V(D)J-seq) assays21, we generated RAG-deficient v-Abl cells and ectopically introduced RAG upon G1 arrest. Although v-Abl cells undergo robust D-to-JH rearrangements, they rarely exhibit VH-to-DJH rearrangements owing to high levels of WAPL7. Despite these high WAPL levels, v-Abl cells underwent robust Vκ-to-Jκ rearrangements with usage patterns of deletional- and inversional-oriented Vκ segments similar to those of normal bone marrow pre-B cells (Fig. 1b,c). Of note, bone marrow pre-B cells and v-Abl cells in which we inverted the Vκ locus (Fig. 1d) underwent very similar patterns of robust Vκ-to-Jκ rearrangements, with previously deletional-oriented Vκ segments rearranging by inversion and previously inversional-oriented Vκ segments rearranging by deletion (Fig. 1e,f). These results confirm that Igk utilizes a markedly different long-range V(D)J recombination mechanism to that of Igh and indicate that v-Abl lines are a faithful system for in depth analyses of this mechanism.
Fig. 1. Vκ locus inversion maintains utilization of deletional and inversional Vκ segments in bone marrow pre-B cells and in v-Abl cells.
a, Illustration of mouse Igk (not to scale). Relative location of proximal (orange shadow) and distal (blue shadow) mainly deletional-oriented Vκ segments and middle (grey shadow) mainly inversional-oriented Vκ segments. Cer and Sis lie downstream of the proximal Vκ; Cer upstream-oriented (purple trapezoids) and Sis downstream-oriented (pink trapezoids) CBEs are indicated. Four functional Jκ segments downstream of Sis, with the Igk intronic enhancer (iEκ), form the RC (dashed red rectangle). Further downstream, the Cκ, Igk enhancers, RSS and upstream-oriented CBE are indicated. Vκ segments are flanked by 12RSSs (red triangles) and Jκ segments by 23RSSs (yellow triangles). Vκ locus CBEs are shown in Fig. 2. WT, wild type. b,c, Relative utilization of individual Vκ segments on wild-type alleles in v-Abl cells (b) and bone marrow (BM) pre-B cells (c) baiting from Jκ5 (indicated in a). Inv, inversional joins; Del, deletional joins. Locations of selected Vκ segments are indicated—these features are retained in subsequent figures. Vκ usage patterns in b,c are highly similar (two-sided Pearson’s r = 0.88, P = 2.2 × 10−53). d, Illustration of inverted Vκ locus. e,f, Relative utilization of individual Vκ segments on inverted Vκ alleles in v-Abl cells (e) and bone marrow pre-B cells (f) assayed with Jκ5 bait. Vκ usage data in the inverted locus is shown in the inverted orientation. Vκ usage patterns in e,f are highly similar (two-sided Pearson’s r = 0.97, P = 5.5 × 10−97). Junction numbers are shown in each panel and in subsequent figures for comparison of absolute levels. Vκ utilization data are presented as mean ± s.e.m. from 4 (b,e) or 7 (c,f) biological repeats.
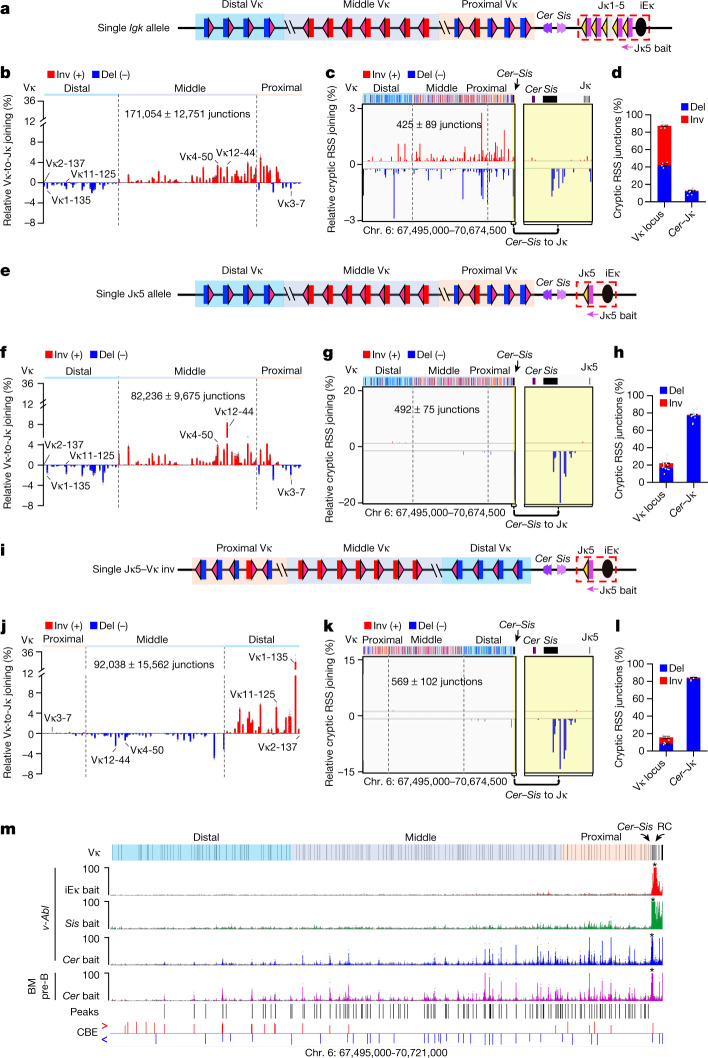
To facilitate the assessment of effects of cis-acting Igk modifications in v-Abl cells, we generated a v-Abl cell line containing a single Igk locus (the single Igk allele v-Abl line). This line undergoes Vκ-to-Jκ joining nearly identically to its parental line (Fig. 2a,b; compare with Fig. 1b). Long-range RAG chromatin scanning of both the Igh and other multi-megabase domains genome-wide can be revealed by highly sensitive HTGTS-V(D)J-seq-based RAG-scanning assays for very low-level RAG-initiated joins between a RC-based bona fide RSS and weak cryptic RSSs as simple as the CAC of the heptamer when in convergent orientation2,4,5,7. This assay reveals chromatin regions scanned by RC-based RAG, directionality of exploration, and effects of local chromatin structure on loop extrusion-mediated scanning activity2,4,5,7. We used this assay with a Jκ5 bait, which should primarily detect chromosomal joins8, to assess RAG scanning versus normal Vκ-to-Jκ joining activity in the single Igk allele v-Abl line. The results were markedly different from linear strand-specific scanning tracks observed during VH-to-DJH rearrangement6,7; indeed, scanning tracks appeared across the Vκ locus on both DNA strands and lacked clear directionality (Fig. 2c,d). These scanning patterns suggested that inversional rearrangements displace Cer and Sis impediments and place groups of downstream inversional Vκ segments in deletional-orientation upstream of remaining Jκ segments for secondary rearrangements9,10, potentially mediated by linear RAG scanning.
Fig. 2. RAG scanning for primary Igk rearrangement is terminated within Sis while Cer interacts across the Vκ locus.
a, Diagram of the single Igk allele v-Abl line. b, Relative utilization of individual Vκ segments in the single Igk allele line with Jκ5 bait. c, Percentage of pooled RAG off-target junctions in Igk locus from the single Igk allele line. The region between Cer and Jκ, highlighted in yellow, is enlarged on the right. d, Percentage of inversional and deletional cryptic RSS junctions within indicated Vκ locus (chromosome (chr.) 6:67,495,000–70,657,000) and Cer–Jκ regions (chr. 6:70,657,000–70,674,500) from the single Igk allele line. e, Diagram of the single Jκ5 allele v-Abl line. f–h, Vκ usage (f) and RAG off-target profiles (g,h) in the single Jκ5 allele line presented as in b–d. i, Diagram of the single Jκ5-Vκ inv v-Abl line. j–l, Vκ usage (j) and RAG off-target profiles (k,l) in the single Jκ5-Vκ inv line presented as in b–d. Vκ1-135 is over-utilized (j), probably owing to its associated transcription. In Fig. 1e,f, Vκ2-137 is equally used, probably owing to its replacement of primary Vκ1-135 inversional rearrangements via deletional secondary rearrangements. Vκ usage data and RAG off-target junctions in the inverted locus are shown in inverted orientation (j,k). m, Chromosome conformation capture (3C)-HTGTS profiles in the Igk locus from RAG-deficient v-Abl cells baiting from iEκ (red), Sis CBE2 (green) and Cer CBE1 (blue) and from RAG-deficient primary pre-B cells baiting from Cer CBE1 (pink). Asterisks indicate the location of baits. Locations of Cer-baited interaction peaks in the Vκ locus significantly above background are indicated with black lines, CBEs in the Igk locus are indicated with red (rightward) and blue (leftward) lines. Details on peak calling are provided in Methods. Vκ utilization and cryptic RSS data are presented as mean ± s.e.m. from 4 (b,d), 7 (f,h) or 3 (j,l) biological repeats; 3C-HTGTS data are presented as mean value from 2 biological repeats.
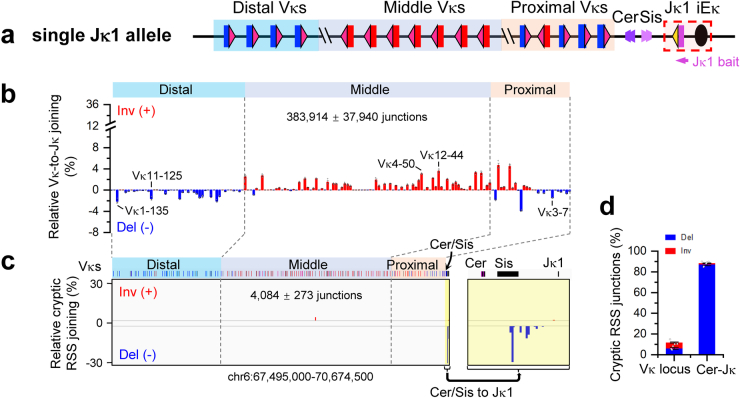
To more rigorously test the origin of the complex wild-type v-Abl Igk scanning patterns, we deleted both Jκ1-4 and the downstream Igk-RSS-based deleting element22 from the single Igk allele v-Abl cells, leaving Jκ5 in its normal position relative to iEκ. This ‘single Jκ5 allele’ v-Abl line undergoes only primary Vκ-to-Jκ5 rearrangements (Fig. 2e), with rearrangements and scanning patterns representing those that happen during primary Vκ-to-Jκ recombination. Primary bona fide Jκ5 joins to deletional and inversional Vκ segments across the locus were chromosomally retained with patterns somewhat different from those of the parental single Igk allele v-Abl cells (Fig. 2f; compare with Fig. 2b), probably owing in large part to elimination of secondary rearrangements (see Fig. 2 caption). However, overall findings were clear—primary RAG scanning from the Jκ5-based RC was terminated 8 kb upstream within Sis (Fig. 2g,h), despite primary Vκ-to-Jκ joins in the same cells occurring across the locus (Fig. 2f). We also inverted the Vκ locus in the single Jκ5 allele v-Abl line to form the ‘single Jκ5–Vκ inv’ line (Fig. 2i). In the single Jκ5–Vκ inv v-Abl line, Vκ-to-Jκ rearrangements occurred across the locus, albeit with dominant utilization of the normally distal Vκ1-135 in a proximal position (Fig. 2j); however, primary RAG scanning was still terminated within Sis (Fig. 2k,l). Finally, we generated a single Jκ1 allele v-Abl line and found that Vκ segments were utilized across the locus (Extended Data Fig. 1a,b); but primary RAG scanning was also terminated within Sis (Extended Data Fig. 1c,d).
Extended Data Fig. 1. RAG scanning for primary Vκ-to-Jκ1 rearrangement is terminated within Sis. Related to Fig. 2.
a, Diagram of single Jκ1 allele v-Abl line. b, Relative utilization percentage of individual Vκs in single Jκ1 allele line with Jκ1 bait. c, Percentage of pooled RAG off-target junctions in Igκ locus from single Jκ1 allele line. Right panel: zoom-in to the region between Cer and Jκ, highlighted in yellow. d, Percentage of inversional (red) and deletional (blue) cryptic RSS junctions within indicated Vκ locus (chr6:67,495,000-70,657,000) and Cer-Jκ regions (chr6:70,657,000- 70,674,500) from single Jκ1 allele line. Vκ utilization and cryptic RSS data are presented as mean ± s.e.m. from 3 biological repeats. Overall figure presentation is as described in Fig. 2. Note that the total on-target and off-target Jκ1 junctions recovered are, respectively, 5-fold and 8-fold greater than those recovered with a Jκ5 bait, consistent with the greater strength of the Jκ1-RSS47.
Primary Vκ-to-Jκ joining uses short-range diffusion
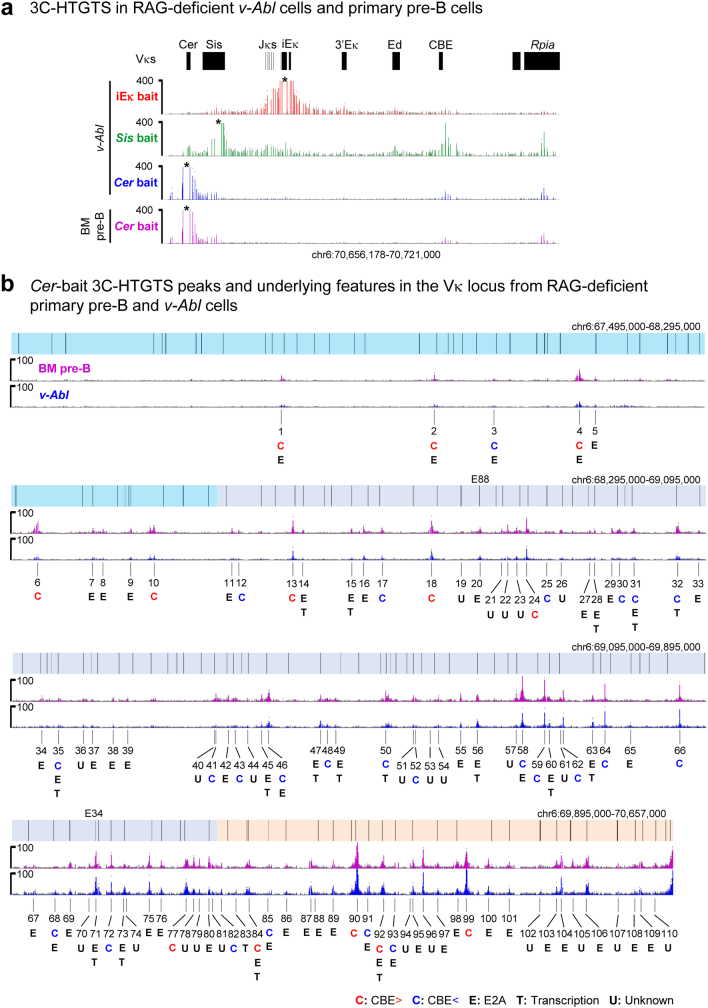
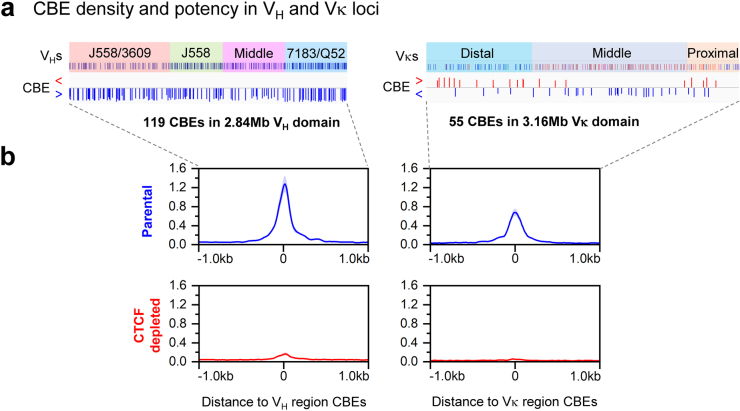
Given our findings that RAG does not linearly scan upstream chromatin beyond Sis during primary Vκ-to-Jκ rearrangement, we used high-resolution 3C-HTGTS3 to explore interactions of the Igk-RC, Sis or Cer with the Vκ locus in RAG-deficient v-Abl cells. These analyses revealed that, compared with Cer, the Igk-RC and Sis had little interaction with sequences upstream of Cer (Fig. 2m, top 3 tracks). By contrast, Cer interacted with more than 100 sites across the Vκ locus in RAG-deficient pre-B cells, many of which were also found in RAG-deficient v-Abl lines (Fig. 2m, bottom two tracks). Moreover, Cer did not interact substantially with Igk sequences, including the RC, downstream of Sis (Extended Data Fig. 2a). The strongest Cer interactions frequently corresponded to CBEs23, but many others corresponded to E2A sites, often in association with transcribed sequences (Extended Data Fig. 2b and Supplementary Data 1). Notably, two previously described Vκ enhancers were in the latter category; deletion of either enhancer affected utilization of nearby Vκ segments24,25. As these deletions were done in wild-type cells, additional effects of the enhancer deletions on primary Igk rearrangements might be confounded by secondary rearrangements (see example in Fig. 2 caption). Finally, it is notable that these interactions with the Cer bait across the Vκ locus occurred with WAPL levels that abrogate interactions of IGCR1 CBE with upstream VH locus scanning impediments6,26,27. In this regard, CBEs in the Vκ locus appear less dense and less potent than those in the VH locus (Extended Data Fig. 3a,b). Thus, loop extrusion may proceed more readily across the Vκ locus with high WAPL levels, as found for other multi-megabase loci without strong extrusion impediments in v-Abl cells4. Internal convergent CBE-based loops in the Vκ locus have been proposed as a major mechanism for bringing Vκ segments into proximity with Cer23. Our current findings support a mechanism in which juxtaposition of Vκ segments with the Cer anchor is mediated by ongoing loop extrusion. During this process CBEs, E2A sites and transcribed sequences act as dynamic impediments5 to extend the time for short-range diffusional interactions of Vκ segments with the Igk-RC. Transcription can further increase accessibility of RSSs to RAG28.
Extended Data Fig. 2. Cer interacts with various loop extrusion impediments across the Vκ locus but not substantially with sequences downstream of Sis. Related to Fig. 2.
a, 3C-HTGTS profiles in the Igκ downstream region from Cer to the downstream Rpia gene from RAG-deficient v-Abl cells, baiting from iEκ (red), Sis CBE2 (green) and Cer CBE1 (blue) and from RAG-deficient primary pre-B cells baiting from Cer CBE1 (pink). Black asterisks indicate the location of baits. b, 3C-HTGTS interaction profiles across the Vκ locus when baiting from Cer CBE1 in RAG-deficient primary pre-B (pink) and v-Abl (blue) cells. Cer interaction peaks and their underlying features in the Vκ locus are shown. A total of 110 peaks were called to be significantly above background in either primary pre-B cells or v-Abl cells. Peaks are indicated with black lines and numbered according to their locations from distal to proximal. For each peak, underlying features within ± 1 kb are indicated, including rightward CBE (“C” in red), leftward CBE (“C” in blue), E2A-binding sequence (“E”) and transcription (“T”). Peaks without any obvious underlying features are labeled as unknown (“U”). CBE annotation and transcription were determined based on published CTCF ChIP-seq and GRO-seq data in RAG-deficient v-Abl cells6. E2A binding was determined based on published E2A ChIP-seq data in RAG-deficient primary pro-B cells46. See Methods for more details. 3C-HTGTS data are presented as mean value from 2 biological repeats.
Extended Data Fig. 3. VH locus CBEs are more dense and more potent than Vκ locus CBEs. Related to Fig. 2.
a, Locations of CBEs in the VH locus (left) and Vκ locus (right). There are 119 annotated CBEs in the 2.84 Mb VH locus and 55 annotated CBEs in the 3.16 Mb Vκ locus. The two loci are shown on the same genomic scale to reflect the difference in CBE density. In the Vκ locus, rightward CBEs are shown in red, leftward CBEs are in blue. In the VH locus, leftward CBEs are shown in red, rightward CBEs are in blue. b, Average enrichment of CTCF ChIP-seq signal within ± 1 kb region across all annotated CBEs in the VH locus (left) and Vκ locus (right) in RAG-deficient parental v-Abl cells (blue) or CTCF-depleted v-Abl cells (red). Data are presented as average signal counts (solid blue or red line) ± s.e.m. (blue or red shade) from 3 biological repeats. The CTCF ChIP-seq data shown were extracted from data deposited in the context of a prior study of RAG-deficient parental and CTCF-depleted v-Abl cells6.
Igk-specific elements promote diffusional joining
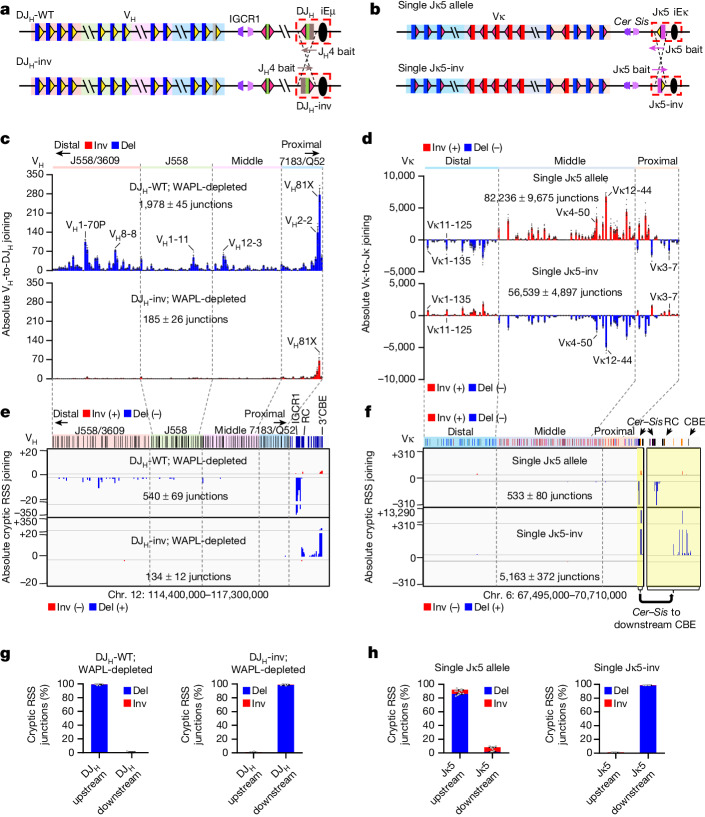
To further explore the basis for the differential V(D)J recombination mechanisms in the Igh versus Igk loci, we generated pre-rearranged DQ52JH4 (DJH-WT) and inverted DQ52JH4 (DJH-inv) v-Abl lines in which WAPL could be depleted (Fig. 3a). In the DJH-WT v-Abl line, WAPL depletion activated VH-to-DJH joining and RAG scanning across the VH locus (Fig. 3c,e, top, g, left). In the WAPL-depleted DJH-inv v-Abl line, VH-to-DJH rearrangement was abrogated and RAG scanning was directed downstream through the Igh locus to the 3′ CBE cluster (Fig. 3c,e, bottom, g, right). This finding is notable, as it has been suggested that inverting the VH locus affects VH-to DJH rearrangement by disrupting convergent VH locus CBE-based structure17. Our findings from the DJH inversion rule out this possibility, as the inversion does not alter any CBEs in the Igh locus or elsewhere and leaves the RC DJH inverted in its normal location. Rather, the DJH inversion only affects the direction of RAG chromatin scanning from the RC. For comparison, we also inverted Jκ5 in the single Jκ5 allele line to generate the ‘single Jκ5-inv’ line (Fig. 3b). Indeed, the Jκ5 inversion redirected RC-bound RAG to scan Igk chromatin downstream of the RC to the 3′ Igk CBE (Fig. 3f,h). However, other than reversing the orientation by which different Vκ segments joined to the Jκ5, there was little effect on the utilization of upstream Vκ segments across the locus (Fig. 3d). In this regard, as cryptic RSS-based scanning reflects cohesin-mediated loop extrusion past the RC, rather than movement of the RC itself, the inverted Jκ5 would not alter the position of Jκ5-RC-bound RAG relative to Sis for short-range diffusional capture of bona fide Vκ-RSSs extruded past Cer. These findings from Jκ inversion strongly support the short-range diffusion model for Vκ access to the Jκ-RC and suggest that the Igk locus, but not the Igh locus, has elements that promote this process.
Fig. 3. Inverting RC RSS orientation reverses RAG scanning direction and abrogates IgH, but not Igκ, V(D)J recombination.
a, Diagram of pre-rearranged DQ52JH4 in DJH-WT (top) and DJH-inv (bottom) WAPL-degron v-Abl lines. b, Diagram of Jκ5 in normal (top) and inverted (bottom) orientation from the single Jκ5 and single Jκ5-inv v-Abl lines. c, Absolute level of individual VH usage from DJH-WT (top) and DJH-inv (bottom) lines with WAPL depletion. d, Absolute level of individual Vκ usage from the single Jκ5 allele (top) and single Jκ5-inv (bottom) lines. e, Absolute level of pooled RAG off-target junctions from three repeats in the Igh locus from DJH-WT (top) and DJH-inv (bottom) lines with WAPL depletion. f, Absolute level of pooled RAG off-target junctions from three repeats in the Igk locus from the single Jκ5 (top) and single Jκ5-inv (bottom) lines. RAG off-target junction profiles downstream of the Igk locus from Cer to the downstream CBE are enlarged on the right. The single Jκ5 allele data (d,f, top) are the same as those shown in Fig. 2f,g; but are plotted here as absolute levels rather than percentages for better alignment and comparison with results from the single Jκ5-inv line. g, Percentage of inversional (red) and deletional (blue) cryptic RSS junctions within indicated DJH upstream (chr. 12:114,666,726–117,300,000) and downstream (chr. 12:114,400,000–114,666,725) region from the DJH-WT (left) and DJH-inv (right) lines with WAPL depletion. h, Percentage of inversional (red) and deletional (blue) cryptic RSS junctions within indicated Jκ5 upstream (chr. 6:67,495,000–70,674,000) and downstream (chr. 6: 70,674,001–70,710,000) region from the single Jκ5 allele (left) and single Jκ5-inv (right) lines. Data are presented as mean ± s.e.m. from 3 (c,g), 7 (d, top, h, left) or 4 (d, bottom, h, right) biological repeats.
Hybrid loci reveal Igk-specific elements
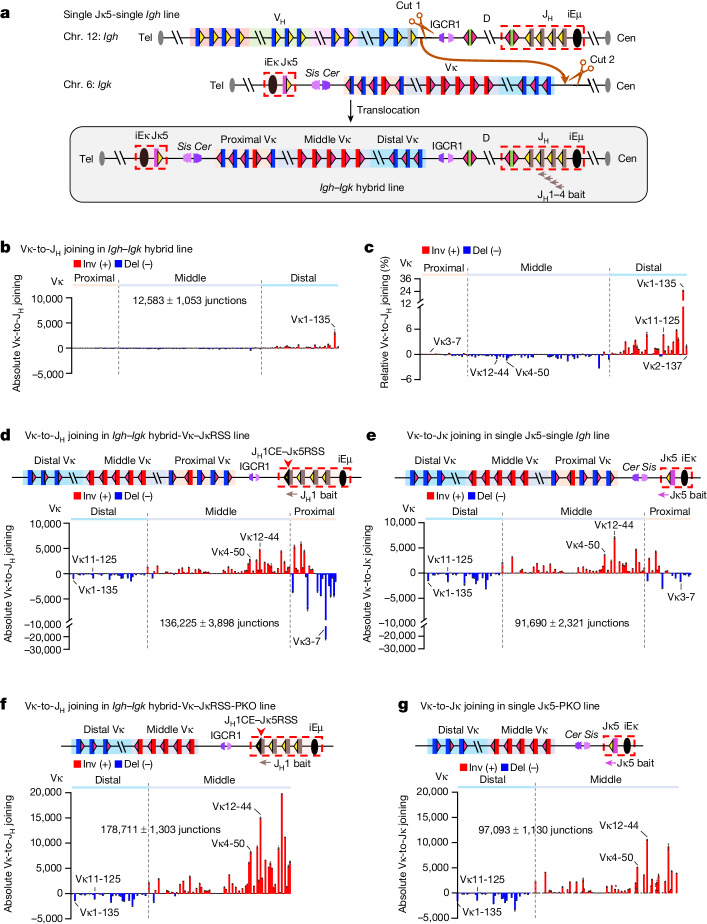
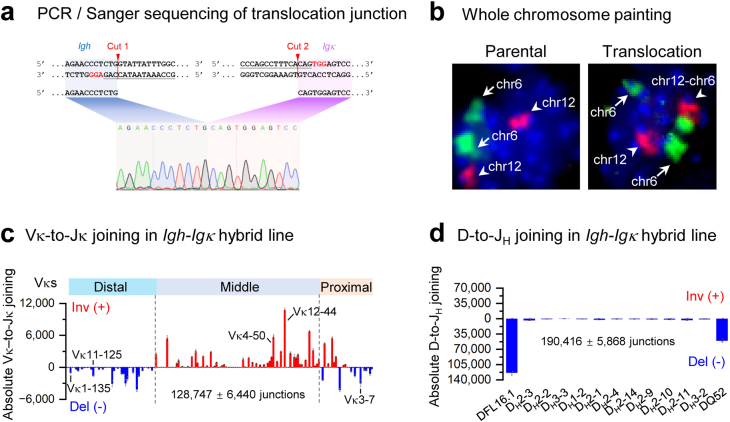
The next major question was to identify the key elements that enable a diffusion-based RC access mechanism to robustly function in Igk and not in Igh2. To address this question, we performed mix-and-match experiments between portions of the two loci. To facilitate these experiments, we used a CRISPR–Cas9-mediated chromosomal translocation targeting approach to generate an Igh–Igk hybrid locus in a single Jκ5 allele v-Abl line in which we had already deleted one copy of the entire Igh locus (Fig. 4a). In this line (Igh–Igk hybrid line), the targeted balanced translocation fused the entire Igk at a point just upstream of the distal Vκ segments to the downstream portion of Igh, starting 85 kb upstream of IGCR1, on a large der(12;6) fusion chromosome (Fig. 4a and Extended Data Fig. 4a,b). Upon G1 arrest and ectopic RAG expression, the Igh–Igk hybrid line underwent Vκ-to-Jκ joining similarly to its parental line (Extended Data Fig. 4c; compare with Fig. 4e), and the retained downstream portion of the Igh underwent normal levels and patterns of D-to-JH joining6,7 (Extended Data Fig. 4d). Thus, the V(D)J recombination activities of the Igk-RC and Igh-RC are maintained in the Igh–Igk hybrid line. To further test the Igh–Igk hybrid line, we used HTGTS-V(D)J-seq to assay for joining of the matched JH-23RSSs with Vκ-12RSSs across the Vκ locus fused upstream of IGCR1. Remarkably, the JH segments joined to both inversional- and deletional-oriented Vκ segments across the Vκ locus, which is in inverted orientation with respect to JH-RSSs (Fig. 4b,c). Although the level of Vκ-to-JH joining across the Igh–Igk hybrid locus was only 14% that of Vκ-to-Jκ joining in the normal Igk locus (Fig. 4b; compare with Fig. 2j total junction number), this level is far higher than that of residual VH-to-DJH joining across an inverted VH locus in bone marrow pro-B cells7. Notably, this long-range Vκ-to-JH joining occurs in v-Abl cells, which have high levels of WAPL that essentially abrogate long-range VH-to-DJH joining beyond low-level joining of the most proximal VH segments7. Finally, the pattern of Vκ-to-JH joining across the inverted Vκ locus was quite similar to that of Jκ joining to an inverted Vκ locus, with Vκ1-135 dominating rearrangement (Fig. 4c; compare with Fig. 2j).
Fig. 4. RSS replacements in Igh–Igk hybrid loci demonstrate superior strength of Igk-RSSs versus Igh-RSSs.
a, Strategy for generating a targeted chromosomal translocation between chr. 12 and chr. 6 in the single Jκ5-single Igh v-Abl line. Cut 1 and Cut 2 show the locations of two single guide RNAs (sgRNAs) used for targeting. b,c, Absolute level (b) and relative percentage (c) of individual Vκ-to-JH joins in the Igh–Igk hybrid line with JH1-4 bait. The patterns of Vκ usage in c and Fig. 2j are highly similar (two-sided Pearson’s r = 0.98, P = 9.6 × 10−110). d, Absolute level of individual Vκ-to-JH joins in the Igh–Igk hybrid-Vκ-JκRSS line in which JH1-23RSS was replaced with a Jκ5-23RSS, assayed with JH1 bait. The patterns of Vκ usage in d and Extended Data Fig. 5d are highly similar (two-sided Pearson’s r = 0.89, P = 1.6 × 10−56), but total rearrangement level in d is 17-fold higher than that in Extended Data Fig. 5c (P = 0.0007; unpaired, two-sided Welch’s t-test). Note that Vκ3-7 is highly over-utilized, perhaps promoted by its closely associated E2A site (Supplementary Data 1). e, Absolute level of individual Vκ-to-Jκ joins in the single Jκ5-single Igh line with Jκ5 bait. f, Absolute level of individual Vκ-to-JH joins in the Igh–Igk hybrid-Vκ-JκRSS-PKO line in which proximal Vκ domain was deleted, assayed with JH1 bait. g, Absolute level of individual Vκ-to-Jκ joins in the single Jκ5-PKO line with Jκ5 bait. The patterns of Vκ usage in f,g are highly similar (two-sided Pearson’s r = 0.90, P = 1.2 × 10−49). Vκ utilization data are presented as mean ± s.e.m. from 3 biological repeats.
Extended Data Fig. 4. Igh-Igκ hybrid line generated by targeted chromosomal translocation maintains normal D-to-JH and Vκ-to-Jκ rearrangements. Related to Fig. 4.
a, Confirmation of translocation junction in Igh-Igκ hybrid v-Abl line (shown in Fig. 4a) by PCR/Sanger sequencing. The sgRNA sequences are underlined, sgRNA cut sites are indicated by red arrows, and the Cas9 PAM sequences are labeled in red. b, Whole chromosome painting results with probes tiling chromosome 6 (green) and chromosome 12 (red) in single Jκ5-single Igh v-Abl cells (“Parental”, left) and Igh-Igκ hybrid v-Abl cells (“Translocation”, right). After translocation, a chr12-chr6 fusion chromosome is detected with half of chr6 appended onto chr12. The reciprocal translocation also placed the small telomeric portion (~7 Mb) of chr12 onto chr6, which is below the detectable size of painting experiments. c, Absolute level of individual Vκ-to-Jκ joins in Igh-Igκ hybrid line with Jκ5 bait. d, Absolute level of individual D-to-JH joining in Igh-Igκ hybrid line with JH1-4 bait. Vκ and D usage data are presented as mean ± s.e.m. from 3 biological repeats.
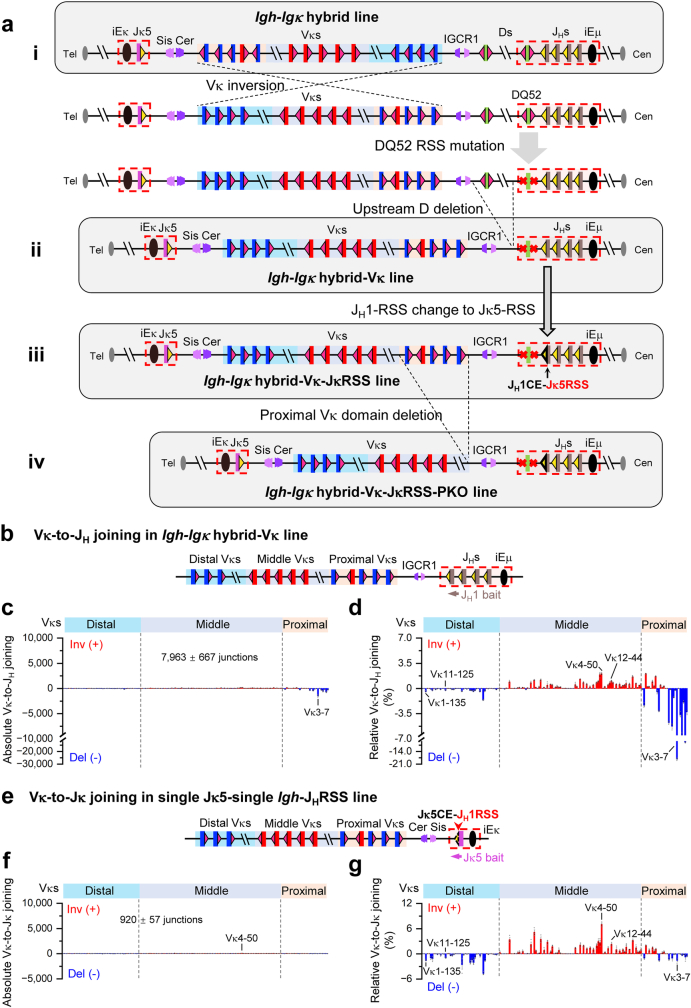
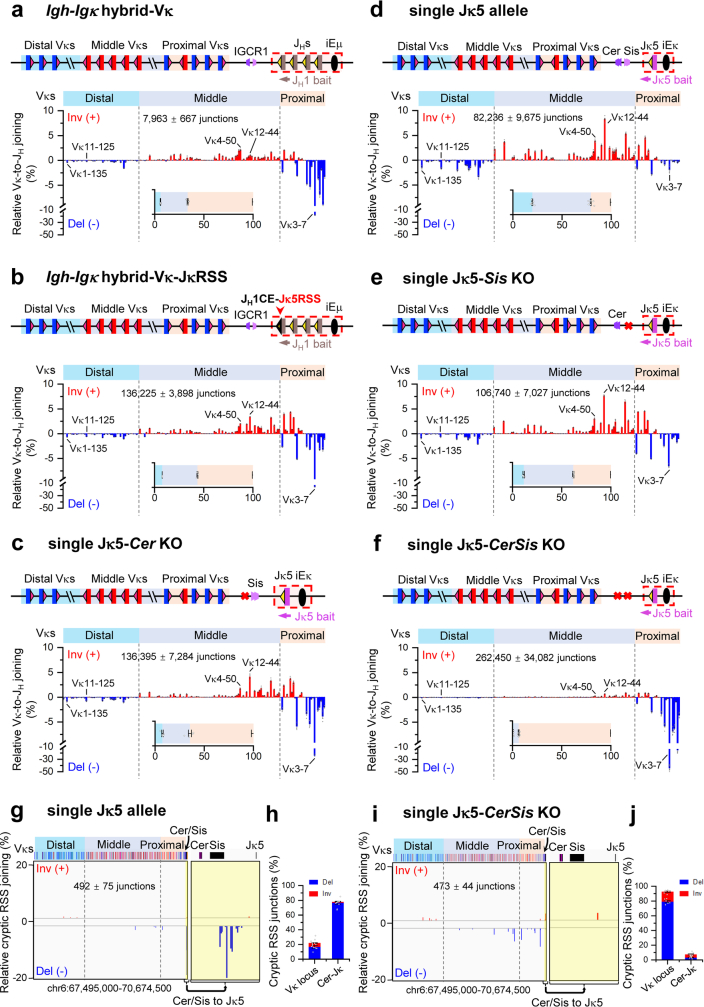
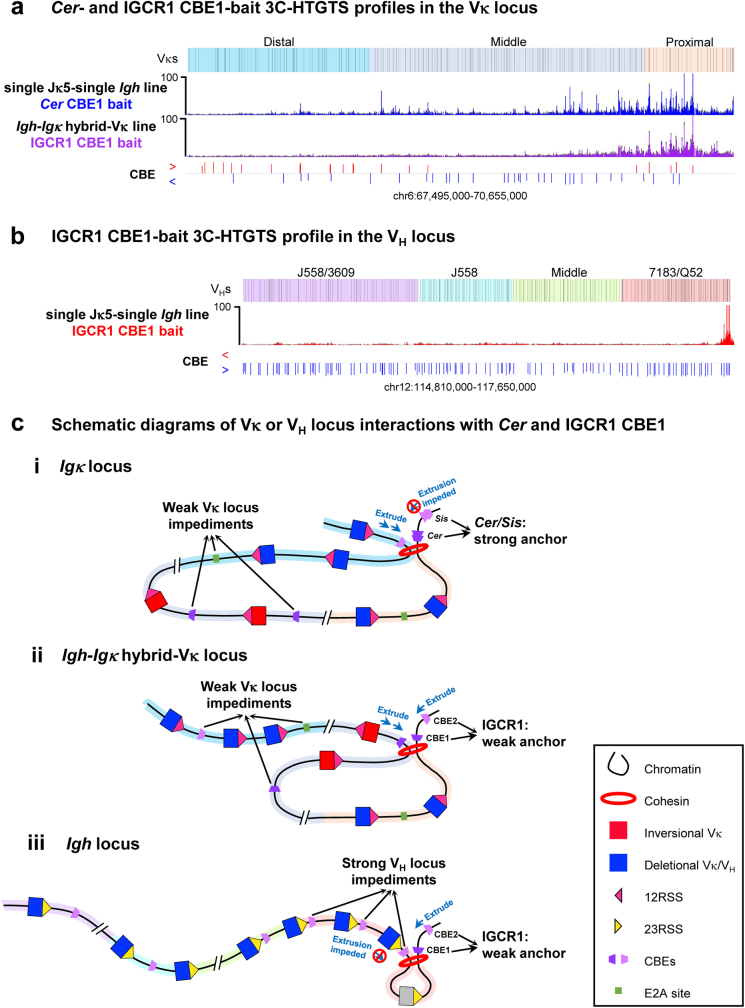
For further comparison of Vκ-to-JH rearrangement patterns and levels, we used a CRISPR–Cas9 approach to modify the Igh–Igk hybrid locus by first inverting the Vκ locus, so that it is in the same relative orientation to JH-RSSs as the normal Vκ locus is to Jκ-RSSs (Extended Data Fig. 5a). To avoid potential confounding effects of competing D-to-JH rearrangements, we deleted all D segments upstream of DQ52 and inactivated both DQ52 RSSs by targeted mutation (Extended Data Fig. 5a), leaving inactivated DQ52 in its normal position to retain its germline promoter and transcription to contribute to Igh-RC activity29. This further modified v-Abl line was termed the ‘Igh–Igk hybrid-Vκ line’ (Extended Data Fig. 5a). HTGTS-V(D)J-seq analyses of Vκ-to-JH joining in the Igh–Igk hybrid-Vκ line revealed JH joining to both deletional- and inversional-oriented Vκ segments across the locus, but at approximately 9% the level of bona fide Vκ-to-Jκ5 joins (Extended Data Fig. 5b–d; compare with Fig. 4e). Whereas the joining patterns of middle and distal Vκ segments were very similar to those of the normal locus, relative utilization of the proximal deletional-oriented Vκ segments was increased (Extended Data Fig. 5d; compare with Fig. 4e). The increased proximal Vκ utilization phenotype could potentially reflect leakiness of the IGCR1 scanning impediment, enabling low-level RAG linear scanning to pass into the proximal Vκ locus versus the Igh locus in which IGCR1 is backed up by proximal VH-associated CBE impediments16,26. To test this possibility, we compared Vκ rearrangement patterns of the Igh–Igk hybrid-Vκ line to those of single Jκ5 lines in which either Cer, Sis or both Cer and Sis were deleted (Extended Data Fig. 6). Consistent with prior analyses12,30, Cer alone maintained nearly wild-type joining patterns, whereas the absence of both Cer and Sis greatly increased proximal Vκ rearrangements at the expense of distal Vκ rearrangements (Extended Data Fig. 6e,f). Cer and Sis deletion also led to extended linear RAG scanning from the ectopic primary Igk-RC into the proximal Vκ region (Extended Data Fig. 6g–j). Notably, the rearrangement patterns in cells with Sis alone in which Cer was deleted were remarkably similar to those of the Igh–Igk hybrid-Vκ line (compare Extended Data Fig. 6a,c). Together, these results support the notion that relative leakiness of the IGCR1 CBE-based impediment, as compared to Cer–Sis deletion, results in increased utilization of proximal Vκ segments in the Igh–Igk hybrid-Vκ line. Finally, 3C-HTGTS analyses of the hybrid locus confirmed both the greater strength of the Cer–Sis anchor compared with IGCR1 and the relative weakness of Vκ locus loop extrusion impediments compared with those of the VH locus (Extended Data Fig. 7).
Extended Data Fig. 5. Genetic modifications in the Igh-Igκ hybrid line and single Jκ5 allele line. Related to Fig. 4.
a, Diagram of the strategy for various genetic modifications in the Igh-Igκ hybrid v-Abl line. In brief: (i) Diagram of the Igh-Igκ hybrid line. (ii) Diagram of the Igh-Igκ hybrid-Vκ line which was generated from the Igh-Igκ hybrid line by inverting the whole Vκ locus, mutating both RSSs of DQ52, and deleting all upstream Ds, as illustrated in the diagrams just above. (iii) Diagram of the Igh-Igκ hybrid-Vκ-JκRSS line which was generated from the Igh-Igκ hybrid-Vκ line by replacing the JH1-23RSS with a Jκ5-23RSS. (iv) Diagram of the Igh-Igκ hybrid-Vκ-JκRSS-PKO line which was generated from the Igh-Igκ hybrid-Vκ-JκRSS line by deleting the proximal Vκ domain. See Methods for more details. b, Diagram of Igh-Igκ hybrid-Vκ line, as shown in a(ii). c, Absolute level, and d, relative percentage of individual Vκ-to-JH joins in Igh-Igκ hybrid-Vκ line with JH1 bait. The patterns of distal and middle Vκ usage in the Igh-Igκ hybrid-Vκ line (d) and the single Jκ5-single Igh line (Fig. 4e) are similar (Two-sided Pearson’s r = 0.70, P = 2.2e-21). e, Illustration of single Jκ5-single Igh-JHRSS line, in which Jκ5-23RSS was replaced with JH1-23RSS. f, Absolute level, and g, relative percentage of individual Vκ-to-Jκ joins in single Jκ5-single Igh-JHRSS line with Jκ5 bait. Total rearrangement level in f is 100-fold lower than that in Fig. 4e (P = 0.0006; unpaired, two-sided Welch t-test). Vκ usage data are presented as mean ± s.e.m. from 3 biological repeats.
Extended Data Fig. 6. IGCR1 is a weaker anchor than Cer-Sis in preventing over-utilization of proximal deletional Vκs. Related to Fig. 4.
a-f, Relative utilization percentage of individual Vκs in Igh-Igκ hybrid-Vκ line (a), Igh-Igκ hybrid-Vκ-JκRSS line (b), single Jκ5-Cer KO line (c), single Jκ5 allele line (d), single Jκ5-Sis KO line (e), single Jκ5-CerSis KO line (f) analyzed with indicated baits. Bar graph in the inset of each panel shows the percentage of distal (blue), middle (gray) and proximal (orange) Vκ domain usage from the corresponding line. g, Percentage of pooled RAG off-target junctions in Igκ locus from single Jκ5 allele line. Right panel: zoom-in to the region between Cer and Jκ, highlighted in yellow. h, Percentage of inversional (red) and deletional (blue) cryptic RSS junctions from single Jκ5 allele line within indicated regions as in Fig. 2d. i-j, RAG off-target profiles in single Jκ5-CerSis KO line presented as in g-h. A group of aberrant pseudo-normal coding-end junctions48 to sequences near the Igκ downstream CBE were excluded4. The patterns of Vκ usage in a, b and c are highly similar (a and c, Two-sided Pearson’s r = 0.91, P = 1.5e-63; b and c, Two-sided Pearson’s r = 0.97, P = 1.0e-99). The data shown in a and d are the same as that shown in Extended Data Fig. 5d and Fig. 2f, the data shown in g and h are the same as that shown in Fig. 2g and h, respectively, plotted here for better alignment and comparison with other results. Vκ utilization and cryptic RSS data are presented as mean ± s.e.m. from 3 (a,b,e), 4 (c), 7 (d,h) or 6 (f,j) biological repeats.
Extended Data Fig. 7. Interactions of IGCR1 or Cer-Sis with VH or Vκ locus in v-Abl cells. Related to Fig. 4 and Extended Data Fig. 3.
a, Upper panel: 3C-HTGTS profiles in the Vκ locus from single Jκ5-single Igh v-Abl line baiting from Cer CBE1. Lower panel: 3C-HTGTS profiles in the Vκ locus from Igh-Igκ hybrid-Vκ v-Abl line baiting from IGCR1 CBE1. b, 3C-HTGTS profiles in the VH locus from single Jκ5-single Igh line baiting from IGCR1 CBE1. CBE sites are shown in a and b with orientations labeled as in Extended Data Fig. 3a. 3C-HTGTS data are presented as mean ± s.e.m. from 3 biological repeats (a) or as mean value from 2 biological repeats (b). c, Schematic loop domain illustrations of Igκ, Igh, and Igh-Igκ hybrid-Vκ loci based on 3C-HTGTS data shown in a and b. (i) In Igκ locus, the strong anchoring activity of Cer-Sis, coupled with relatively weak impediments in the Vκ locus, allows loop extrusion anchored at Cer to extend across the distal, middle and proximal Vκ domains, as shown in a, upper panel. (ii) In Igh-Igκ hybrid-Vκ locus, loop extrusion anchored at IGCR1 can extend a considerable distance into proximal and middle Vκ domains with weak Vκ locus impediments, but does not extend as far as that in (i), because IGCR1 is a less stable anchor than Cer-Sis and more likely to be disassembled before loop extrusion has a chance to proceed into the distal Vκ locus, as shown in a, lower panel. (iii) In Igh locus without WAPL down-regulation, strong VH locus impediments only allow loop extrusion to bring the most proximal VH region to IGCR1, while upstream interactions are completely blocked by the “wall” of proximal VH CBEs, as shown in b. Elements and proteins illustrated are indicated in the box.
As nearly all Vκ segments show low-level rearrangement to JH segments in the presence of IGCR1, a candidate element that could enhance diffusional capture by the Igh-RC would be the Vκ-associated RSSs; which could, in theory, mediate this activity by being stronger than VH-RSSs. In this regard, proximal VH RSSs appear very weak in promoting VH-to-DJH joining in the absence of directly associated CBEs that increase their interaction with the Igh-RC3. This model leads to the further hypothesis that a potential limiting factor for the overall level of Vκ-to-JH joins versus Vκ-to-Jκ joins, is relative strength of the Jκ-RSSs versus JH-RSSs. To test this possibility, we further modified the Igh–Igk hybrid-Vκ locus by replacing JH1-23RSS with Jκ5-23RSS to generate the ‘Igh–Igk hybrid-Vκ-JκRSS’ line (Extended Data Fig. 5a), in which the entire downstream Igh locus including IGCR1, the Igh-RC and downstream sequences were in the same position as in the Igh–Igk hybrid-Vκ line. Remarkably, the pattern of Vκ-to-JH rearrangements in the Igh–Igk hybrid-Vκ-JκRSS line was very similar to that of the parental Igh–Igk hybrid-Vκ line (Fig. 4d; compare with Extended Data Fig. 5d), but the absolute level of rearrangements to Vκ segments across the locus increased approximately 17-fold (compare Fig. 4d with Extended Data Fig. 5c) to levels slightly higher than those of Vκ-to-Jκ joining in the single Jκ5-single Igh line (Fig. 4e). To eliminate the dominance of Vκ3-7 (Fig. 4 caption) and, to a lesser extent, other proximal Vκ segments associated with leaky direct scanning through IGCR1 in the Igh–Igk hybrid-Vκ-JκRSS line, we deleted the most proximal deletional and inversional Vκ segments from this line to generate the ‘Igh–Igk hybrid-Vκ-JκRSS-PKO’ line (Extended Data Fig. 5a). Of note, the pattern of Vκ-to-JH rearrangements in the Igh–Igk hybrid-Vκ-JκRSS-PKO line was very similar to that in the single Jκ5 line with the same proximal Vκ deletion (single Jκ5-PKO line; Fig. 4f,g), with the absolute level of Vκ rearrangements across the Igh–Igk hybrid-Vκ-JκRSS-PKO locus approximately twofold higher than that of the single Jκ5-PKO line (Fig. 4f,g). Finally, to further test the relative RSS strength model, we performed the reciprocal experiment of replacing the Jκ5-23RSS with a JH1-23RSS in the single Jκ5 allele v-Abl line (Extended Data Fig. 5e). Indeed, the JH1-RSS supported only low-level Vκ-to-Jκ joining (1% the level supported by the Jκ5-RSS) (Extended Data Fig. 5f; compare with Fig. 4e), but essentially all Vκ segments were utilized (Extended Data Fig. 5g). The findings from our hybrid locus experiments demonstrate that strong Igk-RSSs are the major determinant of why Igk, but not Igh, supports robust diffusion-mediated V(D)J recombination.
Igk-RSSs are much stronger than Igh-RSSs
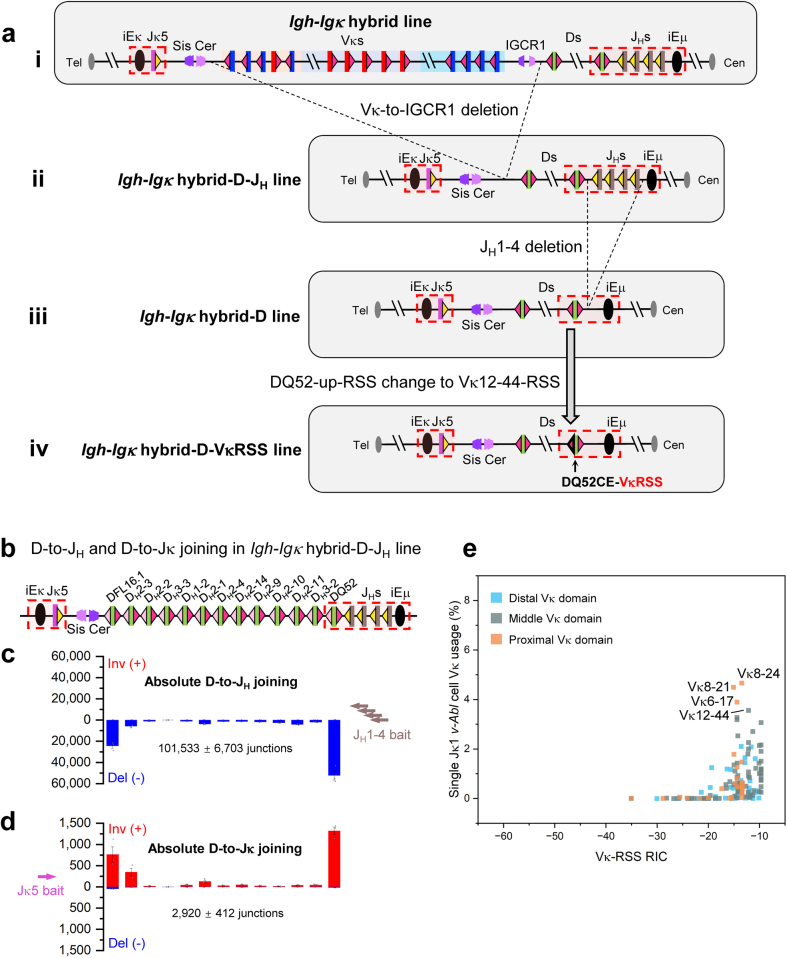
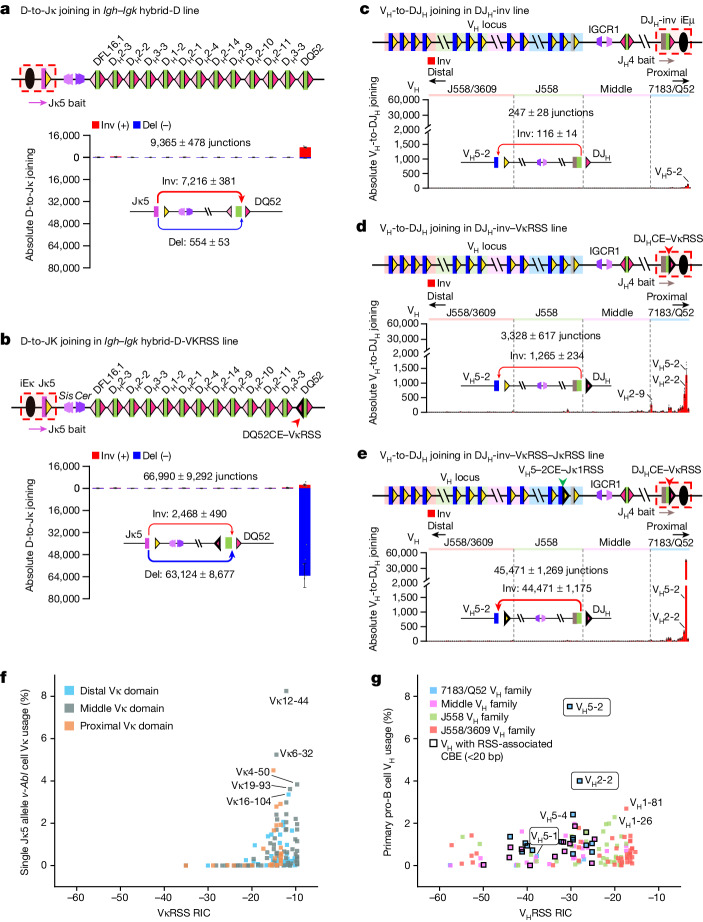
To directly test relative strength of Igh D-12RSSs versus that of a Vκ-12RSS in the context of short-range diffusional joining to the Jκ5-based RC, we used a CRISPR–Cas9-mediated approach to further modify the Igh–Igk hybrid locus. Specifically, we generated a deletion from 5,123 bp upstream of Cer (just downstream of the Vκ locus) to a point 453 bp upstream of DFL16.1 in the Igh–Igk hybrid locus to generate the ‘Igh–Igk hybrid-D-JH’ line (Extended Data Fig. 8a). In this line, the downstream portion of Igk including the Jκ5-based RC and Cer–Sis elements were placed just upstream of the DFL16.1, the 12 downstream D segments, and the JH-RC (Extended Data Fig. 8a). We first assayed for D-to-JH rearrangements in the Igh–Igk hybrid-D-JH line and found the vast majority to be deletional and mostly utilize DFL16.1 and DQ52 (Extended Data Fig. 8b,c), similar to normal deletional-dominated patterns (Extended Data Fig. 4d). We also found D-to-Jκ5 rearrangements at much lower levels; but, nearly all were inversional to DQ52 and DFL16.1 (Extended Data Fig. 8d), consistent with Jκ-RC-bound RAG accessing these D segments by short-range diffusion across Cer–Sis, which is dominated by their stronger downstream D-RSSs5. Indeed, for D-to-JH joining, the various D downstream RSSs are stronger than their upstream RSSs, with the DQ52 downstream RSS being the strongest5. To develop a line for directly comparing relative ability of a Vκ-RSS versus D-RSSs to mediate D-to-Jκ rearrangements, we deleted all JH segments from the Igh–Igk hybrid-D-JH line to generate the ‘Igh–Igk hybrid-D’ line (Fig. 5a and Extended Data Fig. 8a). Activation of V(D)J recombination in this line resulted in primarily DQ52 joining to Jκ5 in which the strong downstream DQ52-RSS dominated rearrangements that were predominantly (13-fold) inversional versus deletional (Fig. 5a). Again, the high level of inversional DQ52-to-Jκ5 joining is consistent with short-range diffusional access across Cer–Sis. Remarkably, replacement of the weaker upstream DQ52-12RSS with the 12RSS of the highly utilized Vκ12-44 in the Igh–Igk hybrid-D line led to a 114-fold increase in the level of Jκ5 deletional joining to DQ52 (Fig. 5b; compare with Fig. 5a), a level approximately 26-fold greater than that of inversional joining mediated by the downstream DQ52-RSS (Fig. 5b). These results demonstrate the remarkable functional strength of the Vκ-12RSS, compared with the DQ52 downstream 12RSS and all other Igh D-12RSSs in mediating diffusion-based D-to-Jκ5 rearrangements.
Extended Data Fig. 8. Genetic modifications in the Igh-Igκ hybrid-D line, and correlation of Vκ usage with RIC score. Related to Fig. 5.
a, Diagram of the strategy for various genetic modifications in the Igh-Igκ hybrid-D v-Abl line. (i) Diagram of the Igh-Igκ hybrid line. (ii) Diagram of the Igh-Igκ hybrid-D-JH line which was generated from the Igh-Igκ hybrid line by deleting all Vκs and IGCR1. (iii) Diagram of the Igh-Igκ hybrid-D line which was generated from the Igh-Igκ hybrid-D-JH line by deleting JH1-4. (iv) Diagram of the Igh-Igκ hybrid-D-VκRSS line which was generated from the Igh-Igκ hybrid-D line by replacing the DQ52 upstream 12RSS with a Vκ12-44 12RSS. See Methods for details. b, Diagram of the Igh-Igκ hybrid-D-JH line as illustrated in a(ii). c, Absolute level of D-to-JH joins baiting from JH1-4 in the Igh-Igκ hybrid-D-JH line. d, Absolute level of D-to-Jκ joins baiting from Jκ5 in the Igh-Igκ hybrid-D-JH line. D utilization data are presented as mean ± s.e.m. from 3 biological repeats. e, Comparison of relative Vκ usage in single Jκ1 allele v-Abl cells with Vκ-RSS RIC scores. Vκs are color-coded according to the three Vκ domains with names indicated for highly used Vκs.
Fig. 5. Igk-RSSs enhance diffusional D-to-Jκ joining in the Igh–Igk hybrid locus and activate inversional VH-to-DJH joining in the Igh locus.
a,b, Absolute level of individual D-to-Jκ joins in the Igh–Igk hybrid-D line (a) and the Igh–Igk hybrid-D-VκRSS line in which the DQ52 upstream 12RSS was replaced with a Vκ12-44 12RSS (b), assayed with Jκ5 bait. Deletional DQ52-to-Jκ5 joining in b is 114-fold higher than that in a (P = 0.0008). c–e, Absolute level of individual inversional VH-to-DJH joins in the DJH-inv line (c), the DJH-inv-VκRSS line, in which DQ52 upstream 12RSS was replaced with a Vκ11-125 12RSS (d) and the DJH-inv-VκRSS-JκRSS line, in which VH5-2 23RSS was replaced with a Jκ1-23RSS (e), assayed with JH4 bait. Total rearrangement level in d is 13-fold higher than that in c (P = 0.0153). Inversional VH5-2 usage level in e is 35-fold higher than that in d (P = 0.0005) and 383-fold higher than that in c (P = 0.0007). In a–e, red arrows show inversional joins and blue arrows show deletional joins. Corresponding junction numbers are shown. Arrow thickness represents relative amounts of junctions. f, Comparison of relative Vκ usage in the single Jκ5 allele v-Abl cells with Vκ-RSS RIC scores calculated using the Recombination Signal Sequences Site33 (http://www.itb.cnr.it/rss). Vκ segments are colour-coded according to the three Vκ domains with names indicated for highly used Vκ segments. g, Comparison of relative VH usage in primary pro-B cells7 with VH-RSS RIC scores. VH segments are colour-coded according to the four VH domains, and square black outlines indicate VH segments with CBEs within 20 bp of their RSSs. The circled VH5-1, VH5-2 and VH2-2 have been shown to depend on associated CBEs for robust utilization3. D and VH utilization data are presented as mean ± s.e.m. from 4 (a,d), 6 (b) and 3 (c,e) biological repeats. P values were calculated with unpaired, two-sided Welch’s t-test.
Igk-RSSs programme diffusional joining in Igh
We tested the relative ability of the frequently utilized Vκ11-125 RSS versus that of the upstream DQ52-RSS to mediate joining of proximal VH segments to the inverted DQ52JH4-based RC. For this experiment, we did not deplete WAPL to leave IGCR1 CBE impediments fully functional to enforce short-range diffusion mediated joining of the most proximal VH segments. With high WAPL levels, distal VH segments are prevented from being extruded past IGCR1 by many robust CBE impediments associated with proximal and middle VH-RSSs6,26,27 (Extended Data Fig. 7b). In the DQ52JH4-inverted line, we found very low levels of inversional joining to proximal VH5-2 mediated by the inverted upstream DQ52-12RSS (Fig. 5c). However, upon replacement of this DQ52-12RSS with the Vκ11-125-12RSS, inversional rearrangements increased approximately 13-fold, predominantly to VH5-2 but at lower levels to additional proximal VH segments (Fig. 5d; compare with Fig. 5c). To test the cooperative ability of Igk-RSSs to promote inversional rearrangement, we replaced the VH5-2-23RSS with the Jκ1-23RSS in the v-Abl line in which the DQ52-12RSS was replaced with the Vκ11-125-12RSS. Remarkably, the Jκ1-RSS replacement led to a further 35-fold increase in VH5-2 to inverted DQ52JH4 joining (Fig. 5e; compare with Fig. 5d). Indeed, the overall increase in VH5-2 to inverted DQ52JH4 joining was more than 380-fold (Fig. 5e; compare with Fig. 5c). This joining level approaches that of direct deletional VH5-2-to-DFL16.1JH4 joining in the absence of IGCR13. Together, these findings demonstrate that paired Igk 12 and 23 RSSs programme the Igh to undergo robust VH-to-DJH inversional joining mediated by short-range diffusion.
Relevance of RSS RIC scores to joining mechanism
The theoretical strength of given 12RSSs and 23RSSs, respectively, has been estimated on the basis of an algorithm that assesses recombination information content (RIC) scores of their sequence31–33. Previous studies failed to detect strong correlations between RIC scores of VH-RSSs or, to a lesser extent, Vκ-RSSs and their utilization frequency34–37. Predicted RIC thresholds for 12RSSs and 23RSSs are −38.81 and −58.45, respectively31,33, with increasing RIC scores proposed to reflect increasing RSS strength. Because 12RSS and 23RSS RIC scores cannot be directly compared31,32, we examined Vκ-12RSS or VH-23RSS RIC scores and corresponding Vκ or VH usage in, respectively, single Jκ5 allele v-Abl cells to focus on primary Vκ rearrangements, or normal pro-B cells to focus on VH rearrangements in the context of physiological WAPL down-regulation7. Most highly used Vκ-12RSSs in single Jκ5 allele v-Abl cells have RIC scores tightly clustered between −16 and −8, with −8 being the highest observed (Fig. 5f); Vκ-12RSSs with RICs below −20 are rarely utilized (Fig. 5f). Similar results were observed in single Jκ1 v-Abl cells (Extended Data Fig. 8e). Approximately 26% of Vκ-RSSs with high RIC scores are rarely utilized. The reason for this is unknown; but one possibility is that these Vκ segments are not in chromatin regions that promote sufficient accessibility to the RAG-bound RC36,37. VH-23RSSs, which span a broader range of RIC scores from −57 to −16, support a similar range of utilization levels, with the exception of proximal VH5-2 and VH2-2 that have lower RIC scores but very high utilization (Fig. 5g). But, robust rearrangement of these two VH segments is promoted by CBEs within 20 bp of their RSSs, which promotes accessibility by enhancing VH-RSS contact with the RC during RAG scanning3. Indeed, inactivation of these RSS-associated CBEs reduces utilization to near baseline, consistent with RSSs themselves being very weak3. Likewise, adding an associated CBE to the barely utilized, low RIC score proximal VH5-1 RSS makes it the most highly utilized3. Transcriptional impediments are likely to function similarly for more distal VH-RSSs5–7; although more distal VH-RSSs also have higher RIC scores (Fig. 5g). Notably, 28 of the most proximal VH segments have CBEs within 20 bp of their RSSs; but, none of the 103 Vκ segments are associated with such proximal CBEs37.
Discussion
The molecular basis by which Igk, but not Igh, is able to utlilize a diffusion-based mechanism to promote both deletional and inversional joining was a long-standing mystery. Our studies reveal that Igk and Igh evolved RSSs with distinctly different strength to carry out their distinct mechanisms of long-range V(D)J recombination. Until now, RSSs were not known to function in the broad context of mediating distinct V(D)J recombination mechanisms between loci. Long ago, we found that differential RSS strength mediates ordered Dβ-to-Jβ and Vβ-to DJβ joining by a “beyond 12/23” mechanism38,39; and, more recently, weaker Vβ-RSSs were implicated in facilitating allelic exclusion of Vβ-to-DJβ joining40. Igh DQ52 evolved a relatively strong downstream RSS to enforce deletional joining to closely linked JH-RSSs via short-range diffusion; correspondingly, when inverted the strong downstream DQ52-RSS mediates robust inversional joining5. Yet, insertion of an inverted DQ52 in an upstream position beyond diffusion range led the weaker upstream DQ52-RSS—now facing downstream—to dominantly generate deletional rearrangements to JH via linear RAG scanning5. The relative strength of Igk-RSSs is underscored by our finding that a Vκ-12RSS is orders of magnitude stronger than the downstream DQ52-12RSS in mediating diffusional joining in the context of the Cer–Sis impediment. Similarly, whereas Igh IGCR1 is weaker in impeding RAG scanning than Cer–Sis, in the Igh–Igk hybrid-Vκ locus, it supports substantial diffusional Vκ capture and joining by RAG bound to a downstream Igh-RC in which the JH-RSS is replaced with a Jκ-RSS. Moreover, robust diffusional joining of VH to an inverted DJH-RC occurs only when VH-RSS and DJH-RSS are replaced with 12/23-matched Igk-RSSs. Whereas single Vκ- or Jκ-RSSs increase diffusion-mediated joining in the above contexts, highly robust joining occurs only with 12/23 matched Igk-RSSs, either through multiplicative effects and/or by more robust pairing. In summary, our findings indicate that the Igk evolved both a robust Cer diffusion platform and strong RSSs that function robustly in the context of more transient RC interactions that likely occur during diffusion-mediated primary Vκ-to-Jκ joining (Extended Data Fig. 9). By contrast, weak Igh-RSSs and a less robust IGCR1 impediment probably evolved to facilitate mediation of VH utilization by WAPL down-regulated modulation of scanning impediments during long-range linear RAG scanning. Finally, our studies suggest the testable hypothesis that Igk secondary rearrangements with Cer–Sis deleted or displaced occur by linear RAG scanning.
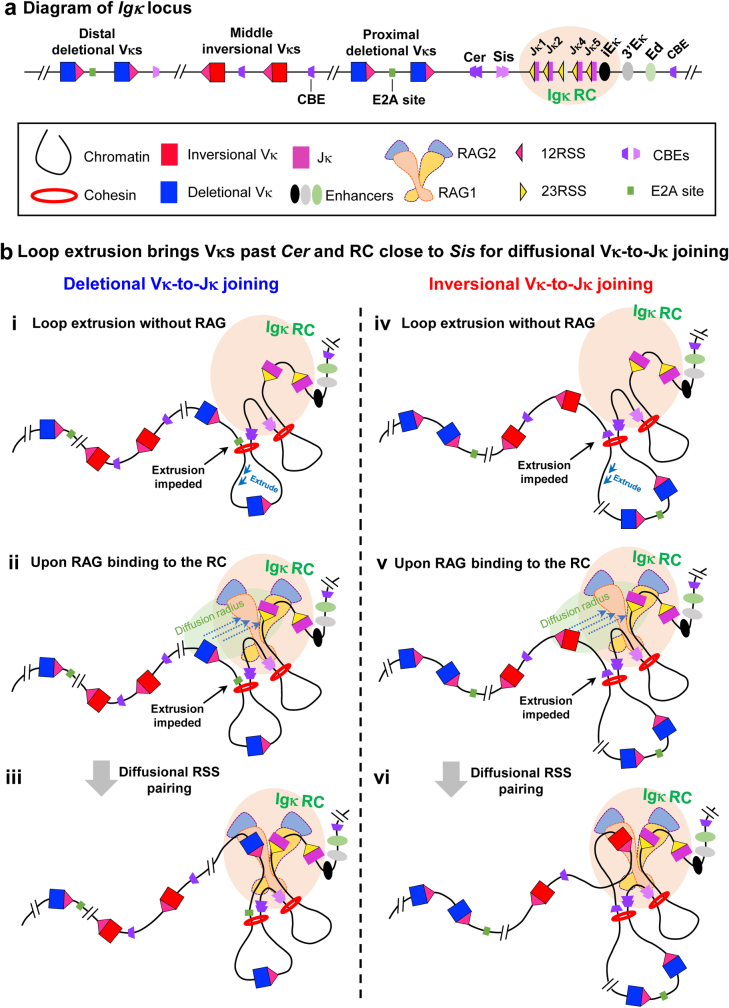
Extended Data Fig. 9. Working model for short-range diffusion-mediated primary Igκ V(D)J recombination.
a, Diagram of Igκ (not to scale). Elements and proteins illustrated are indicated in the box. b, Working model. (i) Loop extrusion of downstream chromatin through a cohesin ring impeded in the upstream direction at Sis juxtaposes the RC, a downstream impediment, to Sis. Simultaneously, loop extrusion of upstream chromatin through a cohesin ring impeded in the downstream direction at Cer brings the Vκ locus past Cer. (ii) During extrusion past Cer, relatively weak extrusion impediments, including CBEs and E2A sites (illustrated) across the Vκ locus dynamically impede extrusion at Cer, providing more opportunity for Vκ-RSSs to remain in short-range diffusion distance for interactions with RC-bound RAG. (iii) Binding of paired strong Vκ-RSSs to the RAG-1 active site across from strong Jκ-RSSs promote robust cleavage and/or joining. (iv-vi) Only a fraction of Vκ-RSSs brought into diffusion range pair with Jκ-RSSs, allowing extrusion to continue upstream where impediments slow down extrusion past Cer, providing opportunity for additional Vκ-RSSs to interact with RC-bound RAG. These panels diagram use of inversional-oriented Vκs, which can interact by the same short-range diffusion process outlined for deletional Vκs. The diagram is simplified to provide a general overview of the proposed mechanism, for which details await high resolution studies. Due to relatively weak Igκ impediments, this model is compatible with cohesin loading across the Vκ locus2. Also, RAG is likely not continuously bound to the RC2,7, allowing extrusion to continue past Cer. These latter features could allow active RAG-bound RCs to initiate the process at different points across the Vκ locus to optimize diverse Vκ utiliation2,7. Human Igκ, which undergoes deletional and inversional joining, has Cer-Sis-like elements in the Vκ-Jκ interval12,49,50 and high Vκ-RSS RIC scores33, consistent with employing a similar primary rearrangement mechanism to mouse Igκ.
Methods
Experimental procedures
Statistical methods were not used to predetermine sample size. Experiments were not randomized. Investigators were not blinded to allocation during experiments and outcome assessment.
Mice
Wild-type 129SV mice were purchased from Taconic Biosciences. All mouse work was performed in compliance with all the relevant ethical regulations established by the Institutional Animal Care and Use Committee (IACUC) of Boston Children’s Hospital and under protocols approved by the IACUC of Boston Children’s Hospital. Mice were maintained on a 14-h light/10-h dark schedule in a temperature (22 ± 3 °C) and humidity (35% ~ 70% ± 5%)-controlled environment, with food and water provided ad libitum. Male and female mice were used equally for all experiments.
Generation and characterization of the entire Vκ locus inversion mouse model
The CRISPR–Cas9-mediated entire Vκ locus inversion modifications were made on one Igk allele in the TC1 embryonic stem (ES) cell line. Targeting of the ES cells was performed using sgRNA1 and sgRNA2 as previously described41. Positive clones with 3.1 Mb Vκ locus inversion were identified by PCR and confirmed by Sanger sequencing. After testing negative for mycoplasma, the ES clone with Vκ inversion was injected into RAG2-deficient blastocysts to generate chimeras42. The chimeric mice were bred with wild-type 129SV mice for germline transmission of the targeted inversion, and bred to homozygosity. Sequences of all sgRNAs and oligonucleotides mentioned in this section and sections below are listed in Supplementary Table 1.
Generation of VH7-3 Igh pre-rearranged; Rag2−/− mouse model
The heterozygous or homozygous VH7-3 Igh pre-rearranged mice (VH7-3wt/re or VH7-3re/re) were generated through induced pluripotent stem (iPS) cells and maintained in the Alt laboratory. To perform 3C-HTGTS experiments with RAG2-deficient background, VH7-3wt/re or VH7-3re/re mice were crossed with Rag2−/− mice to obtain VH7-3wt/re; Rag2−/− or VH7-3re/re; Rag2−/− mice on the 129SV background.
Purification of bone marrow precursor B cells
For RAG on-target and off-target analysis, single cell suspensions were derived from bone marrows of 4- to 6-week-old male and female wild-type and Igk Vκ locus inversion 129SV mice and incubated in Red Blood Cell Lysing Buffer (Sigma-Aldrich, R7757) to deplete the erythrocytes. B220+CD43lowIgM− pre-B cells were isolated by staining with anti-B220–APC (1:1,000 dilution; eBioscience, 17-0452-83), anti-CD43–PE (1:400 dilution; BD Biosciences, 553271) and anti-IgM–FITC (1:500 dilution; eBioscience, 11-5790-81) and purifying via fluorescence-activated cell sorting (FACS), and the purified primary pre-B cells were directly used for HTGTS-V(D)J-seq as described21,43.
For 3C-HTGTS experiments, B220-positive primary pre-B cells were purified via anti-B220 MicroBeads (Miltenyi, 130-049-501) from 4- to 6-week-old male and female VH7-3wt/re; Rag2−/− or VH7-3re/re; Rag2−/− mice. Purified pre-B cells from 3 or 4 mice were pooled together for each 3C-HTGTS experiment. Each mouse was double-checked and confirmed by PCR and Sanger sequencing prior to various assays.
Generation of single Jκ5 v-Abl cell line and its derivatives
The construction of sgRNA–Cas9 plasmids and methods for nucleofection-mediated targeting experiments described for this section and all subsequent paragraphs describing v-Abl line modifications were performed as previously described7. All v-Abl cell lines have not been tested for mycoplasma contamination.
The initial ‘parental’ Rag2−/−;Eμ-Bcl2+ v-Abl cell line in the 129SV background was generated previously6. Random 1–4 bp indels (barcodes) were introduced into a site ~85 bp downstream of the Jκ5-RSS heptamer and ~40 bp upstream of the Jκ5 bait primer on both alleles in this parental line, similarly to the approach previously described to modify JH46. The resulting ‘Jκ5-barcoded’ v-Abl line was further targeted with sgRNA1 and sgRNA2 to invert the whole Vκ locus on one allele and leaving the other allele intact. Thus, the Igk allele-specific barcode permits the separation of sequencing reads derived from the wild-type allele and the Vκ inverted allele assayed with the same bait primer under the same cellular context. This barcoded line was used to generate the data in Fig. 1b,e.
To facilitate further modifications on the Igk locus, the Jκ5-barcoded v-Abl line was targeted with sgRNA1 and sgRNA3 that deleted the entire Igk locus on one allele and left the other allele intact. The barcode was not relevant to further studies based on this single Igk allele line or its derivatives. The single Igk allele line was further targeted by another two pairs of sgRNAs to separately delete Jκ1 to Jκ4 (sgRNA4 and sgRNA5) and downstream Igk-RS (sgRNA6 and sgRNA7) to exclude confounding secondary rearrangements and keep the configuration unchanged between Jκ5 and iEκ. This line is referred to as the ‘single Jκ5 allele line’.
The single Jκ5 allele line was further modified by specifically designed Cas9–sgRNA to generate the single Jκ5-Vκ inv line (sgRNA8 and sgRNA9), single Jκ5-inv line (sgRNA10 and sgRNA11), single Jκ5-single Igh line (sgRNA12 and sgRNA13), single Jκ5-PKO line (sgRNA2 and sgRNA14), single Jκ5-Cer knockout (KO) line (sgRNA15 and sgRNA16), single Jκ5-Sis KO line (sgRNA17 and sgRNA18), and single Jκ5-CerSis KO line (sgRNA15 and sgRNA18).
The single Jκ1 allele v-Abl line was generated from the single Igk allele line by separately deleting Jκ2 to Jκ5 (sgRNA10 and sgRNA19) and deleting downstream Igk-RS (sgRNA6 and sgRNA7).
All candidate clones with desired gene modifications were screened by PCR and confirmed by Sanger sequencing.
Generation and analysis of DJH pre-rearranged WAPL-degron v-Abl cell lines
The DJH pre-rearranged v-Abl lines in C57BL/6 background were derived from the previously described WAPL-degron v-Abl line7. The open reading frame sequences of Rag1 and Rag2 were cloned into pMAX-GFP vector (Addgene, 177825) following the standard protocol to generate pMAX-Rag1 and pMAX-Rag2 plasmids. These two plasmids (each 2.5 μg) were nucleofected into 2.0 × 10⁶ WAPL-degron v-Abl cells to allow endogenous D-to-JH rearrangements mediated by transient RAG expression. Cells harbouring the desired DQ52JH4 rearrangement (DJH-WT line) were subsequently identified by PCR screening and verified by Sanger sequencing. The DJH-inv v-Abl line was generated from the DJH-WT line by using Cas9–sgRNA to target sequences downstream of JH4 and upstream of DQ52 (sgRNA20 and sgRNA21). The DJH-WT and DJH-inv lines were treated with IAA and Dox to deplete WAPL as described7.
Generation of Igh–Igk hybrid v-Abl cell line and its derivatives
The Igh–Igk hybrid v-Abl cell line was derived from the single Jκ5 allele v-Abl line. In brief, the single Jκ5 allele line was targeted by sgRNA12 and sgRNA13 to generate the single Jκ5-single Igh line where the entire Igh locus was deleted from one allele. The single Jκ5-single Igh line was then targeted by sgRNA22 (cut 1, upstream of IGCR1 in Igh) and sgRNA8 (cut 2, upstream of Vκ2-137 in Igk) to generate a balanced chromosomal translocation between chromosomes 12 and 6. In the resulting Igh–Igk hybrid v-Abl line, the entire Igk locus along with the rest of chromosome 6 was appended onto chromosome 12 at a point upstream of IGCR1 in Igh, and the Igh VH locus along with the small telomeric portion of chromosome 12 was reciprocally appended onto chromosome 6. To generate the Igh–Igk hybrid-Vκ line, the Igh–Igk hybrid line was sequentially modified to invert the entire Vκ locus (sgRNA15 and sgRNA23), mutate DQ52 RSSs (sgRNA24 and ssODN1) and delete all upstream D segments (sgRNA25 and sgRNA26). To generate the Igh–Igk hybrid-Vκ-JκRSS-PKO line from the Igh–Igk hybrid-Vκ-JκRSS line, sgRNA2 and sgRNA14 were used to delete the proximal Vκ domain.
To generate the Igh–Igk hybrid-D-JH line, the Igh–Igk hybrid line was targeted by sgRNA27 and sgRNA28 to delete IGCR1 and the entire Vκ locus. The Igh–Igk hybrid-D-JH line was further modified to generate the Igh–Igk hybrid-D line where JH1-4 has been deleted (sgRNA29 and sgRNA30).
All candidate clones with desired gene modifications were screened by PCR and confirmed by Sanger sequencing. See Fig. 4a and Extended Data Figs. 5a and 8a for detailed strategy and procedure.
Whole-chromosome painting
Whole-chromosome painting was performed on single Jκ5-single Igh v-Abl line and Igh–Igk hybrid v-Abl line using fluorescent probes tiling the entire chromosome 6 (Chr6-FITC, Applied Spectral Imaging) and chromosome 12 (Chr12-TxRed, Applied Spectral Imaging) according to standard protocol. In brief, cells were treated with colcemid at 0.05 μg ml−1 final concentration for 3 h before being processed for metaphase drop. The slides were dehydrated in ethanol series, denatured at 70 °C for 1.5 min, and hybridized to denatured probe mixture at 37 °C for 12–16 h. The slides were then washed, stained with DAPI, and imaged with Olympus BX61 microscope. ImageJ (1.53q) was used for image processing.
RSS replacement experiments
All RSS replacement modifications were generated via Cas9–sgRNA using short single-stranded DNA oligonucleotide (ssODN) as donor template. In brief, 2.5 μg Cas9–sgRNA plasmid and 5 μl 10 μM ssODN were co-transfected into 2.0 × 10⁶ v-Abl cells. PCR screening was performed sequentially on pooled clones and then single clones, and subsequently verified by Sanger sequencing. Specifically, sgRNA31 and ssODN2 were used to replace JH1-RSS with Jκ5-RSS in Igh–Igk hybrid-Vκ v-Abl line to generate the Igh–Igk hybrid-Vκ-JκRSS line; sgRNA32 and ssODN3 were used to replace Jκ5-RSS with JH1-RSS in single Jκ5-single Igh line to generate the single Jκ5-single Igh-JHRSS line; sgRNA33 and ssODN4 were used to replace DQ52 upstream RSS with Vκ12-44-RSS in Igh–Igk hybrid-D line to generate the Igh–Igk hybrid-D-VκRSS line; sgRNA34 and ssODN5 were used to replace DQ52 upstream RSS with Vκ11-125-RSS in DJH-inv line to generate the DJH-inv-VκRSS line; sgRNA35 and ssODN6 were used to replace VH5-2-RSS with Jκ1-RSS in DJH-inv-VκRSS line to generate the DJH-inv-VκRSS-JκRSS line.
RAG complementation
RAG was reconstituted in RAG1-deficient v-Abl cells via retroviral infection with the pMSCV-RAG1-IRES-Bsr and pMSCV-Flag-RAG2-GFP vectors followed by 3–4 days of blasticidin (Sigma-Aldrich, 15205) selection to enrich for cells with virus integration7. RAG2 was reconstituted in RAG2-deficient v-Abl cells via retroviral infection with the pMSCV-Flag-RAG2-GFP vector followed by two days of puromycin (ThermoFisher, J67236) selection to enrich for cells with virus integration5.
HTGTS-V(D)J-seq and data analyses
HTGTS-V(D)J-seq libraries were prepared as previously described6,7,21,43 with 0.5–2 μg of genomic DNA (gDNA) from sorted primary pre-B cells or 10 μg of gDNA from G1-arrested RAG-complemented RAG-deficient v-Abl cells. The final libraries were sequenced on Illumina NextSeq550 with control software (2.2.0) or NextSeq2000 with control software (1.5.0.42699) using paired-end 150-bp sequencing kit. HTGTS-V(D)J-seq libraries were processed via the pipeline described previously43. For Igh rearrangement analysis in DJH-WT and DJH-inv WAPL-degron v-Abl lines, the data were aligned to the mm9_DQ52JH4 genome and analysed with all duplicate junctions included in the analyses as previously described43. For analysis in DJH-inv-VκRSS and DJH-inv-VκRSS-JκRSS v-Abl lines, the data were aligned to the mm9_DQ52JH4_VκRSS genome. For all other rearrangement analysis, primary pre-B cells and v-Abl cells used are from 129SV background. Since there is almost no difference in the Igk locus between C57BL/6 and 129SV genomic backgrounds44, the data were aligned to the AJ851868/mm9 hybrid (mm9AJ) genome6 except: data from Igh–Igk hybrid-Vκ-JκRSS and Igh–Igk hybrid-Vκ-JκRSS-PKO v-Abl lines were aligned to the mm9AJ_JH1toJκ5RSS genome, data from single Jκ5-single Igh-JHRSS v-Abl line were aligned to the mm9AJ_Jκ5toJH1RSS genome, and data from Igh–Igk hybrid-D-VκRSS v-Abl line were aligned to the mm9AJ_DQ52uptoVκRSS genome. To show the absolute level of V(D)J recombination, each HTGTS-V(D)J-seq library was down-sampled to 500,000 total reads (junctions + germline reads); to show the relative Vκ usage pattern across the Vκ locus, individual Vκ usage levels were divided by the total Vκ usage level in each HTGTS-V(D)J-seq library to obtain the relative percentage. Such analyses are useful for examining effects of potential regulatory element mutations. For example, differences in absolute rearrangement levels between two samples with the same relative rearrangement patterns would reflect differences in RAG or RC activity without changes in long-range regulatory mechanisms7,26.
RAG off-targets were extracted from corresponding normalized HTGTS-V(D)J-seq libraries by removing on-target junctions on bona fide RSSs. We noticed the remaining junctions in the Igk locus were skewed to a few very strong RSS sites, which represent unannotated bona fide RSSs not associated with functional Vκ segments. We eliminated these strong RSSs from our cryptic RSS analyses by filtering out RSS sites with a CAC and additional at least 9 bp matches to the remaining ideal heptamer AGTG and ideal nonamer ACAAAAACC in the context of a 12-or-23-bp spacer—that is, at most 4-bp mismatches to the ideal RSS site. In addition, because coding end junctions are processed and can spread across several bps beyond the CAC cleavage site4, the new code has the advantage of collapsing these coding end junctional signals within 15 bp into one peak mapped to the CAC cleavage site for better visualization of off-target coding junction peaks. For visualization of the actual distribution of coding end junctions, one can reveal them through analysis with our prior pipeline. Details of both pipelines used are provided in Code availability. Junctions are denoted as deletional if the prey cryptic RSS is in convergent orientation with the bait RSS and as inversional if the prey cryptic RSS is in the same orientation with the bait RSS.
3C-HTGTS and data analyses
3C-HTGTS was performed as previously described3 on G1-arrested RAG2-deficient v-Abl cells3,5–7,26. Reference genomes were the same as used in HTGTS-V(D)J-seq data analyses described above. To better normalize 3C-HTGTS libraries and reduce the impact of the level of self-ligation (circularization), the high peaks upstream of the bait site were filtered out, following the same rationale as described for 4C-seq45. For iEκ-baited 3C-HTGTS libraries, we removed bait site peaks in the chr. 6:70,675,300–70,675,450 region; For Cer CBE1-baited 3C-HTGTS libraries, we removed bait site peaks in chr. 6:70,659,550–70,659,700 region; For Sis CBE2-baited 3C-HTGTS libraries, we removed bait site peaks in chr. 6:70,664,600–70,664,800 region; For IGCR1 CBE1-baited 3C-HTGTS libraries, we removed bait site peaks in the chr12:114,740,239–114,740,353 region. Then, only the junctions inside of a genomic region (chr. 6:64,515,000–73,877,000 for the entire Igk locus; chr. 12:111,453,935–120,640,000 for the entire Igh locus; chr. 6:64,515,000–70,658,827 and chr. 12:111,453,935-114,824,843 for the Igh–Igk hybrid-Vκ locus) encompassing the entire Ig locus were retained (see details in Code availability). After processing as described above, the retained junctions of the 3C-HTGTS libraries were further normalized to 50,827 total number of junctions, which is the junction number recovered from the smallest library in the set of libraries being compared. The sequences of primers used for generating 3C-HTGTS libraries are listed in Supplementary Table 1.
Unlike ChIP-seq, the junctions of 3C-HTGTS data are discontinuously distributed on the genome, but mainly on the enzyme cutting sites (CATG by NlaIII). To call peaks for 3C-HTGTS data, we first collapsed the junction signals to nearby enzyme cutting sites, and discarded signals far away (>10 bp) from enzyme cutting sites. Then, we only focused on the cutting sites with signals, calculated the median with a moving window of 101 cutting sites (one centre, 50 left, and 50 right sites). We did a Poisson test for each site, with the median as a conservative over-estimation of the lambda parameter of Poisson distribution. Based on the raw P values from the Poisson test, we calculated Bonferroni-adjusted P values, called peak summits at the sites with adjusted P value < 0.05, and determined the range of peak region by progressively extending the two sides to the sites that have local maximum raw P value and also the raw P values ≥ 0.05. Nearby overlapping peak regions were merged as one peak region, and only the ‘best’ (defined by lowest P value) summit was kept after merging. Finally, for each group of multiple repeats, we merged the overlapping peak regions from all repeats, and counted the number of supporting repeats for each merged peak region. We defined and only kept the ‘robust’ peak regions that were supported by >50% of the repeats (that is, ≥ 2 supporting repeats among 2 or 3 repeats, or ≥ 3 supporting repeats among 4 or 5 repeats), and the ‘best’ (defined by lowest P value) summit information was reported.
We further annotated and quantified the features underlying each of the robust 3C-HTGTS peak region ±1 kb. We focused on CBEs, E2A-binding sites, and transcription. For CBEs, we first scanned the possible CBEs by MEME-FIMO using the CTCF motif record (MA0139.1) in JASPAR 2018 core vertebrate database. We applied MACS2 to call peaks in the three repeats of published CTCF ChIP-seq data in parental v-Abl line6, and only kept ‘reliable’ CBEs with motif score > 13 and overlapping with peaks called in ≥2 repeats. We counted the number of reliable CBEs within each of the robust 3C-HTGTS peak region ±1 kb, and defined them as having an underlying CBE if the number ≥ 1. For E2A-binding sites, we applied MACS2 to get the signal bigwig file from the published E2A ChIP-seq data46, and then annotated the maximum E2A ChIP-seq signal value within each of the robust 3C-HTGTS peak region ±1 kb. We defined peaks having underlying E2A site if the maximum signal ≥ 0.5. For transcription, we annotated the maximum and the average signal of the three repeats of published GRO-seq data in parental v-Abl line6, and defined a peak as having transcription if the maximum signal ≥40 or the average signal ≥10 in ≥2 repeats. See details in Code availability.
Quantification and statistical analysis
Graphs were generated using GraphPad Prism 10, Origin 2023b and R version 3.6.3. After normalization in each sample, 3C-HTGTS, ChIP-seq and GRO-seq signals of multiple repeats were merged as mean ± s.e.m. of the maximum value in each repeat in each bin, after dividing the plotting region into 1,000 bins (Fig. 2m and Extended Data Fig. 2) or 200 bins (Supplementary Data 1). Unpaired, two-sided Welch’s t-test was used to compare total rearrangement levels between indicated samples, with P values presented in relevant figure legends. Pearson correlation coefficient (r) and the corresponding P value were calculated to determine the similarity in Vκ usage pattern between indicated samples after calculating the average usage among repeats, and are presented in relevant figure legends.
Availability of materials
All plasmids, cell lines and mouse lines generated in this study are available from the authors upon request.
Reporting summary
Further information on research design is available in the Nature Portfolio Reporting Summary linked to this article.
Online content
Any methods, additional references, Nature Portfolio reporting summaries, source data, extended data, supplementary information, acknowledgements, peer review information; details of author contributions and competing interests; and statements of data and code availability are available at 10.1038/s41586-024-07477-y.
Supplementary information
Cer-bait 3C-HTGTS interaction peaks and underlying features in the Vκ locus from RAG-deficient primary pre-B cells and v-Abl cells. Related to Fig. 2m and Extended Data Fig. 2b. Zoom-in profiles of Cer-bait 3C-HTGTS in RAG2-deficient primary pre-B cells (first lane, pink) and RAG2-deficient v-Abl cells (second lane, blue) were shown along with annotated CBE motifs (third lane, red for rightward CBE, blue for leftward CBE), CTCF ChIP-seq (fourth lane, red), Rad21 ChIP-seq (fifth lane, blue), E2A ChIP-seq (sixth lane, purple) and GRO-seq (bottom lane, red for rightward transcription, blue for leftward transcription) within ±10kb region of all peaks called in either primary pre-B cells or v-Abl cells. For each peak, underlying features within ±1kb are indicated, including rightward CBE (“C” in red), leftward CBE (“C” in blue), E2A binding sequence (“E”) and transcription (“T”). Peaks without any obvious underlying features are labeled as unknown (“U”). Vκ domains are indicated by blue (distal), gray (middle) and orange (proximal) shadows. CBE annotation, CTCF ChIP-seq, Rad21 ChIP-seq and GRO-seq were replotted from published data in RAG-deficient v-Abl cells6. E2A ChIP-seq was replotted from published data in RAG-deficient primary pro-B cells46. See Methods for more details on 3C-HTGTS peak calling and underlying feature analysis. Data are presented as mean value from 2 biological repeats (3C-HTGTS) or as mean ± s.e.m. from 3 biological repeats (CTCF ChIP-seq, Rad21 ChIP-seq and GRO-seq).
sgRNAs, oligonucleotides and primers used in this study.
Source data
Acknowledgements
The authors thank members of the Alt laboratory for contributions to the study, particularly H.-L. Cheng for providing the TC1 ES cell line and advice on ES cell culture, X. Zhang for RAG-expressing retrovirus plasmids, A. M. Chapdelaine-Williams, K. Johnson and L. V. Francisco for help with blastocyst injection and mouse care, and J. Hu for preliminary bioinformatics analyses. This work was supported by NIH Grant R01 AI020047 (to F.W.A.). H.H. and X. Li are supported by a Cancer Research Institute Irvington Postdoctoral Fellowship (CRI5352, CRI4203 to H.H. and CRI5278 to X. Li). Z.B. was supported by a CRI fellowship. F.W.A. is an investigator of the Howard Hughes Medical Institute.
Extended data figures and tables
Author contributions
F.W.A., H.H. and Y.Z. designed the overall study with help from X. Li. Y.Z., X. Li and H.H. performed most of the experiments. H.H. and J.L. generated Vκ-inversion mice and the Vκ-inversion v-Abl lines and performed related experiments with help from K.E.G. H.H. generated the single Jκ5 v-Abl cell system and performed related experiments. X. Li generated single Jκ1 v-Abl cells and performed related experiments. H.H. and Y.Z. generated the Igk-RC and Igh-RC inversions and performed related experiments. Y.Z. generated translocation lines and performed related experiments and analysed relative strength of RSSs. Y.Z. and X. Li generated RSS replacements and performed related experiments with help from T.Z. H.H. generated Cer and/or Sis-deleted and proximal Vκ domain-deleted, single Jκ5 allele cells, and performed related experiments. X. Lin and A.Y.Y. designed and applied bioinformatics pipelines for data analysis and image integration. A.Y.Y. performed statistical analyses for data correlation and developed the 3C-HTGTS peak-calling algorithm. Z.B., H.H. and Y.Z. performed and analysed 3C-HTGTS experiments including defining Cer-interacting sequences. Z.B. generated parental v-Abl lines, and developed reagents and approaches important for downstream studies. H.H., Y.Z., X. Li, Z.B. and F.W.A. analysed and interpreted data. Y.Z., H.H., X. Li and F.W.A. designed figures. H.H., Y.Z., X. Li and F.W.A. wrote the paper. Other authors helped to refine the paper. The research was performed in the laboratory of F.W.A.
Peer review
Peer review information
Nature thanks David Schatz and the other, anonymous, reviewer(s) for their contribution to the peer review of this work.
Data availability
High-throughput sequencing data reported in this study have been deposited in the Gene Expression Omnibus (GEO) database under the accession number GSE263124, with subseries GSE254039 for HTGTS-V(D)J-seq data and GSE263123 for 3C-HTGTS data. The consensus CTCF-binding motif was extracted from JASPAR 2018 core vertebrate database (http://jaspar2018.genereg.net/matrix/MA0139.1). Source data are provided with this paper.
Code availability
HTGTS-V(D)J-seq and 3C-HTGTS data were processed through published pipelines as previously described43. Specifically, the pipelines analysing HTGTS data are available at http://robinmeyers.github.io/transloc_pipeline/. Newly developed pipelines for off-targets filtering on cryptic RSS and 3C-HTGTS normalization and peak calling are available at https://github.com/Yyx2626/HTGTS_related.
Competing interests
The authors declare no competing interests.
Footnotes
Publisher’s note Springer Nature remains neutral with regard to jurisdictional claims in published maps and institutional affiliations.
These authors contributed equally: Yiwen Zhang, Xiang Li, Hongli Hu
Contributor Information
Frederick W. Alt, Email: alt@enders.tch.harvard.edu
Hongli Hu, Email: hongli.hu@childrens.harvard.edu.
Extended data
is available for this paper at 10.1038/s41586-024-07477-y.
Supplementary information
The online version contains supplementary material available at 10.1038/s41586-024-07477-y.
References
- 1.Schatz DG, Swanson PC. V(D)J recombination: mechanisms of initiation. Annu. Rev. Genet. 2011;45:167–202. doi: 10.1146/annurev-genet-110410-132552. [DOI] [PubMed] [Google Scholar]
- 2.Zhang Y, Zhang X, Dai H-Q, Hu H, Alt FW. The role of chromatin loop extrusion in antibody diversification. Nat. Rev. Immunol. 2022;22:550–566. doi: 10.1038/s41577-022-00679-3. [DOI] [PMC free article] [PubMed] [Google Scholar]
- 3.Jain S, Ba Z, Zhang Y, Dai H-Q, Alt FW. CTCF-binding elements mediate accessibility of RAG substrates during chromatin scanning. Cell. 2018;174:102–116.e14. doi: 10.1016/j.cell.2018.04.035. [DOI] [PMC free article] [PubMed] [Google Scholar]
- 4.Hu J, et al. Chromosomal loop domains direct the recombination of antigen receptor genes. Cell. 2015;163:947–959. doi: 10.1016/j.cell.2015.10.016. [DOI] [PMC free article] [PubMed] [Google Scholar]
- 5.Zhang Y, et al. The fundamental role of chromatin loop extrusion in physiological V(D)J recombination. Nature. 2019;573:600–604. doi: 10.1038/s41586-019-1547-y. [DOI] [PMC free article] [PubMed] [Google Scholar]
- 6.Ba Z, et al. CTCF orchestrates long-range cohesin-driven V(D)J recombinational scanning. Nature. 2020;586:305–310. doi: 10.1038/s41586-020-2578-0. [DOI] [PMC free article] [PubMed] [Google Scholar]
- 7.Dai H-Q, et al. Loop extrusion mediates physiological Igh locus contraction for RAG scanning. Nature. 2021;590:338–343. doi: 10.1038/s41586-020-03121-7. [DOI] [PMC free article] [PubMed] [Google Scholar]
- 8.de Almeida CR, Hendriks RW, Stadhouders R. Dynamic control of long-range genomic interactions at the immunoglobulin κ light-chain locus. Adv. Immunol. 2015;128:183–271. doi: 10.1016/bs.ai.2015.07.004. [DOI] [PubMed] [Google Scholar]
- 9.Collins AM, Watson CT. Immunoglobulin light chain gene rearrangements, receptor editing and the development of a self-tolerant antibody repertoire. Front. Immunol. 2018;9:2249. doi: 10.3389/fimmu.2018.02249. [DOI] [PMC free article] [PubMed] [Google Scholar]
- 10.Nemazee D. Mechanisms of central tolerance for B cells. Nat. Rev. Immunol. 2017;17:281–294. doi: 10.1038/nri.2017.19. [DOI] [PMC free article] [PubMed] [Google Scholar]
- 11.Xiang Y, Zhou X, Hewitt SL, Skok JA, Garrard WT. A multifunctional element in the mouse Igκ locus that specifies repertoire and Ig loci subnuclear location. J. Immunol. 2011;186:5356–5366. doi: 10.4049/jimmunol.1003794. [DOI] [PMC free article] [PubMed] [Google Scholar]
- 12.Xiang Y, Park S-K, Garrard WT. Vκ gene repertoire and locus contraction are specified by critical DNase I hypersensitive sites within the Vκ–Jκ Intervening region. J. Immunol. 2013;190:1819–1826. doi: 10.4049/jimmunol.1203127. [DOI] [PMC free article] [PubMed] [Google Scholar]
- 13.Ru H, et al. Molecular mechanism of V(D)J recombination from synaptic RAG1–RAG2 complex structures. Cell. 2015;163:1138–1152. doi: 10.1016/j.cell.2015.10.055. [DOI] [PMC free article] [PubMed] [Google Scholar]
- 14.Kim M-S, et al. Cracking the DNA code for V(D)J recombination. Mol. Cell. 2018;70:358–370.e4. doi: 10.1016/j.molcel.2018.03.008. [DOI] [PMC free article] [PubMed] [Google Scholar]
- 15.Gauss GH, Lieber MR. The basis for the mechanistic bias for deletional over inversional V(D)J recombination. Genes Dev. 1992;6:1553–1561. doi: 10.1101/gad.6.8.1553. [DOI] [PubMed] [Google Scholar]
- 16.Guo C, et al. CTCF-binding elements mediate control of V(D)J recombination. Nature. 2011;477:424–430. doi: 10.1038/nature10495. [DOI] [PMC free article] [PubMed] [Google Scholar]
- 17.Hill L, et al. Wapl repression by Pax5 promotes V gene recombination by Igh loop extrusion. Nature. 2020;584:142–147. doi: 10.1038/s41586-020-2454-y. [DOI] [PMC free article] [PubMed] [Google Scholar]
- 18.Yamagami T, ten Boekel E, Andersson J, Rolink A, Melchers F. Frequencies of multiple IgL chain gene rearrangements in single normal or κL chain–deficient B lineage cells. Immunity. 1999;11:317–327. doi: 10.1016/S1074-7613(00)80107-7. [DOI] [PubMed] [Google Scholar]
- 19.Lin WC, Desiderio S. Cell cycle regulation of V(D)J recombination-activating protein RAG-2. Proc. Natl Acad. Sci. USA. 1994;91:2733–2737. doi: 10.1073/pnas.91.7.2733. [DOI] [PMC free article] [PubMed] [Google Scholar]
- 20.Bredemeyer AL, et al. ATM stabilizes DNA double-strand-break complexes during V(D)J recombination. Nature. 2006;442:466–470. doi: 10.1038/nature04866. [DOI] [PubMed] [Google Scholar]
- 21.Lin SG, et al. Highly sensitive and unbiased approach for elucidating antibody repertoires. Proc. Natl Acad. Sci. USA. 2016;113:7846–7851. doi: 10.1073/pnas.1608649113. [DOI] [PMC free article] [PubMed] [Google Scholar]
- 22.Moore MW, Durdik J, Persiani DM, Selsing E. Deletions of kappa chain constant region genes in mouse lambda chain-producing B cells involve intrachromosomal DNA recombinations similar to V–J joining. Proc. Natl Acad. Sci. USA. 1985;82:6211–6215. doi: 10.1073/pnas.82.18.6211. [DOI] [PMC free article] [PubMed] [Google Scholar]
- 23.Hill L, et al. Igh and Igk loci use different folding principles for V gene recombination due to distinct chromosomal architectures of pro-B and pre-B cells. Nat. Commun. 2023;14:2316. doi: 10.1038/s41467-023-37994-9. [DOI] [PMC free article] [PubMed] [Google Scholar]
- 24.Barajas-Mora EM, et al. A B-cell-specific enhancer orchestrates nuclear architecture to generate a diverse antigen receptor repertoire. Mol. Cell. 2019;73:48–60. doi: 10.1016/j.molcel.2018.10.013. [DOI] [PMC free article] [PubMed] [Google Scholar]
- 25.Barajas-Mora EM, et al. Enhancer-instructed epigenetic landscape and chromatin compartmentalization dictate a primary antibody repertoire protective against specific bacterial pathogens. Nat. Immunol. 2023;24:320–336. doi: 10.1038/s41590-022-01402-z. [DOI] [PMC free article] [PubMed] [Google Scholar]
- 26.Liang Z, et al. Contribution of the IGCR1 regulatory element and the 3′Igh CTCF-binding elements to regulation of Igh V(D)J recombination. Proc. Natl Acad. Sci. USA. 2023;120:e2306564120. doi: 10.1073/pnas.2306564120. [DOI] [PMC free article] [PubMed] [Google Scholar]
- 27.Dai, H.-Q. et al. Loop extrusion mediates physiological locus contraction for V(D)J recombination. Preprint at bioRxiv10.1101/2020.06.30.181222 (2020).
- 28.Bevington S, Boyes J. Transcription-coupled eviction of histones H2A/H2B governs V(D)J recombination. EMBO J. 2013;32:1381–1392. doi: 10.1038/emboj.2013.42. [DOI] [PMC free article] [PubMed] [Google Scholar]
- 29.Nitschke L, Kestler J, Tallone T, Pelkonen S, Pelkonen J. Deletion of the DQ52 element within the Ig heavy chain locus leads to a selective reduction in VDJ recombination and altered D gene usage. J. Immunol. 2001;166:2540–2552. doi: 10.4049/jimmunol.166.4.2540. [DOI] [PubMed] [Google Scholar]
- 30.Xiang Y, Park S-K, Garrard WT. A major deletion in the Vκ–Jκ intervening region results in hyper-elevated transcription of proximal Vκ genes and a severely restricted repertoire. J. Immunol. 2014;193:3746–3754. doi: 10.4049/jimmunol.1401574. [DOI] [PMC free article] [PubMed] [Google Scholar]
- 31.Cowell LG, Davila M, Kepler TB, Kelsoe G. Identification and utilization of arbitrary correlations in models of recombination signal sequences. Genome Biol. 2002;3:research0072.1. doi: 10.1186/gb-2002-3-12-research0072. [DOI] [PMC free article] [PubMed] [Google Scholar]
- 32.Cowell LG, Davila M, Yang K, Kepler TB, Kelsoe G. Prospective estimation of recombination signal efficiency and identification of functional cryptic signals in the genome by statistical modeling. J. Exp. Med. 2003;197:207–220. doi: 10.1084/jem.20020250. [DOI] [PMC free article] [PubMed] [Google Scholar]
- 33.Merelli I, et al. RSSsite: a reference database and prediction tool for the identification of cryptic Recombination Signal Sequences in human and murine genomes. Nucleic Acids Res. 2010;38:W262–W267. doi: 10.1093/nar/gkq391. [DOI] [PMC free article] [PubMed] [Google Scholar]
- 34.Choi NM, et al. Deep sequencing of the murine Igh repertoire reveals complex regulation of nonrandom V gene rearrangement frequencies. J. Immunol. 2013;191:2393–2402. doi: 10.4049/jimmunol.1301279. [DOI] [PMC free article] [PubMed] [Google Scholar]
- 35.Bolland DJ, et al. Two mutually exclusive local chromatin states drive efficient V(D)J recombination. Cell Rep. 2016;15:2475–2487. doi: 10.1016/j.celrep.2016.05.020. [DOI] [PMC free article] [PubMed] [Google Scholar]
- 36.Matheson LS, et al. Local chromatin features including PU.1 and IKAROS binding and H3K4 methylation shape the repertoire of immunoglobulin kappa genes chosen for V(D)J recombination. Front. Immunol. 2017;8:1550. doi: 10.3389/fimmu.2017.01550. [DOI] [PMC free article] [PubMed] [Google Scholar]
- 37.Kleiman E, Loguercio S, Feeney AJ. Epigenetic enhancer marks and transcription factor binding influence Vκ gene rearrangement in pre-B cells and pro-B cells. Front. Immunol. 2018;9:2074. doi: 10.3389/fimmu.2018.02074. [DOI] [PMC free article] [PubMed] [Google Scholar]
- 38.Bassing CH, et al. Recombination signal sequences restrict chromosomal V(D)J recombination beyond the 12/23 rule. Nature. 2000;405:583–586. doi: 10.1038/35014635. [DOI] [PubMed] [Google Scholar]
- 39.Wu C, et al. Dramatically increased rearrangement and peripheral representation of Vβ14 driven by the 3′Dβ1 recombination signal sequence. Immunity. 2003;18:75–85. doi: 10.1016/S1074-7613(02)00515-0. [DOI] [PubMed] [Google Scholar]
- 40.Wu GS, et al. Poor quality Vβ recombination signal sequences stochastically enforce TCRβ allelic exclusion. J. Exp. Med. 2020;217:e20200412. doi: 10.1084/jem.20200412. [DOI] [PMC free article] [PubMed] [Google Scholar]
- 41.Dai H-Q, et al. Direct analysis of brain phenotypes via neural blastocyst complementation. Nat. Protoc. 2020;15:3154–3181. doi: 10.1038/s41596-020-0364-y. [DOI] [PMC free article] [PubMed] [Google Scholar]
- 42.Chen J, Lansford R, Stewart V, Young F, Alt FW. RAG-2-deficient blastocyst complementation: an assay of gene function in lymphocyte development. Proc. Natl Acad. Sci. USA. 1993;90:4528–4532. doi: 10.1073/pnas.90.10.4528. [DOI] [PMC free article] [PubMed] [Google Scholar]
- 43.Hu J, et al. Detecting DNA double-stranded breaks in mammalian genomes by linear amplification–mediated high-throughput genome-wide translocation sequencing. Nat. Protoc. 2016;11:853–871. doi: 10.1038/nprot.2016.043. [DOI] [PMC free article] [PubMed] [Google Scholar]
- 44.Kos, J. T. et al. Characterization of extensive diversity in immunoglobulin light chain variable germline genes across biomedically important mouse strains. Preprint at bioRxiv10.1101/2022.05.01.489089 (2022).
- 45.Krijger PHL, Geeven G, Bianchi V, Hilvering CRE, de Laat W. 4C-seq from beginning to end: A detailed protocol for sample preparation and data analysis. Methods. 2020;170:17–32. doi: 10.1016/j.ymeth.2019.07.014. [DOI] [PubMed] [Google Scholar]
- 46.Lin YC, et al. A global network of transcription factors, involving E2A, EBF1 and Foxo1, that orchestrates B cell fate. Nat. Immunol. 2010;11:635–643. doi: 10.1038/ni.1891. [DOI] [PMC free article] [PubMed] [Google Scholar]
- 47.Vettermann C, Timblin GA, Lim V, Lai EC, Schlissel MS. The proximal J kappa germline-transcript promoter facilitates receptor editing through control of ordered recombination. PLoS ONE. 2015;10:e0113824. doi: 10.1371/journal.pone.0113824. [DOI] [PMC free article] [PubMed] [Google Scholar]
- 48.Alt FW, Baltimore D. Joining of immunoglobulin heavy chain gene segments: implications from a chromosome with evidence of three D–JH fusions. Proc. Natl Acad. Sci. USA. 1982;79:4118–4122. doi: 10.1073/pnas.79.13.4118. [DOI] [PMC free article] [PubMed] [Google Scholar]
- 49.Wang H, et al. Widespread plasticity in CTCF occupancy linked to DNA methylation. Genome Res. 2012;22:1680–1688. doi: 10.1101/gr.136101.111. [DOI] [PMC free article] [PubMed] [Google Scholar]
- 50.Jing D, et al. Lymphocyte-specific chromatin accessibility pre-determines glucocorticoid resistance in acute lymphoblastic leukemia. Cancer Cell. 2018;34:906–921. doi: 10.1016/j.ccell.2018.11.002. [DOI] [PubMed] [Google Scholar]
Associated Data
This section collects any data citations, data availability statements, or supplementary materials included in this article.
Supplementary Materials
Cer-bait 3C-HTGTS interaction peaks and underlying features in the Vκ locus from RAG-deficient primary pre-B cells and v-Abl cells. Related to Fig. 2m and Extended Data Fig. 2b. Zoom-in profiles of Cer-bait 3C-HTGTS in RAG2-deficient primary pre-B cells (first lane, pink) and RAG2-deficient v-Abl cells (second lane, blue) were shown along with annotated CBE motifs (third lane, red for rightward CBE, blue for leftward CBE), CTCF ChIP-seq (fourth lane, red), Rad21 ChIP-seq (fifth lane, blue), E2A ChIP-seq (sixth lane, purple) and GRO-seq (bottom lane, red for rightward transcription, blue for leftward transcription) within ±10kb region of all peaks called in either primary pre-B cells or v-Abl cells. For each peak, underlying features within ±1kb are indicated, including rightward CBE (“C” in red), leftward CBE (“C” in blue), E2A binding sequence (“E”) and transcription (“T”). Peaks without any obvious underlying features are labeled as unknown (“U”). Vκ domains are indicated by blue (distal), gray (middle) and orange (proximal) shadows. CBE annotation, CTCF ChIP-seq, Rad21 ChIP-seq and GRO-seq were replotted from published data in RAG-deficient v-Abl cells6. E2A ChIP-seq was replotted from published data in RAG-deficient primary pro-B cells46. See Methods for more details on 3C-HTGTS peak calling and underlying feature analysis. Data are presented as mean value from 2 biological repeats (3C-HTGTS) or as mean ± s.e.m. from 3 biological repeats (CTCF ChIP-seq, Rad21 ChIP-seq and GRO-seq).
sgRNAs, oligonucleotides and primers used in this study.
Data Availability Statement
High-throughput sequencing data reported in this study have been deposited in the Gene Expression Omnibus (GEO) database under the accession number GSE263124, with subseries GSE254039 for HTGTS-V(D)J-seq data and GSE263123 for 3C-HTGTS data. The consensus CTCF-binding motif was extracted from JASPAR 2018 core vertebrate database (http://jaspar2018.genereg.net/matrix/MA0139.1). Source data are provided with this paper.
HTGTS-V(D)J-seq and 3C-HTGTS data were processed through published pipelines as previously described43. Specifically, the pipelines analysing HTGTS data are available at http://robinmeyers.github.io/transloc_pipeline/. Newly developed pipelines for off-targets filtering on cryptic RSS and 3C-HTGTS normalization and peak calling are available at https://github.com/Yyx2626/HTGTS_related.


