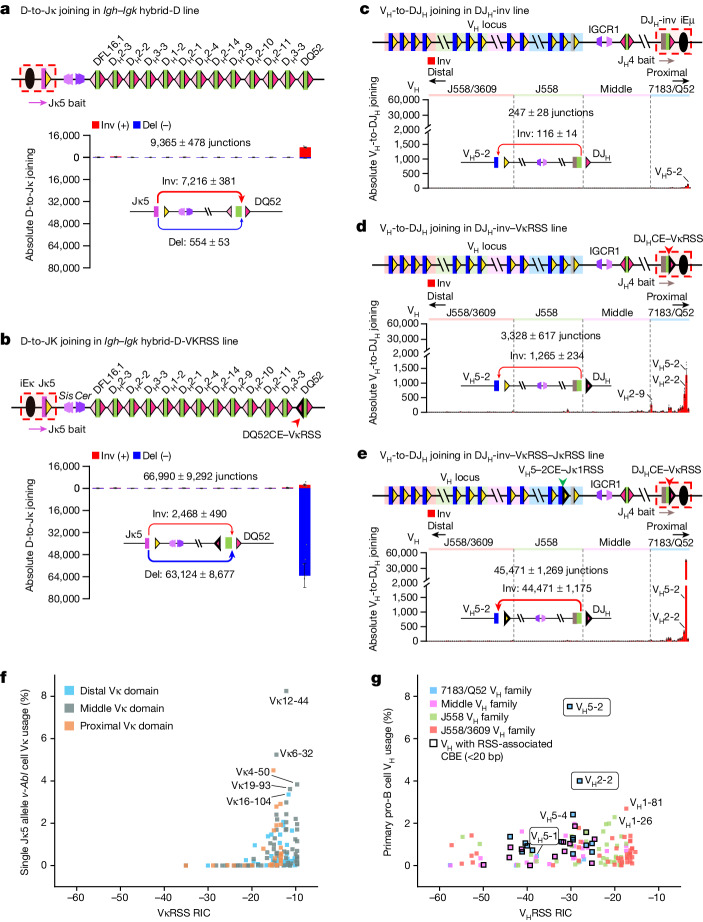
Fig. 5. Igk-RSSs enhance diffusional D-to-Jκ joining in the Igh–Igk hybrid locus and activate inversional VH-to-DJH joining in the Igh locus.
a,b, Absolute level of individual D-to-Jκ joins in the Igh–Igk hybrid-D line (a) and the Igh–Igk hybrid-D-VκRSS line in which the DQ52 upstream 12RSS was replaced with a Vκ12-44 12RSS (b), assayed with Jκ5 bait. Deletional DQ52-to-Jκ5 joining in b is 114-fold higher than that in a (P = 0.0008). c–e, Absolute level of individual inversional VH-to-DJH joins in the DJH-inv line (c), the DJH-inv-VκRSS line, in which DQ52 upstream 12RSS was replaced with a Vκ11-125 12RSS (d) and the DJH-inv-VκRSS-JκRSS line, in which VH5-2 23RSS was replaced with a Jκ1-23RSS (e), assayed with JH4 bait. Total rearrangement level in d is 13-fold higher than that in c (P = 0.0153). Inversional VH5-2 usage level in e is 35-fold higher than that in d (P = 0.0005) and 383-fold higher than that in c (P = 0.0007). In a–e, red arrows show inversional joins and blue arrows show deletional joins. Corresponding junction numbers are shown. Arrow thickness represents relative amounts of junctions. f, Comparison of relative Vκ usage in the single Jκ5 allele v-Abl cells with Vκ-RSS RIC scores calculated using the Recombination Signal Sequences Site33 (http://www.itb.cnr.it/rss). Vκ segments are colour-coded according to the three Vκ domains with names indicated for highly used Vκ segments. g, Comparison of relative VH usage in primary pro-B cells7 with VH-RSS RIC scores. VH segments are colour-coded according to the four VH domains, and square black outlines indicate VH segments with CBEs within 20 bp of their RSSs. The circled VH5-1, VH5-2 and VH2-2 have been shown to depend on associated CBEs for robust utilization3. D and VH utilization data are presented as mean ± s.e.m. from 4 (a,d), 6 (b) and 3 (c,e) biological repeats. P values were calculated with unpaired, two-sided Welch’s t-test.

