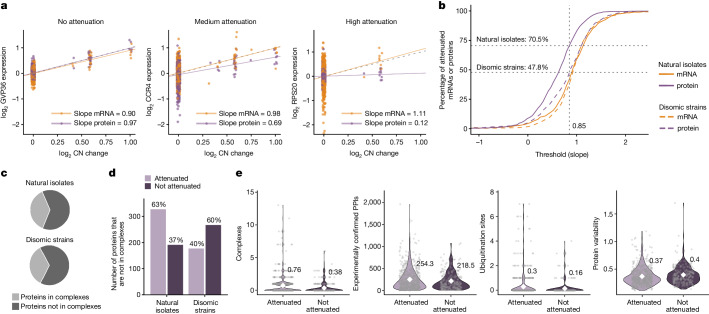
Fig. 2. Gene-by-gene quantification of dosage compensation.
a, Linear regression of relative mRNA and protein levels against relative copy number changes for three exemplary genes with different extents of protein-level dosage compensation. Each point shows the log2 expression when expressed from an aneuploid chromosome in an isolate (GVP36: chr. 9, relative CN change > 0 in 24 points; CCR4: chr. 1, CN change > 0 in 29 points; RPS20: chr. 8, CN change > 0 in 9 points). The expected behaviour of a non-buffered gene (y = x, dotted grey line) is shown. b, Cumulative distribution analysis for natural isolates and disomic strains, comparing the fraction of genes attenuated at the mRNA or protein level on the basis of the distribution slopes. The vertical dotted grey line denotes an analysis threshold of 0.85, and the horizontal dotted grey lines and numbers indicate the fraction of proteins attenuated at this threshold. c, Proportion of genes in natural isolates and in synthetic disomes that are part of macromolecular complexes. d, Proportion of proteins that are not part of macromolecular complexes and attenuated or not in natural isolates or synthetic disomes. For a–d, the regression analysis was performed separately for natural isolates and disomic strains (827 and 680 proteins included in the analysis, respectively). e, For proteins (dots) that are either attenuated (n = 583) or not (n = 244) when expressed from aneuploid chromosomes of natural isolates, comparison of the number of complexes a protein is part of (P = 4.1 × 10⁻⁸ (without adjustment); P = 9.3 × 10⁻⁷ (with adjustment)), the number of experimentally confirmed protein–protein interactions (PPIs) (P = 0.056; P = 0.20), the number of ubiquitination sites per protein obtained from Uniprot (integrating both experimental and computational resources; P = 0.023; P = 0.13) and the general variability in protein abundance (P = 4.4 × 10⁻³; P = 0.034). White diamonds represent means. P values refer to significance testing by two-sample, two-sided Wilcoxon tests without or with Benjamini-Hochberg adjustment.

