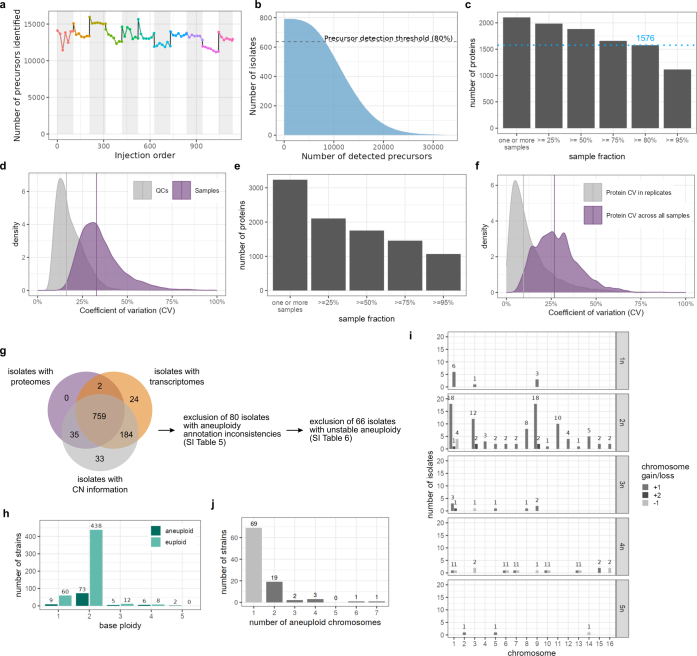
Extended Data Fig. 1. Quality assessment plots for proteomics data processing and integrated dataset assembly.
a, Number of precursors identified by DIA-NN in the QC samples (n = 77) of the natural isolate collection, before further processing, ordered by injection number, demonstrating a stable performance over the acquisition of the data. Colours and shaded backgrounds highlight separate batches. b, Precursor detection rate in the natural isolates. A strict threshold was set to retain precursors that were well detected in at least 80% of the isolates. The precursors retained were then used for protein quantification. c, Number of proteins quantified across samples. The blue dotted line highlights the 80% cut-off used for the proteomic dataset, leading to 1,576 proteins consistently quantified across the natural isolates after preprocessing. d, Coefficients of variation (CV) of the precursor quantities in the technical quality controls (QCs, technical variability, n = 77) compared to the biological samples (yeast isolates, biological signal, n = 796). The solid purple line indicates the median CV across samples (32.8 %). e, Number of proteins quantified across samples for different sample fraction thresholds in the disomic dataset. f, Coefficients of variation (CV) of protein abundance within replicates or across all samples in the disomic dataset. All disomic strains were measured in triplicates, except for disome 8, which was measured in duplicates due to one replicate not passing preprocessing quality control thresholds (Methods). The solid purple line indicates the median CV across all samples (26.7%). The comparison of the CVs demonstrates low technical variability and a well-detected biological signal in the disome dataset. g, Overlap between genomic, transcriptomic, and proteomic datasets and number of isolates excluded due to inconsistencies at or between genome and transcriptome layer. h, Number of aneuploid and euploid isolates per ploidy. i, Chromosome gains (+1, +2) and losses (−1) across the isolates of the integrated dataset by ploidy. For isolates with complex aneuploidies, each aneuploid chromosome was counted separately. j, Distribution of chromosome copy number changes per aneuploid isolate across the 613 isolates in the integrated dataset.

