

Abstract
Background
The utilization of segmentation method using volumetric data in adults dental age estimation (DAE) from cone-beam computed tomography (CBCT) was further expanded by using current 5-Part Tooth Segmentation () method. Additionally, supervised machine learning modelling —namely support vector regression (SVR) with linear and polynomial kernel, and regression tree — was tested and compared with the multiple linear regression model.
Material and Methods
CBCT scans from 99 patients aged between 20 to 59.99 was collected. Eighty eligible teeth including maxillary canine, lateral incisor, and central incisor were used in this study. Enamel to dentine volume ratio, pulp to dentine volume ratio, lower tooth volume ratio, and sex was utilized as independent variable to predict chronological age.
Results
No multicollinearity was detected in the models. The best performing model comes from maxillary lateral incisor using SVR with polynomial kernel ( = 0.73). The lowest error rate achieved by the model was given also by maxillary lateral incisor, with 4.86 years of mean average error and 6.05 years of root means squared error. However, demands a complex approach to segment the enamel volume in the crown section and a lengthier labour time of 45 minutes per tooth.
KEYWORDS : Forensic Dentistry,; Age Determination by Teeth, Cone Beam Computed Tomography,; Supervised Machine Learning; J Forensic Odontostomatol
INTRODUCTION
The emergence of cone beam computed tomography (CBCT) systems in dentistry has opened new possibilities in diagnostics and image analysis. Utilizing CBCT for patient diagnosis provides dentists with a clear and detailed visualization of the dentomaxillofacial feature. (1) The improved anatomical visualization provided by CBCT leads to more predictable post-operative outcomes and safer clinical practices. (2) On the image analysis front, researchers have used volumetric information to deeply analyze anatomical structures, (3) human growth, (4) and other changes that happens in the craniofacial region. (5) This volumetric information has also proven to be highly valuable in various dental analyses, including dental age estimation performed by forensic odontologists. (6)
The importance of volumetric information provided by the CBCT allows forensic odontologists to conduct a thorough investigation of regressive changes in teeth, which is essential in dental age estimation of adults when dental growth has ceased. (7) Recent research has expanded the capabilities of volumetric measurement for dental age estimation by segmenting it into various anatomical regions to enhance the reliability of predictive models, namely: Lower Tooth Volume Ratio (LTVR), derived from the lower root chamber volume (LRCV) and lower hard tissue volume (LHTV); (8) Pulp to Dentine Volume Ratio (PDVR), derived from the pulp chamber volume (PCV) of the crown and dentine volume (DV); and Enamel to Dentine Volume Ratio (EDVR), derived from enamel volume (EV) and DV. (9) All these ratios can be included in a single predictive model. However, the introduction of more independent variables into a predictive linear model carries the risk of multicollinearity, (10) lower model reliability, (11) and inflated R2. (12)
These problems were argued that it can be solved by calculating the variance inflation factor (VIF) and adjusted R2 ( of the model. Modern solutions — such as Supervised Machine Learning (SML) — have also been reported to reduce the multicollinearity problem (13) while minimizing the error-rate of a dental age estimation model when compared to the traditional multiple linear regression model. (14)
Considering these aspects, the aim of this research is twofold: (1) to examine the predictive performance of the 5-Part Tooth Segmentation ( method by combining the variables introduced by Merdietio Boedi et al. (8, 9) and (2) assessing the effectiveness of SML — namely, support vector regression (SVR) and regression tree (RT) — to improve the reliability of the variables in predicting chronological age (CA).
MATERIAL AND METHODS
Data acquisition
This observational cross-sectional study received ethical approval from the Research Ethics Committee of Universitas Padjajaran (Approval No. 899/UN6.KEP/EC/2021). The sample used in this study was acquired from Merdietio Boedi et al.'s (2023) and was adapted and reanalyzed for the current study. (9) The sample consisted of 45 males and 54 females of Bandung, Indonesian origin, aged between 20 and 59.99 years (Mean CA 40.69 ± 11.23). CBCT scans were acquired at Universitas Padjajaran Dental Hospital using the Instrumentarium Dental OP300 (Instrumentarium Dental, Tuusula, Finland) with patient-specific exposure settings, including 85 kV, tube current ranging from 3 to 8 mA, and an exposure time between 1.7 to 8.7 seconds. The voxel size used in this study were 0.125mm3 (n = 14), 0.2mm3 (n = 36), 0.3mm3 (n = 43), and 0.4 mm3 (n =6). In relation to the respective fields of view, the smaller voxel size was taken for the small field of view (250 x 250 x 250), whilst the 0.3 and 0.4 mm3 size was used for the 400 x 400 x 400 scans. Importantly, no patient was subjected to radiation specifically for the study, as the sample collection was retrospective and taken from an existing image database of CBCT scans acquired for clinical purposes.
The inclusion sample for the current study consists of maxillary teeth with fully erupted, closed apex, and a visible cemento-enamel junction (CEJ). Teeth with restorations, caries, impaction, resorption, associated tumors, cysts, pulp calcification, visible accessory root canals, or any interventions that may affect tooth formation or structure were excluded. The total sample size for this study includes 240 teeth (Table 1) consisting of maxillary canines (C, n = 80), lateral incisors (Li, n = 80), and central incisors (Ci, n = 80).
Table 1. Total sample size of each examined tooth for each sex and age range.
| Age (Years) | M | F | ||||
|---|---|---|---|---|---|---|
| C | C | Li | Ci | Li | Ci | |
| 20-24.99 | 5 | 5 | 5 | 5 | 5 | 5 |
| 25-24.99 | 5 | 5 | 5 | 5 | 5 | 5 |
| 30-34.99 | 5 | 5 | 5 | 5 | 5 | 5 |
| 35-35.99 | 5 | 5 | 5 | 5 | 5 | 5 |
| 40-44.99 | 5 | 5 | 5 | 5 | 5 | 5 |
| 45-49.99 | 5 | 5 | 5 | 5 | 5 | 5 |
| 50-54.99 | 5 | 5 | 5 | 5 | 5 | 5 |
| 55-59.99 | 5 | 5 | 5 | 5 | 5 | 5 |
M = Male, F = Female, C = Maxillary Canine, Li = Maxillary Lateral Incisor, Ci = Maxillary Central Incisor
Sample processing
The volumetric information of each tooth was segmented into 5 distinct components: PCV, DV, EV, LRCV, and LHTV (Fig. 1). These measurements were carried out using ITK-SNAP ver. 3.8 (ITK-SNAP, UPenn & UNC, USA). (15) The primary settings in ITK-SNAP were consistently configured as follows throughout the measurement process: 3D brush settings ON, all label opacities were set to 35, "initialize with current segmentation" option ON, and "thresholding" option was chosen in the segmentation mode. All volumetric measurements are conducted through the built-in region of interest (ROI) function within ITK-SNAP.
Figure 1.
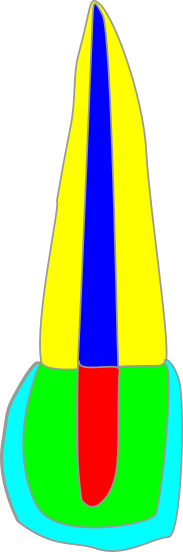
Illustration of the 5-Part Tooth Segmentation method. The demarcation between the crown area and root area is defined using the highest or most apical point of the cemento-enamel junction in the sagittal section of the CBCT.
The method starts with the volume calculation for the crown region (i.e., PCV, DV, and EV) followed the protocol described by Merdietio Boedi et al. in their 2023 work, (9) while for the root region (i.e., LRCV and LHTV), the procedure follows to their 2022 work. (8) The volumetric measurement started with the calculation of PCV, followed by the entire crown volume, demarcated by the highest or most apical CEJ in the sagittal view of the CBCT. Subsequently, the volumetric information was partitioned into DV and EV. Lastly, the calculation extended to LRCV and LHTV (Fig. 2). In the separation of the crown and root regions, the regions of interest (ROI) were ensured to overlap, ensuring the continuity of segmentation. All the calculated volume will then be converted to 3 volumetric ratios:
Figure 2.

5-Part Tooth Segmentation sequence in ITK-SNAP three-dimensional rendering. A: Pulp Chamber Volume (red), B: Whole Crown Volume (green), C: Separation between Dentine (green) and Enamel (light blue) Volume, D: Lower root chamber volume (blue), E: Lower hard tissue volume (yellow), F: Visualization of the cross-sectioned volumetric data depicting the separation between 5 volumetric information.
EDVR (, PDVR (, and LTVR (. The superscripted letter notation corresponds to the specific tooth's volumetric ratio calculation (i.e., represents the EDVR calculation for tooth Li). Generally, the meantime taken for the method was 45 minutes for each tooth.
Data analysis
Inter- and intra-observer variabilities were calculated using the Intraclass Correlation Coefficient (ICC). Inter-observer agreement was determined by the first author— a forensic odontologist with 7 years of experience, with calculations repeated after a two-week interval between observations. Furthermore, the inter-observer analysis was accomplished by comparing the observations of the first author with a second observer — an oral and maxillofacial radiologist with 3 years of experience — recruited for the study. These analyses were based on a randomly selected set of 20 CBCT scans from unpublished data.
Initial analysis was performed by calculating Pearson’s correlation coefficient (r) cross-tabulation for each variable. Then, three predictive models, namely MLR, SVR, and RT, were developed using CA as the dependent variable, volumetric ratios as independent variables, and sex as a covariate. All data analysis was conducted using R (version 3.4.1, R Foundation for Statistical Computing, Vienna, Austria) with the caret extension. Model training parameters in caret were set using the "repeated cross-validation" training method with 5-fold cross-validation and 2 repetitions. The hyperparameters for both SVR and RT were set to center and scale for the preProcess function, and the tuneLength parameter was set to 5. Two SVR kernel will be tested: linear (SVR-L) and polynomial (SVR-Poly) kernels.
Model reliability was assessed using , root mean squared error (RMSE), and mean absolute error (MAE). Additionally, performance evaluation included the use of the variance inflation factor (VIF) to detect multicollinearity, with VIF > 5 indicating multicollinearity among independent variables. To ensure reproducibility in the randomization, the pseudo-random number generator in R was controlled using set.seed = 30.
RESULTS
Volumetric measurements demonstrated good consistency, with intra- and inter-observer agreement reported in Table 2.
Table 2. Intra and Inter-Class Correlation Coefficient between and within observers.
| Variables | ICC | |
|---|---|---|
| Intra | Inter | |
| PCV | 0.78 | 0.78 |
| DV | 0.82 | 0.81 |
| EV | 0.7 | 0.76 |
| LRCV | 0.92 | 0.92 |
| LHTV | 0.9 | 0.73 |
All r-values in the cross-tabulation (Table 3) were statistically significant. Negative correlations were observed between CA and independent variables, indicating that as CA increases, the ratio measurements reflecting regressive changes in the observed tooth decrease. The highest negative correlation between CA and an independent variable was observed in (r = -0.68). Positive r-values between independent variables indicate that both variables change in the same direction; in this case, all independent variables decrease over time. The highest and lowest positive correlations between independent variables were observed for to (r = 0.57), and to (r = 0.38), respectively.
Table 3. Pearson's correlation coefficient values for each variable.
| Tooth | EDVR | PDVR | LTVR | CA | |
|---|---|---|---|---|---|
| C | EDVR | - | 0.57 | 0.51 | -0.67 |
| PDVR | 0.57 | - | 0.44 | -0.68 | |
| LTVR | 0.51 | 0.44 | - | -0.66 | |
| CA | -0.67 | -0.68 | -0.66 | - | |
| Li | EDVR | - | 0.47 | 0.60 | -0.61 |
| PDVR | 0.47 | - | 0.38 | -0.65 | |
| LTVR | 0.60 | 0.38 | - | -0.73 | |
| CA | -0.61 | -0.65 | -0.73 | - | |
| Ci | EDVR | - | 0.55 | 0.47 | -0.60 |
| PDVR | 0.55 | - | 0.51 | -0.65 | |
| LTVR | 0.47 | 0.51 | - | -0.61 | |
| CA | -0.60 | -0.65 | -0.61 | - |
C = Maxillary Canine, = Li = Maxillary Lateral Incisor, Ci = Maxillary Central Incisor, EDVR = Enamel to Dentine Volume Ratio, PDVR = Pulp to Dentine Volume Ratio, LTVR = Lower Tooth Volume Ratio
MLR models were calculated as follows:
where y is the estimated dental age. The sex covariate did not exhibit a significant contribution to the MLR models, and similarly, did not show significance in predicting CA. All VIF values were below 5, indicating no multicollinearity among the independent variables.
A comparison of the models revealed that SVR-Poly consistently achieved superior performance in predicting CA compared to the other modelling approaches, as evidenced in Table 4. Notably, the highest values also translated to a lower MAE and RMSE metrics. The third-degree SVR-Poly model in C utilizing all independent variables and sex as predictor yielded the lowest MAE (4.97 years) and RMSE (6.37 years), with value of 0.71. Conversely, the Ci SVR-L model employing all independent variables produced the highest MAE (6.6 years) and RMSE (7.97 years), with the lowest value of 0.55.
Table 4. Model performance comparison for each tooth. All error values were reported from the cross-validated data using 5-fold cross-validation with 2 repetitions.
| Tooth | Metrics | Models | |||
|---|---|---|---|---|---|
| MLR | SVR-L | SVR-Poly | RT | ||
| C | 0.66 | 0.65 | 0.71 | 0.62 | |
| MAE | 5.42 | 5.23 | 4.97 | 5.77 | |
| RMSE | 6.86 | 6.8 | 6.37 | 7.18 | |
| Li | 0.69 | 0.7 | 0.73 | 0.69 | |
| MAE | 5.14 | 5.15 | 4.86 | 5.28 | |
| RMSE | 6.46 | 6.42 | 6.05 | 6.67 | |
| Ci | 0.56 | 0.55 | 0.68 | 0.56 | |
| MAE | 6.4 | 6.6 | 5.27 | 6.26 | |
| RMSE | 7.7 | 7.97 | 6.67 | 7.7 | |
C = Maxillary Canine, = Li = Maxillary Lateral Incisor, Ci = Maxillary Central Incisor,
= Adjusted R2, MAE = Mean Average Error, RMSE = Root Mean Squared Error, MLR = Multiple Linear Regression, SVR-L = Support Vector Regression with Linear Kernel, SVR-Poly = Support Vector Regression with Polynomial Kernel, RT = Regression Tree
DISCUSSION
Although studies on dental age estimation might use different approaches, several key objectives need to be addressed by researchers to establish a robust methodology. (16) Firstly, an adequate sample size is essential, not only in the quantity of analyzed data but also the distribution across age group and sex. (17) This key objective ensures that the results evade the age mimicry phenomenon, where the final error rate may be skewed toward a certain age group or population reference. (18) Secondly, the proposed methodology must incorporate inter- and intra-observer error, certainly with a proper quantification analysis to ensure methodological reproducibility. For instance, when dealing with ordinal data (e.g., staging, atlases), Cohen's Kappa should be employed for analysis, while continuous data (e.g., measurements) necessitate the use of ICC. (19) Thirdly, the reliability of the model is signified by the error-rate that should be shown along with the conversion of the age-related dental data, and this can be achieved through scoring systems, diagrams, or models. Importantly, the error-rate should be calculated from a different dataset than the one used for model creation to prevent overfitting — a scenario that occurs when a model is too closely tailored to the training data and may not perform well on new, unseen data. The most straightforward approach to prevent overfitting is to separate the dataset into training and testing subsets. For instance, considering a dataset denoted as , the training data could use the portion of the data, while the model derived from the training dataset is evaluated against the data. Another method — as employed in this research — involves k-fold cross-validation. This technique divides the data into parts or folds, utilizing segments for training the dataset and reserving the untrained fold for testing. This process is repeated times, with each fold serving as the test data exactly once.
CBCT can be used for dental staging, (20) alveolar bone loss measurement, (21) metric assessment, (22) and specifically for volumetric measurement application (23). Volumetric data has shown the highest reliability within the adult population. (6) This is primarily attributed to the absence of dental maturation process, a method commonly employed for children and adolescents. Regressive dental changes are subtle when compared to dental maturation, necessitating data granularity to ensure even the smallest shifts in adult tooth structure are captured accurately. Unlike conventional radiographs — which provide only two-dimensional measurements, volumetric data captures these details through CBCT voxels to approximate radiographic structure volume, acquired from the height, width, and depth of the images. (24) Therefore, the accuracy of the volumetric method has much to recommend it for the assessment of the dental age of adults.
This study utilizes volumetric approximations of a tooth obtained through CBCT scans employing various voxel sizes. As noted in previous studies, inconsistencies in measuring or observing age-related variables can introduce errors in the final estimated age. (25) Lee et al. recommend a 0.2mm3 voxel for optimal dental structure evaluation. (27) Even so, Adisen et al. concluded that different voxel sizes have not significantly improved overall result. (26) While smaller voxel sizes offer increased clarity, methods utilizing CBCT volumetric information can still function appropriately with larger voxel sizes with good quality scans. Whenever feasible, uniform sampling if images based on the same voxel size should be preferred to standardize the methodological settings.
The potential variability in CBCT-based measurements was seen by Yang et al. whom conducted a comparison of pulp size obtained from an Archimedes' principle experiment to CBCT-derived volumes, yielding an acceptable error rate of ±7.6%. (28) Further work by Star et al. revealed a more substantial discrepancy between software measurements and the gold standard, with differences of up to 21% and 16% for pulp and tooth volume, respectively. (29) Adding to this complexity, previous research has identified a significant correlation between individual stature and tooth volume. (30) This implies that larger individuals may tend to have larger teeth, potentially introducing bias into the volumetric measurements. This study used a ratio as its independent variable, mitigating the influence of both intrinsic variability in CBCT measurements and the correlation between stature and tooth size.
This study employed a segmentation method to achieve higher model performance by discerning multiple volumetric regressive changes in anterior teeth using CBCT images. Previous studies have primarily utilized tooth volumetric data, conducting this approach across various populations, (7) each with their own modifications aimed at either improving model performance or adopting a more user-friendly approach. For instance, (1) Zhang et al. utilized only the enamel and pulp chamber of an impacted third molar to eliminate the influence of external factors affecting the rate of enamel attrition, (31) and (2) Pinchi et al. simplified volumetric measurements by using geometric approximations of upper central incisors to reduce operating time. (32) A direct comparison of R2 values with the current methodology reveals a higher R2 value of 0.71 for the Li SVR-Poly model when compared to Zhang et al. (R2 = 0.42), Pinchi et al. (R2 = 0.58), or similar population study conducted by Anjani et al. (R2 = 0.58). However, it is important to note that the approach involves a more complex segmentation process, and hence a greater time commitment, for each part of the tooth to achieve enhanced model performance.
The error rate in adult dental age estimation was found to be higher and possible causes include external factors, regressive dental changes, and population-specific influences. (33) For instance, individuals with bruxism may experience a higher rate of attrition, resulting in reduced enamel volume. Additionally, error rates may vary significantly depending on the specific population, as seen in the Indonesian populations. Marroquin et al. (2018) conducted pulp/tooth volume calculations on two distinct samples —Colombian and Malaysian— concluding the necessity of population-specific methods for age estimation due to discriminatory results. (34) Du et al. (2021) observed significant differences in error rates when a model derived from Chinese samples was applied to Black Americans, because the original MAE of 7.9 years Increased to 14.04 years for the later population. (35) Hence, the model performance reported in this study may be population-specific, underscoring the importance of methodological validation when a model is applied to a new or different populations.
The limitations of this study are two-fold and linked primarily to sample size and methodological constraints. First, the sample size was 80 per tooth position, above the required minimum sample size of 67 from G*Power analysis for a-priori sample size determination with effect size of 0.3, Power 0.95, and 4 estimated predictors. However, a bigger sample size to achieve a lower effect size may result in better age estimation performance that more accurately representing dental regressive changes in adults. (36) Moreover, a non-uniform distribution of voxel sizes was obtained during sampling process — a situation justified by the institutional protocol that require patient-specific modeling of energy parameters for image acquisition. Second, the inclusion of EV calculation affected the operating time of the segmentation, approximately 45 minutes, and with a steeper learning curve. In contrast, similar segmentation study that divided the tooth volumetric information into four segments without EV calculation took only 10 minutes. (8) This drawback certainly comes with a better overall performance. As reported in the previous study, the current approach shows an increase of R2 between 0.1 to 0.23. Hence, the current is better suited for evaluating individual dental identification cases, where time constraints are presumably more lenient compared to mass disaster cases.
CONCLUSION
The approach combined with SVR-Poly model gives an overall better performance when compared to other modelling approaches, with the maxillary canine affording the best overall performance in comparison to other anterior maxillary teeth examined. Nonetheless, this improvement in model performance comes with greater labor time costs and a steep learning curve for methodology application. Future research might consider the application of this segmentation methodology to additional teeth, particularly molars, given their relatively greater protection within the oral cavity, thus potentially enhancing their usefulness in disaster scenarios.
ACKNOWLEDGMENTS
This work was supported by the Ministry of Education and Culture, Universitas Diponegoro No.497/UN7.P/HK/2021.
Footnotes
The authors declare that they have no conflict of interest.
REFERENCES
- 1.Ludlow JB, Timothy R, Walker C, Hunter R, Benavides E, Samuelson DB, et al. Effective dose of dental CBCT-a meta analysis of published data and additional data for nine CBCT units. Dentomaxillofac Radiol. 2015;44:20140197. 10.1259/dmfr.20140197 [DOI] [PMC free article] [PubMed] [Google Scholar]
- 2.Wang X, Shujaat S, Shaheen E, Ferraris E, Jacobs R. Trueness of cone-beam computed tomography-derived skull models fabricated by different technology-based three-dimensional printers. BMC Oral Health. 2023;23:397. 10.1186/s12903-023-03104-w [DOI] [PMC free article] [PubMed] [Google Scholar]
- 3.Lenza MG, Lenza MM, Dalstra M, Melsen B, Cattaneo PM. An analysis of different approaches to the assessment of upper airway morphology: a CBCT study. Orthod Craniofac Res. 2010;13:96–105. 10.1111/j.1601-6343.2010.01482.x [DOI] [PubMed] [Google Scholar]
- 4.Anderson PJ, Yong R, Surman TL, Rajion ZA, Ranjitkar S. Application of three-dimensional computed tomography in craniofacial clinical practice and research. Aust Dent J. 2014;59:174–85. 10.1111/adj.12154 [DOI] [PubMed] [Google Scholar]
- 5.Van Dessel J, Nicolielo LF, Huang Y, Coudyzer W, Salmon B, Lambrichts I, et al. Accuracy and reliability of different cone beam computed tomography (CBCT) devices for structural analysis of alveolar bone in comparison with multislice CT and micro-CT. Eur J Oral Implantology. 2017;10:95–105. [PubMed] [Google Scholar]
- 6.Merdietio Boedi R, Shepherd S, Manica S, Franco A. CBCT in dental age estimation: A systematic review and meta analysis. Dentomaxillofac Radiol. 2022;51:20210335. 10.1259/dmfr.20210335 [DOI] [PMC free article] [PubMed] [Google Scholar]
- 7.Barbosa MG, Franco A, de Oliveira RDB, Mamani MP, Junqueira JLC, Soares MQS. Pulp volume quantification methods in cone-beam computed tomography for age estimation: A critical review and meta-analysis. J Forensic Sci. 2023;68:743–56. 10.1111/1556-4029.15248 [DOI] [PubMed] [Google Scholar]
- 8.Merdietio Boedi R, Shepherd S, Oscandar F, Manica S, Franco A. Regressive changes of crown-root morphology and their volumetric segmentation for adult dental age estimation. J Forensic Sci. 2022;67:1890–8. 10.1111/1556-4029.15094 [DOI] [PMC free article] [PubMed] [Google Scholar]
- 9.Merdietio Boedi R, Shepherd S, Oscandar F, Manica S, Franco A. 3D segmentation of dental crown for volumetric age estimation with CBCT imaging. Int J Legal Med. 2023;137:123–30. 10.1007/s00414-022-02898-8 [DOI] [PMC free article] [PubMed] [Google Scholar]
- 10.Alin A. Multicollinearity. Wiley Interdiscip Rev Comput Stat. 2010;2:370–4. 10.1002/wics.84 [DOI] [Google Scholar]
- 11.Ioannidis JP. Why most published research findings are false. PLoS Med. 2005;2:e124. 10.1371/journal.pmed.0020124 [DOI] [PMC free article] [PubMed] [Google Scholar]
- 12.Helland IS. On the Interpretation and Use of R2 in Regression Analysis. Biometrics. 1987;43:61–9. 10.2307/2531949 [DOI] [Google Scholar]
- 13.Chan JYL, Leow SMH, Bea KT, Cheng WK, Phoong SW, Hong ZW, et al. Mitigating the Multicollinearity Problem and Its Machine Learning Approach: A Review. Mathematics. 2022;10:1283. 10.3390/math10081283 [DOI] [Google Scholar]
- 14.Rocha LT, Ingold MS, Panzarella FK, Santiago BM, de Oliveira RN, Bernardino ID, et al. Applicability of Willems method for age estimation in Brazilian children: performance of multiple linear regression and artificial neural network. Egypt J Forensic Sci. 2022;12:1–9. [Google Scholar]
- 15.Yushkevich PA, Gerig G. ITK-SNAP: An Intractive Medical Image Segmentation Tool to Meet the Need for Expert-Guided Segmentation of Complex Medical Images. IEEE Pulse. 2017;8:54–7. 10.1109/MPUL.2017.2701493 [DOI] [PubMed] [Google Scholar]
- 16.Bjørk MB, Kvaal SI. CT and MR imaging used in age estimation: a systematic review. J Forensic Odontostomatol. 2018;36:14–25. [PMC free article] [PubMed] [Google Scholar]
- 17.Schmeling A, Geserick G, Reisinger W, Olze A. Age estimation. Forensic Sci Int. 2007;165:178–81. 10.1016/j.forsciint.2006.05.016 [DOI] [PubMed] [Google Scholar]
- 18.Vossoughi M, Movahhedian N, Ghafoori A. The impact of age mimicry bias on the accuracy of methods for age estimation based on Kvaal’s pulp/tooth ratios: a bootstrap study. Int J Legal Med. 2022;136:269–78. 10.1007/s00414-021-02651-7 [DOI] [PubMed] [Google Scholar]
- 19.Aldridge VK, Dovey TM, Wade A. Assessing Test-Retest Reliability of Psychological Measures Persistent Methodological Problems. Eur Psychol. 2017;22:207–18. 10.1027/1016-9040/a000298 [DOI] [Google Scholar]
- 20.Cantekin K, Sekerci AE, Buyuk SK. Dental computed tomographic imaging as age estimation: morphological analysis of the third molar of a group of Turkish population. Am J Forensic Med Pathol. 2013;34:357–62. 10.1097/PAF.0000000000000054 [DOI] [PubMed] [Google Scholar]
- 21.Daluz A, Saliba-Serre B, Foti B, Lan R. Age estimation from alveolar bone loss, re-evaluation of Ruquet’s method. Forensic Sci Med Pathol. 2024;20:79–88. [cited 2023 November 10] Available from https://link.springer.com/article/10.1007/s12024-023-00617-2 10.1007/s12024-023-00617-2 [DOI] [PubMed] [Google Scholar]
- 22.Salemi F, Farhadian M, Sabzkouhi BA, Saati S, Nafisi N. Age estimation by pulp to tooth area ratio in canine teeth using cone-beam computed tomography. Egypt J Forensic Sci. 2020;10:1–8. [Google Scholar]
- 23.Helmy MA, Osama M, Elhindawy MM, Mowafey B. Volume analysis of second molar pulp chamber using cone beam computed tomography for age estimation in Egyptian adults. J Forensic Odontostomatol. 2020;38:25–34. [PMC free article] [PubMed] [Google Scholar]
- 24.Spin-Neto R, Gotfredsen E, Wenzel A. Impact of voxel size variation on CBCT-based diagnostic outcome in dentistry: a systematic review. J Digit Imaging. 2013;26:813–20. 10.1007/s10278-012-9562-7 [DOI] [PMC free article] [PubMed] [Google Scholar]
- 25.Abdul Rahim AH, Davies JA, Liversidge HM. Reliability and limitations of permanent tooth staging techniques. Forensic Sci Int. 2023;346:111654. 10.1016/j.forsciint.2023.111654 [DOI] [PubMed] [Google Scholar]
- 26.Adisen MZ, Keles A, Yorubulut S, Nalcaci R. Age estimation by measuring maxillary canine pulp/tooth volume ratio on cone beam CT images with two different voxel sizes. Aust J Forensic Sci. 2018;52:71–82. 10.1080/00450618.2018.1474947 [DOI] [Google Scholar]
- 27.Lee S-M, Oh S, Kim J, Kim Y-M, Choi Y-K, Kwak HH, et al. Age estimation using the maxillary canine pulp/tooth ratio in Korean adults: A CBCT buccolingual and horizontal section image analysis. J Forensic Radiol Imaging. 2017;9:1–5. 10.1016/j.jofri.2016.12.001 [DOI] [Google Scholar]
- 28.Yang F, Jacobs R, Willems G. Dental age estimation through volume matching of teeth imaged by cone-beam CT. Forensic Sci Int. 2006;159:S78–83. 10.1016/j.forsciint.2006.02.031 [DOI] [PubMed] [Google Scholar]
- 29.Star H, Thevissen P, Jacobs R, Fieuws S, Solheim T, Willems G. Human dental age estimation by calculation of pulp-tooth volume ratios yielded on clinically acquired cone beam computed tomography images of monoradicular teeth. J Forensic Sci. 2011;56:S77–82. 10.1111/j.1556-4029.2010.01633.x [DOI] [PubMed] [Google Scholar]
- 30.Hatipoğlu FP, Arıcıoğlu B, Hatipoğlu Ö, Köse TE, Günaçar DN. Prediction of root canal lengths and pulp volume of the maxillary permanent first molar based on stature, crown diameters, and facial morphometry. Anat Sci Int. 2023;98:454–62. 10.1007/s12565-023-00727-5 [DOI] [PubMed] [Google Scholar]
- 31.Zhang ZY, Yan CX, Min QM, Li SQ, Yang JS, Guo YC, et al. Age estimation using pulp/enamel volume ratio of impacted mandibular third molars measured on CBCT images in a northern Chinese population. Int J Legal Med. 2019;133:1925–33. 10.1007/s00414-019-02112-2 [DOI] [PubMed] [Google Scholar]
- 32.Pinchi V, Pradella F, Buti J, Baldinotti C, Focardi M, Norelli GA. A new age estimation procedure based on the 3D CBCT study of the pulp cavity and hard tissues of the teeth for forensic purposes: A pilot study. J Forensic Leg Med. 2015;36:150–7. 10.1016/j.jflm.2015.09.015 [DOI] [PubMed] [Google Scholar]
- 33.Phulari RGS, Dave EJ. Evolution of dental age estimation methods in adults over the years from occlusal wear to more sophisticated recent techniques. Egypt J Forensic Sci. 2021;11:1–14.33432273 [Google Scholar]
- 34.Marroquin TY, Karkhanis S, Kvaal SI, Kruger E, Tennant M. Overcoming population differences for dental age estimation in adults through pulp/tooth volume calculations: a pilot study. Aust J Forensic Sci. 2018;52:500–7. 10.1080/00450618.2018.1554089 [DOI] [Google Scholar]
- 35.Du H, Li G, Zheng Q, Yang J. Population-specific age estimation in Black Americans and Chinese people based on pulp chamber volume of first molars from cone beam computed tomography. Int J Legal Med. 2022;136:811–9. 10.1007/s00414-022-02776-3 [DOI] [PubMed] [Google Scholar]
- 36.Sgheiza V, Liversidge H. Reference and target sample age distribution impacts between model types in dental developmental age estimation. Int J Legal Med. 2023;137:383–93. 10.1007/s00414-022-02925-8 [DOI] [PubMed] [Google Scholar]