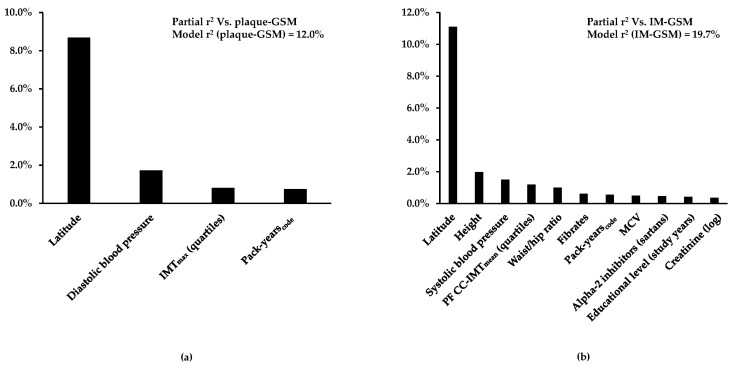
Figure 3.
(a) Percent plaque-GSM variability and (b) IM-GSM variability explained by independent predictors. Variables listed in Tables S1 and S2 that were confirmed with stepwise selection as associated with plaque-GSM or IM-GSM at least 70% of the time in the cross-validation analysis were used as candidates. Among these, the independent predictors were recognized by multiple regression analysis. Partial R2 represents the proportion of GSM variability explained by each predictor.

