

Graphical abstract

Keywords: Acetylation, Apoptosis, Autophagy, HDAC, HDACi, Isoenzyme specificity
Highlights
-
•
Novel HDACi with nanomolar activity against leukemic cells were synthesized.
-
•
HDACi of the KH-series are superior to a clinical grade HDACi.
-
•
HDACi of the KH-series modulate acetylation and phosphorylation of proteins.
-
•
The new HDACi KH16 regulates cell cycle arrest, apoptosis, and autophagy.
-
•
Apoptosis acts upstream of autophagy in KH16-treated cells.
Abstract
Introduction
Posttranslational modification of proteins by reversible acetylation regulates key biological processes. Histone deacetylases (HDACs) catalyze protein deacetylation and are frequently dysregulated in tumors. This has spurred the development of HDAC inhibitors (HDACi). Such epigenetic drugs modulate protein acetylation, eliminate tumor cells, and are approved for the treatment of blood cancers.
Objectives
We aimed to identify novel, nanomolar HDACi with increased potency over existing agents and selectivity for the cancer-relevant class I HDACs (HDAC1,-2,-3,-8). Moreover, we wanted to define how such drugs control the apoptosis-autophagy interplay. As test systems, we used human leukemic cells and embryonic kidney-derived cells.
Methods
We synthesized novel pyrimidine-hydroxamic acid HDACi (KH9/KH16/KH29) and performed in vitro activity assays and molecular modeling of their direct binding to HDACs. We analyzed how these HDACi affect leukemic cell fate, acetylation, and protein expression with flow cytometry and immunoblot. The publicly available DepMap database of CRISPR-Cas9 screenings was used to determine sensitivity factors across human leukemic cells.
Results
Novel HDACi show nanomolar activity against class I HDACs. These agents are superior to the clinically used hydroxamic acid HDACi SAHA (vorinostat). Within the KH-series of compounds, KH16 (yanostat) is the most effective inhibitor of HDAC3 (IC50 = 6 nM) and the most potent inducer of apoptosis (IC50 = 110 nM; p < 0.0001) in leukemic cells. KH16 though spares embryonic kidney-derived cells. Global data analyses of knockout screenings verify that HDAC3 is a dependency factor in 115 human blood cancer cells of different lineages, independent of mutations in the tumor suppressor p53. KH16 alters pro- and anti-apoptotic protein expression, stalls cell cycle progression, and induces caspase-dependent processing of the autophagy proteins ULK1 and p62.
Conclusion
These data reveal that HDACs are required to stabilize autophagy proteins through suppression of apoptosis in leukemic cells. HDAC3 appears as a valid anti-cancer target for pharmacological intervention.
Introduction
Histone deacetylases (HDACs) are Zn2+- or NAD+-dependent enzymes that control the acetylation status of cellular proteins in procaryotes and eucaryotes. Eighteen mammalian HDACs are classified into four classes, based on their time of discovery and their homology to yeast deacetylases. Class I HDACs comprise HDAC1,-2,-3,-8, class II is divided into IIA being HDAC4,-5,-7,-9 and class IIB being HDAC6,-10, and class IV contains only HDAC11, which shares structural properties with classes I and II [1], [2]. The HDAC classes I, II, and IV use Zn2+ as a cofactor and the class III HDACs SIRT1-7 utilize NAD+ as a cofactor [2], [3].
Cancerous tissues frequently overexpress class I HDACs. This is linked to tumors having histone and non-histone protein acetylation patterns that differ from healthy tissues [1], [4], [5]. Such findings have stimulated the development of HDAC inhibitors (HDACi) with nanomolar activities against class I HDACs. HDACi against Zn2+-dependent HDACs have been approved by the U.S. food-and-drug administration (FDA) for the therapy of human blood tumors [1], [4], [5]. This was preceded by the use of weakly active, millimolar fatty acid HDACi in compassionate protocols in the last century [2]. The micromolar hydroxamic acid SAHA was the first clinically approved HDACi. The hydroxamic acid belinostat, as well as the depsipeptide romidepsin are additional HDACi that are approved by the U.S. FDA. The China FDA approved the HDACi tucidinostat, also called chidamide, for clinical use against subtypes of leukemia [1], [4], [5]. Hydroxamic acids are variably active against all Zn2+-dependent HDACs. Romidepsin and tucidinostat block class I HDACs [6], [7]. Additional HDACi, such as the hydroxamic acid-based pan-HDACi abexinostat, increased overall survival rates of follicular cell, T-cell, and B-cell lymphoma patients, at the cost of dose-limiting hematopoietic toxicity, in a phase II clinical trial [8]. Synthesizing and characterizing HDACi that are based on the hydroxamic acid scaffold is a promising approach to identify more effective epigenetic drug candidates for cancer treatment.
A common feature of clinical grade, therapeutically active HDACi is a nano- to micromolar inhibition of class I HDACs. This encourages the synthesis of HDACi with selectivity for these enzymes. Beyond high activity against tumor cells, selective HDACi are expected to have less side-effects than pan-HDACi [2]. HDACi with the benzamide group as a molecular warhead to complex Zn2+ can have remarkable class I HDAC selectivity but lack the low nanomolar activities of depsipeptides and hydroxamic acids [6], [7], [9], [10]. There is an intense search for hydroxamic acids with a very potent inhibition of individual class I HDACs.
The best-characterized anti-proliferative effects of HDACi include the induction of cell cycle arrest and non-inflammatory cell death through apoptosis. The molecular mechanisms underlying the induction of cell cycle arrest by HDACi involve an increase in cyclin-dependent kinase inhibitors and a downregulation of cyclin-dependent kinases. HDACi-induced apoptosis relies on an upregulation of pro-apoptotic and a downregulation of anti-apoptotic proteins, including members of the BCL2 family and a disruption of kinase signaling cascades. These effects can occur through RNA- and protein-dependent mechanisms [1], [4], [5], [11]. HDACi additionally halt tumor cell proliferation through the induction of DNA replication stress and DNA damage [12], [13]. Recent data show that HDACi also modulate a “self-eating” mechanism of cells termed autophagy. This pathway digests cellular proteins and organelles under stress to promote cell survival [14], [15]. Accordingly, the induction of autophagy frequently antagonizes pro-apoptotic properties of HDACi [5], [16], [17], [18].
A nanomolar HDACi with class I HDAC selectivity is both a clinically interesting molecule and a pharmacological tool to assess the specific functions of HDACs. We developed and characterized novel pyrimidine-hydroxamic acids regarding their potency against leukemic cells. We focused on this type of cancer because FDAs approved HDACi for the treatment of certain types of leukemia and lymphoma [1], [4], [5], and because there is a vital clinical testing of HDACi for blood disorders [2], [19]. We compared these novel compounds with established HDACi and analyzed the impact of the most potent new HDACi on key proteins controlling apoptosis and autophagy. As testbeds, we used human leukemic cells and kidney-derived cells, and we analyzed global datasets.
Materials and methods
HDACi
SAHA and MS-275 were purchased from Selleck Chemicals, Munich, Germany. KH9, KH16 (yanostat), and KH29 were synthesized as mentioned in the supplemental information file SI and Figs S1-S13. All drugs were kept as stock solutions in DMSO at −80 °C and diluted in PBS immediately before treatment.
In vitro HDAC enzymatic assays
Recombinant human HDAC1, HDAC2, HDAC3/NCOR1, and HDAC6 were purchased from ENZO Life Sciences AG (Lausen, CH). Recombinant human HDAC11 and recombinant human HDAC8 were produced as mentioned [20], [21]. In vitro testing of the inhibitors in an enzymatic assay was carried out as described in previous publications [20], [21], [22]. For HDAC1,-2,-3, a fluorogenic peptide derived from p53 (Ac-RHKK(Acetyl)-AMC) was used. All measurements were performed in assay buffer (50 mM HEPES, 150 mM NaCl, 5 mM MgCl2, 1 mM TCEP and 0.2 mg/mL BSA, pH 7.4 adjusted with NaOH) at 37 °C. An Envision 2104 Multilabel Plate Reader (PerkinElmer, Waltham, MA), with an excitation wavelength of 380 ± 8 nm and an emission wavelength of 430 ± 8 nm was used to measure the fluorescence intensity. For HDAC6, the substrate (Abz-SRGGK(thio-TFA)FFRR-NH2) was used as described before [20], [21]. The HDAC11 inhibition assay was performed as mentioned in [22]. The enzyme inhibition of HDAC8 was determined with a homogenous fluorescence assay [21]. The enzyme was incubated for 90 min at 37 °C, with the fluorogenic substrate ZMAL (Z(Ac)Lys-AMC) in a concentration of 10.5 μM and increasing inhibitor concentrations. Fluorescence intensity was measured at an excitation wavelength of 390 nm and an emission wavelength of 460 nm in a microtiter plate reader (BMG Polarstar).
Docking studies
Protein structures were retrieved from the Protein Data bank (PDB) (HDAC1 PDB ID: 4BKX, HDAC2 PDB ID: 5IWG, 7ZZS. HDAC3 PDB ID: 4A69) [23], [24], [25]. The docking was carried out using the Schrödinger program [26], [27] as previously reported [9], [21]. Validation of the molecular docking method was done with re-docking of ligands from available HDAC crystal structures. The solvent molecules (except one conserved water molecule W617) and ions (except the catalytic Zn2+ ion) were removed. For preparation of the proteins, the protein preparation wizard implementation of the Schrödinger version 2019.1 was used with the following steps: hydrogen atoms addition, protonation states assignation, and finally restrained energy minimization using the OPLS force field 2005. Generation of the ligand structures were done in the implemented 2D Sketcher of the Schrödinger version (version 2019.1). Afterwards, the LigPrep (version 2019.1) tool was used for the preparation of the inhibitors with energy minimization using OPLS force field 2005. Sixty-four conformers for each inhibitor were generated with the ConfGen (Schrödinger version 2019.1) tool of the same version. Preparation of the receptor grid for the docking procedure was applied by assigning the co-crystallized ligand as the centroid of the grid box. The active site of the proteins was defined with 10 Å radius grid box around the ligand. Standard precision (SP) mode was applied for docking. Ten docking poses were subjected for further post-docking minimization. The root mean square deviation (RMSD) values of the docking poses corresponding to the ligand binding mode in HDAC2 (5IWG), HDAC2 (7ZZS) and HDAC3 (4A69) are 0.29, 0.77, and 0.50 Å, respectively. Values below 1 Å are considered as good agreement to the experimental structures [28], [29]. Docking poses were visualized using the MOE2019.01 program [30]. The obtained HDAC-inhibitor docking complexes were further refined and re-scored using the AMBER:10:ETH force field and R-field solvation model (default force field setting in MOE2019.01) as implemented in MOE2019.01.
In silico prediction of pharmacokinetic and toxicological data
For the in silico prediction of pharmacokinetic and toxicological properties of the HDACi, the PreADMET (absorption, distribution, metabolism, excretion, and toxicity) web server (https://preadmet.qsarhub.com) was used. The PreADMET approach is based on different series of molecular descriptors that are considered for generating quantitative structure property relationship and classification models. The following properties were calculated: blood brain barrier penetration (BBB) [31], Caco2 cell permeability (Caco2 apparent permeability coefficient (Papp) nm/s) [32], human intestinal absorption (% HIA), plasma protein binding, buffer solubility (classification model), log P (consensus logP), and total polar surface area (TPSA Å2). Classification models were used to predict the inhibition of several cytochromes, hERG and para-glycoprotein (p-GP). Drug likeness was predicted using Lipinski's rule of five [33], the MDL Drug Data Report database [34], [35], and World Drug Index rule (WDI) [36]. To predict human organ toxicity, we used the PROTOX II approach developed by Preissner et al. [37], which is available online (https://tox-new.charite.de/protox_II/). The prediction method is based on the analysis of the structural similarity of compounds with known median lethal doses (LD50).
Cell culture
Experiments were carried out with HEL cells (erythroblast cell line from the bone marrow of a 30-year-old, white, male patient with erythroleukemia), Ramos cells (B-lymphocyte cell line from a 3-year-old, white, male Burkitt’s Lymphoma patient), RS4-11 cells (lymphoblast cells from the marrow of a 32-year-old, white, female patient with acute lymphoblastic leukemia), and human embryonic kidney cells (HEK293T cells, originally from a female fetus). The cells were kind gifts from Dr. Grez (Frankfurt/Main, Germany), Dr. Kosan (Jena, Germany), Prof. Böhmer (Jena, Germany), Prof. Heinzel (Jena, Germany), and were originally from the DSMZ (Braunschweig, Germany). Cells were cultured under sterile conditions at 37 °C and 5% CO2 in Roswell Park Memorial Institute-1640 (RPMI 1640, Sigma-Aldrich) for leukemic cells or Dulbecco’s Modified Eagle Medium (DMEM, Sigma-Aldrich) for HEK293T cells. Media were supplemented with 5% fetal calf serum (FCS) (Sigma-Aldrich) and 1% penicillin/streptomycin (Gibco). As previously reported [38], using 5% instead of 10% FCS reduces cell stress during proliferation. Cell density was kept below 400,000 cells per mL.
Immunoblot and antibodies
Immunoblot was done as recently described by us [39], [40], [41]. In brief, cells were seeded at 200,000 cells per mL in 6-well plates. Cells were harvested into 15 mL conical tubes, centrifuged (300 × g, 5 min) and the supernatant was aspirated. Cell pellets were resuspended in 1 mL ice-cold PBS, transferred to 1.5 mL tubes, and centrifuged (21,000 × g, 5 min, 4 °C). Cells were lysed on ice in NET-N buffer (100 mM NaCl, 10 mM Tris-HCl pH 8, 1 mM EDTA, 10% glycerin, 0.5% NP-40; plus cOmplete protease inhibitor tablets (Roche) and phosphatase inhibitor cocktail 2 (Sigma)) for 25 min and sonified (10 s/40% amplitude). Lysates were centrifuged (21,000 × g, 25 min 4 °C) and protein concentrations were adjusted using the Bradford assay. Afterwards, 35–40 µg lysate were denatured in 6x loading buffer (375 mM Tris-HCL pH 6.8, 12% SDS (w/v), 30% glycerol, 500 nM DTT, and bromophenol blue in H2O) and loaded onto SDS-PAGE gels. Electrophoresis was performed at 95 V for 10 min and increased to 125 V for the remaining time. Proteins were blotted onto 0.2 µm nitrocellulose membranes (Amersham Protran, GE Healthcare) for 2 h. Membranes were blocked in 5% non-fatty dry milk in TBS-T for 1 h and placed in primary antibodies for a minimum of 16 h at 4 °C. Secondary antibodies were applied for 2 h at room temperature at 1 µg/6250 µL for infrared (IR) dye-based and 1 µg/4200 µL in case of horseradish peroxidase (HRP)-linked secondary antibodies. IR dye-coupled antibodies were detected using the Odyssey imaging system (LI-COR), HRP-linked antibodies were detected using the Ibright CL-1000 imaging system (Thermo Fischer).
Primary antibodies used in this work:
| primary antibody | host | dilution | catalogue number | manufacturer |
|---|---|---|---|---|
| anti-α-tubulin | rabbit | 1:30.000 | ab6560 | Abcam, Cambridge, UK |
| anti-acetylated histone H3 | rabbit | 1:500 | 06–599 | Merck Millipore, MA, USA |
| anti-acetylated histone H4 | rabbit | 1:1000 | 8674 | Cell Signaling Tech., MA, USA |
| anti-BAK | rabbit | 1:500 | ab32371 | Abcam, Cambridge, UK |
| anti-BCL-XL | rabbit | 1:500 | ab32370 | Abcam, Cambridge, UK |
| anti-beclin-1 | rabbit | 1:500 | 3495 | Cell Signaling Tech., MA, USA |
| anti-BID | rabbit | 1:1000 | 2002 | Cell Signaling Tech., MA, USA |
| anti-β-actin | mouse | 1:1000 | sc47778 | Santa Cruz Biotechnology, Heidelberg, DE |
| anti-cleaved caspase-3 | rabbit | 1:1000 | 9661 | Cell Signaling Tech., MA, USA |
| anti-cleaved PARP1 | mouse | 1:1000 | 552,596 | BD Biosciences, Heidelberg, DE |
| anti-ERK1/ERK2 | mouse | 1:1000 | sc271269 | Santa Cruz Biotechnology, Heidelberg, DE |
| anti-GAPDH | rabbit | 1:1000 | ab128915 | Abcam, Cambridge, UK |
| anti-HSP90 | mouse | 1:1000 | ADISPA830 | Enzo Life Sciences, NY, USA |
| anti-LC3B | rabbit | 1:500 | 3868 | Cell Signaling Tech., MA, USA |
| anti-MCL1 | rabbit | 1:500 | sc-819 | Santa Cruz Biotechnology, Heidelberg, DE |
| anti-p53 | mouse | 1:500 | sc-126 | Santa Cruz Biotechnology, Heidelberg, DE |
| anti-p62 | rabbit | 1:500 | sc-25575 | Santa Cruz Biotechnology, Heidelberg, DE |
| anti-PARP1 | mouse | 1:1000 | 556,362 | BD Biosciences, Heidelberg, DE |
| anti-pERK1/pERK2 (T202/Y204) | rabbit | 1:1000 | 9101 | Cell Signaling Tech., MA, USA |
| anti-pULK1 (S757) | rabbit | 1:100 | 14,202 | Cell Signaling Tech., MA, USA |
| anti-survivin | rabbit | 1:500 | ab134170 | Abcam, Cambridge, UK |
| anti-ULK1 | rabbit | 1:500 | 8054 | Cell Signaling Tech., MA, USA |
| anti-vinculin | mouse | 1:500 | sc-73614 | Santa Cruz Biotechnology, Heidelberg, DE |
| anti-XIAP | rabbit | 1:500 | 2042S | Cell Signaling Tech., MA, USA |
Secondary antibodies used in this work:
| secondary antibody | host | catalogue number | manufacturer | |
|---|---|---|---|---|
| IRDye©680RD anti-mouse IgG | goat | 925–68070 | LI-COR, NE, USA | |
| IRDye©680RD anti-rabbit IgG | goat | 925–68071 | LI-COR, NE, USA | |
| IRDye©800CW anti-mouse IgG | goat | 925–32210 | LI-COR, NE, USA | |
| IRDye©800CW anti-rabbit IgG | goat | 925–32211 | LI-COR, NE, USA | |
| anti-mouse IgG, HRP-linked antibody | horse | 7076 | Cell Signaling Tech., MA, USA | |
| anti-rabbit IgG, HRP-linked antibody | horse | 7074 | Cell Signaling Tech., MA, USA |
Measurement of apoptosis
Annexin-V binds to phosphatidylserine, which becomes exposed on the outer membrane of early and late apoptotic cells. Propidium iodide (PI) stains DNA and is utilized as a marker of late-stage apoptosis and necrosis, with non-intact cell membranes [39], [40], [41]. In brief, cells were seeded at 200,000 cells per mL in 24-well plates and harvested into flow cytometry tubes. HEL cell cultures have some cells attached to the culture dishes. Such cells should be collected by trypsinization. Cells were centrifuged (300 × g, 5 min), washed twice in ice-cold PBS, resuspended in 2.5 µL annexin-V (BD Bioscience) diluted in 50 µL annexin-V binding buffer (1 mM HEPES, 0.14 M NaCl, 0.25 mM CaCl2, adjusted to pH 7.4 with KOH), and kept in the dark. After 15 min, 10 µL of PI (Sigma-Aldrich) solution (50 µg/mL, diluted in 430 µL annexin-V binding buffer) were added. Cells were analyzed after 10 min with a FACS Canto II flow cytometer. Data were examined with the FACSDiva software. To calculate IC50 values, we chose logarithmic scale concentrations from 2.5 nM to 5 µM in GraphPad Prim 6.
Cell cycle analysis
We recorded cell cycle profiles by flow cytometry [39], [40], [41]. PI is a marker for DNA contents in different phases of the cell cycle. From G1 phase to G2/M phase, the cellular DNA content increases from 2 N to 4 N. Apoptotic cells have DNA contents below 2 N (termed subG1 fractions). In brief, cells were seeded at 200,000 cells per mL in 24-well plates. Both floating and adherent cells were harvested and washed twice with ice-cold PBS. After discarding the PBS, 1 mL ice-cold 80% ethanol was added dropwise while vortexing to fix the cells. After storage at −20 °C for at least 2 h, samples were centrifuged, and ethanol was discarded. To prevent false measurement of RNA instead of DNA, fixed cells were treated with 333 µL PBS supplemented with 1 µL RNAse (10 mg/mL) (Roche) at 37 °C for 30 min at room temperature. Cells were treated with 164 µL PI-staining solution (50 μg/mL) and measured after 10 min using a FACS Canto II. Further data analysis was carried out with FACSDiva and GraphPad Prism 6.
Cancer dependency map (DepMap) data base analysis
CRISPR dependency data (CHRONOS scores) and TP53 (gene encoding the transcription factor p53) mutation data for cell lines of myeloid and lymphoid lineages were both downloaded from the publicly available 2022 Q4 DepMap release using the Broad Institute’s DepMap portal (https://depmap.org/portal/). The Wilcoxon rank-sum test, which does not require that the data show a normal distribution test, was applied to compare dependency scores between TP53 wild-type and TP53 mutant cell lines.
Additional software used in this work to collect biological data
| software | developers |
|---|---|
| BD FACSDivaTM CS 6 | BD Biosciences, Heidelberg, DE |
| Cell Imaging Software | Olympus Soft Imaging Solutions, Münster, DE |
| Flowing Software 2.5.1 | Turku Bioscience Centre, Turku, FIN |
| GraphPad Prism Version 6 | GraphPad Software, CA, USA |
| Image Studio Lite 5.2 | LI-COR, NE, USA |
| MS Office 365 | Microsoft, Unterschleißheim, DE |
| Odyssey Version 3.0 | LI-COR, NE, USA |
| RStudio 2023.03.1 | Posit PBC, Boston, MA, USA |
Measurement of autophagy
Autophagy detection was performed with a kit from Enzo life sciences. This tool contains the Cyto-ID® dye that labels autophagic vacuoles [42]. In brief, 200,000 cells per mL were seeded in 12-well plates and harvested into flow cytometry tubes. Cells were centrifuged (300 × g, 5 min) and washed with 1 mL ice-cold PBS. Cells were re-centrifuged, and PBS was discarded. Pellets were resuspended in 250 µL RPMI (phenol-red free) with 5% FCS. Cyto-ID® dye was diluted 1:1000 in RPMI (phenol-red free) with 5% FCS. Each sample was subjected to 250 µL dye-RPMI mixture, gently vortexed, and stored at 37 °C and 5% CO2 for 30 min. Samples were centrifuged (300 × g, 5 min), resuspended in 2 mL PBS, and re-centrifuged (300 × g, 5 min). Pellets were resuspended in 500 µL PBS and measured using a FACS Canto II flow cytometer (BD Biosciences).
Statistical analysis
Statistical analysis of annexin-V/PI and cell cycle measurement data were done using two-way ANOVA tests with Bonferroni correction using GraphPad Prism 6 (*p < 0.05, **p < 0.01, ***p < 0.001, ****p < 0.0001). Statistical analysis of autophagy detection was done using one-way ANOVA tests with Dunnett multiple comparison using GraphPad Prism 6 (*p < 0.05, **p < 0.01, ***p < 0.001, ****p < 0.0001). Cancer dependency data was analyzed in RStudio 23.03.1 using the Wilcoxon rank-sum test.
Results
In vitro activity of new HDACi of the KH-series: KH9, KH16, and KH29
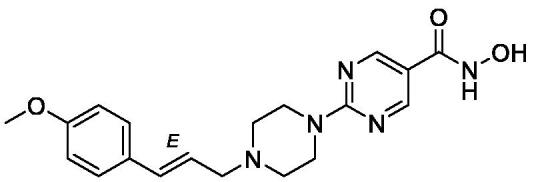
We synthesized a battery of pyrimidine-based hydroxamic acids as potential HDACi and tested them with established enzymatic assays [9] in vitro (KH-series, Table 1). Synthesis details and analytical characterization of these compounds are described in the supplementary information file SI and Figs. S1-S13. KH9, KH16, and KH29 have low nanomolar in vitro activity against class I HDACs (Table 1). The three compounds were similarly active against HDAC2 (IC50 = 22–34 nM). KH9 and KH29 were most active against HDAC1 (IC50 = 9 nM) and KH16 was most active against HDAC3 (IC50 = 6 nM). Except for KH29, the KH-compounds were less active against the class I HDAC HDAC8 (IC50 = 49–530 nM) and the class IIB HDAC HDAC6 (IC50 = 25–460 nM). All agents showed far weaker activity against the class IV HDAC HDAC11 (IC50 = 870–1500 nM) (Table 1).
Table 1.
In vitro activity of KH9, KH16, and KH29 against the indicated HDACs.
| compound | structure | HDAC1 IC50 µM | HDAC2 IC50 µM | HDAC3 IC50 µM | HDAC6 IC50 -μM | HDAC8 IC50 µM | HDAC11 IC50 μM |
|---|---|---|---|---|---|---|---|
| KH9 |  |
0.0089± 0.0005 | 0.022±0.001 | 0.019±0.001 | 0.14±0.01 | 0.11±0.01 | 1.5±0.1 |
| KH16 |  |
0.013±0.001 | 0.034±0.001 | 0.0060 ± 0.0001 | 0.46±0.03 | 0.53±0.03 | 0.87±0.08 |
| KH29 |  |
0.0094± 0.0005 | 0.026±0.001 | 0.020±0.001 | 0.025±0.001 | 0.049±0.002 | 1.0±0.1 |
| SAHA |  |
0.101±0.007 | 0.43±0.009 | 0.21±0.01 | 0.013±0.001 | 0.42±0.08 | n.d. |
KH9, KH16, and KH29 contain the hydroxamic acid moiety which is present in the clinically approved HDACi SAHA. SAHA is an at least eightfold less potent inhibitor of HDAC1, HDAC2, and HDAC3 than KH9, KH16, and KH29. SAHA and KH29 are similarly effective against HDAC6, and both are at least 10-fold more potent inhibitors of HDAC6 than KH9 and KH16 (Table 1).
These data show that the KH-compounds are low nanomolar inhibitors of the cancer-associated enzymes HDAC1, HDAC2, and HDAC3 in vitro.
In silico ADMET results
To further analyze the in vivo potential of the inhibitors, we calculated several physicochemical properties and predicted pharmacokinetic parameters (Table S1). For predictions, we used the PreADMET (https://preadmet.qsarhub.com/adme/) and PROTOX II (https://tox-new.charite.de/protox_II/) web services. The in silico pharmacokinetic data, e.g., Caco2 apparent permeability (Papp nm/s) and human intestinal absorption (HIA %) as well as physicochemical data, e.g., TPSA and consensus logP predict that the KH-compounds are cell permeable and display oral bioavailability. All three compounds were classified as well-absorbed compounds (HIA 70–100%) with good to high solubility. In addition, the predicted human toxicity values from various assays gave suitable results for the studied compounds (Table S1).
Assessment of apoptosis induction by KH-compounds
The low nanomolar inhibitory activity of the KH-compounds encouraged us to test them in leukemic cells. Since HDACi are considered for the treatment of myeloproliferative neoplasms (MPNs) [2], [19], we chose HEL erythroleukemia cells as testbed to analyze cellular effects of our new HDACi. We treated these cells with KH9, KH16, and KH29 and assessed early apoptosis (annexin-V positivity) and late apoptosis (annexin-V/PI positivity) by flow cytometry. We calculated the IC50 values for total apoptosis induction by the KH-compounds and used the clinically validated HDACi SAHA for comparison. KH9 induced apoptosis starting at approximately 50 nM and with a corresponding IC50 value of 164.8 ± 2.13 nM. KH29 was similarly effective, with apoptosis induction starting at 55 nM and an IC50 value of 162.0 ± 2.12 nM. KH16 was the most effective agent, starting to trigger apoptosis at 30 nM and with an IC50 value of 110.0 ± 2.10 nM. SAHA evoked apoptosis at a concentration starting from approximately 400 nM and with an IC50 value of 1214.4 ± 1.92 nM (Fig. 1A-D). KH16 had the lowest IC50 value of the KH-compounds and an 11-fold lower IC50 value than SAHA had. Comparison of IC50 values demonstrated that KH9, KH16, and KH29 were significantly more effective than SAHA (p < 0,0001) (Fig. 1E).
Fig. 1.

HDACi of the KH-series induce apoptosis of leukemic cells. (A-D) HEL cells were treated with increasing concentrations ranging from 25 nM to 5 µM of either KH9, KH16, KH29, or SAHA for 24 h. Cytotoxicity was determined by annexin-V/PI staining using flow cytometry. (E) Overlay of data collected in (A-D) SAHA (black), KH9 (blue), KH16 (red), KH29 (green). IC50 values were determined from independent experiments (KH-series n = 4, SAHA n = 3; **** p < 0.0001 for SAHA versus the KH-compounds; mean ± SD for A-D and mean ± SE for E). (For interpretation of the references to colour in this figure legend, the reader is referred to the web version of this article.)
These results show that the three KH-compounds are up to 11-fold more potent than their parent compound SAHA in leukemic cells. These data correspond to the notion that the KH-compounds have a higher in vitro activity against HDAC1, HDAC2, and HDAC3 than SAHA (Table 1). KH16 exerts the strongest impact on HDAC3 in vitro and this translates into the strongest impact on leukemic cell survival.
KH16 binds class I HDACs through structurally defined regions
To rationalize the high inhibitory potency of the structurally highly similar KH16 and KH29 for HDAC1, HDAC2, and HDAC3 (Table 1), we docked them into available crystal structures. Modelling the interaction of KH-compounds with HDAC1, HDAC2, and HDAC3 unraveled that in all three HDACs, the hydroxamate coordinates the Zn2+ at the bottom of the catalytic clefts of the HDACs. The pyrimidine ring is sandwiched between two conserved phenylalanine residues in the acetyllysine tunnel. The protonated piperazine forms a salt-bridge with the D99 residue in HDAC1/HDAC2 (corresponding to D92 in HDAC3). For HDAC1 and HDAC2, their capping groups (methoxyphenyl of KH9, indole of KH16, and methylindole of KH29) make van-der-Waals interactions with the F205/F210 moieties in HDAC1/HDAC2 and the corresponding F200 residue in HDAC3. The overall binding mode of the inhibitors to HDAC1 and HDAC2 is highly similar. In HDAC3, KH16 has a different orientation of the capping group that is stabilized by a hydrogen bond between its indole NH and the D92 moiety. This interaction cannot be observed for the methylated agents KH29 and KH9, which do not possess a hydrogen bond donor in the capping group. This interaction is also not observed for KH16 docked to HDAC1 and HDAC2 due to a different conformation of this part of the binding pocket. In addition, we calculated the docking scores and binding energies ΔH of the KH-compounds as well as the reference SAHA for HDAC1, HDAC2, and HDAC3 (Table S2). The KH-compounds show better docking scores compared to SAHA. This mirrors their superior HDAC inhibition in vitro (Table 1). KH16 showed the best docking score to HDAC3. This can be explained by the additional hydrogen bond between the indole ring and D92. The same trend was noted for the calculated binding energies ΔH. Concerning HDAC1 and HDAC2, KH9 shows the best binding energy, whereas KH16 is the strongest binder for HDAC3. Thus, its unique interaction profile can in part explain the high potency of KH16 for HDAC3 (Fig. 2A-C; S14-S16). The 2D plots of the HDAC-HDACi interactions are included in Figs. S17-S19.
Fig. 2.

Binding mode of KH16 to class I HDACs and accumulation of hyperacetylated histone H3. (A-C) Binding mode of KH16 (colored green) at HDAC1, HDAC2, and HDAC3. Hydrogen bonds between inhibitors and proteins are shown as yellow-colored dashed lines. Coordinative binding to the Zn2+ ion (colored cyan) is indicated by cyan colored dashes lines. Salt bridges are shown as purple-colored dashed lines. Aromatic interactions are shown as dark blue colored dashed lines. (D) HEL cells were treated with 50, 100, or 200 nM KH16 for 24 h or 100 nM KH16 for 24 h to 48 h. Immunoblots were performed with antibodies against acetylated histone H3 and vinculin or α-tubulin as independent loading controls; ac-H3, acetylated histone H3. Data are representative for two or more independent experiments. Numbers indicate densitometry values for the proteins, divided by those for the loading controls. Untreated samples are set as 1.0. (For interpretation of the references to colour in this figure legend, the reader is referred to the web version of this article.)
Of the three KH-compounds, KH16 is the most potent in vitro and in cells. To investigate if KH16 has on-target activity for the cancer-relevant class I HDACs, we analyzed the acetylation of their prototypical targets histones H3 and H4 in cells [43]. We applied 50–200 nM KH16 for 24 h or 100 nM for 24 h to 48 h. KH16 increased acetylated histone H3 levels dose-dependently up to nearly 70-fold. After 24 h, 100 nM KH16 induced an over 30-fold increase in acetylated histone H3. This effect persisted over at least 48 h (Fig. 2D). Furthermore, the accumulation of the acetylated histones H3 and H4 was induced more strongly by KH16 than by SAHA and the selective, benzamide-based HDAC1, HDAC2, and HDAC3 inhibitor MS-275 (entinostat; Fig. S20).
These data illustrate the interaction of KH9, KH16, and KH29 with class I HDACs and verify that KH16 inhibits class I HDACs in leukemic cells.
KH16 causes cell cycle arrest and DNA fragmentation
Of the KH-compounds, KH16 has the lowest IC50 value (Fig. 1E). Therefore, we used KH16 for all further experiments with tumor cells. We used flow cytometry to test if the induction of protein hyperacetylation and apoptosis by KH16 are linked to cell cycle arrest of HEL cells. As expected, untreated HEL cells showed a typical cell cycle distribution in the G1, S, or G2/M phases, and only 7.6 ± 2.2% of cells were detectable as subG1 fractions with fragmented DNA (Fig. 3A). Treatment with 100 nM KH16 for 24 h decreased the numbers of cells in the S phase and G2/M phases. After 48 h, the G2/M phase population was decreased significantly by KH16. The numbers of cells in the G1 phase were not significantly changed by KH16 after 24 h and 48 h. The subG1 fractions increased significantly to 40 ± 11.2% and 55 ± 3.5% in a time-dependent manner (Fig. 3A).
Fig. 3.

KH16 dysregulates the cell cycle and apoptosis regulators in HEL cells. (A) HEL cells were treated with 100 nM KH16 for 24 h or 48 h; -, untreated cells. Cells were fixed, stained with PI, and analyzed by flow cytometry. Results are derived from three independent experiments. Statistical tests for cell cycle analysis were performed using two-way ANOVA with Bonferroni correction (** p < 0.01, *** p < 0.001, **** p < 0.0001). (B) KH16 blocks ERK phosphorylation. HEL cells were treated with 50, 100, or 200 nM KH16 for 24 h. Immunoblots were performed with antibodies against ERK1/ERK2, phosphorylated ERK1/phosphorylated ERK2, and α-tubulin as loading control. (C) Treatment of HEL with 100 nM KH16 was applied for 24 and 48 h. Indicated proteins are analyzed as mentioned in B). (D) KH16 activates caspase-3 and cleavage of its substrate PARP1 concentration-dependently. HEL cells were treated with 50, 100, or 200 nM KH16 for 24 h. Immunoblots were performed with antibodies against cleaved caspase-3, cleaved PARP1, and β-actin as loading control; cl, cleaved; casp, caspase. (E) Time-dependent activation of caspase-3 and PARP1 processing by 100 nM KH16. HEL cells were treated with 100 nM KH16 for 24 h or 48 h. Immunoblots were performed with antibodies against cleaved caspase-3, cleaved PARP1, and β-actin as loading control. (F,G) Dose- and time-dependent alteration of apoptosis regulators by KH16. HEL cells were treated with 50, 100, or 200 nM KH16 for 24 h (F), or 100 nM KH16 for 24 h to 48 h (G). Immunoblots were performed with antibodies against BID, BAK, XIAP, p53, survivin, BCL-XL, MCL1, with α-tubulin, β-actin and GAPDH as loading control; fl. full-length; MCL1(L), MCL1 large isoform. Quantifications were normalized to the loading control, untreated cells defined as 1.0. Data are derived from two or more independent experiments.
HEL cells have a constitutive activity of mitogen-activated protein kinases and extracellular signal-regulated kinases (MAPK/ERK1/ERK2). These promote cell cycle entry and unrestricted cell proliferation [44]. Treatment with 50 nM KH16 for 24 h strongly decreased the phosphorylation of ERK1/ERK2 at T202/Y204. This was not further augmented by 100–200 nM KH16. Total ERK1/ERK2 levels remained unchanged by KH16 (Fig. 3B). A concentration of 100 nM KH16 diminished pERK1/pERK2 at 24 h and this effect persisted up to 48 h (Fig. 3C).
These results show that nanomolar concentrations of KH16 stall cell cycle progression, cause DNA fragmentation, and suppress kinase signaling.
KH16 dysregulates apoptosis regulators
Apoptosis is executed upon the limited proteolysis of pro-caspases into active enzymes. Activated caspase-3 is the ultimate death executioner at a “point-of-no-return” [14], [45]. This holds for HDACi-induced apoptosis [1], [4]. We treated HEL cells with 50–200 nM KH16 for 24 h and 100 nM KH16 for 24 h and 48 h and probed lysates from these cells for cleaved caspase-3 by immunoblot. We found a dose-dependent accumulation of active, cleaved caspase-3 fragments. Consistent herewith, we noted an accumulation of the cleaved form of the DNA repair protein PARP1 (Fig. 3D), which is a typical target of active caspase-3 in HDACi-treated tumor cells [41]. We further noted a time-dependent activation of caspase-3 and subsequent cleavage of PARP1 (Fig. 3E).
Next, we investigated the underlying mechanisms of KH16-induced apoptosis in HEL cells by immunoblot. Pro-apoptotic and anti-apoptotic proteins of the BCL2 family control mitochondrial integrity and thereby mitochondrially mediated apoptosis [14], [45]. An application of 50–200 nM KH16 for 24 h dose-dependently and significantly attenuated the levels of the anti-apoptotic BCL2 family members BCL-XL and MCL1 (Fig. 3F). The pro-apoptotic BAK is activated by truncated BID and forms pores in mitochondrial membranes to trigger release of cytochrome-c for caspase activation [46]. Full-length BID was processed, which propels apoptosis. BAK was expressed in resting HEL cells and KH16 augmented BAK levels dose- and time-dependently (Fig. 3F,3G). KH16 additionally reduced the anti-apoptotic proteins XIAP and survivin. An application of 50 nM KH16 for 24 h attenuated XIAP and survivin as effective as 100–200 nM KH16 (Fig. 3F). These effects persisted and increased upon a 48-h treatment period (Fig. 3G).
The transcription factor p53 suppresses aberrant cell growth, but mutants thereof promote tumorigenesis and therapy resistance [47], [48], [49]. HEL cells carry p53 with an inactivating M133K mutation in its DNA-binding domain [50], [51]. KH16 dose- and time-dependently reduced this mutant p53 protein (Fig. 3F,3G).
These results illustrate that KH16 modulates anti-apoptotic and pro-apoptotic proteins. This ties in with caspase-dependent apoptosis.
HDAC3 is a valid target in blood cancer cells
Of the new HDACi of the KH-series, KH16 is the most effective inhibitor of HDAC3 and the most effective inducer of apoptosis (Table 1, Fig. 1). We therefore analyzed whether HDAC3 is a dependency factor in various leukemic cells using data from the DepMap project. This database includes genome-wide CRISPR-Cas9 screens across a large panel of well-characterized human tumor cell lines (https://depmap.org/portal/). The dependency of a cell line on a gene is reported as a dependency score, which represents the effect of the gene knockout on cell growth and viability. A score of zero indicates that a cell line is not dependent on the gene, whereas (strongly) negative scores indicate that the gene is essential in the given cell line. Analysis of the DepMap CRISPR-Cas9 dataset identified that both myeloid and lymphoid tumor cells depend on HDAC3 for their proliferation and/or survival (Fig. 4A). The transcription factor p53 is a major tumor suppressor and mutated in 5–40% of aggressive myeloid and lymphoid cancer subtypes [47], [48], [49]. Like p53 wild-type leukemic cells, p53 mutant cells depend on HDAC3 (Fig. 4A).
Fig. 4.

Myeloid and lymphoid leukemic cells rely on HDAC3 and are susceptible to KH16. (A) DepMap data analysis of HDAC3 dependencies in a panel of myeloid and lymphoid cell lines (115 specimen). Cell lines were stratified according to their TP53 status into p53 wild-type and p53 mutant cell lines. The boxplot shows the interquartile range in the box with the median as a horizontal line, the whiskers extend to 1.5 times the interquartile range. Each dot represents one cell line. p-values were determined using the Wilcoxon rank-sum test. A dependency score of 0 indicates that HDAC3 is not essential in each cell line, whereas a dependency score < 0 indicates that the cell line is more likely to be dependent on HDAC3. The median score of all common essential genes is −1. The Wilcoxon test was used to assess if there is a statistically significant difference in the HDAC3 dependency between p53 wild-type and p53 mutant cell lines. The p53 status has no statistically significant impact on the HDAC3 dependency: p = 0.77 for myeloid and p = 0.66 for lymphoid tumor cells. (B) RS4-11 cells were treated with 50, 100, or 200 nM KH16 for 24 or 48 h (n = 3). Statistical tests were performed using two-way ANOVA test with Bonferroni correction (* p < 0.05, ** p < 0.01, **** p < 0.0001). (C) Ramos cells were treated with 50, 100, or 200 nM KH16 for 24 h. Immunoblots were performed with antibodies against cleaved caspase-3 and cleaved PARP1 with HSP90 as loading control; cl, cleaved; casp, caspase. (D) The impact of 50, 100, and 200 nM KH16 on HEK293T cells after 24 h and 48 h was determined by annexin-V/PI-staining and flow cytometry (n = 3). HEL cells treated with 100 nM KH16 for 48 h were used as positive control for apoptosis induction (n = 2); two-way ANOVA, Bonferroni correction; **** p < 0.0001. (E) HEK293T cells and HEL cells (positive control) were treated with 50, 100, or 200 nM KH16 for 24 h. Immunoblots were performed with antibodies against cleaved caspase-3 and cleaved PARP1, and HSP90 as loading control. Experiments represent two or more independent repetitions.
Due to these findings and to extend our data for the efficacy of KH16 against HEL cells, we assessed whether it induces apoptosis in human acute lymphoblastic leukemia cells (RS4-11, p53 wild-type) and B-cell lymphoma cells (Ramos, p53 mutant) [52], [53]. KH16 activated caspase-3, the processing of PARP1, and annexin-V/PI positivity in these cells (Fig. 4B,4C; S21), indicating efficient apoptosis induction.
To exclude that KH16 has general and non-selective killing effects, we incubated human embryonic kidney cells with KH16. These cells did not become apoptotic after 48 h when KH16 doses up to 200 nM KH16 were applied to them (Fig. 4D). Consistent herewith, no activation of caspase-3 in response to KH16 was observed in these cells (Fig. 4E).
These data show that HDAC3 is a rational drug target in leukemic cells.
KH16 triggers disruption of autophagy proteins
Autophagy is initiated by the formation of autophagosomes, which require catalytically active UNC-51 like autophagy activating kinase (ULK1), activated LC3B, and beclin-1. The sequestosome 1 (p62/SQSTM1) protein is degraded inside the autophagosome [54]. This multifunctional protein sorts ubiquitinylated proteins together with itself for degradation by autolysosomes [15]. We found that KH16 dose-dependently reduced the autophagy substrate p62 after 24 h in HEL cells (Fig. S22). This effect was pronounced after 48 h (Fig. 5A). Moreover, there was a time-dependent reduction of the autophagy-inhibiting phosphorylation of ULK1 at S757 and a decrease of the autophagy-promoting protein beclin-1 by 100 nM KH16 (Fig. 5A). Activation of LC3B manifests as phosphatidylethanolamine-conjugated band that migrates faster in immunoblot analyses. This conversion of LC3-I to LC3-II denotes autophagosome formation [54]. We noted a reduction of total LC3B after 24 h and a non-significant accumulation of the active form after 48 h in KH16-treated cells (Fig. 5A). Since the reduction of the inhibitory phosphorylation of ULK1 may still indicate autophagy, we suppressed it with chloroquine. This compound prevents the autophagosome-lysosome fusion and thereby interrupts the autophagic flux [55]. Chloroquine did not alter the KH16-induced activation of caspase-3 and PARP1 cleavage (Fig. 5B). Furthermore, KH16 did not induce autophagosome formation, but even attenuated the chloroquine-induced accumulation of autophagosomes (Fig. 5C,5D).
Fig. 5.

KH16 modulates autophagy and apoptosis in leukemic cells. (A) HEL cells were treated with 100 nM KH16 for 24 h to 48 h or 50 µM chloroquine for 24 h. Immunoblots were performed with antibodies against ULK1 phosphorylated at S757, p62, LC3B, beclin-1, and β-actin as loading control. (B) HEL cells were treated with 50 nM KH16 ± 50 µM chloroquine for 24 h. Immunoblots were performed against cleaved caspase-3, PARP1, and HSP90 as loading control; CQ, chloroquine; fl, full-length; cl, cleaved; casp., caspase. (C) HEL cells were treated with 50 nM KH16 ± 50 µM chloroquine for 24 h. Autophagy was measured using flow cytometry and the Cyto-ID® kit. Representative overlay histogram of fluorescence spectra of the untreated control (grey), chloroquine (red), KH16 (green), and the combination of KH16 and chloroquine (blue). (D) Cells were treated as in (C). Statistical evaluation of mean fluorescence intensities was measured (n = 3), one-way ANOVA, Dunnett multiple comparison (* p < 0.05, **** p < 0.0001); a.u., arbitrary units. (E) HEL cells were treated with 50 or 100 nM KH16 ± 20 or 50 µM z-VAD-FMK for 24 h. Immunoblots were performed with antibodies against ULK1 S757, p62 and PARP1; β-actin as loading control. Quantifications were normalized to the loading control, untreated cells defined as 1.0. The data represent the outcomes of two or more independent repetitions. (For interpretation of the references to colour in this figure legend, the reader is referred to the web version of this article.)
These data let us speculate that the reduction of p62 and pULK1 by KH16 is not indicative of increased autophagy. Since KH16 causes apoptosis (Fig. 1,3), we speculated that caspase activation decreased p62 and ULK1. Like the established caspase-3 target PARP1, ULK1 was processed into a smaller protein fragment in KH16-treated HEL cells. This effect occurred dose-dependently. The pan-caspase inhibitor z-VAD-FMK restored full-length ULK1 and prevented its processing into the smaller fragment. Z-VAD-FMK also restored the levels of p62 in such cells (Fig. 5E).
These findings unravel that caspases cleave major autophagy-inducing proteins in KH16-treated cells. Hence, we conclude that KH16 has a negative impact on autophagy through activation of caspases and a subsequent degradation of autophagy proteins.
Discussion
HDACi are an approved therapeutic option for cutaneous T-cell lymphoma and myeloma [1], [4], [5]. The hydroxamic acid-based HDACi panobinostat and givinostat produced promising results in MPN patients [56], [57]. Since KH16 is effective against human MPN cells, acute lymphoblastic leukemia cells, and B-cell lymphoma cells [52], [53], it may equally be a promising drug for treating such hematological diseases.
In vitro and in cells, HDACi of the KH-series are more potent inducers of apoptosis in leukemic cell cultures than their parental structure SAHA [6]. KH16 is the most potent of them and has the strongest activity against HDAC3. HDAC3 controls key survival functions in leukemic cells, such as cell proliferation, apoptosis, DNA replication forks, and genomic integrity [40], [58], [59], [60], [61], [62], [63], [64]. These data together with CRISPR-Cas9 screening data from a panel of 115 human myeloid and lymphoid cancer cells of different lineages suggest that HDAC3 is a particular vulnerability of blood cancer cells and that future research on HDACi should focus on agents with strong activity against HDAC3. The narrower inhibition profile of KH16 compared to established HDACi, combined with its high anti-proliferative activity suggest a further testing of KH16 and derivatives thereof. According to our results, these should contain an unmethylated indole in the capping group for interaction with HDAC3.
KH16 is an improvement of SAHA, which is approved for the treatment of blood malignancies in humans. The corresponding safety and toxicology data for SAHA are publicly available. Such advanced research appears to be superior to animal data and, notably, authorities like the US Food-and-Drug-Administration no longer require animal tests before human drug trials [65]. In addition, like our data with human embryonic kidney cells, data from whole mice demonstrate that HDAC3 is not a dependency factor of normal tissues [66].
Apoptosis is an event resulting from multiple cellular alterations [14], [45]. We see dose-dependent molecular changes in various pro- and anti-apoptotic regulators (BID, XIAP, p53, BCL-XL, MCL1, PARP1) and caspase-3 activation. These culminate in the orchestration of apoptosis. Previous studies showed that class I HDAC inhibition reduced p53 levels [41], [67], [68], [69], [70]. Congruently, KH16 attenuates p53 levels. Wild-type p53 acts as a tumor suppressor gene with the capability to induce cell death via apoptosis. HEL cells carry the p53M133K mutation rendering p53 inactive [50]. It remains to be shown whether this mutant p53 induces survivin and BCL-XL like p53R172H (corresponds to the human p53 hotspot mutation p53R175H) in murine tumor cells [68], [69]. If this applies, reduction of p53M133K might have caused the attenuation of survivin and BCL-XL in HEL cells. Irrespective thereof, our analyses demonstrate that leukemic cells rely on HDAC3. Hence, patients with different p53 status may profit from KH16 and other HDACi with a strong inhibitory impact on HDAC3.
KH16 mainly reduced cells in the S- and G2/M−phases and had a lesser impact on cells in G1 phase. The stronger sensitivity of such cells is consistent with the literature and multiple explanations for this have been provided for leukemic cells. These include, but are not limited to, an inhibition of the S phase-dependently induced transcription factor NF-κB [69], [71], [72], the induction of DNA replication stress/DNA damage [40], [58], [59], [60], [62], inactivation of signaling through the transcription factor STAT5 [73], and a disruption of proper mitosis [74]. Consistent herewith, KH16-induced cell cycle disruptions are linked to a significant fragmentation of DNA. Activated ERK1/ERK2 regulate gene expression driving cell cycle progression as well as resistance towards kinase inhibitors [44], [75]. Albeit we did not specifically investigate other proteins in the MAPK/ERK pathway, our observations suggest that the inactivation of ERKs by KH16 is a mechanism contributing to cell cycle arrest and apoptosis.
Apoptosis appears as the main anti-leukemic mechanism that KH16 induces. In some experiments, we noticed cleavage of PARP1 before a detectable activation of caspase-3. This can be explained by a processing of PARP1 by additional apoptosis-promoting enzymes, such as caspase-7 [76], [77]. In addition to apoptosis, HDACi modulate autophagy in leukemic cells [5]. Opposed to the destruction of cells by apoptosis, autophagy is characterized by self-digestion through autophagosomes. This frequently protects cells from HDACi-induced apoptosis [5], [16], [17], [18], [54]. KH16 decreases pS757-ULK1, which suppresses autophagy, as well as the autophagy inducers p62 and beclin-1. An activation of ULK1 and attenuation of p62 can indicate ongoing apoptosis [15], [54]. However, experiments with chloroquine suggest that autophagy plays a minor role in the KH16-mediated cell death. Instead, KH16 induces the caspase-mediated processing of ULK1 and p62. Thus, apoptosis can operate as an upstream regulator of autophagy in HDACi-treated leukemic cells.
The induction of autophagy can be an undesired effect of HDACi. For example, SAHA induces autophagy in chronic myeloid leukemia cells. This process restricts HDACi-induced apoptosis that occurs without functional p53 but dependent on the apoptosis-promoting lysosomal protease cathepsin-D [78]. Unlike in chronic myeloid leukemia cells, the fatty acid-based class I HDACi valproic acid, MS-275, and SAHA suppress autophagy in pediatric acute myeloid leukemia cells [79]. Both studies found that HDACi induced an accumulation of reactive oxygen species and DNA damage. In acute pre-B lymphocytic leukemia cells, autophagy attenuates pro-apoptotic effects of the pan-HDACi panobinostat [80]. The benzamide class I HDACi mocetinostat and tucidinostat induce apoptosis and suppress autophagy in chronic lymphocytic leukemia B-cells [81], [82]. Although HDAC10 regulates autophagy, cytotoxic effects due to HDAC10 inhibition unlikely explain our data. At least in acute myeloid leukemia cells, an induction of autophagy upon a specific inhibition of HDAC10 does not cause apoptosis [83]. It appears that KH16 is superior to HDACi that are inducers of cytoprotective autophagy. These findings suggest further investigation of KH16 as a drug for the treatment of blood cancers and potentially other tumor types.
Conclusions
HDACi of the KH-series kill leukemic cells, outperforming the clinically validated HDACi SAHA in preclinical experiments. The most promising compound, KH16 (yanostat), preferentially inhibits HDAC3, efficiently induces apoptosis, and disables autophagy through caspase activation. This occurs through a previously unrecognized acetylation-regulated, caspase-dependent upstream control of autophagy by apoptosis. KH16 triggers apoptosis and caspase activity that eliminates autophagy proteins.
Availability of data and material
Data generated or analyzed during this study and material are available from the corresponding authors upon reasonable scientific request.
Funding
O.H.K gratefully acknowledges funding that made this project possible. Funded by the Deutsche Forschungsgemeinschaft (DFG, German Research Foundation) – Project-ID 393547839 – SFB 1361; DFG-project KR2291/12–1, project number 445785155; the Walter Schulz Stiftung; and the DAAD (Deutscher Akademischer Austauschdienst/German Academic Exchange Service (DAAD), Egypt-Germany). Additional support to O.H.K. is from Deutsche Forschungsgemeinschaft DFG-projects KR2291/9–1, project number 427404172; KR2291/14–1, project number 469954457; KR2291/15–1, project number 495271833; KR2291/16–1, project number 496927074; KR2291/17–1, DFG-project number 502534123; and the Brigitte und Dr. Konstanze Wegener-Stiftung (projects 65 and 110). W.S. acknowledges funding from the Deutsche Forschungsgemeinschaft DFG-project number 469954457, SI 868/22–1 and the Alexander von Humboldt Foundation Project EGY 1191187 (HIS).
Declaration of Competing Interest
The authors declare that they have no known competing financial interests or personal relationships that could have appeared to influence the work reported in this paper.
Acknowledgement
We thank Prof. Dr. Thorsten Heinzel, Prof. Dr. F.-D. Böhmer, Dr. Kosan, Jena, and Dr. Manuel Grez, Frankfurt/Main for cell lines.
Footnotes
Supplementary data to this article can be found online at https://doi.org/10.1016/j.jare.2023.07.005.
Contributor Information
Marten A. Fischer, Email: mfisch05@students.uni-mainz.de.
Al-Hassan M. Mustafa, Email: alabdeen@uni-mainz.de.
Kristin Hausmann, Email: Kristin.hausmann@pharmazie.uni-halle.de.
Ramy Ashry, Email: relashry@uni-mainz.de.
Anita G. Kansy, Email: akansy@students.uni-mainz.de.
Magdalena C. Liebl, Email: magliebl@uni-mainz.de.
Christina Brachetti, Email: brachett@uni-mainz.de.
Andrea Piée-Staffa, Email: pieean01@uni-mainz.de.
Matthes Zessin, Email: matthes.zessin@googlemail.com.
Hany S. Ibrahim, Email: hany.ibrahim@pharmazie.uni-halle.de.
Thomas G. Hofmann, Email: thomas.hofmann@uni-mainz.de.
Mike Schutkowski, Email: mike.schutkowski@biochemtech.uni-halle.de.
Wolfgang Sippl, Email: wolfgang.sippl@pharmazie.uni-halle.de.
Oliver H. Krämer, Email: okraemer@uni-mainz.de.
Appendix A. Supplementary material
The following are the Supplementary data to this article:
Supplementary figure 1.
References
- 1.Li G., Tian Y., Zhu W.G. The roles of histone deacetylases and their inhibitors in cancer therapy. Front Cell Dev Biol. 2020;8 doi: 10.3389/fcell.2020.576946. [DOI] [PMC free article] [PubMed] [Google Scholar]
- 2.Mustafa A.M., Krämer O.H. pharmacological modulation of the crosstalk between aberrant janus kinase signaling and epigenetic modifiers of the histone deacetylase family to treat cancer. Pharmacol Rev. 2023;75(1):35–61. doi: 10.1124/pharmrev.122.000612. [DOI] [PubMed] [Google Scholar]
- 3.Fiorentino F., et al. Sirtuin modulators: past, present, and future perspectives. Future Med Chem. 2022;14(12):915–939. doi: 10.4155/fmc-2022-0031. [DOI] [PMC free article] [PubMed] [Google Scholar]
- 4.Dasko M., et al. HDAC inhibitors: innovative strategies for their design and applications. Molecules. 2022:27(3). doi: 10.3390/molecules27030715. [DOI] [PMC free article] [PubMed] [Google Scholar]
- 5.San Jose-Eneriz E., et al. HDAC inhibitors in acute myeloid leukemia. Cancers (Basel) 2019;11(11) doi: 10.3390/cancers11111794. [DOI] [PMC free article] [PubMed] [Google Scholar]
- 6.Bradner J.E., et al. Chemical genetic strategy identifies histone deacetylase 1 (HDAC1) and HDAC2 as therapeutic targets in sickle cell disease. Proc Natl Acad Sci U S A. 2010;107(28):12617–12622. doi: 10.1073/pnas.1006774107. [DOI] [PMC free article] [PubMed] [Google Scholar]
- 7.Lechner S., et al. Target deconvolution of HDAC pharmacopoeia reveals MBLAC2 as common off-target. Nat Chem Biol. 2022 doi: 10.1038/s41589-022-01015-5. [DOI] [PMC free article] [PubMed] [Google Scholar]
- 8.Ribrag V., et al. Safety and efficacy of abexinostat, a pan-histone deacetylase inhibitor, in non-Hodgkin lymphoma and chronic lymphocytic leukemia: results of a phase II study. Haematologica. 2017;102(5):903–909. doi: 10.3324/haematol.2016.154377. [DOI] [PMC free article] [PubMed] [Google Scholar]
- 9.Ibrahim H.S., et al. Synthesis, molecular docking and biological characterization of pyrazine linked 2-aminobenzamides as new class I selective histone deacetylase (HDAC) inhibitors with anti-leukemic activity. Int J Mol Sci. 2021;23(1) doi: 10.3390/ijms23010369. [DOI] [PMC free article] [PubMed] [Google Scholar]
- 10.Methot J.L., et al. Delayed and prolonged histone hyperacetylation with a selective HDAC1/HDAC2 inhibitor. ACS Med Chem Lett. 2014;5(4):340–345. doi: 10.1021/ml4004233. [DOI] [PMC free article] [PubMed] [Google Scholar]
- 11.Rahhal R., Seto E. Emerging roles of histone modifications and HDACs in RNA splicing. Nucleic Acids Res. 2019;47(10):4911–4926. doi: 10.1093/nar/gkz292. [DOI] [PMC free article] [PubMed] [Google Scholar]
- 12.Nikolova T., Kiweler N., Krämer O.H. Interstrand crosslink repair as a target for HDAC inhibition. Trends Pharmacol Sci. 2017;38(9):822–836. doi: 10.1016/j.tips.2017.05.009. [DOI] [PubMed] [Google Scholar]
- 13.Roos W.P., Krumm A. The multifaceted influence of histone deacetylases on DNA damage signalling and DNA repair. Nucleic Acids Res. 2016;44(21):10017–10030. doi: 10.1093/nar/gkw922. [DOI] [PMC free article] [PubMed] [Google Scholar]
- 14.Cheung C.H.A., et al. Anti-apoptotic proteins in the autophagic world: an update on functions of XIAP, Survivin, and BRUCE. J Biomed Sci. 2020;27(1):31. doi: 10.1186/s12929-020-0627-5. [DOI] [PMC free article] [PubMed] [Google Scholar]
- 15.Ning S., Wang L. The multifunctional protein p62 and Its mechanistic roles in cancers. Curr Cancer Drug Targets. 2019;19(6):468–478. doi: 10.2174/1568009618666181016164920. [DOI] [PMC free article] [PubMed] [Google Scholar]
- 16.Koeneke E., Witt O., Oehme I. HDAC family members intertwined in the regulation of autophagy: a druggable vulnerability in aggressive tumor entities. Cells. 2015;4(2):135–168. doi: 10.3390/cells4020135. [DOI] [PMC free article] [PubMed] [Google Scholar]
- 17.Mrakovcic M., Frohlich L.F. Molecular determinants of cancer therapy resistance to HDAC inhibitor-induced autophagy. Cancers (Basel) 2019;12(1) doi: 10.3390/cancers12010109. [DOI] [PMC free article] [PubMed] [Google Scholar]
- 18.Peixoto P., et al. Epigenetic control of autophagy in cancer cells: a key process for cancer-related phenotypes. Cells. 2019;8(12) doi: 10.3390/cells8121656. [DOI] [PMC free article] [PubMed] [Google Scholar]
- 19.Chifotides H.T., Bose P., Verstovsek S. Givinostat: an emerging treatment for polycythemia vera. Expert Opin Investig Drugs. 2020;29(6):525–536. doi: 10.1080/13543784.2020.1761323. [DOI] [PMC free article] [PubMed] [Google Scholar]
- 20.Zessin M., et al. One-atom substitution enables direct and continuous monitoring of histone deacylase activity. Biochemistry. 2019;58(48):4777–4789. doi: 10.1021/acs.biochem.9b00786. [DOI] [PubMed] [Google Scholar]
- 21.Heimburg T., et al. Structure-based design and biological characterization of selective histone deacetylase 8 (HDAC8) inhibitors with anti-neuroblastoma activity. J Med Chem. 2017;60(24):10188–10204. doi: 10.1021/acs.jmedchem.7b01447. [DOI] [PubMed] [Google Scholar]
- 22.Kutil Z., et al. Histone deacetylase 11 Is a fatty-acid deacylase. ACS Chem Biol. 2018;13(3):685–693. doi: 10.1021/acschembio.7b00942. [DOI] [PubMed] [Google Scholar]
- 23.Millard C.J., et al. Class I HDACs share a common mechanism of regulation by inositol phosphates. Mol Cell. 2013;51(1):57–67. doi: 10.1016/j.molcel.2013.05.020. [DOI] [PMC free article] [PubMed] [Google Scholar]
- 24.Wagner F.F., et al. Kinetic and structural insights into the binding of histone deacetylase 1 and 2 (HDAC1, 2) inhibitors. Bioorg Med Chem. 2016;24(18):4008–4015. doi: 10.1016/j.bmc.2016.06.040. [DOI] [PubMed] [Google Scholar]
- 25.Watson P.J., et al. Structure of HDAC3 bound to co-repressor and inositol tetraphosphate. Nature. 2012;481(7381):335–340. doi: 10.1038/nature10728. [DOI] [PMC free article] [PubMed] [Google Scholar]
- 26.Schrödinger . Schrödinger LLC; New York, NY, USA: 2019. Schrödinger Release 2019–1: Maestro, Protein Preparation Wizard, Prime, Epik, Ligprep, Confgen, Glide. [Google Scholar]
- 27.Harder E., et al. OPLS3: a force field providing broad coverage of drug-like small molecules and proteins. J Chem Theory Comput. 2016;12(1):281–296. doi: 10.1021/acs.jctc.5b00864. [DOI] [PubMed] [Google Scholar]
- 28.Gohlke H., Hendlich M., Klebe G. Knowledge-based scoring function to predict protein-ligand interactions. J Mol Biol. 2000;295(2):337–356. doi: 10.1006/jmbi.1999.3371. [DOI] [PubMed] [Google Scholar]
- 29.Meng X.Y., et al. Molecular docking: a powerful approach for structure-based drug discovery. Curr Comput Aided Drug Des. 2011;7(2):146–157. doi: 10.2174/157340911795677602. [DOI] [PMC free article] [PubMed] [Google Scholar]
- 30.Chemical Computing Group; Montreal, QC, Canada: 2019. Molecular Operating Environment (MOE), 2019.01. [Google Scholar]
- 31.Ma X.L., Chen C., Yang J. Predictive model of blood-brain barrier penetration of organic compounds. Acta Pharmacol Sin. 2005;26(4):500–512. doi: 10.1111/j.1745-7254.2005.00068.x. [DOI] [PubMed] [Google Scholar]
- 32.Yamashita S., et al. Optimized conditions for prediction of intestinal drug permeability using Caco-2 cells. Eur J Pharm Sci. 2000;10(3):195–204. doi: 10.1016/s0928-0987(00)00076-2. [DOI] [PubMed] [Google Scholar]
- 33.Lipinski C.A., et al. Experimental and computational approaches to estimate solubility and permeability in drug discovery and development settings. Adv Drug Deliv Rev. 2001;46(1–3):3–26. doi: 10.1016/s0169-409x(00)00129-0. [DOI] [PubMed] [Google Scholar]
- 34.Oprea T.I. Property distribution of drug-related chemical databases. J Comput Aided Mol Des. 2000;14(3):251–264. doi: 10.1023/a:1008130001697. [DOI] [PubMed] [Google Scholar]
- 35.Sheridan R.P., Shpungin J. Calculating similarities between biological activities in the MDL Drug Data Report database. J Chem Inf Comput Sci. 2004;44(2):727–740. doi: 10.1021/ci034245h. [DOI] [PubMed] [Google Scholar]
- 36.Mishra A., Singh A. Discovery of histone deacetylase inhibitor using molecular modeling and free energy calculations. ACS Omega. 2022;7(22):18786–18794. doi: 10.1021/acsomega.2c01572. [DOI] [PMC free article] [PubMed] [Google Scholar]
- 37.Banerjee P., et al. ProTox-II: a webserver for the prediction of toxicity of chemicals. Nucleic Acids Res. 2018;46(W1):W257–W263. doi: 10.1093/nar/gky318. [DOI] [PMC free article] [PubMed] [Google Scholar]
- 38.Pons M., et al. Human platelet lysate as validated replacement for animal serum to assess chemosensitivity. ALTEX. 2019;36(2):277–288. doi: 10.14573/altex.1809211. [DOI] [PubMed] [Google Scholar]
- 39.Beyer M., et al. Identification of a highly efficient dual type I/II FMS-like tyrosine kinase inhibitor that disrupts the growth of leukemic cells. Cell. Chem Biol. 2022;29(3):398–411 e4. doi: 10.1016/j.chembiol.2021.10.011. [DOI] [PubMed] [Google Scholar]
- 40.Wachholz V., et al. Inhibitors of class I HDACs and of FLT3 combine synergistically against leukemia cells with mutant FLT3. Arch Toxicol. 2022;96(1):177–193. doi: 10.1007/s00204-021-03174-1. [DOI] [PMC free article] [PubMed] [Google Scholar]
- 41.Marx C., et al. Mechanistic insights into p53-regulated cytotoxicity of combined entinostat and irinotecan against colorectal cancer cells. Mol Oncol. 2021;15(12):3404–3429. doi: 10.1002/1878-0261.13060. [DOI] [PMC free article] [PubMed] [Google Scholar]
- 42.Göder A., Mahendrarajah N., Krämer O.H. Detection of autophagy induction After HDAC inhibitor treatment in leukemic cells. Methods Mol Biol. 2017;1510:3–10. doi: 10.1007/978-1-4939-6527-4_1. [DOI] [PubMed] [Google Scholar]
- 43.Beyer M., et al. How to distinguish between the activity of HDAC1-3 and HDAC6 with western blot. Methods Mol Biol. 2017;1510:355–364. doi: 10.1007/978-1-4939-6527-4_26. [DOI] [PubMed] [Google Scholar]
- 44.Pandey G., Kuykendall A.T., Reuther G.W. JAK2 inhibitor persistence in MPN: uncovering a central role of ERK activation. Blood Cancer J. 2022;12(1):13. doi: 10.1038/s41408-022-00609-5. [DOI] [PMC free article] [PubMed] [Google Scholar]
- 45.Kalkavan H., Green D.R. MOMP, cell suicide as a BCL-2 family business. Cell Death Differ. 2018;25(1):46–55. doi: 10.1038/cdd.2017.179. [DOI] [PMC free article] [PubMed] [Google Scholar]
- 46.Hafezi S., Rahmani M. Targeting BCL-2 in cancer: advances, challenges, and perspectives. Cancers (Basel) 2021;13(6) doi: 10.3390/cancers13061292. [DOI] [PMC free article] [PubMed] [Google Scholar]
- 47.Salmoiraghi S., Rambaldi A., Spinelli O. TP53 in adult acute lymphoblastic leukemia. Leuk Lymphoma. 2018;59(4):778–789. doi: 10.1080/10428194.2017.1344839. [DOI] [PubMed] [Google Scholar]
- 48.George B., et al. TP53 in acute myeloid leukemia: molecular aspects and patterns of mutation. Int J Mol Sci. 2021;22(19) doi: 10.3390/ijms221910782. [DOI] [PMC free article] [PubMed] [Google Scholar]
- 49.Newcomb E.W. P53 gene mutations in lymphoid diseases and their possible relevance to drug resistance. Leuk Lymphoma. 1995;17(3–4):211–221. doi: 10.3109/10428199509056825. [DOI] [PubMed] [Google Scholar]
- 50.Zhao W., et al. JAK2V617F and p53 mutations coexist in erythroleukemia and megakaryoblastic leukemic cell lines. Exp Hematol Oncol. 2012;1(1):15. doi: 10.1186/2162-3619-1-15. [DOI] [PMC free article] [PubMed] [Google Scholar]
- 51.Stetka J., et al. Addiction to DUSP1 protects JAK2V617F-driven polycythemia vera progenitors against inflammatory stress and DNA damage, allowing chronic proliferation. Oncogene. 2019;38(28):5627–5642. doi: 10.1038/s41388-019-0813-7. [DOI] [PMC free article] [PubMed] [Google Scholar]
- 52.Lew T.E., Seymour J.F. Clinical experiences with venetoclax and other pro-apoptotic agents in lymphoid malignancies: lessons from monotherapy and chemotherapy combination. J Hematol Oncol. 2022;15(1):75. doi: 10.1186/s13045-022-01295-3. [DOI] [PMC free article] [PubMed] [Google Scholar]
- 53.Bruno B., et al. European myeloma network perspective on CAR T-Cell therapies for multiple myeloma. Haematologica. 2021;106(8):2054–2065. doi: 10.3324/haematol.2020.276402. [DOI] [PMC free article] [PubMed] [Google Scholar]
- 54.Yoshii S.R., Mizushima N. Monitoring and measuring autophagy. Int J Mol Sci. 2017;18(9) doi: 10.3390/ijms18091865. [DOI] [PMC free article] [PubMed] [Google Scholar]
- 55.Mauthe M., et al. Chloroquine inhibits autophagic flux by decreasing autophagosome-lysosome fusion. Autophagy. 2018;14(8):1435–1455. doi: 10.1080/15548627.2018.1474314. [DOI] [PMC free article] [PubMed] [Google Scholar]
- 56.Spivak J.L. Advances in polycythemia vera and lessons for acute leukemia. Best Pract Res Clin Haematol. 2021;34(4) doi: 10.1016/j.beha.2021.101330. [DOI] [PubMed] [Google Scholar]
- 57.Crodel C.C., et al. Cytoreductive treatment in real life: a chart review analysis on 1440 patients with polycythemia vera. J Cancer Res Clin Oncol. 2022;148(10):2693–2705. doi: 10.1007/s00432-021-03855-5. [DOI] [PMC free article] [PubMed] [Google Scholar]
- 58.Beyer M., et al. HDAC3 activity is essential for human leukemic cell growth and the expression of beta-catenin, MYC, and WT1. Cancers (Basel) 2019;11(10) doi: 10.3390/cancers11101436. [DOI] [PMC free article] [PubMed] [Google Scholar]
- 59.Wells C.E., et al. Inhibition of histone deacetylase 3 causes replication stress in cutaneous T cell lymphoma. PLoS One. 2013;8(7):e68915. doi: 10.1371/journal.pone.0068915. [DOI] [PMC free article] [PubMed] [Google Scholar]
- 60.Mehdipour P., et al. HDAC3 activity is required for initiation of leukemogenesis in acute promyelocytic leukemia. Leukemia. 2017;31(4):995–997. doi: 10.1038/leu.2017.3. [DOI] [PubMed] [Google Scholar]
- 61.Minami J., et al. Histone deacetylase 3 as a novel therapeutic target in multiple myeloma. Leukemia. 2014;28(3):680–689. doi: 10.1038/leu.2013.231. [DOI] [PMC free article] [PubMed] [Google Scholar]
- 62.Long J., et al. Targeting HDAC3, a new partner protein of AKT in the reversal of chemoresistance in acute myeloid leukemia via DNA damage response. Leukemia. 2017;31(12):2761–2770. doi: 10.1038/leu.2017.130. [DOI] [PubMed] [Google Scholar]
- 63.Hess L., et al. A toolbox for class I HDACs reveals isoform specific roles in gene regulation and protein acetylation. PLoS Genet. 2022;18(8):e1010376. doi: 10.1371/journal.pgen.1010376. [DOI] [PMC free article] [PubMed] [Google Scholar]
- 64.Hess L., Moos V., Seiser C. Development of a cellular model mimicking specific HDAC inhibitors. Methods Mol Biol. 2023;2589:51–73. doi: 10.1007/978-1-0716-2788-4_4. [DOI] [PubMed] [Google Scholar]
- 65.Wadman M. FDA no longer has to require animal testing for new drugs. Science. 2023;379(6628):127–128. doi: 10.1126/science.adg6276. [DOI] [PubMed] [Google Scholar]
- 66.Ritter M.J., et al. Nuclear Receptor CoRepressors, NCOR1 and SMRT, are required for maintaining systemic metabolic homeostasis. Mol Metab. 2021;53 doi: 10.1016/j.molmet.2021.101315. [DOI] [PMC free article] [PubMed] [Google Scholar]
- 67.Kiweler N., et al. Histone deacetylase inhibitors dysregulate DNA repair proteins and antagonize metastasis-associated processes. J Cancer Res Clin Oncol. 2020;146(2):343–356. doi: 10.1007/s00432-019-03118-4. [DOI] [PMC free article] [PubMed] [Google Scholar]
- 68.Schneider G., et al. Cross talk between stimulated NF-kappaB and the tumor suppressor p53. Oncogene. 2010;29(19):2795–2806. doi: 10.1038/onc.2010.46. [DOI] [PubMed] [Google Scholar]
- 69.Schäfer C., et al. Class I histone deacetylases regulate p53/NF-kappaB crosstalk in cancer cells. Cell Signal. 2017;29:218–225. doi: 10.1016/j.cellsig.2016.11.002. [DOI] [PubMed] [Google Scholar]
- 70.Sonnemann J., et al. p53-dependent and p53-independent anticancer effects of different histone deacetylase inhibitors. Br J Cancer. 2014;110(3):656–667. doi: 10.1038/bjc.2013.742. [DOI] [PMC free article] [PubMed] [Google Scholar]
- 71.Bastian L., et al. Synergistic activity of bortezomib and HDACi in preclinical models of B-cell precursor acute lymphoblastic leukemia via modulation of p53, PI3K/AKT, and NF-kappaB. Clin Cancer Res. 2013;19(6):1445–1457. doi: 10.1158/1078-0432.CCR-12-1511. [DOI] [PubMed] [Google Scholar]
- 72.Noack K., et al. Analysis of the interplay between all-trans retinoic acid and histone deacetylase inhibitors in leukemic cells. Arch Toxicol. 2017;91(5):2191–2208. doi: 10.1007/s00204-016-1878-5. [DOI] [PMC free article] [PubMed] [Google Scholar]
- 73.Kosan C., et al. STAT5 acetylation: Mechanisms and consequences for immunological control and leukemogenesis. JAKSTAT. 2013;2(4):e26102. doi: 10.4161/jkst.26102. [DOI] [PMC free article] [PubMed] [Google Scholar]
- 74.Singh A., et al. CAP rigidification of MS-275 and chidamide leads to enhanced antiproliferative effects mediated through HDAC1, 2 and tubulin polymerization inhibition. Eur J Med Chem. 2021;215 doi: 10.1016/j.ejmech.2021.113169. [DOI] [PubMed] [Google Scholar]
- 75.Dillon M., et al. Progress on Ras/MAPK signaling research and targeting in blood and solid cancers. Cancers (Basel) 2021;13(20) doi: 10.3390/cancers13205059. [DOI] [PMC free article] [PubMed] [Google Scholar]
- 76.Chaitanya G.V., Steven A.J., Babu P.P. PARP-1 cleavage fragments: signatures of cell-death proteases in neurodegeneration. Cell Commun Signal. 2010;8:31. doi: 10.1186/1478-811X-8-31. [DOI] [PMC free article] [PubMed] [Google Scholar]
- 77.Mashimo M., et al. The 89-kDa PARP1 cleavage fragment serves as a cytoplasmic PAR carrier to induce AIF-mediated apoptosis. J Biol Chem. 2021;296 doi: 10.1074/jbc.RA120.014479. [DOI] [PMC free article] [PubMed] [Google Scholar]
- 78.Carew J.S., et al. Targeting autophagy augments the anticancer activity of the histone deacetylase inhibitor SAHA to overcome Bcr-Abl-mediated drug resistance. Blood. 2007;110(1):313–322. doi: 10.1182/blood-2006-10-050260. [DOI] [PMC free article] [PubMed] [Google Scholar]
- 79.Stankov M.V., et al. Histone deacetylase inhibitors induce apoptosis in myeloid leukemia by suppressing autophagy. Leukemia. 2014;28(3):577–588. doi: 10.1038/leu.2013.264. [DOI] [PMC free article] [PubMed] [Google Scholar]
- 80.Mehrpouri M., et al. Anti-leukemic effects of histone deacetylase (HDAC) inhibition in acute lymphoblastic leukemia (ALL) cells: shedding light on mitigating effects of NF-kappaB and autophagy on panobinostat cytotoxicity. Eur J Pharmacol. 2020;875 doi: 10.1016/j.ejphar.2020.173050. [DOI] [PubMed] [Google Scholar]
- 81.El-Khoury V., et al. Disruption of autophagy by the histone deacetylase inhibitor MGCD0103 and its therapeutic implication in B-cell chronic lymphocytic leukemia. Leukemia. 2014;28(8):1636–1646. doi: 10.1038/leu.2014.19. [DOI] [PMC free article] [PubMed] [Google Scholar]
- 82.Kong Y.L., et al. Chidamide, a histone deacetylase inhibitor, inhibits autophagy and exhibits therapeutic implication in chronic lymphocytic leukemia. Aging (Albany NY) 2020;12(16):16083–16098. doi: 10.18632/aging.103536. [DOI] [PMC free article] [PubMed] [Google Scholar]
- 83.Zeyen P., et al. Identification of histone deacetylase 10 (HDAC10) inhibitors that modulate autophagy in transformed cells. Eur J Med Chem. 2022;234 doi: 10.1016/j.ejmech.2022.114272. [DOI] [PMC free article] [PubMed] [Google Scholar]
Associated Data
This section collects any data citations, data availability statements, or supplementary materials included in this article.
Supplementary Materials
Data Availability Statement
Data generated or analyzed during this study and material are available from the corresponding authors upon reasonable scientific request.