

Abstract
Diabetes mellitus (DM) is a complex metabolic condition that causes organ dysfunction. The current experiment sought to determine the effect of thymoquinone (TQ) on hyperglycemia, hyperlipidemia, oxidative/nitrosative stress, inflammation, and apoptosis in diabetic rats prompted by streptozotocin (STZ) (55 mg/kg body weight i/p). The animals were allocated into control, TQ (50 mg/kg B.W. orally administered for 4 succeeding weeks), Diabetic, and Diabetic + TQ groups. This study confirmed that TQ preserves the levels of insulin, fasting blood glucose, HOMA β-cell indices, HbA1c %, body weight, and lipid profile substantially relative to the DC group. Furthermore, hepatic antioxidant (CAT, GSH, and T-SOD) values were reduced. Conversely, the enzymatic activity of liver functions (AST, ALT, ALP, cytochrome P450, and hepatic glucose-6-phosphatase), lipid peroxidation (MDA), pro-inflammatory cytokines (IL-1β, TNF-α, and IL-6), nitric oxide (NO) and inflammatory marker (CRP) enhanced with STZ administration, which is substantially restored after TQ treatment. Relative to the diabetic rats, TQ reestablished the hepatic architectural changes and collagen fibers. Additionally, TQ downregulated the intensity of the immunohistochemical staining of pro-apoptotic marker (caspase-3), p53, and tumor necrosis factor-alpha (TNF-α) proteins in hepatic tissues. Furthermore, TQ displayed abilities to interact and inhibit the binding site of caspase-3, interleukin-6 receptor, interleukin-1 receptor type 1, TNF receptor superfamily member 1A, and TNF receptor superfamily member 1B in rats following the molecular docking modeling. All these data re-establish the liver functions, antioxidant enzymes, anti-inflammatory markers, and anti-apoptotic proteins impacts of TQ in STZ-induced DM rats. Founded on these outcomes, the experiment proposes that TQ is a novel natural supplement with various clinical applications, including managing DM, which in turn is recommended to play a pivotal role in preventing the progression of diabetes mellitus.
Keywords: Molecular docking, Oxidative stress, Pro-inflammatory cytokines, Streptozotocin, Thymoquinone
Subject terms: Biochemistry, Medical research
Introduction
Natural ingredients have traditionally occupied a role in drug development, and they also served as the foundation for the earliest medications. In folk medicine, they were used to treat a variety of diseases and illnesses. Several plants have been discovered to offer anti-diabetic characteristics1,2. Furthermore, various phytoconstituents with anti-diabetic properties have been identified in plants in recent years. Thymoquinone (TQ; 2-isopropyl-5-methyl-1, 4-benzoquinone) is a bioactive phytochemical ingredient of Nigella sativa seeds' volatile oil. TQ is a commonly safe constituent, particularly when given orally to laboratory animals3. TQ has been shown to have different pharmacological actions, including anti-inflammatory, immunomodulatory, anti-diabetic, antioxidant, anticancer, and anti-aging properties4–15. Previous research has shown that TQ has a substantial antioxidant effect against a variety of free radical-producing chemicals, including diabetes-induced testicular atrophy10 and cardiac11 alterations, cisplatin-induced hepato-toxicity, doxorubicin-induced cardiotoxicity, and cadmium-induced reproductive dysfunctions16,17. Furthermore, TQ was also shown to protect against diabetic nephropathy and membrane-induced lipid peroxidation2,18.
Islets of Langerhans organelles are found in the pancreas and are responsible for synthesizing insulin, glucagon, somatostatin, and pancreatic polypeptide in response to stimulation3. Diabetes mellitus (DM) is a chronic, serious, and complicated metabolic syndrome, and the primary goal of islet research is to develop a cure and improve DM care19. The diabetes population is growing fast at an alarming rate and is expected to reach over 600 million by 20352. Diabetes triggers long-term failure, dysfunction, and damage of several important organs, including the liver1. One of the primary organs impacted by DM is the hepatic tissue function, and resistance to insulin follows in both liver and peripheral tissues, resulting in unrestrained hepatic glucose levels and impaired uptake of peripheral glucose20. DM complications have long been recognized, including oxidative stress caused by persistent and chronic hyperglycemia, which increases free radical production, stress of endoplasmic reticulum, and inflammation, causing cell injury via apoptosis in many tissues, including the hepatic tissue2,8. Additionally, reactive oxygen species (ROS): hydroxyl radicals, nitric oxide (NO), and superoxide radicals are harmful chemicals that contribute to cellular death. ROS causes cellular harm by damaging the cells' biological components, such as peptides, DNA, and lipids, and hence death of the cell16. Diabetic liver damage is thought to be caused primarily by inflammation and disruptions in systemic and hepatic fat metabolism. Furthermore, systemic hyperglycemia changes carbohydrate metabolism in the liver, exacerbating the disruption in peripheral glucose uptake21. Hyperglycemia and reduced glucose tolerance are linked to a variety of hepatic, metabolic, vascular, nephropathic, and neuropathic dysfunctions. The major indicators for detecting DM metabolic problems are hyperglycemia and lipid profile anomalies22. Hypertriglyceridemia, low levels of high-density lipoprotein-cholesterol (HDL-C), and high values of low-density lipoprotein-cholesterol (LDL-C) are all related to DM and contribute considerably to the development of atherosclerosis1. When investigating the efficacy of anti-diabetic medications, antioxidant properties, efficacy in treating dyslipidemia and hyperglycemia, and safety are fundamental16. To limit the risks of diabetic complications, effective diabetes care necessitates continuous control of blood sugar levels. Thus, therapeutic and natural antioxidants are one of the diabetic treatment techniques3,23. For the best of our research, only a few experiments were undertaken to investigate the impact of TQ on DM-induced liver damage. So, the current work aimed to evaluate the impact of TQ on glycemic control, oxidative stress, hepatic functions biomarkers, lipid profile, molecular docking, histological and immunohistochemical staining of caspase-3, p53, and tumor necrosis factor-alpha (TNF-α) proteins in hepatic tissues of streptozotocin (STZ)-triggered diabetic rats.
Materials and methods
Ethics statement
All experimental protocols were approved by Animal Research. Animal Care Review Committee of the Faculty of Veterinary Medicine, Alexandria University, Alexandria, Egypt, accepted the current study following the rules for the maintenance and use of laboratory animals (Committee permit number: 2022/013/167). All methods were carried out following animal research guidelines and regulations. All experiments were conducted in accordance with the ARRIVE guidelines24.
Chemicals and reagents
STZ (Product#: 572,201) and TQ (Product#: 274,666; ≥ 98%) were bought from Sigma–Aldrich (St. Louis, MO, USA). Hemoglucotest® glucose strips were acquired from Roche Diagnostics (Montreal, Canada). Hemoglobin A1c (HbA1c) %, glucose, malondialdehyde (MDA) analyze kit, reduced glutathione (GSH), total serum nitrate/nitrite kit, CAT kits, total superoxide dismutase (T-SOD), and serum aspartate aminotransferase (AST), alanine aminotransferase (ALT), and alkaline phosphatase (ALP) concentration kits were obtained from Biodiagnostic (Cat. Tahrir, Cairo, Egypt). Rat's insulin enzyme-linked immunosorbent assay (ELISA) analysis kit (Cat#; 80-INSRTH-E01, E10 American Laboratory Products Co., USA). Proinflammatory cytokines (IL-6, IL-1β, and TNF-α) ELISA kits (Anogen, Mississauga, Ontario, Canada). Triacylglycerol (TAG), total cholesterol (TC), and LDL-C and HDL-C triggering chemical kits were obtained from United Diagnostics (Cairo, Egypt). Entire chemicals consumed were of analytical grade and were utilized as obtained without any additional purification.
Animals
In this experiment, 32 Sprague–Dawley male rats, 180–200 g of average weight, were employed. Rats were housed in plastic cages (each group was housed in a cage of 50 × 50 cm and a height of 30 cm with a wood shaving bedding, applied to a depth of 2 cm in each cage) and fed a regular laboratory ration containing 0.5% NaCl, 22% protein, and 4–6% dietary fat (Damanhour Feed Co, Behera, Egypt) with free access to water. Throughout the study, rats were housed at a normal room temperature of 22–25°C, with humidity and a light cycle. Animals were obtained from Alexandria University's Medical Research Institute and adapted to laboratory settings for 2 weeks.
Induction of diabetes
The rats were distributed into 4 equal groups (n = 8 for every group). In groups 3 and 4, DM was produced with a single intraperitoneal infusion of STZ (55 mg/kg body weight) freshly liquefied in 5 mM citrate buffer, pH 4.520. Control rats (groups 1 and 2) were infused with an identical amount (1 mL) of buffer solution only. To dismiss the STZ-triggered hypoglycemia, animals were permitted to receive an overnight 5% sugar solution. Following three days, fasting blood glucose levels were immediately determined using Hemoglucotest® glucose strips (Roche Diagnostics, Montreal, Canada). Three days after STZ administration, animals with more than 200 mg/dL of blood glucose were rendered diabetic25. Treatment was introduced on the 3rd day after STZ injection, which was considered experiment 1st day. Consequently, all animals were sustained for 4 weeks (the entire experimental period) on ad libitum water and food with inspection of average body weight, food, and water ingestion, and fasting blood glucose levels prior to the start of TQ administration8.
Experimental design
Rats were allocated to 4 groups at random, each with eight rats:
-
i.
Rats in group 1 (control group) were administrated with 1 mL of distilled water / 100 g of BW/day through gastric gavage.
-
ii.
Rats in group 2 (TQ group) were administered with TQ, firstly dissolved by the addition of dimethyl sulfoxide, then by adding normal saline (for a final dimethyl sulfoxide value of less than 0.5%). Subsequent TQ solution was given at 50 mg/kg of BW one time per day by oral gavage for up to four weeks8. The dosage was accustomed weekly following any alteration in body weight to sustain a parallel dose per kg BW of rats over the whole experimental period for every group.
-
iii.
Rats in group 3 (Diabetic) were rendered diabetic as previously described and were administered 1 mL of distilled water / 100 g of BW/day by gastric gavage.
-
iv.
Rats in group 4 (Diabetic + TQ) were rendered diabetic and administrated with TQ as defined with group 2.
Body weight measurements
The body weights of all animals were measured at the start of each week, and findings were analyzed accordingly.
Oral glucose tolerance test (OGTT)
After ending the experiment, animals were deprived overnight and then given glucose solution (2 g of glucose/ 5ml distilled water/kg Bwt of rats) intragastrically. Samples of the blood were drawn from the tail vein at 0, 30, 60, 90, and 120 min. Glucose levels were evaluated immediately in the blood samples by Hemoglucotest® glucose strips20,24,26.
Blood and tissue assembly and preparation
Twenty-four hours following the last treatment administration, with ketamine/xylazine anesthesia (7.5 and 1.0 mg/kg via intra-peritoneal infusion)23, 2 samples of the blood were collected from the heart on sodium fluoride at room temperature. One sample was utilized to calculate HbA1c%, and the other was centrifuged at 1,800 × g for 15 min to separate plasma for insulin, glucose, liver function tests, lipid profile, and inflammatory marker analysis.
Following blood collection, and while the animals were still anesthetized, euthanasia was performed via decapitation, and dissected, each liver excised and thoroughly estimated. A part of the hepatic tissue of every rat was washed with deionized water and physiological saline solution (NaCl 0.9%) to remove RBCs and platelets; tissues were blotted with blotting paper and perfused with 50 mM sodium phosphate saline buffer (100 mM Na2HPO4/NaH2PO4, pH 7.4) in an ice-cold medium with 0.1 mM EDTA. Then, tissues were shredded in 10 mL of ice-cold buffer/g tissue and centrifuged for 30 min at 10,000 × g. The supernatant was transferred to Eppendorf tubes and stored at -80°C until oxidative/nitrosative and anti-oxidative enzyme activities were determined. Another section of liver tissue was removed and promptly preserved in 10% buffered formaldehyde for histological and immunohistochemical analysis.
Blood biochemical measurements
Plasma glucose concentrations27 (Cat#: BD-30234) and HbA1c %28 (Cat#: BD-10453) were spectrophotometrically evaluated through provided analysis kits (Bio-diagnostic Co., Cairo, Egypt). A High Range Rat’s Insulin ELISA kit (Cat#: 102-INSRTH-E01, E10 American Laboratory Products Co., USA) was consumed to analyze the plasma insulin values.
Homeostasis model assessment of β-cell function (HOMA-β-cell) index
For HOMA β-cell index determination, plasma insulin, and fasting glucose levels were utilized according to Matthews's formula29:
Insulin sensitivity indices: fasting glucose/insulin ratio and insulin-1 were calculated from plasma insulin and fasting glucose concentrations30.
Liver function tests and lipid profile measurements
ALT (Cat#: DD0440), AST (Cat#: DD0453), and ALP (Cat#: DD0363) content were estimated using commercially available kits (Diamond Diagnostics Co., Cairo, Egypt) as per the manufacturer's directions. The activity of plasma's cytochrome p450 (CYP450) (Cat#: BD34701) was determined through ELISA kits. Markers of lipid profile, including TAG, TC, HDL-C, and LDL-C, were analyzed by kits (Bio-Diagnostics Co., Cairo, Egypt), and the data were interpreted consequently. The atherogenic index in plasma (AIP) was determined through the formula = log (TAG/HDL-C)22.
Analysis of proinflammatory cytokines and inflammatory marker
Interleukin-6 (IL-6), TNF-α, and interleukin-1β (IL-1β), as proinflammatory cytokines and inflammatory marker C reactive protein (CRP) were estimated in the plasma following manufacturer's procedures of obtained ELISA kits (Cat#: 102-ALPD-A201, E510 and A218 respectively, Millipore, CA, USA). To confirm all readings, an ELISA Plate Reader (Bio-Rad, Hercules, CA, USA) was consumed.
Hepatic lipid peroxidation, antioxidants, and G6Pase
Homogenates of hepatic tissues were utilized to calculate malondialdehyde (MDA) (Cat#: BD0523) levels31. NO was measured indirectly by determining nitrite synthesis in hepatic extract using the Griess diazotization reaction32, reduced glutathione (GSH) (Cat#: BD0385)33, T-SOD (Cat#: BD0342) and catalase (CAT) (Cat#: BD0422) enzyme activities34 were determined using provided diagnostic examine kits (Bio-diagnostic Co., Cairo, Egypt). The activity of glucose-6-phosphatase (G6Pase) in the liver was colorimetrically valued following Barman35. The content of protein in hepatic tissues was measured36.
Histopathological examination and semi‑quantitative lesion scoring
Hepatic tissue samples were obtained from 8 rats per group and promptly maintained in buffered formalin 10% for a minimum of 24 h. Hepatic samples were washed, dehydrated with serial alcohol dilutions, cleaned in xylene, and inserted in paraffin at 60°C. To assess the extent of collagen, paraffin slices of five microns thickness were produced and stained with hematoxylin and eosin (H and E) and Masson's trichrome stain, then inspected beneath a light microscope. The extent of hepatic tissue damage was evaluated using a semiquantitative scoring assay, in which five random fields were examined from each section. The severity of lesions was scored and graded according to the percentage of affected tissue, as follows: none (-) = 0%, representing no involvement of the examined field; mild ( +) = 5–25% of the examined field; moderate (+ +) = 25–50% of the examined field; and severe (+ + +) ≥ 50–100% of the examined field37.
Immunohistochemical evaluation
Following the manufacturer's directions, a standard horseradish peroxidase-immunohistochemical approach employing rabbit anti-rat p53, caspase-3, and TNF-α was smeared to positively charged slides of paraffin Sects38. Five-micron slices of hepatic tissue were dewaxed, rehydrated, and incubated with 3% hydrogen peroxide to inhibit endogenous peroxidase activity. The slides were antigen-retrieved by putting them in a microwave oven for 10 min in a 10 mM sodium citrate buffer (pH 6.0). Then, endogenous peroxidase activity was blocked with 3% H2O2 for 10 min. Nonspecific proteins were inhibited by 2% bovine serum albumin. The slices were rinsed three times in Dako Tris-buffered saline before being incubated overnight at 4°C with a primary rabbit polyclonal anti-p53 antibody (1:100) (PA5-32,045; Thermo-Fisher Scientific, WA, USA), rabbit polyclonal anti-caspase-3 antibody (1:100) (Code# ab4051; Abcam, Cambridge, UK) and rabbit polyclonal anti- TNF-α antibody (1:100) (PA5-41,057; Thermo-Fisher Scientific, WA, USA). The tissue slices were rinsed in Tris-buffered saline and then incubated with the streptavidin–horseradish peroxidase reagent and a biotinylated secondary antibody for 30 min at 37°C. Slides were then treated with a 3, 3' diaminobenzidine substrate chromogen solution, counterstained with Mayer's hematoxylin, and photographed. Images of 10 different fields, at a magnification of × 400, were analyzed using ImageJ software to estimate the area (%) of caspase3, P-53 and TNF-α positive brown immunostained cells37.
Molecular docking
Ligand preparation
The three-dimensional (3D) structure of TQ was retrieved from the PubChem (https://pubchem.ncbi.nlm.nih.gov/) database in SDF format and opened in MOE 2015.1039 software for energy minimization and docking with target proteins.
Protein preparation
Caspases-3, interleukin-1 receptor type 1 (IL1R1), TNF receptor superfamily member 1A (TNFRSF1A), and TNF receptor superfamily member 1B (TNFRSF1B) 3D structures from rats were acquired from UniProt database (https://www.uniprot.org/). While the 3D structure of the interleukin-6 receptor (IL-6R) was produced by the Robetta server40. Target proteins were prepared for docking using MOE software along with target protein energy minimization.
Molecular docking analysis and visualization
Target proteins were docked with TQ using MOE software and the protein–ligand interactions were visualized by the same software.
Statistical analysis
GraphPad Prism v.9 (https://www.graphpad.com/) (GraphPad, San Diego, CA, USA) analyzed the data by a one-way ANOVA with Tukey's post hoc multiple range testing. Two-way ANOVA analyzed body weight and OGTT data with Tukey's post hoc multiple range testing. P < 0.05 was required for all significance declarations.
Results
Body weights
Weights of the body of the STZ-induced diabetic animals decreased markedly (P < 0.001) than those of the control non-diabetic group in the 3rd and 4th weeks of the study. However, TQ-treated diabetic rats improved the weights of the body (P < 0.001) relative to the diabetic non-treated animals in the 3rd and 4th weeks of the study. A non-significant variation was documented between the weights of control non-diabetic and TQ-treated rats (Fig. 1).
Figure 1.

Assessment of body weight. Data were analyzed with a two-way ANOVA followed by Tukey’s multiple comparison test. Data are expressed as the mean ± SD. n = 8. ns = nonsignificant, ***P ˂ 0.001, and ****P ˂ 0.0001.
Oral glucose tolerance test
Differences in blood glucose levels of all groups throughout various time courses (0–120 min) are displayed in Fig. 2. The maximum value of glucose was identified after 30 min of receiving glucose (2 g/kg B.W.) and then reduced to main levels within 2 h in all experimental animals except STZ-diabetic control, which displayed an extreme glucose intolerance (P < 0.001) throughout the entire time course (0–120 min). Nonetheless, diabetic animals treated with TQ had substantially (P < 0.001) lower glucose levels than the normal control group. During the various time courses of the oral glucose tolerance test, there was no significant variation in blood glucose concentrations of the control non-diabetic and TQ-treated rats.
Figure 2.

Assessment of glucose tolerance test. Data were analyzed with a two-way ANOVA followed by Tukey’s multiple comparison test. Data are expressed as the mean ± SD. n = 8. ****P ˂ 0.0001.
Blood glycemic parameters and β-cell function indices
As revealed in Fig. 3, compared to non-diabetic control animals, there were statistically marked (P < 0.001) increases in fasting plasma glucose (Fig. 3A), glucose/insulin ratio (Fig. 3C), HbA1c% (Fig. 3F) and insulin−1 (Fig. 3D) in the diabetic group. Acquired data also displayed that there was a substantial reduction in HOMAβ-cell index (Fig. 3E) and fasting insulin (Fig. 3B) value in STZ-diabetic rats as relative to non-diabetic control animals. Those parameters improved significantly in diabetic TQ-treated rats relative to diabetic control rats, with fasting plasma glucose, insulin−1, HbA1c%, and glucose/insulin ratio significantly (P < 0.001) lowered in diabetic animals treated with TQ relative to the diabetic group. While the HOMA-cell index and fasting insulin were markedly (P < 0.001) higher in the Diabetic + TQ treated animals relative to the Diabetic group.
Figure 3.

Assessment of blood glycemic parameters and β-cell function indices. (A) Glucose. (B) Insulin. (C) Glucose/insulin ratio. (D) Insulin−1. (E) HOMA-β. (F) hemoglobin A1c (HbA1c) %. Data were analyzed with a one-way ANOVA followed by Tukey’s multiple comparison test. Data are expressed as the mean ± SD. n = 8. ns = nonsignificant and ****P ˂ 0.0001.
Hepatic function tests and lipid profile
Our findings revealed that STZ-induced diabetes induced a marked (P < 0.001) enhancement in plasma ALT (Fig. 4A), AST (Fig. 4B), and ALP (Fig. 4C) values, which indicates a hepatic tissue injury and destruction of the hepatocyte cell membrane. Moreover, it also enhanced plasma CYP450 (Fig. 4D). TQ therapy of diabetic rats reduced these effects substantially (P < 0.001) reducing hepatic function tests and CYP450 activity relative to diabetic control rats. The hepatic function tests and CYP450 activity were not markedly variant between the TQ-treated group and the control non-diabetic one.
Figure 4.

Assessment of blood hepatic function and hepatic glucose-6-phosphatase (G6Pase) activity. (A) Alanine aminotransferase (ALT). (B) Aspartate aminotransferase (AST). (C) Alkaline phosphatase (ALP). (D) Cytochrome p450 (CYP450). Data were analyzed with a one-way ANOVA followed by Tukey’s multiple comparison test. Data are expressed as the mean ± SD. n = 8. ns = nonsignificant, *P ˂ 0.05, and ****P ˂ 0.0001.
Figure 5 displays the lipid profile and atherogenic index in normal and experimental rats in each group. STZ-induced diabetes triggered a marked (P < 0.001) enhancement in plasma TC (Fig. 5A), TAG (Fig. 5B), LDL-C (Fig. 5D), and atherogenic index (Fig. 5E) values with a marked reduction in HDL-C (Fig. 5C). Treating diabetic animals with TQ led to a marked (P < 0.001) down-regulation in plasma TC, LDL-C, TAG, and atherogenic index values relative to the diabetic group. TQ enhanced the marked reduction in HDL-C of diabetic animals. A non-significant difference was recorded between the control non-diabetic and TQ-treated rats considering the lipid profile and atherogenic index except for the HDL-C which was reduced (P < 0.05) in the TQ group chart compared to the control one.
Figure 5.

Assessment of lipid profile and atherogenic index (AIP). (A) Total cholesterol (TC). (B) Triacylglycerol (TAG). (C) High-density lipoprotein-cholesterol (HDL-C). (D) Low-density lipoprotein-cholesterol (LDL-C). (E) Atherogenic index (AIP). Data were analyzed with a one-way ANOVA followed by Tukey’s multiple comparison test. Data are expressed as the mean ± SD. n = 8. ns = nonsignificant, *P ˂ 0.05, and ****P ˂ 0.0001.
Pro-inflammatory cytokines and inflammatory marker
STZ-induced diabetic control rats displayed a marked (P < 0.001) enhancement in plasma concentrations of TNF-α (Fig. 6A), IL-1β (Fig. 6B), IL-6 (Fig. 6C), and CRP (Fig. 6D) relative to the normal control group, which indicate the higher grade of the inflammatory cascade in the liver through diabetes. Nevertheless, TQ administration reduced markedly (P < 0.001) degree of enhanced proinflammatory, and inflammatory markers relative to diabetic control rats. A non-significant variation was documented in proinflammatory, and inflammatory biomarkers between the control non-diabetic and TQ-treated rats.
Figure 6.
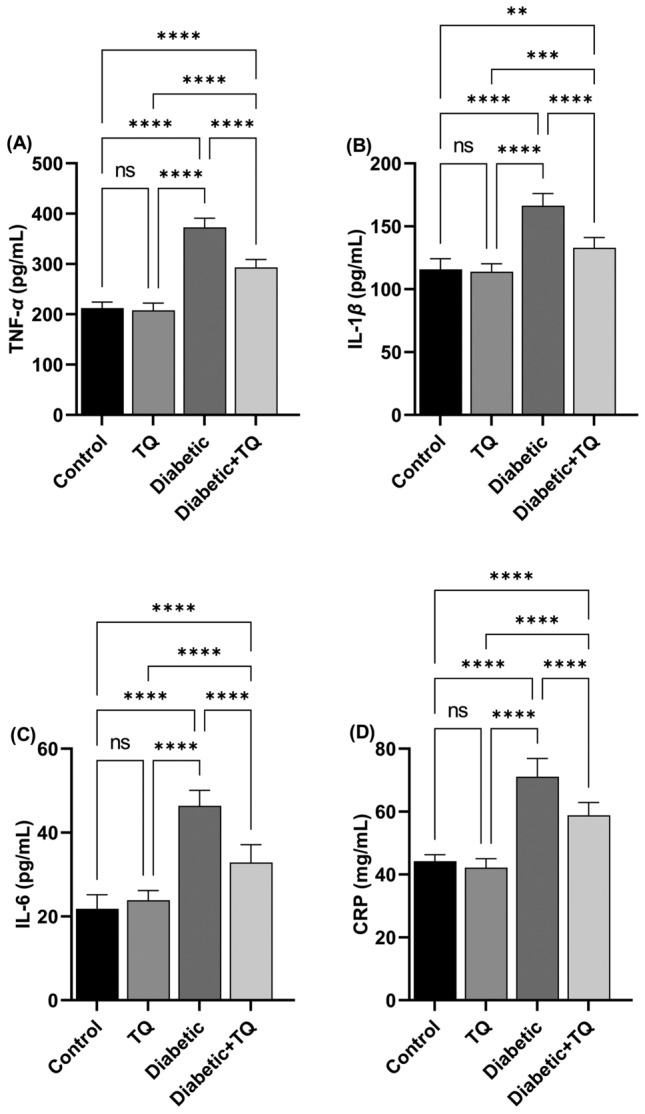
Assessment of plasma proinflammatory cytokines and inflammatory markers. (A) Tumor necrosis factor-alpha (TNF-α). (B) Interleukin-1β (IL-1β). (C) Interleukin-6 (IL-6). (D) C reactive protein (CRP). Data were analyzed with a one-way ANOVA followed by Tukey’s multiple comparison test. Data are expressed as the mean ± SD. n = 8. ns = nonsignificant, **P ˂ 0.01, ***P ˂ 0.001, and ****P ˂ 0.0001.
Oxidant-antioxidant status and G6Pase
The diabetic group showed a substantial (P < 0.001) enhancement in hepatic MDA (lipid peroxidation marker) (Fig. 7A), nitrite (Fig. 7B) values, and the activity of hepatic G6Pase (Fig. 7F); which is linked with a marked reduction in GSH (Fig. 7C) value and T-SOD (Fig. 7D) and CAT (Fig. 7E) activities relative to the normal control group. On the contrary, TQ treatment of diabetic rats markedly (P < 0.001) reduced the degree of increased LPO, nitrosative markers, and G6Pase hepatic activity relative to the diabetic control animals. Additionally, relative to diabetic rats, the antioxidant markers were mostly recovered in the Diabetic + TQ animals. TQ alone administrated rats revealed a marked (P < 0.01) reduction in intensity of MDA and nitrite concentrations relative to non-diabetic control animals. Furthermore, the antioxidant enzymatic activities in the TQ-treated rats were considerably (P < 0.01) enhanced than in normal control animals. Regarding the hepatic G6Pase activity, there was a non-marked variation between the TQ-treated group and the control non-diabetic one.
Figure 7.

Assessment of hepatic lipid peroxidation, antioxidants, and G6Pase. (A) Malondialdehyde (MDA). (B) Nitric oxide (NO). (C) Reduced glutathione (GSH). (D) Total superoxide dismutase (T-SOD). (E) Catalase (CAT). (F) Glucose-6-phosphatase (G6Pase). Data were analyzed with a one-way ANOVA followed by Tukey’s multiple comparison test. Data are expressed as the mean ± SD. ns = nonsignificant, *P ˂ 0.05, **P ˂ 0.01, ***P ˂ 0.001, and ****P ˂ 0.0001.
Histopathological findings
No histological variations were observed between non-diabetic control and TQ-administrated rats in the liver. So, they were deliberated as control. Control and TQ-treated rats' hepatic tissue displayed a normal histological structure, with undamaged hepatic architecture in hepatic lobules, portal areas, and hepatic vasculature (Fig. 8A). meanwhile, hepatocytes of the diabetic group exhibited diffuse congestion of hepatic vasculature (hepatic sinusoids and central vein) (Table 1 and Fig. 8B), diffuse hepatic hydropic degeneration where the cells were swollen, and the cytoplasm being replaced by clear fluids (Table 1 and Fig. 8C) alongside hepatocellular necrosis with mononuclear cell infiltration (Table 1 and Fig. 8D) and intense mononuclear cell infiltrations in the portal area (Table 1 and Fig. 8E). Simultaneously, hepatic tissue sections of the Diabetic + TQ group displayed nearly normal histoarchitecture (Table 1 and Fig. 8F).
Figure 8.

Photomicrograph of a rat liver section stained by H and E × 400. (a) Control rats showing normal histology with normal central vein (CV) and hepatocytes (b, c, d, e) diabetic rats showing congestion of hepatic sinusoid (long black arrows) and central vein (short black arrows), diffuse hydropic degeneration of hepatocytes (arrowheads) beside hepatocellular necrosis with mononuclear cell infiltrations (black star) and intense mononuclear cell infiltrations in portal area (white star) (f) TQ + diabetic treated rats showing normal hepatic histoarchitecture with normal central vein (CV). (Scale bar = 50 μm).
Table 1.
Incidence and severity of hepatic histopathological lesions in the experimental groups.
| Group ⁄ lesion | Incidence and severity of histopathological lesions | |||||||||||||||
|---|---|---|---|---|---|---|---|---|---|---|---|---|---|---|---|---|
| control | TQ | Diabetic | Diabetic + TQ | |||||||||||||
| − | + | + + | + + + | − | + | + + | + + + | − | + | + + | + + + | − | + | + + | + + + | |
| Congestion of hepatic vasculature | 6 | 2 | 0 | 0 | 7 | 1 | 0 | 0 | 0 | 1 | 2 | 5 | 5 | 3 | 0 | 0 |
| Hepatic hydropic degeneration | 7 | 1 | 0 | 0 | 7 | 1 | 0 | 0 | 0 | 1 | 3 | 4 | 6 | 2 | 0 | 0 |
| hepatocellular necrosis | 8 | 0 | 0 | 0 | 8 | 0 | 0 | 0 | 0 | 2 | 3 | 3 | 7 | 1 | 0 | 0 |
| Mononuclear cell infiltrations in the portal area | 8 | 0 | 0 | 0 | 8 | 0 | 0 | 0 | 1 | 1 | 3 | 3 | 7 | 1 | 0 | 0 |
Number of animals with lesions per total examined (8 rats per group). TQ Thymoquinone.
Severity of lesions was graded by estimating the percentage area affected in the entire section. Lesion scoring: (−) absence of the lesion = 0%, ( +) mild = 5–25%, (+ +) moderate = 26–50% and (+ + +) severe ≥ 50% of the examined tissue sections.
The obvious lesions of Masson’s trichrome in control and TQ-treated rats were fine light green collagen fibers (Fig. 9A and B). Diabetic rats displayed moderate and extensive thick collagen fibers around the central vein, in the portal area, and hepatic parenchyma (Fig. 9C, D, and E), while the Diabetic + TQ rats showed fine collagen fibers (Fig. 9F).
Figure 9.

Photomicrograph of a rat liver section stained by Masson’s trichrome stain × 400. (a) Control rat (b) TQ treated rats (c, d, e) diabetic rats (f) TQ + diabetic treated rats showing fine light green collagen fibers (arrow), moderate and extensive thick collagen fibers (arrowheads). (Scale bar = 50 μm).
Immunohistochemistry
Nuclear and cytoplasmic immunostaining of hepatocytes of the non-diabetic control and TQ-administrated groups displayed a negative staining for the expression of caspase-3 protein (Fig. 10A and B). Conversely, diabetic animals exhibited moderate to strong positive brown immune reactions for caspase-3 protein (Fig. 10C). At the same time, Diabetic + TQ rats were weak immune brown staining for caspase-3 protein (Fig. 10D).
Figure 10.

Photomicrographs of immunohistochemical staining × 400. Photomicrographs of immunohistochemical staining of caspase-3, p53, and tumor necrosis factor-alpha (TNF-α) proteins expression that show Negative immune-stained (black arrows), strong positive immune-stained (yellow arrows), moderate positive immune-stained (red arrows), weak positive immune-stained (blue arrows) cytoplasmic and nuclear hepatocytes (Scale bar = 50 μm). With Quantification of caspase-3, p53, and TNF-α expressios,, the immunohistochemical staining of caspase-3, p53, and TNF-α was measured as area percent (%) across 10 different fields/section, n = 8 rat/group. Data were analyzed with a one-way ANOVA followed by Tukey’s multiple comparison test. Data are expressed as the mean ± SD. ns = nonsignificant, *P ˂ 0.05, **P ˂ 0.01, ***P ˂ 0.001, and ****P ˂ 0.0001.
The immunohistochemical estimation of p53 protein of the hepatocytes of the control and TQ-treated animals displayed negative brown staining (Fig. 10E and F). On the contrary, diabetic rats exhibited strong to moderate nuclear-positive brown immunoreactivity of p53 protein expression (Fig. 10G). Nonetheless, there was weak nuclear immune brown staining in Diabetic + TQ rats (Fig. 10H).
The hepatic tissue immunostaining of the inflammatory TNF-α protein in control and TQ-administrated animals displayed a negative brown staining (Fig. 10I and J). In contrast, the diabetic group revealed moderate to strong positive brown reactions for TNF-α protein (Fig. 10K). In the Diabetic + TQ rats, there was less dense and weak brown staining (Fig. 10L).
The non-diabetic control and TQ-administrated groups displayed no significant alterations in the immune-stained area % of caspase-3 (Fig. 10M), p53 (Fig. 10N) and TNF- α (Fig. 10O). Compared with the normal control values, the diabetic group displayed a substantial (P < 0.001) enhancement in the immune-stained area % of caspase-3 (Fig. 10M), p53 (Fig. 10N) and TNF-α (Fig. 10O). The Diabetic + TQ-treated rats’ hepatic tissues displayed a marked reduction in immune-stained area % of caspase-3, p53 and TNF- α relative to the diabetic animals (Figs. 10M, N and O).
Molecular docking assessment
Molecular docking interactions and scores of TQ against caspase-3, IL-6R, IL1R1, TNFRSF1A, and TNFRSF1B binding sites are illustrated in Fig. 11. TQ interacted with the binding site of caspase-3 with a binding energy of -4.94 kcal/mol by H-acceptor with ARG207 and H-pi with TRP206 residues (Fig. 11A). Figure 11B explores the interaction of TQ with the IL-6R binding site by -4.68 kcal/mol, binding energy. Furthermore, TQ interacted with GLY423 (pi-H) residue in the IL1R1 binding site by binding energy of -4.90 kcal/mol (Fig. 11C). By three H-acceptor bonds (GLN111, HIS140, and PHE141), TQ interacted with TNFRSF1A’s binding site by binding energy of -4.55 kcal/mol (Fig. 11D). Although TQ interacted with TNFRSF1B’s binding site by binding energy of -4.36 kcal/mol with GLY169 (H-acceptor) residue.
Figure 11.


Molecular docking interaction of thymoquinone (TQ) and rats’ target proteins. (A) Caspase-3. (B) Interleukin-6 receptor (IL-6R). (C) Interleukin-1 receptor type 1 (IL1R1). (D) Tumor necrosis factor receptor superfamily member 1A (TNFRSF1A). (E) Tumor necrosis factor receptor superfamily member 1B (TNFRSF1B).
Discussion
In many metabolic dysfunctions, antioxidant use is seen as an approach to reestablishing normal physiological balance19. DM is a systemic, metabolic, and endocrine illness defined mostly by hyperglycemia. It is also linked to glucose, lipid, and protein metabolism changes. This is because antioxidant processes within the body are being reduced and impaired22,25. Thymoquinone (TQ), the primary ingredient of N. sativa, is thought to be a hypoglycemic and anti-oxidative substance that might offset the side effects and enhanced cost of pharmaceutical medications3,41. The liver is the tissue utmost vulnerable to the effects of hyperglycemia-induced oxidative stress. Different processes, such as inflammation and oxidative stress, promote hepatocyte damage20. STZ is a diabetogenic and hepatotoxic substance that destroys the cell membrane of pancreatic beta-cells, breaks DNA, and interacts with many enzymes, counting glucokinase, causing insulin levels to drop dramatically23. It is critical to investigate the impact of anti-diabetic drugs in STZ-triggered hyperglycemia in research models. TQ was administered to animals in this experiment to evaluate their anti-diabetic and hepato-protective capabilities.
The current study displayed that STZ considerably reduced body weights in the third and fourth weeks of the experiment. The results are congruent with those of Almatroodi et al42. and Abdelrazek et al22. This might be due to decreased glucose and amino acid availability to cells of the body, which results in a deficiency of substrates required for the biosynthesis of the cells and can disrupt connected cellular metabolism, resulting in muscular wastage2. TQ treatment for diabetic rats caused a marked enhancement in the weight of the body relative to the diabetic animals. Present findings follow those of Abdelrazek et al22. and Abdel-Moneim et al43. This could support TQ's anabolic/antidiabetic action on diabetes-induced muscle atrophy due to glucose inaccessibility16,42.
Diabetic rats had lower blood insulin and HOMA β-cell function indicators than control rats. In contrast, the diabetes group had higher plasma glucose levels, HbA1c%, and glucose/insulin ratio than the control group. These data are consistent with those of Hafez et al20 and Faisal Lutfi et al8. HbA1c% is a widely used biomarker for assessing the severity of diabetes and its consequences23. This impact is caused by STZ's alkylating toxic activity on pancreatic islet β-cells, which limits insulin secretion, resulting in hyperglycemia19. TQ caused a significant drop and increase in plasma glucose and insulin levels compared to diabetic control rats. These findings agreed with those of Hofni et al2. and Abdelrazek et al22. TQ's plasma glucose lowering impact may demonstrate its insulinotropic activity, where it might cause partial regeneration of pancreatic islet β-cells, resulting in increased insulin synthesis and peripheral use16. TQ, in addition to its capacity to reduce intestinal glucose absorption, has an inhibiting impact on the expression of gluconeogenic enzymes and glucose synthesis in the liver16,22. Furthermore, it has the ability to stimulate adenosine monophosphate-activated protein kinase in the liver and muscles, blocking gluconeogenesis42.
TQ lowered blood glucose during the OGTT, which might be attributed to TQ's capacity to stimulate pancreatic β-cells insulin production16. Another factor is quinine's hypoglycemic feature, part of the TQ molecule's structure41. The mechanisms of action might be via inhibiting gluconeogenesis in hepatic tissue or glucose uptake into adipose tissues and muscles or by increasing glucose consumption in tissues42. As a result, unlike insulin and other synthetic medicines, TQ may be presumed to have anti-hyperglycemic properties22,43 without causing any undesirable hypoglycemia.
STZ promotes experimental hyperglycemia in rats, increasing ALT, AST, ALP, CYP450, and hepatic G6Pase activity, which is a strong sign of liver injury. AST and ALT are closely related to converting amino acids to keto acids and are known to rise with DM43. CYP450 isoforms are a class of enzymes that can catalyze various enzymatic processes, including xenobiotic metabolism17,44. G6Pase is a critical and rate-limiting enzyme in gluconeogenesis, as demonstrated by an experiment in which G6Pase knockout mice had symptoms such as hyperlipidemia and lactic acid buildup45. The elevated activities of serum markers of liver function (ALP, ALT, AST, CYP450, and G6Pase) in the current investigation suggested that hepatic damage could be caused by the generation of hyperglycemia by infusing STZ. The rise in AST and ALT activity could be attributed to impairment of the cells in the hepatic tissue due to STZ-induced diabetes20. The present experiment revealed that treating diabetic rats with TQ reduces liver function enzyme activity to virtually normal levels, indicating that TQ protects liver cellular functioning. Previous research has shown that TQ positively affects hepatic key enzymes in diabetic rats3,41. It was also previously revealed that insulin has a role in downregulating CYP450 and G6Pase22, which could explain why TQ therapy enhanced insulin levels in diabetic rats.
According to the present experiment, within the diabetic control group, STZ caused dyslipidemia (lower HDL-C and higher TC, LDL-C, TAG, and AIP). These results agreed with those of Abdelrazek et al22. DM-induced dyslipidemia develops as a result of hyperglycemia and insulin deficiency, which enhances lipolysis and fatty acid production from adipose tissue to the circulation with changes in the metabolism, raising LDL-C, TC, and TAG values and predisposing to cardiovascular dysfunction43. TQ administration improves the diabetes-induced aberrant lipid profile, which is in line with the results of Abdelrazek et al22. and Abdel-Moneim et al43. TQ's beneficial effects on DM-induced dyslipidemia might be attributed to its stimulation of the activity of hepatic arylesterase, antioxidant properties, and adjusting impacts on the genes influencing cholesterol metabolism1,3.
Lipid peroxidation is a symptom of cellular impairment caused by ROS. In addition to MDA generation, excessive concentrations of ROS promote lipid peroxidation of the cellular membrane2,46. The true procedure of STZ-administrated DM in animals implicates ROS formation, DNA alkylation, and an increase in NO production in β-cells of the pancreas. Decrease of β-cell mass and function is the primary cause of diabetes and initiates dysfunction of the pancreatic β-cell22. Diabetes-related oxidative/nitrosative stress causes glucose autoxidation, lipid peroxidation, protein glycation, and decreased activity of antioxidant enzymes1. Lipid peroxidation might be produced by oxidative stress with enhanced mitochondrial uncoupling protein expression, activating cytokines, ligands, and growth factors, resulting in fibrosis and inflammation47. MDA and nitrite levels in the hepatic tissue were considerably greater in STZ-administrated diabetic animals. TQ administration also markedly reduced hepatic oxidative/nitrosative stress indicators, suggesting that TQ possess an important influence as a hepatic protective agent in contradiction to STZ diabetic mice, principally through its antioxidant characteristics2,42.
The present experiment considered the effect of TQ on oxidative stress of the liver in STZ DM in male rats. Fundamental processes of diabetes-induced free radicals and oxidative stress have been widely studied19,20. Diabetic rats had considerably lower hepatic GSH levels, activities of T-SOD, and CAT because of hyperglycemia and hyperlipidemia, which reduce the natural antioxidant activities and stimulate the generation of free radicals3,8. TQ treatment increased the antioxidant reserve of GSH levels as well as T-SOD and CAT activities in hepatic tissues, supporting the findings of Almatroodi et al42., Abdelrazek et al22., and Abdel-Moneim et al26. The inclusion of quinine in the TQ structure confirms its antioxidant capabilities. Quinine improves the admission to cellular and subcellular components, facilitating ROS removal16. TQ reduced oxidative stress by inhibiting nonenzymatic lipid peroxidation2,41. Furthermore, TQ's hypoglycemic impact enhances its antioxidant effect by regulating hyperglycemia-induced ROS.
These findings were confirmed in our work by immunostaining for the hepatic tissue inflammatory TNF-α protein of diabetic rats, which demonstrated a moderate to strong positive brown reaction for TNF-α protein with a marked increase in the immunohistochemical staining of TNF-α. Inflammation plays a significant role in the progression of diabetes and is consequently related to increased resistance to insulin and decreased responsiveness in the target tissues of insulin18. Furthermore, pro-inflammatory cytokines (IL-6, TNF-α, and IL-1β) and inflammatory markers (CRP) are important markers of pancreatic β-cell dysfunction and insulin resistance, all of which provide the DM progression3,42. These findings were confirmed in our work by immunostaining for the inflammatory protein of TNF-α in the liver of diabetic rats, which demonstrated a moderate to strong positive brown reaction for TNF-α protein. Circulating values of most proinflammatory cytokines are often raised in DM, owing to hyperglycemia, which raises cytokine levels in the blood via an oxidative mechanism48. It was discovered that diabetic liver had considerably enhanced pro-inflammatory cytokines (TNF-α, IL-1β, and IL-6) protein production and the inflammatory infiltration of macrophages1. TNF-α was significantly elevated in the STZ diabetic group, with enhancing DNA destruction in the hepatic tissue, which also substantially enhanced the stimulation of nuclear factor kappa B, Janus kinases-signal transducer and stimulator of transcription, and c-Jun N-terminal kinases signaling pathways16. TQ treatment reduced liver TNF-α protein levels and immunostaining significantly. According to our findings, STZ may trigger an inflammatory mechanism that contributes to diabetic liver damage20. Previous research has shown that TQ decreases pro-inflammatory markers (IL-6, TNF-α, and cyclooxygenase-2)18,49. Because of its anti-inflammatory capabilities, TQ suppressed the overproduction of pro-inflammatory markers (IL-6, IL-1β, and TNF-α), an inflammatory indicator (CRP), and immunostaining of TNF-α in STZ-administrated diabetic rats2,41. These findings were also validated by the current study's molecular docking findings. TQ displayed affinity to interact with and block the binding sites of IL-6R, IL1R1, TNFRSF1A, and TNFRSF1B, which may explain TQ's anti-inflammatory effects, as recognized by Alyami and Al-Hariri16.
Microscopic examination of normal control and TQ hepatic tissue revealed normal histological structure, with undamaged hepatic architecture in hepatic lobules, portal regions, and hepatic vasculature. STZ-induced diabetic rats had diffuse hepatic vasculature congestion, diffuse hepatic hydropic degeneration, and intense mononuclear cell infiltrations in the portal area, which was accompanied by a moderate or extensive thick collagen fiber around the portal vein and hepatic parenchyma50. STZ has a degenerative effect on hepatocytes, in addition to free radical buildup and damage due to oxidative stress45. The pathophysiology of diabetic hepatic injury may be due to inadequate insulin production or insulin resistance caused by DM, which causes hyperglycemia and hyperlipidemia due to carbohydrate metabolism disruption47. Diabetic rats given TQ had essentially normal histoarchitecture. Because of its antioxidant, anti-inflammatory, and hypoglycemic properties, TQ is a promising candidate for managing diabetes complications16.
Apoptosis, or programmed cell death, is a physiological mechanism of the body that performs a critical function in maintaining the body's environmental stability. It is a biomarker that responds to persistent stress. Excessive or insufficient apoptosis would be harmful to the body. It is also considered an important defensive mechanism because it regulates many effector cells20. A pro-apoptotic marker (caspase-3) is an effector protein in the intrinsic and extrinsic apoptotic mechanisms47. The immunohistochemical and quantitative analyses of our experiment revealed that the STZ-diabetic group had considerably higher caspase-3 immunopositive hepatic cell counts. Faisal Lutfi et al8. discovered that STZ-induced oxidative damage in male diabetic rats' hepatic tissues indicated a high presence of caspase-3 positive cells and a low expression of Bcl2. TQ reduced the expression of caspase-3 and p53 proteins in the hepatic tissue of diabetic rats, implying that TQ protects the liver by inhibiting apoptosis and inflammation41; this was also confirmed by the findings of the current study's molecular docking, which revealed that TQ interacts with and inhibits the caspase-3 binding site.
ROS causes DNA damage and stimulates a response to it, leading to the overexpression of p53. Chronic hyperglycemia followed by an increase in cytoplasmic glucose concentration causes C-terminal glycosylation of the tumor suppressor p53, which then activates the transcriptional activator p53, resulting in its translocation to the nucleus and the initiation of transcription of several p53-dependent genes21,51. The overall response of many cell types to DNA-damaging chemicals is typically characterized by p53 protein overexpression52. The tumor suppressor gene p53 governs cell cycle progression, induces apoptosis, and is integrated in progression of diabetic complications in response to DNA damage at the G1/S checkpoint51. Diabetes patients had higher levels of p53 in their livers, which was associated with the resistance to insulin21. Because TQ modulates blood glucose concentrations in diabetic animals, TQ treatment lowered immunostaining of p53, which could indicate that TQ has an anti-apoptotic effect in the handling of DM2,42.
Conclusion
To conclude, TQ has anti-diabetic, anti-inflammatory, anti-apoptotic and hepatic protective actions via modulating blood glucose and lipid profile, as well as enhancing liver functioning, hepatic histoarchitecture and oxidative stress status. In the current work, we found that TQ displayed abilities to interact and inhibit the binding site of caspase-3, interleukin-6 receptor, interleukin-1 receptor type 1 and TNF receptor in rats following the molecular docking modeling. Overall, TQ alleviates most of the alterations seen in diabetic animals and effectively ameliorates the harm caused by STZ; consequently, it’s recommended to be integrated with the diabetes mellites management protocols. TQ's detailed molecular mechanism in diabetes management must be further investigated.
Abbreviations
- AIP
Atherogenic index
- ALP
Alkaline phosphatase
- ALT
Alanine aminotransferase
- ANOVA
Analysis of variance
- AST
Aspartate aminotransferase
- CAT
Catalase
- CRP
C-reactive protein
- CYP450
Cytochrome p450
- DM
Diabetes mellitus
- G6Pase
Glucose-6-phosphatase
- GSH
Reduced glutathione
- HbA1c
Glycosylated hemoglobin
- HDL
High density lipoprotein
- HOMA-β
Homeostasis model assessment of β-cell function
- i.p.
Intraperitoneal
- IL-1β
Interleukin-1β
- IL-6
Interleukin-6
- LDL
Low density lipoproteins
- MDA
Malondialdehyde
- NO
Nitric oxide
- OGTT
Oral glucose tolerance test
- ROS
Reactive oxygen species
- SD
Standard deviation
- STZ
Streptozotocin
- TAG
Triglycerides
- TC
Total cholesterol
- TNF-α
Tumor necrosis factor-alpha
- T-SOD
Total superoxide dismutase
Author contributions
Conceptualization M.H.H, S.M.E.E, H.G.T, and A.H.E–F; formal analysis, M.H.H, S.M.E.E, H.G.T, and A.H.E.F; investigation, M.H.H, S.M.E.E, and H.G.T; project administration, M.H.H, S.M.E-E, H.G.T, and A.H.E–F; software, M.H.H, S.M.E-E, H.G.T, and A.H.E–F; validation, M.H.H, S.M.E.E, H.G.T, and A.H.E.F; visualization, M.H.H, S.M.E.E, and H.G.T; writing—original draft, M.H.H, S.M.E-E, H.G.T, and A.H.E–F; writing—review and editing, M.H.H, S.M.E.E, H.G.T, and A.H.E.F. All authors have read and agreed to the published version of the manuscript.
Funding
Open access funding provided by The Science, Technology & Innovation Funding Authority (STDF) in cooperation with The Egyptian Knowledge Bank (EKB).
Data availability
All data generated or analyzed during this study are included in this published article.
Competing interests
The authors declare no competing interests.
Footnotes
Publisher's note
Springer Nature remains neutral with regard to jurisdictional claims in published maps and institutional affiliations.
References
- 1.Hamdan A, Haji Idrus R, Mokhtar MH. Effects of nigella sativa on type-2 diabetes mellitus: A systematic review. Int. J. Environ. Res. Public Health. 2019;16:4911. doi: 10.3390/ijerph16244911. [DOI] [PMC free article] [PubMed] [Google Scholar]
- 2.Hofni A, Ali FEM, Ibrahim ARN, Aboubaker EM. Renoprotective effect of thymoquinone against streptozotocin-induced diabetic nephropathy: Role of NOX2 and Nrf2 signals. Curr. Mol. Pharmacol. 2023;16:905–914. doi: 10.2174/1874467216666230125150112. [DOI] [PubMed] [Google Scholar]
- 3.Adam SH, et al. Potential health benefits of Nigella sativa on diabetes mellitus and its complications: A review from laboratory studies to clinical trials. Front. Nutr. 2022;10(9):1057825. doi: 10.3389/fnut.2022.1057825. [DOI] [PMC free article] [PubMed] [Google Scholar]
- 4.Khan MA, et al. Thymoquinone upregulates IL17RD in controlling the growth and metastasis of triple negative breast cancer cells in vitro. BMC Cancer. 2022;22:707. doi: 10.1186/s12885-022-09782-z. [DOI] [PMC free article] [PubMed] [Google Scholar]
- 5.Fu J, et al. Impact of TMPRSS2 expression, mutation prognostics, and small molecule (CD, AD, TQ, and TQFL12) inhibition on pan-cancer tumors and susceptibility to SARS-CoV-2. Molecules. 2022;27:7413. doi: 10.3390/molecules27217413. [DOI] [PMC free article] [PubMed] [Google Scholar]
- 6.El-Far AH, et al. Thymoquinone and curcumin defeat aging-associated oxidative alterations induced by d-galactose in rats’ brain and heart. Int. J. Mol. Sci. 2021;22:6839. doi: 10.3390/ijms22136839. [DOI] [PMC free article] [PubMed] [Google Scholar] [Retracted]
- 7.El-Far AH, Darwish NHEE, Mousa SA. Senescent colon and breast cancer cells induced by doxorubicin exhibit enhanced sensitivity to curcumin, caffeine, and thymoquinone. Integr. Cancer Ther. 2020;19:1534735419901160. doi: 10.1177/1534735419901160. [DOI] [PMC free article] [PubMed] [Google Scholar]
- 8.Faisal Lutfi M, et al. Thymoquinone lowers blood glucose and reduces oxidative stress in a rat model of diabetes. Molecules. 2021;26:2348. doi: 10.3390/molecules26082348. [DOI] [PMC free article] [PubMed] [Google Scholar]
- 9.Shen S, Wei C, Fu J. RNA-Sequencing reveals heat shock 70-kDa protein 6 (HSPA6) as a novel thymoquinone-upregulated gene that inhibits growth, migration, and invasion of triple-negative breast cancer cells. Front. Oncol. 2021;11:667995. doi: 10.3389/fonc.2021.667995. [DOI] [PMC free article] [PubMed] [Google Scholar]
- 10.Atta MS, et al. Thymoquinone defeats diabetes-induced testicular damage in rats targeting antioxidant, inflammatory and aromatase expression. Int. J. Mol. Sci. 2017;18:919. doi: 10.3390/ijms18050919. [DOI] [PMC free article] [PubMed] [Google Scholar]
- 11.Atta MS, et al. Thymoquinone attenuates cardiomyopathy in streptozotocin-treated diabetic rats. Oxid. Med. Cell. Longev. 2018;2018:1–10. doi: 10.1155/2018/7845681. [DOI] [PMC free article] [PubMed] [Google Scholar]
- 12.El-Far AH, Salaheldin TA, Godugu K, Darwish NHE, Mousa SA. Thymoquinone and its nanoformulation attenuate colorectal and breast cancers and alleviate doxorubicin-induced cardiotoxicity. Nanomedicine. 2021;16:1457–1469. doi: 10.2217/nnm-2021-0103. [DOI] [PubMed] [Google Scholar]
- 13.El-Far AH, Tantawy MA, Al Jaouni SK, Mousa SA. Thymoquinone-chemotherapeutic combinations: new regimen to combat cancer and cancer stem cells. Naunyn-Schmiedeberg's Arch. Pharmacol. 2020;393:1581–1598. doi: 10.1007/s00210-020-01898-y. [DOI] [PubMed] [Google Scholar]
- 14.El-Far AH. Thymoquinone anticancer discovery: Possible mechanisms. Curr. Drug Discov. Technol. 2015;12:80–89. doi: 10.2174/1570163812666150716111821. [DOI] [PubMed] [Google Scholar]
- 15.El-Far AH, et al. Thymoquinone and costunolide induce apoptosis of both proliferative and doxorubicin-induced-senescent colon and breast cancer cells. Integr. Cancer Ther. 2021;20:15347354211035450. doi: 10.1177/15347354211035450. [DOI] [PMC free article] [PubMed] [Google Scholar]
- 16.Alyami HH, Al-Hariri MT. Synergistic effects of nigella sativa and exercise on diabetic profiles: A systematic review. Diabetes Ther. 2023;14:467–478. doi: 10.1007/s13300-022-01362-5. [DOI] [PMC free article] [PubMed] [Google Scholar]
- 17.Kathem SH, Abdulsahib WK, Zalzala MH. Berbamine and thymoquinone exert protective effects against immune-mediated liver injury via NF-κB dependent pathway. Front. Vet. Sci. 2022;9:960981. doi: 10.3389/fvets.2022.960981. [DOI] [PMC free article] [PubMed] [Google Scholar]
- 18.Chen L, et al. Thymoquinone alleviates the experimental diabetic peripheral neuropathy by modulation of inflammation. Sci. Rep. 2016;6:31656. doi: 10.1038/srep31656. [DOI] [PMC free article] [PubMed] [Google Scholar]
- 19.Eitah HE, et al. Modulating impacts of quercetin/sitagliptin combination on streptozotocin-induced diabetes mellitus in rats. Toxicol. Appl. Pharmacol. 2019;365:30–40. doi: 10.1016/j.taap.2018.12.011. [DOI] [PubMed] [Google Scholar]
- 20.Hafez MH, Elblehi SS, El-Sayed YS. Date palm fruit extract ameliorated pancreatic apoptosis, endocrine dysfunction and regulatory inflammatory cytokines in Streptozotocin-induced diabetes in rats. Environ. Sci. Pollut. Res. 2020;27:43322–43339. doi: 10.1007/s11356-020-10262-9. [DOI] [PubMed] [Google Scholar]
- 21.Yuniartha R, Arfian N, Setyaningsih WAW, Kencana SMS, Sari DCR. Accelerated senescence and apoptosis in the rat liver during the progression of diabetic complications. Malaysian J. Med. Sci. 2022;29:46–59. doi: 10.21315/mjms2022.29.6.5. [DOI] [PMC free article] [PubMed] [Google Scholar]
- 22.Abdelrazek HMA, Kilany OE, Muhammad MAA, Tag HM, Abdelazim AM. Black seed thymoquinone improved insulin secretion, hepatic glycogen storage, and oxidative stress in streptozotocin-induced diabetic male wistar rats. Oxid. Med. Cell. Longev. 2018;2018:1–10. doi: 10.1155/2018/8104165. [DOI] [PMC free article] [PubMed] [Google Scholar]
- 23.El-Aarag B, Hussein W, Ibrahim W, Zahran M. Thymoquinone improves anti-diabetic activity of metformin in streptozotocin-induced diabetic male rats. J. Diabetes Metab. 2017;8:1000780. [Google Scholar]
- 24.Percie du Sert N, et al. Reporting animal research: Explanation and elaboration for the ARRIVE guidelines 2.0. PLoS Biol. 2020;18(7):e3000411. doi: 10.1371/journal.pbio.3000411. [DOI] [PMC free article] [PubMed] [Google Scholar]
- 25.Sadek KM, Lebda MA, Nasr SM, Shoukry M. Spirulina platensis prevents hyperglycemia in rats by modulating gluconeogenesis and apoptosis via modification of oxidative stress and MAPK-pathways. Biomed. Pharmacother. 2017;92:1085–1094. doi: 10.1016/j.biopha.2017.06.023. [DOI] [PubMed] [Google Scholar]
- 26.Abdel-Moneim A, El-Twab SMA, Yousef AI, Reheim ESA, Ashour MB. Modulation of hyperglycemia and dyslipidemia in experimental type 2 diabetes by gallic acid and p-coumaric acid: The role of adipocytokines and PPARγ. Biomed. Pharmacother. 2018;105:1091–1097. doi: 10.1016/j.biopha.2018.06.096. [DOI] [PubMed] [Google Scholar]
- 27.Trinder P. Determination of blood glucose using an oxidase-peroxidase system with a non-carcinogenic chromogen. J. Clin. Pathol. 1969;22:158–161. doi: 10.1136/jcp.22.2.158. [DOI] [PMC free article] [PubMed] [Google Scholar]
- 28.Jeppsson, J.O. et al. Approved IFCC Reference Method for the Measurement of HbA1c in Human Blood. Clin. Chem. Lab. Med.40, (2002) [DOI] [PubMed]
- 29.Matthews DR, et al. Homeostasis model assessment: insulin resistance and beta-cell function from fasting plasma glucose and insulin concentrations in man. Diabetologia. 1985;28:412–419. doi: 10.1007/BF00280883. [DOI] [PubMed] [Google Scholar]
- 30.Legro RS, Finegood D, Dunaif A. A fasting glucose to insulin ratio is a useful measure of insulin sensitivity in women with polycystic ovary syndrome. J. Clin. Endocrinol. Metab. 1998;83:2694–2698. doi: 10.1210/jcem.83.8.5054. [DOI] [PubMed] [Google Scholar]
- 31.Buege JA, Aust SD. Microsomal lipid peroxidation. Methods Enzymol. 1978;52:302–310. doi: 10.1016/S0076-6879(78)52032-6. [DOI] [PubMed] [Google Scholar]
- 32.Guevara I, et al. Determination of nitrite/nitrate in human biological material by the simple Griess reaction. Clin. Chim. Acta. 1998;274:177–188. doi: 10.1016/S0009-8981(98)00060-6. [DOI] [PubMed] [Google Scholar]
- 33.Beutler E, Duron O, Kelly BM. Improved method for the determination of blood glutathione. J. Lab. Clin. Med. 1963;61:882–888. [PubMed] [Google Scholar]
- 34.Aebi H. Catalase in vitro. Methods Enzymol. 1984;105:121–126. doi: 10.1016/S0076-6879(84)05016-3. [DOI] [PubMed] [Google Scholar]
- 35.Barman TE. Glucose-6-phosphatase. Enzyme handbook. 1969;2:530. [Google Scholar]
- 36.Lowry OH, Rosebrough NJ, Farr AL, Randall RJ. Protein measurement with the Folin phenol reagent. J. Biol. Chem. 1951;193:265–275. doi: 10.1016/S0021-9258(19)52451-6. [DOI] [PubMed] [Google Scholar]
- 37.Bancroft, J.D.J. & Layton, C. The Hematoxylin and eosin. In: Suvarna S. K, Layton C, Bancroft J. D, editors. Theory Practice of histological techniques. , 7th ed edn. (Philadelphia: Churchill Livingstone of El Sevier, 2013).
- 38.Missaoui N, et al. Immunohistochemical characterization improves the reproducibility of the histological diagnosis of ovarian carcinoma. Asian Pac. J. Cancer Prev. 2018;19:2545–2551. doi: 10.22034/APJCP.2018.19.9.2545. [DOI] [PMC free article] [PubMed] [Google Scholar]
- 39.Salim B, Noureddine M. Identification of compounds from nigella sativa as new potential inhibitors of 2019 novel coronasvirus (Covid-19): Molecular docking study. chemRxiv. 2020;19:1–12. [Google Scholar]
- 40.Baek M, et al. Accurate prediction of protein structures and interactions using a three-track neural network. Science. 2021;80(373):871–876. doi: 10.1126/science.abj8754. [DOI] [PMC free article] [PubMed] [Google Scholar]
- 41.Maideen NMP. Antidiabetic activity of nigella sativa (black seeds) and its active constituent (thymoquinone): A review of human and experimental animal studies. Chonnam. Med. J. 2021;57:169. doi: 10.4068/cmj.2021.57.3.169. [DOI] [PMC free article] [PubMed] [Google Scholar]
- 42.Almatroodi SA, Alnuqaydan AM, Alsahli MA, Khan AA, Rahmani AH. Thymoquinone, the most prominent constituent of nigella sativa, attenuates liver damage in streptozotocin-induced diabetic rats via regulation of oxidative stress, inflammation and cyclooxygenase-2 protein expression. Appl. Sci. 2021;11:3223. doi: 10.3390/app11073223. [DOI] [Google Scholar]
- 43.Abdel-Moneim A, Abdel-Reheim ES, Helmy H, Addaleel W. Antidiabetic effect of thymoquinone via modulation of PPAR-γ, GLUT4, hyperlipidemia and antioxidant status in diabetic rats. Asian J. Biol. Sci. 2018;11:203–209. doi: 10.3923/ajbs.2018.203.209. [DOI] [Google Scholar]
- 44.Wang J, Zhai T, Chen Y. Effects of honokiol on CYP450 activity and transporter mRNA expression in type 2 diabetic rats. Int. J. Mol. Sci. 2018;19:815. doi: 10.3390/ijms19030815. [DOI] [PMC free article] [PubMed] [Google Scholar]
- 45.Zhu Y-X, et al. Effect of oxymatrine on liver gluconeogenesis is associated with the regulation of PEPCK and G6Pase expression and AKT phosphorylation. Biomed. Rep. 2021;15:56. doi: 10.3892/br.2021.1432. [DOI] [PMC free article] [PubMed] [Google Scholar]
- 46.Alam MF, et al. Thymoquinone ameliorates doxorubicin-induced cardiotoxicity in swiss albino mice by modulating oxidative damage and cellular inflammation. Cardiol. Res. Pract. 2018;2018:1–6. doi: 10.1155/2018/1483041. [DOI] [PMC free article] [PubMed] [Google Scholar]
- 47.Xia L-L, Zhu Q-J, Wu Y-G. Hepatoprotective effect of peony total glucosides and the underlying mechanisms in diabetic rats. Pharm. Biol. 2017;55:2178–2187. doi: 10.1080/13880209.2017.1390589. [DOI] [PMC free article] [PubMed] [Google Scholar]
- 48.Ling P-R, Smith RJ, Bistrian BR. Hyperglycemia enhances the cytokine production and oxidative responses to a low but not high dose of endotoxin in rats. Crit. Care Med. 2005;33:1084–1089. doi: 10.1097/01.CCM.0000163225.88827.63. [DOI] [PubMed] [Google Scholar]
- 49.Ikhsan M, Hiedayati N, Maeyama K, Nurwidya F. Nigella sativa as an anti-inflammatory agent in asthma. BMC Res. Notes. 2018;11:744. doi: 10.1186/s13104-018-3858-8. [DOI] [PMC free article] [PubMed] [Google Scholar]
- 50.Dhanavathy G. Immunohistochemistry, histopathology, and biomarker studies of swertiamarin, a secoiridoid glycoside, prevents and protects streptozotocin-induced β-cell damage in Wistar rat pancreas. J. Endocrinol. Invest. 2015;38:669–684. doi: 10.1007/s40618-015-0243-5. [DOI] [PubMed] [Google Scholar]
- 51.Chen L, et al. 1,25-Dihydroxyvitamin D exerts an antiaging role by activation of Nrf2-antioxidant signaling and inactivation of p16/p53-senescence signaling. Aging Cell. 2019;18:e12951. doi: 10.1111/acel.12951. [DOI] [PMC free article] [PubMed] [Google Scholar] [Retracted]
- 52.Hu W, et al. Glutaminase 2, a novel p53 target gene regulating energy metabolism and antioxidant function. Proc. Natl. Acad. Sci. 2010;107:7455–7460. doi: 10.1073/pnas.1001006107. [DOI] [PMC free article] [PubMed] [Google Scholar]
Associated Data
This section collects any data citations, data availability statements, or supplementary materials included in this article.
Data Availability Statement
All data generated or analyzed during this study are included in this published article.